Abstract
Biochar’s ability to amend and remediate agricultural soil has been a growing interest, though the energy expenses from high-temperature pyrolysis deter the product’s use. Therefore, it is urgent to improve the pyrolysis efficiency while ensuring the quality of produced biochar. The present study utilized three types of feedstock (i.e., switchgrass, biosolid, and water oak leaves) to produce biochar via conventional slow pyrolysis and microwave pyrolysis at different temperature/energy input. The produced biochar was characterized and comprehensively compared in terms of their physiochemical properties (e.g., surface functionality, elemental composition, and thermal stability). It was discovered that microwave-mediated biochar was more resistant to thermal decomposition, indicated by a higher production yield, yet more diverse surface functional groups were preserved than slow pyrolysis-derived biochar. A nutrient (NO3-N) adsorption isotherm study displayed that microwave-mediated biochar exhibited greater adsorption (13.3 mg g−1) than that of slow pyrolysis-derived biochar (3.1 mg g−1), proving its potential for future applications. Results suggested that microwaves pyrolysis is a promising method for biochar production.
1. Introduction
Biochar is the thermochemical product converted from biomass in the absence of oxygen at high temperature [1]. The process has been deemed “charring” or “pyrolysis”. When biochar was first investigated, it was widely used as a method to sequester carbon in soil [2,3]. Consequently, instead of suffering from rapid decomposition, the residues of plants and compost were recycled for biochar production and retained in the format of aromatic carbon [4]. Biochar is not a narrowly defined material. Because the utilization of the various feedstocks and the different pyrolysis conditions, biochar can exhibit different beneficial characteristics. As the interest in biochar research consistently grows, the extensive benefits of biochar contribute to a wide range of strategies: Agronomic improvement, mitigation of climate change, waste management, and energy production [4,5]. Large progress in each strategic scenario has been recorded in the previous studies. For example, Hangs et al. [6] demonstrated that the biochar produced from shrub willow feedstock enhanced the urease activity and nitrification rate of urea fertilizer which consequently increased the crop yield. Greenhouse gas (GHG) emissions, such as N2O, CO2, and NH3, have been largely reduced because of the addition of biochar [7]. The nutrient-rich temple floral refuse was processed to a biochar in the Singh et al. study, and the potential application in the dye removal was evidenced by a series of adsorption experiments [4]. Lastly, with regard to energy production, slow pyrolysis not only produces biochar, but it also presents comparable energy production. Besides the high efficiency for energy production, 30% lower energy input and 2–5 times of CO2 emission elimination can be achieved [8].
The yield of biochar, its physical and chemical characteristics vary depending on the pyrolysis conditions (e.g., temperatures, retention times, and heat fluxes) and the raw materials. Processed via relatively higher temperatures, biochar is more recalcitrant and resistant to microbial and chemical decomposition. Elements like hydrogen (H) and oxygen (O) are largely depleted during pyrolysis. At the same time, the increased carbon (C) concentration indicates that C-related compounds have been condensed and mostly existed as the form of stable aromatic C in the biochar [9]. In addition, high temperatures provide benefits not limited to: Larger porosity and surface area, which are vitally important in the application related to biochar adsorption capacity [10]. However, high residue ashes and metal volatilization from high temperature charring get caught in the micropores [11]. In contrast, an atmosphere with a low temperature reserves most of the elements. Benefits including increased biochar yield and water adsorption make the low-temperature pyrolysis unignorable. Biochar under low-temperature pyrolysis (<500 °C) is recognized to be more favorable for plant growth and more easily decomposed [12].
The biochar derived from relatively high-temperature pyrolysis is more depleted of H and O, but possesses a larger proportion of aromatic C in comparison with that from a lower temperature [13] and consequently, has great chemical recalcitrance and resistance to microbial and chemical decomposition in soil. The organic matter presents in feedstocks, composed of mostly hydrocarbons, amino-acids, or lipids, and with a small presence of lignin or cellulose [14], can lead to an amelioration of soil physical properties, including an improvement in soil structure or attenuating the potential for surface runoff and erosion. The mineralization of the organic matter releases macro and micronutrients essential for crop development, reducing mineral fertilizer use [15]. Organic matter contributes as an energy source for micro-organisms inhabiting in soil. Therefore, feedstocks with these qualities may increase soil microbial population and activity [16]. Furthermore, different soil constraints require different biochar properties by also recognizing the different crop needs; for example: Legume or cereal crops [17]. As a result, not all biochar have demonstrated improved crop yield in all instances [18,19], and there are significant differences in stability between biochar [20]. In addition, biochar properties change over time in soil and these changes may also be affected by the initial properties of the biochar [21]. Therefore, the differences between biochar properties have to be well understood as a function of production conditions and feedstock type, in order to match soil needs with the appropriate biochar type.
Slow pyrolysis has been a well explored and trusted method of biochar production, providing a proficient baseline for comparisons. The pyrolysis-derived suffered from the long heating duration, damage to the reactor wall, and even an undesired secondary reaction. Slow pyrolysis requires time for the furnace to reach the desired temperature, as well as the desired time of pyrolysis at the desired temperature. To address these problems, the microwave irradiation has been explored as an innovative alternative heating source for these two main reasons. Compared to a furnace, the amount of time required to meet a comparable pyrolysis temperature is achieved in a fraction of the time [22]. Secondly, the merit of microwave mediation is that the rotation of molecules through high frequency and the penetration depth of the microwaves into the materials consequently provide sufficient heat to the materials [23]. During such process, the interactions between polar functional groups and free surface charges on the biochar surface and water molecular will concretely transfer the microwave energy to heat energy, facilitated with the mechanism such as interfacial polarization, ionic conduction, and dipole polarization [24,25]. Previous studies on various biomass example feedstocks also explored feasibility of microwave radiation in the biochar synthesis with continuous N2 gas and a vacuum [25].
This study is unique in two ways. First, it has attempted an alternative method in which the procedure of the irradiation was by covering the vessel containing the feedstock and purged with N2 providing an alternative method to produce biochar via microwave. A second distinction is testing NO3− sorption capacity rather than ammonium nitrogen (NH4+). The implications of these two are documented in the end of the discussion. The hypothesis is that this method of producing microwave-mediated biochar through a faster means will yield a quality biochar at a reduced energy demand.
The objectives of this study were to:
- Develop an alternative method of microwave biochar production,
- produce microwave-mediated biochar from three feedstocks that exhibit similar characteristics to that of pyrolysis-derived biochar, and
- compare characteristics of slow pyrolysis-derived biochar and microwave pyrolysis-derived biochar via elemental composition, thermogravimetric structure, porous and surface structure, as well as sorption capacities of nitrate (NO3−).
Feedstocks of biosolid, water oak leaves (Quercus virginiana), and switchgrass (Panicum virgatum) were utilized to produce biochar at several pyrolysis temperatures and energy levels. The takeaways aim at providing evidence of a biochar alternative method that can have increased use in future agricultural industry at a significantly lower energy requirement.
2. Materials and Methods
2.1. Biochar Feedstock and Production
To maximize the economic benefits of biochar in agronomic fields, three feedstocks that are easily accessible were used in this study: Switchgrass (SG), biosolids (BS), and water oak leaves (L). All feedstocks were dried at 60 °C for 48 h until no significant weight change was observed. It was then crushed to 0.5–1 cm in size.
2.1.1. Conventional Slow Pyrolysis
During slow pyrolysis, pure N2 gas with purity > 99.99% was used at temperatures 300, 500, and 700 °C in a bench scale pyrolysis apparatus described in a previous study [26]. In brief, between 10–14 g of preprocessed feedstock was centered in a quartz tube (inner diameter: 2 cm, length: 45 cm). The tube was fitted with airtight connectors and rubber O-rings with continuous N2 gas purge at 80 mL/min, heated in a controllable S-line single-zone split tube furnace (Thermcraft Inc., Wiston-Salem, NC, USA) at heat ramp of 10 °C/min until the desired temperature and was kept at final temperature for 60 min. The quartz tube was purged with N2 gas during heating and cooling to prevent rapid oxidation and/or auto-ignition.
2.1.2. Microwave Pyrolysis
A Domestic Electric microwave (General Electric, Boston, MA, USA) with maximum power output of 1650 W and 2.45 GHz frequency was utilized for microwave mediation. Preprocessed feedstock (between 10–15 g) was evenly distributed in a leakproof glass container. Before being completely sealed, pure N2 gas with purity > 99.99% sparged the container for minutes to prevent oxidation during the following process. Two power levels, Level 8 (1320 W) and Level 10 (1650 W) were used to synthesize the biochar. A 60-min duration was used for both power levels, and a third product was synthesized at 1650 W for 30 min, producing a total of 9 microwave-mediated biochar samples. Whence half the time was reached, the vessel was shaken to disperse the contents. Because the vessel was enclosed, it became pressurized with N2 gas as well as biogas from the breakdown of the feedstock.
The yield of biochar was estimated by proportion of solid product to the original weight (wt/wt). The produced biochar from two methods were grinded to a fine composition with a mortar and pestle (<0.5 mm). They were then stored in sealed plastic containers at room temperature to prevent moisture absorption. Different pyrolysis conditions and biochar labels are listed in the Table 1.

Table 1.
Experimental conditions and yields of biochar specimens.
2.2. Physicochemical Characteristics Analysis
2.2.1. MESTA Ultimate Analysis and Thermogram
The multi-element scanning thermal analysis (MESTA) was performed using a carrier gas of 33% O2 in helium [27]. The loaded sample (15 mg) at ambient temperature (22 ± 1 °C) was heated to 750 °C at a 50 °C/min temperature ramp. Integration of thermograms of carbon (C), nitrogen (N), hydrogen (H), and sulfur (S) were used to determine the elemental composition (wt%) of biochar. Mass balance was performed to estimate the oxygen (O) content (wt%): O = 100 − (C + N + H + residual ash). Elemental compositions allow us to calculate significant parameters such as the atomic H/C and atomic O/C ratios, as well as the polarity index.
2.2.2. Thermogravimetric Analysis
The feedstock and biochar samples were analyzed by TGA thermalgravimetric analyzer (GA 550, TA Instrument, New Castle, DE) under the flow of argon (50 mL/min). The sample was weighed to approximately 5–7 mg. Before the sample was placed, a tare was performed so that only the sample weight was measured in the thermal weight-change analysis. The temperature ramp was set as follows:
- Isotherm at room temperature (21 °C) for 5 min,
- temperature equilibrium at 21 °C to 100 °C,
- isotherm at (100 °C) for 5 min,
- ramping of 5 °C/min from 100 °C to 700 °C.
2.2.3. Porous Structure Analysis
The Brunauer, Emmett, and Teller (BET) test was performed using an autosorb iQ automated gas sorption analyzer (Boynton Beach, FL, USA) to determine the specific surface area of the biochar samples within the 0.01–0.30 relative pressure (P/Po) range of N2 sorption isotherm. Degassing of the sample was done as a pretreatment by heating the tube around the sample to 120 °C for 4 h and vacuuming any remaining gas out of the vessel. Polanyi theory (P/Po = 0.98) was used to calculate the total pore volume [28]. The built-in Non-Local Density Functional Theory determined the pore size distribution in the pressure region (0.01–0.98). NovaWin 11.0 (Quantachrome Instruments, Boynton Beach, FL, USA) performed the data analysis.
2.2.4. Surface Morphology Analysis
The scanning electron microscopy (SEM) imaging was performed on all biochar and feedstocks utilizing a FEI Nova 400 Nano SEM (Hillsboro, OR, USA). Samples were first coated with Iridium (Ir) via sputter coater (Cressington HR208 Sputter Coater, Ted Pella, Inc.) with N2 gas purging to dissipate charging artifacts and minimize the beam damage. A 4 nm coat was applied to each sample. Images were taken on samples under vacuum following the standard procedures at scales 50 μm, 10 μm, and 5 μm, which was magnifications of 1000, 5000, and 10000, respectively. Characterization of surface morphology was performed using the SEM detector (ETD) at a voltage of 5 kV, 10 kV, or 15 kV, current of 96 pA, and focal length of 5 mm to 10 mm.
2.2.5. FTIR Analysis
Fourier transform infrared (FTIR) spectroscopy using a PerkinElmer 100 spectrometer (Waltham, MA, USA) was performed to analyze the structure of biochar using the non-contact reflectance imaging method. For the FTIR spectra, there were 16 scans performed on each sample with a spectral resolution of 4 cm−1 and in the mid-infrared range of 4000 to 650 cm−1. Broad-bands within the detection ranges include aromatic C–H rings, O–H stretch of phenolic compounds, aromatic and olefinic C = C vibrations, C–H alkyl structures, and H-bonded O–H stretch vibrations of hydroxyl groups from alcohols, phenols, and organic acids [9].
2.3. Nitrate Adsorption Isotherm Experiments
Batch sorption experiments were conducted to investigate the ability of different biochar to adsorb NO3−. A series of polyethylene centrifuge tubes with 15mL volume containing 100 mg of biochar sample and 12 mL NaNO3 solutions (10, 25, 50, 75, and 150 mg L−1 NO3−) were agitated on a wrist action shaker (Model 75, Burrel Scientific, Pittsburgh, PA, USA) to reach sorption equilibrium. Tests were triplicated with each trial beginning with a blank at each concentration to gain a calibration curve (R2 = 0.998). The samples suspension were then centrifuged for 15 min at 2500 rpm. Concentrations of NO3− in 6 mL of sample supernatant were estimated by ion chromatography (Dionex Aquion, Thermo Scientific, Waltham, MA, USA). A 4-mm AS15 analytical column set at 40 °C was coupled with a 4-mm AG15 guard column, and a 4-mm AMMS Micromembrane suppressor to take measurements of NO3− (Thermo Scientific, Waltham, MA, USA). During the test, 38 mM NaOH was used as an eluent at a flow rate of 1.2 mL/min.
The amount of NO3− adsorbed on the biochar was calculated via Equation (1):
where, q (mg g−1) is the amount of NO3− adsorbed onto the biochar at equilibrium; C0 and Ce (mg L−1) are the initial and equilibrium concentrations of NO3−; V (L) is the volume of the aqueous solution; and M (g) is the mass of the added biochar.
q = (C0 − Ce)V/M
The Freundlich model in Equation (2), a widely utilized sorption model, was fitted to the sorption data.
where KF and n are experimentally derived constants.
lnq = lnKF + (1/n)lnCe
2.4. Statistical Analysis
Statistical analyses for means and errors of the data were executed using Microsoft Excel for Windows 10 (Microsoft Office, Redmond, WA, USA) and SigmaPlot (Version 10.0, Systat Software, Inc., San Jose, CA, USA).
3. Results and Discussion
3.1. Yield of Biochar
The biochar yield observed from the slow pyrolysis from the different feedstocks showed that BS had the largest yield across the three different temperatures (Figure 1). This might because the higher concentration of inorganic compounds and lower volatile organic contents in BS [29]. Both SG and L had yields between 20% and 30% for temperatures of 500 °C and 700 °C, but then increased to almost 40% and 50% at 300 °C, respectively. There was an interesting commonality among the three feedstocks: The 300 °C biochar had high variability (3–10 times more) in yield compared to the 500 °C and 700 °C.
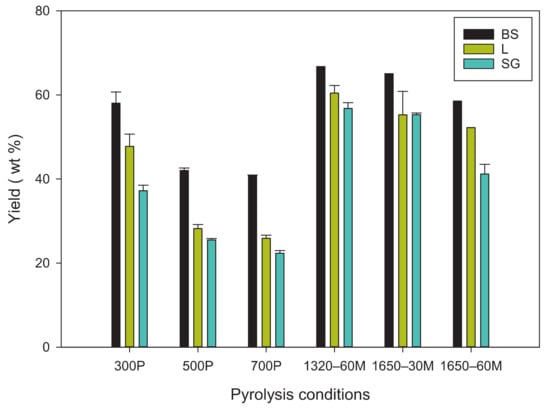
Figure 1.
Yields of biochar specimens. BS: Biosolids; L: Water oak leaves; SG: Switchgrass P: Slow pyrolysis; M: Microwave pyrolysis.
The microwave pyrolysis derived biochar had a similar trend of decreased yield when a higher power level was applied for the same duration. Although, when the feedstock was radiated at 1.65 kW for half the time as the other specimens, it had a similar yield to that of 1320–60M biochar. There was 150–200% increase in yield from microwave-mediated biochar yield compared to the pyrolysis-derived biochar. Additionally, the minimum yield of microwave-mediated biochar, found at 1.65 kW for 60 min, was observed to be the same or higher than the maximum yield observed from the pyrolysis-derived biochar, i.e., 300 °C.
Knowledge on measured temperature from previous studies during the microwave pyrolysis-derived biochar synthesis was used in this study. A recent study observed temperature for microwave biochar synthesis at 700 W; their findings showed that after 15 min, a temperature of at least 650 °C was achieved [22]. Another study measured 400 °C in a microwave at 750 W [23]. Ge et al., 2020, also observed that there was an average 60 °C min−1 increase in temperature within the first 5 min, but dropped to roughly a 30 °C min−1 increase for the remainder of the synthesis, with signs of plateauing in the last 2 min of synthesis [22].
3.2. Elemental Composition of Biochar
Elemental composition of biochar exhibited great dependence on the feedstock types. Since the initial benefit of biochar was carbon sequestering, it was expected that the percent composition of C increased with temperature/power increase [9]. This expected result was only not evident for BS biochar (Table 2). Relatively high carbon contents (>50%) were found in the L and SG biochar, proving that the feedstocks have the potential to provide carbon-rich biochar [30]. The variation of C consequently led to the variation of O content, even though increased dehydrogenation and condensation were to promote significant decreases in both H and O [31]. BS raw materials and resulting biochar consistently composed most of elemental N among three feedstocks. This indicates that heterolytic N-containing structure may be formed as a result of pyrolysis [32]. According to previous study, the formed N-functional group may affect nutrient such as NH4-N and organic-N adsorption, which consequently resulting in N immobilization [33]. Element S, as one of essential plant nutrients and soil amendment [34], was detected in very low concentration (<1.0 wt%) in BS and SG-300P biochar.
Table 2.
Elemental composition and atomic ratios for different biochar specimens.
Atomic O/C ratios of the biochar ranged from 0.19–1.34 (Table 2). Higher O/C ratios have been attributed to hydrophilic surfaces from more O-containing functional groups [9]. When applied in agricultural fields, lower atomic O/C ratios may provide larger half-lives (>1000 years), allowing it to be retained in the soil and providing its other benefits perpetually [35]. Atomic H/C ratios of biochar, which specify degree of original organic carbon preserved, varied from 0.19–1.52, with lower ratios occurring at higher temperatures and power outputs, though more uncertainty was evident with the microwave-mediated biochar. BS1320–60M had the highest atomic H/C ratio. Higher ratios eluded that increased filtering efficiency of inorganic contaminants could be achieved [36]. The atomic H/C ratio is a key factor when associated with agricultural fields as it has been found to impact the intensity of reducing N2O emissions, where lower H/C ratios were observed having higher capacity for reduction of N2O emissions [37].
The gradation of recalcitrance and aromaticity of biochar was approximated by the data from Table 2, developed as a van Krevelen diagram (Figure 2). Generally, the lower H/C and O/C ratios occurred at SG and L biochar, attributed to the formation of aromatic rings, increase of single C-bonds, decrease in H–C and O–C bonds, and reduction of easily biodegradable organic compounds [31]. However, BS biochar has a relatively high O/C and H/C producing from both pyrolysis methods. This indicates SG and L biochar may mineralize slower than BS biochar, contributing to higher biochar stability in the application [32]. Compared to slow pyrolysis, microwave pyrolysis resulted in similar ratios for SG and L feedstocks, while biosolid exhibited less predictable results from two pyrolysis procedures. The lack of gas circulation and the heating of water particles in the microwave-mediated biochar process may resulted in less dehydration, which could account for difference in ratio trends.
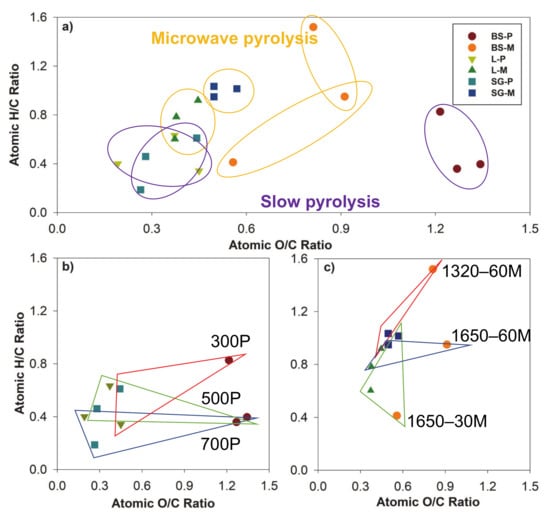
Figure 2.
van Krevelen diagram of atomic ratios for biochar from biosolids (BS), switchgrass (SG), and water oak leaves (L) via slow pyrolysis (P) and microwave pyrolysis (M). (a) Comparison of all biochar; (b) Slow pyrolysis-derived biochar comparison (c) microwave-pyrolysis biochar comparison.
3.3. Thermogravimetric Characteristics of Biochar
The decomposition stability of the slow and microwave pyrolysis-derived biochar and their respective feedstocks were analyzed by TG decomposition and derivative thermogram (DTG) curves (Figure 3, Figure 4 and Figure 5). DTG curves were derived from data obtained from TG decomposition data, which displayed differences in thermal peak quantity, temperature occurrence, and magnitude/shape of peak across each feedstock and its respective temperature or radiation applied, indicating differences in structure by all types of biochar. Compared to microwave pyrolysis, slow pyrolysis exhibited great carbon sequestration of all feedstocks evidenced from less pronounced and less amounts of thermal peaks. The first dominant thermal peaks occurred between 200 and 400 °C on original feedstocks and microwave pyrolysis biochar, resulting from the combustion of cellulose and hemicellulose [38]. All of the microwave-mediated had significant increased weight reduction within 350–550 °C, mainly attributed to the breakdown of lignin and autocatalytic reactions [39]. Lignin has been suggested to begin showing loss of mass beginning at 200 °C, but at small increments, as is the most difficult component to decompose compared to cellulose and hemicellulose, due to its complex chemical composition [38]. The differences in decomposition that occurred across the feedstocks as well as by methods of pyrolysis show that there was a clear difference of structural integrity of the samples, with generally more stability in the samples that occurred at higher temperature or power.
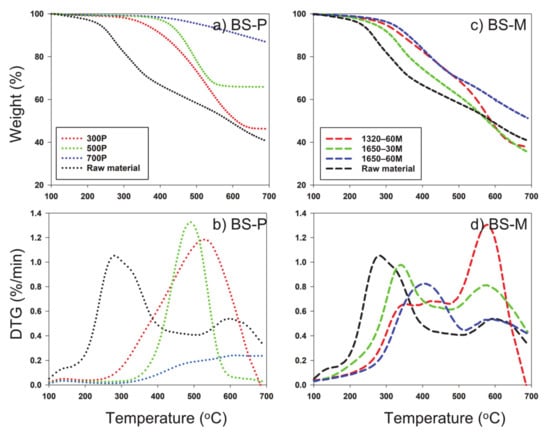
Figure 3.
TGA (thermalgravimetric analyzer) of biosolid and resulting pyrolysis-derived biochar via (a) slow pyrolysis and (c) microwave pyrolysis; (b), DTG (derivative thermogram) curves of biosolid and resulting pyrolysis-derived biochar via (b) slow pyrolysis and (d) microwave pyrolysis. BS: Biosolids; P: Slow pyrolysis; M: Microwave pyrolysis.
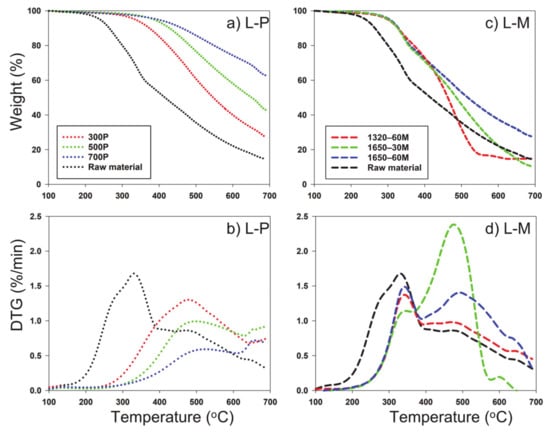
Figure 4.
TGA (thermalgravimetric analyzer) of water oak leaves and resulting pyrolysis-derived biochar via (a) slow pyrolysis and (c) microwave pyrolysis; (b), DTG (derivative thermogram) curves of biosolid and resulting pyrolysis-derived biochar via (b) slow pyrolysis and (d) microwave pyrolysis. L: Water oak leaves; P: Slow pyrolysis; M: Microwave pyrolysis.
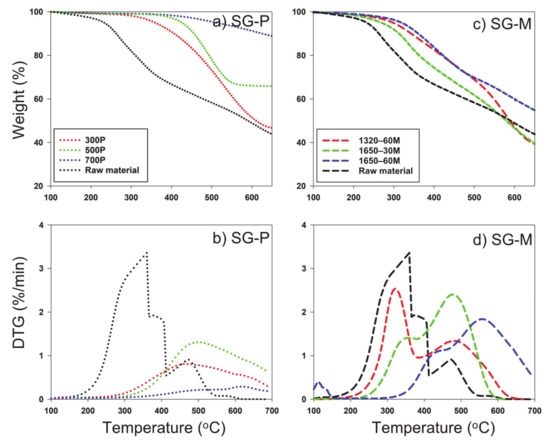
Figure 5.
TGA (thermalgravimetric analyzer) of switchgrass and resulting pyrolysis-derived biochar via (a) slow pyrolysis and (c) microwave pyrolysis; (b), DTG (derivative thermogram) curves of biosolid and resulting pyrolysis-derived biochar via (b) slow pyrolysis and (d) microwave pyrolysis. SG: Switchgrass P: Slow pyrolysis; M: Microwave pyrolysis.
3.4. Surface Structure Analysis of Biochar
Surface structures were observed from the infrared spectra of the biochar and their respective feedstock at the various slow and microwave pyrolysis syntheses (Figure 6). The spectral peaks enabled the diverse functional groups in the raw feedstock, microwave-mediated, and low temperature samples to be evident. The raw feedstocks, all microwave-derived biochar, and slow pyrolysis at 300 °C (except for SG) detected the unstable functional groups of O–H (~3400 cm−1) and alkyl C–H (~3000 cm−1). This occurrence was attributed to the breaking of hydroxyl groups of aliphatic groups which occur between 120 and 200 °C. The further increasing of temperature to 400 °C cause the breaking of the aliphatic methoxyl, methyl, and methylene groups [9]. For most feedstocks and biochar except at 700 °C, and in BS- and SG-500 °C, broadbands near 1000 and 1700 cm−1 were still evident.
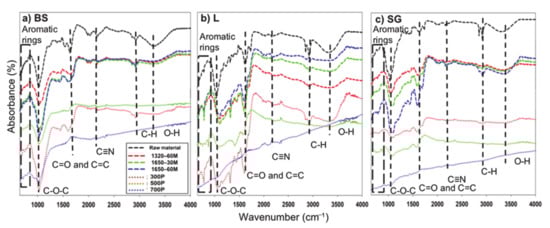
Figure 6.
FTIR (fourier transform infrared) spectra of feedstocks and resulting biochar produced by slow pyrolysis and microwave pyrolysis. (a) FTIR spectra of biosolid and resulting biochar, (b) FTIR spectra of water oak leaves and resulting biochar, and (c) FTIR spectra of switchgrass and resulting biochar. BS: Biosolids; L: Water oak leaves; SG: Switchgrass.
The only broadbands that seemed to disappear for the microwave-mediated biochar were the C–H stretching and O–H stretching near 3000 cm−1 and 3400 cm−1, respectively, indicating that half the functional groups were released through microwave irradiation. At 3200–3400 cm−1, non-detection of the hydroxyl group signified a release of hydroxyl-containing compounds (phenolic or aliphatic alcohol) as volatile matter [5]. Additionally, alkyl-hydroxyl chain cracking within lignin [2] potentially cracked (within the carbonization process), attributing to the release of the hydroxyl groups [40]. In the 2850–2950 cm−1 range, C–H stretching functional groups were released partly due to demethylation [41] and methyl group transforming into species containing carbon (CO and/or CO2) by means of ether bond breaking [30]. The band of C–O–C stretching near 1000 cm−1 were more pronounced for both 1.65 kW biochar for BS and L, corresponding to the increased C and O elements found from the MESTA results in Section 3.2. The dehydration of cellulosic materials and ligneous compounds occurring at temperatures > 400 °C attribute to the increased pronunciation [2].
3.5. Structural Porosity and Morphology of Biochar
The surface area and porosity of biochar have been noted as two of the most critical properties for nutrient sorption of biochar [42]. The greater surface area the biochar contains per gram can promote increased space for adsorption along with more microbial communities to grow and assist in crop growth [30]. There were many similarities discovered in the surface area between the different specimens (Figure 7). For slow pyrolysis-derived biochar at 500 °C, the highest surface area was recorded for L and BS at 42 m2 g−1 and 29 m2 g−1, respectively. Whereas the 700 °C biochar had the most surface area for SG at 18 m2 g−1. The feedstocks showed varied results. SG was collectively the feedstock with the least surface area among all the variations of slow and microwave pyrolysis derived. The other two feedstocks had similar surface areas which were contained between 2–10 m2 g−1, with the exception of the 500 and 700 °C samples. Higher temperature/energy input was expected to yield a more porous/increased surface area biochar due to more mesopores and micropores being formed from the intensified structural condensation [26]; however, decreased pore size is a consequence of high temperature/energy input pyrolysis. The microwave pyrolysis-derived biochar for SG showed consistent results (0.5–2 m2 g−1), despite the increase in power or time. While the highest specific surface area for BS was 1650–60M (8.3 m2 g−1) and L 1650–30M (7.2 m2 g−1), respectively. Compared to the feedstocks, there was at least a 350% increase in specific surface area as energy was used to heat the feedstocks. The elevated power level increased heat energy that led to enhanced carbonization, which allowed more volatile matter to be released, theorized to create more pores in remaining non-volatile parts [30]. Therefore, results showed promise to be a successful soil amendment to adsorb N nutrients and facilitate plant growth.
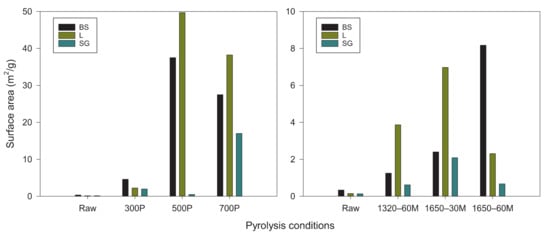
Figure 7.
Specific surface areas of feedstocks and their resulting slow and microwave pyrolysis-derived biochar. BS: Biosolids; L: Water oak leaves; SG: Switchgrass.
BS specimens were expected to contain the highest surface area as the temperature and radiation level increased (Figure 7), as well as by the evident amount of pore space shown from the SEM images (Figure 8). The BS feedstock showed the most visual surface area from SEM. L surface was primarily smooth across all versions of the biochar species, but there was an area that showed capacity for an increased amount of surface are. For the SG biochar, there was primarily strings of parallel rods that ran the length of the sample. Within these rods there were strings of silicon bands that remained within the biochar (found via Energy Dispersive Spectroscopy detector). Between SG 1320–60M and SG 1650–60M, the increased energy dissipation onto the biochar provided clear deterioration of the surface, creating grooves along the length of the specimen, indicating an increased surface area when energy was increased.
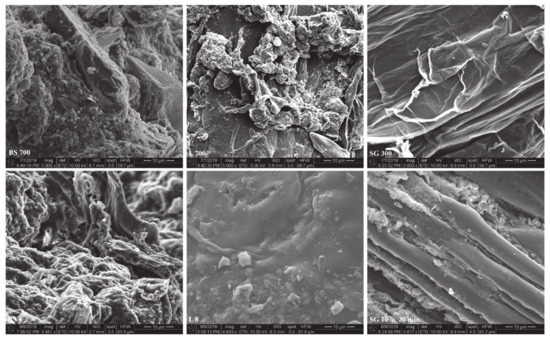
Figure 8.
Scanning Electron Microscopy (SEM) images at 10 μm scale. Top row: Slow pyrolysis-derived biochar; bottom row: Microwave pyrolysis-derived biochar; left column: Biosolids (BS); center column: Water oak leaves (L); right column: Switchgrass (SG).
3.6. NO3− Adsorption Isotherms and Characteristics
Like NH4+, NO3− is a species of N required for adequate and/or enhanced crop growth. NO3-N is a key component in the nitrogen cycle, specifically starting the denitrification process, and ending up as N2O, a GHG. Previous studies have looked primarily at NH4+ adsorption on biochar [26], while few investigated NO3− [43], and mainly found that little or no NO3− adsorption capacity was evident for biochar. Additionally, there has not been much exploration of NO3− sorption on microwave-mediated biochar [44].
Vital information of nutrient sorption by slow and microwave pyrolysis-derived biochar was observed through the equilibrium isotherm of NO3− (Figure 9). Biochar derived from two pyrolysis methods shared similar NO3− adsorption capacities. In addition, there was a significant increase of N nutrient adsorption for SG 1650–30M, where 6.2 mg g−1 NO3−-N showed more than a 200% increase than all other feedstocks for an initial concentration of 150 mg L−1 NO3− (Figure 9f). However, there was considerable variability among all SG samples derived from both pyrolysis methods. There was a difference of behavior from the different pyrolysis temperatures as well as the microwave power dispersion; i.e., for pyrolysis-derived and microwave-mediated, the adsorption of NO3− was 500P > 300P > 700P and 1320–60M > 1650–30M > 1650–60M for BS, respectively, 300P > 700P > 500P and 1650–60M > 1320–60M > 1650–30M, for L respectively, and 300P > 500P > 700P and 1650–30M > 1320–60M > 1650–60M for SG, respectively. In these differences, it is clear that lower temperatures and lower irradiation concluded with more NO3− adsorbed by biochar, due to the reduced amount of dehydrogenation and dehydration that occurred at higher temperatures and radiation. It is suggested that increased sorption of NO3− is possible when an acid activation with hydrochloric acid is performed to reduce negative surface charge of biochar, as indicated in a previous study [44].
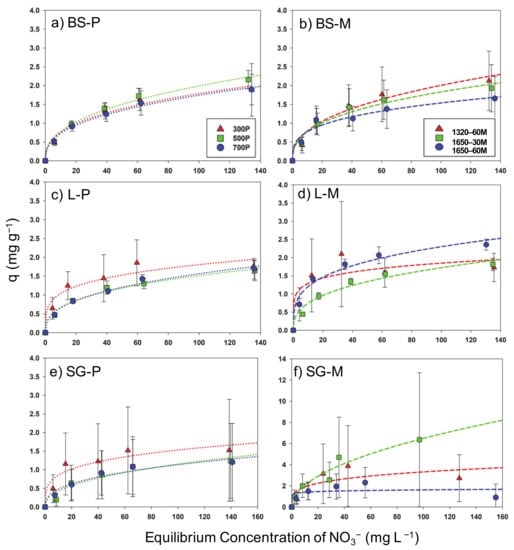
Figure 9.
Sorption isotherms of NO3− for biochar specimens. Pyrolysis-derived biochar: (a,c,e); microwave-mediated biochar: (b,d,f). (Dashed lines indicate fitted Fruendlich sorption model for respective colored data). L: Water oak leaves; SG: Switchgrass P: Slow pyrolysis; M: Microwave pyrolysis.
There were certain samples of the biochar, namely all derivations of SG and L1320–60M that were not able to comply with the Freundlich model from the experimental data of NO3− adsorption (R2 < 0.72). In relation to increased sorption intensity and capacity, the constants 1/n and kF tend to have higher values [26]. However, a decrease in R2-value occurred with an increased kF and decreased, implying that increased variability occurred with decreased intensity. The high correlations with low SE values of the Freundlich model indicates that the adsorption of NO3− follows a heterogeneous behavior [4] for BS and L, while SG is assumed to follow a homogenous behavior [26].
3.7. Implications of the Study and Future Work
One of the studies pointed out that energy consumption, chemicals, and reactors running cost required 50% of the total processing cost [45]. Therefore, the involvement of microwave irradiation could be beneficial because of less energy requirement and equipment installation. Furnaces, such as the one used in this study, required time to warm up, to ramp to the desired temperature, and to hold that temperature to produce the biochar, which demands increasingly more amounts of energy for each stage. Costs associated with ramping alone were shown to increase four-fold for a biochar specimen of 600 °C (400 USD ton−1) compared to one at 400 °C (~100 USD ton−1) [9]. With a microwave-irradiated instrument, however, there is no/little additional energy or time requirement for warming and ramping, only time to produce the product at the desired energy level. Additionally, the biochar yield of microwave-mediated biochar was on average about 50% more than what the yield of pyrolysis-derived biochar (Figure 1), potentially allowing for higher production in addition to the reduced energy costs. Therefore, perfecting the microwave mediation process of biochar can open new opportunities for a cost-effective soil additive by reducing the production time and energy input required.
Although temperature was not measured during the microwave pyrolysis in this study, the amount of power from the microwave can be used as a pseudo-variable to measure temperature if the specific heat capacity of the feedstock is known. However, the specific heat capacity of the feedstock used in this study is not available. This brings out the need for estimating specific heat capacity of alternative feedstocks and is deferred for future work. The ash content of the original feedstock was not measured in this study. However, it can help understand reasons of high oxygen content in some of the biochar specimens. Raw material analysis from an earlier study using the same feedstock was used to estimate ash content.
Further laboratory experiments, field application studies, as well as techno-economical estimation are needed to display realistic conditions and the ability for microwave-mediated biochar to confirm its ability for N adsorption via fertilizer application and its ability to enhance crop production for cost driven farmers [46]. A prior study had found that pyrolysis-derived biochar would not be economically feasible without the additional application of fertilizer products [47], whereas it is still unknown whether this requirement also applies to microwave-mediated biochar. Studies also need to increase exploration on additional feedstock materials and their respective product properties to determine the scale of variability that microwave-mediated biochar can have across various regions. Though feedstock dependent, there may be obvious trade-offs for this method of synthesis, i.e., a low-cost production versus a high specific surface area and carbon sequestration. Such knowledge can remove the lingering uncertainty for biochar products and potentially provide a variety of cost-effective method of biochar application.
4. Conclusions
This study indicated that microwave irradiation is a promising pyrolysis method. Carbon content of all produced biochar were similar, except biosolid, where variation was found between different pyrolysis methods. Higher yield from microwave-mediated biochar can benefit in large scale production and reduce cost. Specific surface area was a characteristic that greatly differentiated between the two pyrolysis, in which the microwave pyrolysis-derived biochar exhibited smaller surface area compared to slow pyrolysis-derived biochar (500 °C or higher). The biggest difference was the considerable adsorption of NO3− observed in all biochar, and in the case of switchgrass, exceptionally more adsorption from microwave pyrolysis-derived biochar than slow pyrolysis-derived biochar. Such high adsorbency might be because of the more hydrophilic functional groups on the biochar surface, which was also indicated by the FT-IR and TGA results. The application of microwave pyrolysis-derived biochar in agricultural fields may provide a potential soil additive to incorporate increased N retention for enhanced crop production. Indicating from previous studies, the significant reduction in energy requirement and cost increases the likelihood for future use; however, in situ experiments and techno-economical assessment to expand on the application potential of microwave pyrolysis-derived biochar are required in future study.
Author Contributions
Conceptualization, S.L. and A.A.; methodology, S.L. and C.A.B.; software, Y.W.; validation, S.L., A.A. and G.C.; formal analysis, S.L.; investigation, C.A.B. and Y.W.; resources, G.C.; data curation, A.A.; writing—original draft preparation, C.A.B.; writing—review and editing, Y.W.; visualization, Y.W.; supervision, S.L.; project administration, G.C.; funding acquisition, G.C. and A.A. All authors have read and agreed to the published version of the manuscript.
Funding
This research was funded by the National Institute of Food and Agriculture (NIFA) of the United States Department of Agriculture (USDA), grant number 2016-67020-25275, grant number 2018-68002-27920, and grant number 2017-38821-26405; and by the National Science Foundation (NSF), grant number 1735235 awarded as part of the National Science Foundation Research Traineeship (NRT).
Institutional Review Board Statement
Not applicable.
Informed Consent Statement
Not applicable.
Data Availability Statement
The data presented in this study are available on request from the corresponding author.
Acknowledgments
The authors are grateful for the helpful comments and constructive suggestions offered by the three anonymous reviewers.
Conflicts of Interest
The authors declare no conflict of interest. The funders had no role in the design of the study; in the collection, analyses, or interpretation of data; in the writing of the manuscript, or in the decision to publish the results.
References
- Bonanomi, G.; Ippolito, F.; Cesarano, G.; Vinale, F.; Lombardi, N.; Crasto, A.; Woo, S.L.; Scala, F. Biochar chemistry defined by C-13-CPMAS NMR explains opposite effects on soilborne microbes and crop plants. Appl. Soil Ecol. 2018, 124, 351–361. [Google Scholar] [CrossRef]
- Zhu, L.; Lei, H.W.; Wang, L.; Yadavalli, G.; Zhang, X.S.; Wei, Y.; Liu, Y.P.; Yan, D.; Chen, S.L.; Ahring, B. Biochar of corn stover: Microwave-assisted pyrolysis condition induced changes in surface functional groups and characteristics. J. Anal. Appl. Pyrol. 2015, 115, 149–156. [Google Scholar] [CrossRef]
- Harvey, O.R.; Kuo, L.J.; Zimmerman, A.R.; Louchouarn, P.; Amonette, J.E.; Herbert, B.E. An Index-Based Approach to Assessing Recalcitrance and Soil Carbon Sequestration Potential of Engineered Black Carbons (Biochars). Environ. Sci. Technol. 2012, 46, 1415–1421. [Google Scholar] [CrossRef] [PubMed]
- Singh, P.; Singh, R.; Borthakur, A.; Madhav, S.; Singh, V.K.; Tiwary, D.; Srivastava, V.C.; Mishra, P.K. Exploring temple floral refuse for biochar production as a closed loop perspective for environmental management. Waste Manag. 2018, 77, 78–86. [Google Scholar] [CrossRef] [PubMed]
- Verma, L.; Singh, J. Synthesis of novel biochar from waste plant litter biomass for the removal of Arsenic (III and V) from aqueous solution: A mechanism characterization, kinetics and thermodynamics. J. Environ. Manag. 2019, 248. [Google Scholar] [CrossRef] [PubMed]
- Hangs, R.D.; Ahmed, H.P.; Schoenau, J.J. Influence of Willow Biochar Amendment on Soil Nitrogen Availability and Greenhouse Gas Production in Two Fertilized Temperate Prairie Soils. Bioenergy Res. 2016, 9, 157–171. [Google Scholar] [CrossRef]
- Agegnehu, G.; Bass, A.M.; Nelson, P.N.; Muirhead, B.; Wright, G.; Bird, M.I. Biochar and biochar-compost as soil amendments: Effects on peanut yield, soil properties and greenhouse gas emissions in tropical North Queensland, Australia. Agric. Ecosyst. Environ. 2015, 213, 72–85. [Google Scholar] [CrossRef]
- Azzi, E.S.; Karltun, E.; Sundberg, C. Prospective Life Cycle Assessment of Large-Scale Biochar Production and Use for Negative Emissions in Stockholm. Environ. Sci. Technol. 2019, 53, 8466–8476. [Google Scholar] [CrossRef] [PubMed]
- Li, S.M.; Chen, G. Thermogravimetric, thermochemical, and infrared spectral characterization of feedstocks and biochar derived at different pyrolysis temperatures. Waste Manag. 2018, 78, 198–207. [Google Scholar] [CrossRef]
- Marousek, J.; Vochozka, M.; Plachy, J.; Zak, J. Glory and misery of biochar. Clean Technol. Environ. 2017, 19, 311–317. [Google Scholar] [CrossRef]
- Enders, A.; Hanley, K.; Whitman, T.; Joseph, S.; Lehmann, J. Characterization of biochars to evaluate recalcitrance and agronomic performance. Bioresour. Technol. 2012, 114, 644–653. [Google Scholar] [CrossRef]
- Guo, M.X.; Shen, Y.F. Quality variations of poultry litter biochar generated at different pyrolysis temperatures. J. Am. Chem. Soc. 2011, 242. [Google Scholar] [CrossRef]
- Heitkotter, J.; Marschner, B. Interactive effects of biochar ageing in soils related to feedstock, pyrolysis temperature, and historic charcoal production. Geoderma 2015, 245, 56–64. [Google Scholar] [CrossRef]
- Kim, D.; Lee, K.; Park, K.Y. Upgrading the characteristics of biochar from cellulose, lignin, and xylan for solid biofuel production from biomass by hydrothermal carbonization. J. Ind. Eng. Chem. 2016, 42, 95–100. [Google Scholar] [CrossRef]
- Rigby, H.; Clarke, B.O.; Pritchard, D.L.; Meehan, B.; Beshah, F.; Smith, S.R.; Porter, N.A. A critical review of nitrogen mineralization in biosolids-amended soil, the associated fertilizer value for crop production and potential for emissions to the environment. Sci. Total Environ. 2016, 541, 1310–1338. [Google Scholar] [CrossRef]
- Mossa, A.W.; Dickinson, M.J.; West, H.M.; Young, S.D.; Crout, N.M.J. The response of soil microbial diversity and abundance to long-term application of biosolids. Environ. Pollut. 2017, 224, 16–25. [Google Scholar] [CrossRef] [PubMed]
- van Zwieten, L.; Kimber, S.; Morris, S.; Chan, K.Y.; Downie, A.; Rust, J.; Joseph, S.; Cowie, A. Effects of biochar from slow pyrolysis of papermill waste on agronomic performance and soil fertility. Plant. Soil 2010, 327, 235–246. [Google Scholar] [CrossRef]
- Li, S.M.; Harris, S.; Anandhi, A.; Chen, G. Predicting biochar properties and functions based on feedstock and pyrolysis temperature: A review and data syntheses. J. Clean Prod. 2019, 215, 890–902. [Google Scholar] [CrossRef]
- Van Zwieten, L.; Kimber, S.; Downie, A.; Morris, S.; Petty, S.; Rust, J.; Chan, K.Y. A glasshouse study on the interaction of low mineral ash biochar with nitrogen in a sandy soil. Aust. J. Soil Res. 2010, 48, 569–576. [Google Scholar] [CrossRef]
- Zimmerman, A.R. Abiotic and Microbial Oxidation of Laboratory-Produced Black Carbon (Biochar). Environ. Sci. Technol. 2010, 44, 1295–1301. [Google Scholar] [CrossRef]
- Joseph, S.D.; Camps-Arbestain, M.; Lin, Y.; Munroe, P.; Chia, C.H.; Hook, J.; van Zwieten, L.; Kimber, S.; Cowie, A.; Singh, B.P.; et al. An investigation into the reactions of biochar in soil. Aust. J. Soil Res. 2010, 48, 501–515. [Google Scholar] [CrossRef]
- Ge, S.B.; Foong, S.Y.; Ma, N.L.; Liew, R.K.; Mahari, W.A.W.; Xia, C.L.; Yek, P.N.Y.; Peng, W.X.; Nam, W.L.; Lim, X.Y.; et al. Vacuum pyrolysis incorporating microwave heating and base mixture modification: An integrated approach to transform biowaste into eco-friendly bioenergy products. Renew. Sust. Energ. Rev. 2020, 127. [Google Scholar] [CrossRef]
- Mohamed, B.A.; Kim, C.S.; Ellis, N.; Bi, X.T. Microwave-assisted catalytic pyrolysis of switchgrass for improving bio-oil and biochar properties. Bioresour. Technol. 2016, 201, 121–132. [Google Scholar] [CrossRef]
- Sara, M.; Brar, S.K.; Blais, J.F. Comparative study between microwave and ultrasonication aided in situ transesterification of microbial lipids. RSC Adv. 2016, 6, 56009–56017. [Google Scholar] [CrossRef]
- Foong, S.Y.; Liew, R.K.; Yang, Y.F.; Cheng, Y.W.; Yek, P.N.Y.; Mahari, W.A.W.; Lee, X.Y.; Han, C.S.; Vo, D.V.N.; Le, Q.V.; et al. Valorization of biomass waste to engineered activated biochar by microwave pyrolysis: Progress, challenges, and future directions. Chem. Eng. J. 2020, 389. [Google Scholar] [CrossRef]
- Li, S.M.; Barreto, V.; Li, R.W.; Chen, G.; Hsieh, Y.P. Nitrogen retention of biochar derived from different feedstocks at variable pyrolysis temperatures. J. Anal. Appl. Pyrol. 2018, 133, 136–146. [Google Scholar] [CrossRef]
- Hsieh, Y.P. A novel multielemental scanning thermal analysis (MESTA) method for the identification and characterization of solid substances. J. AOAC Int. 2007, 90, 54–59. [Google Scholar]
- Polanyi, M. Adsorption and capillarity from the stand point of the II. main clause. Z. Phys. Chem. 1914, 88, 622–631. [Google Scholar]
- Antunes, E.; Schumann, J.; Brodie, G.; Jacob, M.V.; Schneider, P.A. Biochar produced from biosolids using a single-mode microwave: Characterisation and its potential for phosphorus removal. J. Environ. Manag. 2017, 196, 119–126. [Google Scholar] [CrossRef] [PubMed]
- Liew, R.K.; Nam, W.L.; Chong, M.Y.; Phang, X.Y.; Su, M.H.; Yek, P.N.Y.; Ma, N.L.; Cheng, C.K.; Chang, C.T.; Lam, S.S. Oil palm waste: An abundant and promising feedstock for microwave pyrolysis conversion into good quality biochar with potential multi-applications. Process. Saf. Environ. Prot. 2018, 115, 57–69. [Google Scholar] [CrossRef]
- Jindo, K.; Mizumoto, H.; Sawada, Y.; Sanchez-Monedero, M.A.; Sonoki, T. Physical and chemical characterization of biochars derived from different agricultural residues. Biogeosciences 2014, 11, 6613–6621. [Google Scholar] [CrossRef]
- Gonzaga, M.I.S.; Mackowiak, C.L.; Comerford, N.B.; Moline, E.F.D.; Shirley, J.P.; Guimaraes, D.V. Pyrolysis methods impact biosolids-derived biochar composition, maize growth and nutrition. Soil Tillage Res. 2017, 165, 59–65. [Google Scholar] [CrossRef]
- Zheng, H.; Wang, Z.; Deng, X.; Herbert, S.; Xing, B. Impacts of adding biochar on nitrogen retention and bioavailability in agricultural soil. Geoderma 2013, 206, 32–39. [Google Scholar] [CrossRef]
- Li, R.; Xu, K.; Ali, A.; Deng, H.; Cai, H.; Wang, Q.; Pan, J.; Chang, C.-C.; Liu, H.; Zhang, Z. Sulfur-aided composting facilitates ammonia release mitigation, endocrine disrupting chemicals degradation and biosolids stabilization. Bioresour. Technol. 2020, 312, 123653. [Google Scholar] [CrossRef]
- Spokas, K.A. Review of the stability of biochar in soils: Predictability of O:C molar ratios. Carbon Manag. 2010, 1, 289–303. [Google Scholar] [CrossRef]
- Ahmad, M.; Rajapaksha, A.U.; Lim, J.E.; Zhang, M.; Bolan, N.; Mohan, D.; Vithanage, M.; Lee, S.S.; Ok, Y.S. Biochar as a sorbent for contaminant management in soil and water: A review. Chemosphere 2014, 99, 19–33. [Google Scholar] [CrossRef]
- Alburquerque, J.A.; Sanchez-Monedero, M.A.; Roig, A.; Cayuela, M.L. High concentrations of polycyclic aromatic hydrocarbons (naphthalene, phenanthrene and pyrene) failed to explain biochar’s capacity to reduce soil nitrous oxide emissions. Environ. Pollut. 2015, 196, 72–77. [Google Scholar] [CrossRef]
- Alhinai, M.; Azad, A.K.; Abu Bakar, M.S.; Phusunti, N. Characterisation and Thermochemical Conversion of Rice Husk for Biochar Production. Int. J. Renew. Energy Res. 2018, 8, 1648–1656. [Google Scholar]
- Yang, H.P.; Yan, R.; Chen, H.P.; Lee, D.H.; Zheng, C.G. Characteristics of hemicellulose, cellulose and lignin pyrolysis. Fuel 2007, 86, 1781–1788. [Google Scholar] [CrossRef]
- Cao, J.; Xiao, G.; Xu, X.; Shen, D.K.; Jin, B.S. Study on carbonization of lignin by TG-FTIR and high-temperature carbonization reactor. Fuel Process. Technol. 2013, 106, 41–47. [Google Scholar] [CrossRef]
- Asmadi, M.; Kawamoto, H.; Saka, S. Thermal reactivities of catechols/pyrogallols and cresols/xylenols as lignin pyrolysis intermediates. J. Anal. Appl. Pyrolysis 2011, 92, 76–87. [Google Scholar] [CrossRef]
- Mukherjee, A.; Zimmerman, A.R.; Harris, W. Surface chemistry variations among a series of laboratory-produced biochars. Geoderma 2011, 163, 247–255. [Google Scholar] [CrossRef]
- Kameyama, K.; Miyamoto, T.; Iwata, Y.; Shiono, T. Influences of feedstock and pyrolysis temperature on the nitrate adsorption of biochar. Soil Sci. Plant Nutr. 2016, 62, 180–184. [Google Scholar] [CrossRef]
- Chintala, R.; Mollinedo, J.; Schumacher, T.E.; Papiernik, S.K.; Malo, D.D.; Clay, D.E.; Kumar, S.; Gulbrandson, D.W. Nitrate sorption and desorption in biochars from fast pyrolysis. Microporous Mesoporous Mater. 2013, 179, 250–257. [Google Scholar] [CrossRef]
- Saini, R.; Osorio-Gonzalez, C.S.; Hegde, K.; Brar, S.K.; Magdouli, S.; Vezina, P.; Avalos-Ramirez, A. Lignocellulosic Biomass-Based Biorefinery: An Insight into Commercialization and Economic Standout. Curr. Sustain. Renew. Energy Rep. 2020, 7, 122–136. [Google Scholar] [CrossRef]
- Sara, M.; Rouissi, T.; Brar, S.K.; Blais, J.F. Chapter 4 - Life Cycle Analysis of Potential Substrates of Sustainable Biorefinery. In Platform Chemical Biorefinery; Kaur Brar, S., Jyoti Sarma, S., Pakshirajan, K., Eds.; Elsevier: Amsterdam, The Netherlands, 2016; pp. 55–76. [Google Scholar] [CrossRef]
- Clare, A.; Barnes, A.; McDonagh, J.; Shackley, S. From rhetoric to reality: Farmer perspectives on the economic potential of biochar in China. Int. J. Agric. Sustain. 2014, 12, 440–458. [Google Scholar] [CrossRef]


Publisher’s Note: MDPI stays neutral with regard to jurisdictional claims in published maps and institutional affiliations. |
© 2021 by the authors. Licensee MDPI, Basel, Switzerland. This article is an open access article distributed under the terms and conditions of the Creative Commons Attribution (CC BY) license (http://creativecommons.org/licenses/by/4.0/).