Abstract
The European Directive on Safety and Health at Work and the following normatives have the scope to provide high levels of health and safety at work, based on some general principles managing activities and including the risk assessment to continuously improve processes and workplaces. However, the working area changes and brings new risks and challenges for workers. Several of them are associated with new technologies, which determine complex human–machine interactions, leading to an increased mental and emotional strain. To reduce these emerging risks, their understanding and assessment are important. Although great efforts have already been made, there is still a lack of conceptual frameworks for analytically assessing human–machine interaction. This paper proposes a systematic approach that, beyond including the classification in domains to explain the complexity of the human–machine interaction, accounts for the information processing of the human brain. Its validation is shown in a major accident hazard industry where a smart safety device supporting crane related operations is used. The investigation is based on the construction of a questionnaire for the collection of answers about the feeling of crane operators when using the device and the evaluation of the Cronbach’s alpha to measure of the reliability of the assessment.
Keywords:
human factor; emerging risk; safety device; major hazard industry; crane; Cronbach’s alpha 1. Introduction
The use of smart devices for the improvement of safety in workplaces is becoming enormously popular, particularly in the chemical and process industry classified at major accident hazard [1], where the use of tools and machines is growing in number and complexity [2]. From the safety point of view, particularly relevant workplaces are those where cranes are used for the handling/lifting of loads, because failures could be the cause of severe accidents [3,4,5]; therefore, there is a need to assess and manage the risk [6,7]. The communication between machine and worker can be realised by displays and operating elements (e.g., buttons, touchscreens, keyboards or mouse). Machines can give back information, which are visual (e.g., as pictures and characters), acoustic (verbal or non-verbal) or physical (e.g., vibration). The interaction human–machine is generally limited by the fact that whereas humans have intelligence, allowing the interpretation of situations, this ability is missing in most machines and restricted in the most advanced ones. Human factors are relationships and interactions between a system and its human elements and between the human elements themselves of a system or its adjacent organisation. Minimising human factors in the design of machines is essential [8]; this permits the reduction of errors, the increase of the productivity and the enhancement of safety and comfort when humans interact with a system, etc.
EU-OSHA [9,10] reports that a poor human–machine interaction (HMI) could be the cause of stress and occupational accidents and diseases. Its assessment is of utmost importance in major accident hazard industries, where the release of hazardous materials can cause catastrophic events [11,12,13]. The previous approach to the design of HMI, which took into account technical requirements and rarely included the needs and characteristics of workers, was overcome during the last two decades. Currently, new design trends point towards a user-centred design approach, which considers a system as composed by machines, workers, tools, tasks and work contexts [14]. The automation of process allows preventing the cause of errors due to HMI, even if it is well-known that only the intuition of human beings has the flexibility to better cope with unexpected situations [9]. This means that it is important to appropriately divide tasks between the operator and computer-operated systems by accounting for the working situation and environment. Koller et al. showed that the opinion of operators on HMI is essential to reduce emerging human factors [15]. Their involvement can be obtained by surveys, direct observations of workers at their workplace, structured discussions, participation in design workshops and feedback about prototypes or products in usability tests.
Complexity is considered the most influential factor for human–system interaction [16]. The more complex the system (more details, functions, possible choices, etc.) the weaker its performances, especially those related to the mind strategy, use of cognitive resources, acquisition of cognitive skills, work overload and human error. Numerous studies dealt with the research about complexity human factors (or complexity factors) for specific contexts, i.e., nuclear industry, control process system, traffic control, etc. [8,16,17,18,19]. Existing approaches are top down or bottom up, model based or experience based, etc.; this unfortunately means that there is no single applicable method suitable to each context [20]. Several complexity factors were defined and considered in earliest studies to provide an adequate description of HMI [21]. The analysis of these factors concluded that complexity can be reduced by providing humans with adequate and sufficient knowledge about machines. Various categorisations of human factors were given later by Ham et al. [20], which are based on structural complexity, functional complexity and interface complexity, or more detailed categorisations that include multiple levels. Other researchers focused also on defining the factors related to cognitive tasks complexity.
This paper presents a systematic approach for the identification, organisation and assessment of complexity factors, which has been applied to the use of a safety device supporting crane operators in performing their tasks. Taking advantage from the approach of Ham et al. [20], which makes use of a classification in domains to explain complexity, a framework has been derived for the human factors modelling. It integrates information connected with the information processing of the human brain (perception of information, cognitive resources and skills and strategies formulation) and allows reducing human errors in using machines. The system, used for the application of the approach, is a recent developed anti-collision device, named Visual Guidance System (VGS). The VGS has been developed within the project SPRINCE (Smart PRocess INdustry CranEs), supported by the consortium SAF€RA, and aimed at the prevention of accidents due to the limited view of the working area for the crane operators [22]. The goal was the development and assessment of a solution, aligned with the principle of the Industry 4.0. In this study, the usability tests of the VGS have been conducted in a context where hazardous substances are handled [23]. The manuscript has been organised as in the following: Section 2 describes current approaches to the modelling of human factors, which included the identification, organisation and assessment of complexity factors; Section 3 presents the proposed methodology, i.e., the research design and data analysis; Section 4 reports the results and discussion; Section 5 gives the conclusions of the study.
2. Approach to the Modelling Human Factors
To model human factors related to the use of innovative safety devices, the conceptual framework proposed by Ham et al. [20] could be used for their identification and organisation. The approach uses five views (or domains), given in Figure 1a and described below:
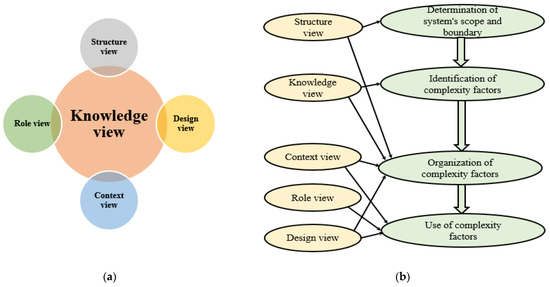
Figure 1.
Schematisation of the conceptual framework for identifying and organising complexity factors: (a) Views in the complexity model; (b) Flow-chart of the approach adapted from [20].
- Knowledge—This view relates to five types of knowledge that operators should have and use to interact with a system (including work domain, task, strategy, collaboration knowledge, interface and cognitive resources [24]). Each piece of knowledge has three aspects (i.e., spatial, relational, and temporal) to be considered in identifying complexity. Spatial aspect is related to the number and type of elements of which it consists. Relational aspect concerns to functional relations between elements. Temporal aspect is related to the change of elements over time. Since this view is linked to all other views, it is placed in a central position in Figure 1a.
- Structure—It reflects the possibility to model the interaction between humans and systems by means of five structural elements including work domain, task, interfaces, organisation and human operators [25].
- Design—It identifies complexity factors that are originated during the design life cycle of the system. These are classified into three types: unavoidable (inherent) complexity factors, designed complexity factors and situational complexity factors.
- Role—It concerns the effect as mediator or moderator of some factors. By considering the relationship between complexity factors and human performance: (i) mediators play a role of mediating the effects on human performance and explain how or why complexity occurs; (ii) moderators mitigates effects and specify when and how much the effects of complexity hold.
- Context—It refers to the contextual information. A context can usually be determined by task or work domain characteristics.
The framework identifying complexity factors consists of the following steps: (i) the determination of system’s scope and boundary, (ii) the identification of factors, (iii) the organisation of factors and (iv) the use of factors. The use of the five views, defined above, or their combination gives a different characterisation of human factors based on the scope of the research. Even if all the views are needed in the analysis, their use by means of the links shown in Figure 1b can be sufficient to identify the greatest number of human factors, but it is not guaranteed that the identification is complete [20].
3. Research Design and Data Analysis
To evaluate the feeling of crane operators about the use of the safety device supporting in handling loads, as well as to increase the safety by reducing problems connected to human–machine interaction, the greatest number of human factors associated with HMI must be captured. To this scope, a systematic approach for their identification, organisation and assessment has been developed and tested. The adopted methodology consists of two main steps: (i) the extension of the common-used approach for the identification and organisation of complexity factors, and (ii) the assessment of the complexity factors, including the feeling of crane operators.
3.1. Methodology for the Identification of Human Factors
To extend the current approach for the identification and organisation of complexity factors, which examines the spatial, relational and temporal aspects of each view of Figure 1b, some metrics have been integrated to account for the mechanism of information processing of the human brain. As shown in Figure 2, such processing includes three steps: the perception, the use of cognitive resources and the elaboration of actions. By combining the acquired information and personal strategies, the worker is able to make a decision and, then, to convert it in an action. The extended approach categorises all complexity factors, previously identified according to [20], by using the metrics introduced by Xing [26] and with respect to each operator’s task and step of Figure 2. The metrics are:
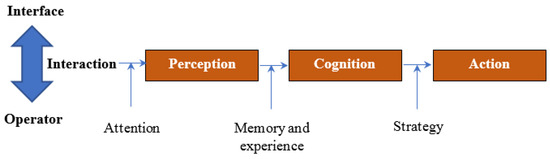
Figure 2.
Mechanism of information processing of the human brain.
- Numeric size—number of groups;
- Variety—variety of groups;
- Relations—relations amongst the elements of different groups;
- Temporal variability—dependence of parameters on the time.
3.2. Method for the Assessment of Complexity Factors
To assess the complexity factors, a proper questionnaire has been built. Its development consisted in the definition of questions, quantifying the importance of each factor. Each question was a 7-point Likert item from “extremely unimportant” to “extremely important” (Table 1). After some planned usability -tests of the safety device, the factors, considered relevant by a group of crane operators through the filled-in questionnaire, have been used to evaluate the feeling of safety in using the device by means of a new questionnaire. The study variables are the complexity factors, which concur in defining the feeling of safety of the crane operators, through the formulation of judgments that refer to a range from 1 to 7, where 1 = extremely bad, 2 = very bad, 3 = bad, 4 = average, 5 = good, 6 = very good and 7 = extremely good. In this regard, new usability -tests have been conducted and then a new group of users filled in the new questionnaire. Through the collected information, the criticalities of the system have been identified, which represent the elements to be improved in future developments of the safety device.

Table 1.
Likert scale.
3.3. Case Study
The innovative anti-collision device Visual Guidance System (VGS), developed within the SPRINCE project [22], has been tested in a complex workplace of a thermoelectric power plant (confidential). Inside the establishment, two overhead cranes are used to lift heavy equipment, in particular these support maintenance activities of turbines and related casings. The complexity of the working area is due to the presence of many equipment and pipelines distributed on different levels (Figure 3a). Lifting operations have been made by means of the support of the VGS. Figure 3b shows the point of the overhead crane where the device is placed. The VGS, which is currently available in a prototype version with two different configurations [23,27], elaborates a real-time streaming acquired by a stereoscopic system and gives back a signal (alarm) when a collision between the load and an obstacle is approaching [23]. The operator controls the load lifting on a laptop by means of a software. The computer communicates with the VGS by a remote desktop protocol.
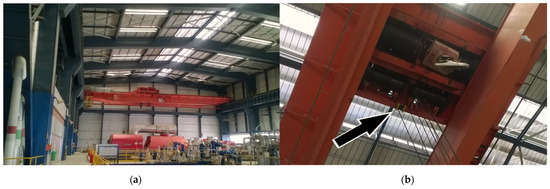
Figure 3.
Case-study: (a) Overhead crane and working area; (b) Location of the anti-collision device.
The boundaries of the workplace define the elements that interact each other during the operations assisted by the VGS. The information (structure view) related to the work domain, the organisation, the interface, tasks and the operator have been acquired:
- Work domain: It refers to the number of elements that are included in the prototype placed on the overhead crane. The main elements (hardware) of the developed solution are:
- ○
- Configuration 1: a box 36 cm × 29 cm × 12 cm (containing two Wi-Fi cameras, two power banks, a ruler and two usb cables) and a remote device (a laptop, two raspberries, two Ethernet cables and two adapters usb/Ethernet).
- ○
- Configuration 2: a box 36 cm × 29 cm × 12 cm (containing two usb cameras, a powerful laptop and a ruler) and a remote device (another laptop).
- Organisation: It refers to the connection of the elements of the prototype with the crane. The hardware placed in the box is located on the top of the crane (Figure 3b). The other elements are organised as follows:
- ○
- Configuration 1: the remote device (a laptop) processes the images and shows the processing results by proper algorithms. This device receives a Wi-Fi signal from the cameras by means of two raspberries.
- ○
- Configuration 2: the remote device (a laptop) shows the processing results by proper the algorithms, which run in another laptop contained in the box. The remote device receives a Wi-Fi signal from the laptop and allows remotely managing operations and setting the software.
- Human–machine interaction: It is realised through the display of the remote device. The interface (Figure 4) is composed by a Graphic User Interface (GUI) and a window showing a real-time video of the operations. In the GUI, the Start, Stop and Reset buttons are, respectively, used to start, end and reset the monitoring process. The Set Object area and Set Ignored area buttons, respectively, select the area to be monitored, which includes the load, and elements to be ignored during the processing. The Settings button is used to calibrate and set the system (this operation has to be executed before the use of the application). The Beep on intrusion checkbox enables or disables the acoustic signal alerting that an object is detected; the Debug checkbox is inserted for debugging purposes.
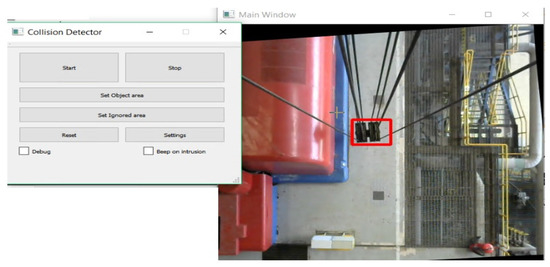 Figure 4. Human–machine interface for the use of the visual guidance system (VGS) in the case study.
 - Tasks: These are the steps of the use of the VGS:
- ○
- Task 1—Setting both the areas to be monitored and excluded, before to start the lifting of the load;
- ○
- Task 2—Starting the image acquisition, it is necessary to click on the Start button, after that, the load can be moved;
- ○
- Task 3—Observing the main window during the load navigation and the setting phases. An alarm will alert the operator when the distance load-obstacle is equal to a previously set threshold value. In such a case, he/she has to stop the operation and takes the proper actions to avoid the accident;
- ○
- Task 4—Stopping the application, to end the image acquisition, by clicking on the Stop button. After this operation, the load has already lifted;
- ○
- Task 5—Reset the application, to start a new operation.
- Operator: It refers to the worker that performs the operation assisted by the VGS, by executing the tasks described above.
3.4. Census of Crane Operators
In this study, crane operators have been recruited at regional level by contacting a company that provides handling/lifting of loads services and rents related equipment in industrial establishments. To ensure that the sample included workers with the requisite of experience in using overhead cranes to perform highly on the assessment, the following targets have been imposed, i.e., proven experience in the use of overhead cranes for at least 5 years and experience in major accident hazard industries. The company reported 43 crane operators that meet the required requirements; these already operated in the same industrial site chosen as a case study and declared themselves willing to participate in the experimentation and to the survey with the first questionnaire (identification of the relevant complexity factors), in this specific case the group was divided into 20% females and 80% males.
According to the same criteria, another sample of 20 operators have been recruited from another company (5% females and 95% males). These participated in the second step of experimentation and survey with the final questionnaire (assessment of the feeling of crane operators).
3.5. Statistical Analysis
To understand whether all questions of the first version of the questionnaire reliably measured the same latent variable, which is the feeling of safety in performing operations supported by the safety device, the Cronbach’s alpha (α) has been evaluated [28]. The parameter α measures the intercorrelation between items as:
where k denotes the number of conditions contributing to a total score, i.e., the total number of items proposed in the questionnaire,
is the variance of the scores associated to the i-th item, whereas
represents the variance of the total test scores [18].
The Cronbach’s alpha values range from 0 to 1, but acceptable values typically range from 0.7 to 0.95 (a recommended value is 0.9). Values falling outside this interval should be excluded: lower values are indeed representative of a low number of questions and/or of a poor interrelatedness between items; larger values are associated to a high level of redundancy [29,30,31]. In the case of a not good correlated α, the questionnaire can be adjusted. If by deleting an item, which is identified as not very correlated, the coefficient α increases, then the item must be permanently discarded. If instead the coefficient decreases, the item must be left. For each item exclusion, the α is calculated and the next candidate for exclusion is identified, looking for the one with the lowest discriminatory power following an iterative procedure. The analysis of the items stops when the last deleted item has produced a decrease in the α, in this case the item must be restored and the analysis can thus be considered completed.
To analyse if there were significant differences in the results between men and women in the first survey, a cluster analysis has been performed based upon an agglomerative hierarchical clustering method on the same samples [32,33]. To build the N×N distance matrix, different metrics have been considered (Euclidean, cityblock and cosine) and, to compute the distance between clusters, different clustering algorithms have been taken into account (single, complete and average linkage, median and centroid). To measure the reliability of the hierarchical tree, the cophenetic correlation coefficient have been computed, defined as the linear correlation coefficient between the cophenetic distances obtained from the tree and the original distances used to construct the tree. Then, the combination “metric-clustering algorithm”, that provides the highest value of the cophenetic correlation coefficient, has been chosen. The distance between two objects/clusters, generally referred to as the cophenetic distance (d), measures the fusion level of the entities. By means of this procedure, the objects in the original data set have been linked together in a graduated hierarchical tree, named dendrogram, where each leaf typically corresponds to one object. Moving up, the tree objects are combined into branches, which are themselves fused at a higher height indicating that the higher the fusion distance the larger the distance between objects. Finally, by cutting the dendrogram at a given distance, it is possible to get the desired information on the resulting different clusters distinguishable by different colours. A further check of the presence of significant differences in the results between men and women in the first survey has been made by designing a one-way ANOVA on the two experimental groups.
All the statistical analysis, here presented, has been performed by using Matlab®, except the one-way ANOVA, which was performed by using the software Sigma Plot. As regards the elaboration about the feeling of the operators by means of the data collected from the second questionnaire, only the average score and the standard deviation have been elaborated with respect to each factor and group.
4. Results and Discussion
4.1. Identification of Complexity Factors
Based on the approach of Ham et al. [20] and using the spatial, relational and temporal aspects and the metrics suggested by Xing [26], the complexity factors given in Table 2 have been identified. The process of identification is briefly described below.
Table 2.
Identified complexity factors.
The knowledge of the work domain regards the understanding of the interface and included elements. It has been assessed based on the spatial aspect, i.e., monitor size and the visibility of the main elements (number of fixation groups), and the temporal aspect, i.e., the rate of acquisition of the overall view. Given the small number of elements included in the work domain, no element has been identified with respect to the relation aspect.
Within the knowledge of the interface, the variety factor was an important item. Xing stated that switching amongst various visual features (colour, font, brightness, text dimension, workplace’s lightning and main window dimension) increases the visual fatigue and could be a cause of stress. These features have been considered as spatial aspects; whereas the change of workplace’s lighting has been assumed as part of the temporal aspect, which could affect the visual fatigue of the operator and cannot be eliminated or even mitigated. From the point of view of the relational aspect, the degree of clutter has been considered, which was defined as the effect of masking the visual perception of the stimulus with the presence of other stimuli. Some authors showed that the clutter effects can be mitigated by reducing the amount of text in the display [34].
Concerning the knowledge of the tasks, the display provides information to the user without performing many actions. This is especially important for time-critical tasks, such as the prevention of collisions. From the spatial point of view, two factors have been considered significant, i.e., the number of required actions and mouse’s movements. With respect to the temporal and relational aspects, two factors have been identified, respectively, the time of response of the system to the ordered action and the hierarchy of actions.
The knowledge of the strategy has been interpreted as the organisation of actions and tasks to achieve the goal for which the system has been designed. The scope is the prevention of collisions, therefore the strategy concerns settings specific issues, i.e., the definition of the area to be monitored and of the threshold for the alarm (spatial aspect). The complexity associated with the organisation of actions and setting have been analysed also from the temporal and relational point views and mainly refers to the difficulty and the time required executing these operations and the management of unexpected situations.
The collaboration knowledge has been interpreted as the knowledge of actions and tasks, which involve operators. The use of the developed system permits the crane operator to lift the load without the need of the guidance provided by another operator. Given that, the crane operator is able to work alone, therefore, this type of knowledge has not been considered within the identification of complexity factors.
The cognitive resources refer to the mental representation of the process for the operator. These resources are the memory and the previous experience, they are needed to deal with complex tasks. It is well-known that the cognitive processing is categorised in pierces of information (so-called functional units) and each one represents an independent dimension that the operator comprehends [26]. Based on these elements, the following complexity factors have been defined: number of functional units (spatial aspect), dynamics of the change in the category of information (temporal aspect) and the number of variables to be considered to achieve the goal (relational aspect).
4.2. Organisation of Complexity Factors
To organise complexity factors, the context is usual considered, i.e., the tasks or work domain. Given the work domain is limited to the system–operator interface, the interaction with the visual information has been considered as the most relevant criterion for organising the complexity factors of Table 2, with respect to each task given in Section 3.3. In addition, by referring to the mechanism of information processing of the human brain and metrics of Xing, the following classification has been obtained.
Perception concerns the acquisition of information about the current status and the process of filtering out unwanted data. Related complexity factors are given in second column of Table 3. The metric numeric size refers to the number of fixation groups, i.e., the set of visual stimuli that can be grabbed with one eye fixation. The metric assesses the ability to capture the main parts of the interface. The time for fixation is about 600–700 ms [35], but the average time to search for an element on the display increases as the number of fixation groups become higher. Another relevant aspect is the effect of the display size on the fixation capacity. The metric variety refers to the difference in visual features. The metric relations concerns the degree of clutter on the display. This increases the searching time and reduce the text readability [36]. Concerning the metric temporal variability, the time for the identification of the main parts of the interface (overall view) has been assessed, which is related to the workplace’s lightning and its uniformity and heterogeneity over time.
Table 3.
Complexity factors for perception, cognition and action.
Cognition concerns the integration of the perceived information with that derived from the observer’s memory and experience (construction of mental process). The third column of Table 3 gives related complexity factors. The metric numeric size assesses the number of basic and independent elements in a given mental representation. The comprehension of the acquired information from the VGS is essential. The metric variety regards the different stimulation of the mental processing mechanism with respect to the different reception mode of the alarm that is provided through the GUI by the red blinking. Concerning the metric relations, the logic of the organisation of the elements supporting the tasks and the degree of difficulty in achieving the goals by using the VGS (prevention of collision and crashes of the application) are considered. The metric temporal variability assesses the time for the information updating on the display with the respect to achievement of the goal (i.e., the prevention of collisions).
Action is the result of combination of the elaborated mental process and personal strategies to formulate a decision. The fourth column of Table 3 shows related complexity factors. The metric numeric size refers to the number of actions to be done per each step of the execution of the application and configuration of the system before its use. This aims defining the complexity of tasks in term of number of actions. The metric variety aims comparing the multiplicity of actions included in each task. The metric relations aims assessing the hierarchy of actions to be executed to use the VGS, the complexity in terms of steps in setting the alarm, the criterion adopted for the selection of the area to be monitored and the task uncertainty. The metric temporal variability aims assessing the time required for the updating of the information.
4.3. Questionnaire
To build the questionnaire, the organisation of factors was essential. Questions have been formulated per category and sub-category (metric) and have been divided in the 14 groups (see Appendix A). The overall questionnaire has been filled-in by 43 workers. The evaluation of Cronbach’s alpha has been made after the collection of the answers provided by the first group of workers. By considering the whole set of questions (k = 53), Cronbach’s alpha was α = 0.71, a value quite close to the lower bound of the range of commonly accepted values. To increase this value, thus dealing with a higher degree of reliability, there was the need to exclude the most uncorrelated items (questions). By applying this procedure, the improved value α = 0.87 has been obtained by removing 16 questions (i.e., 4b, 4f, 4g, 4h, 6c, 8b, 8c, 8d, 10a, 10b, 10c, 10e, 10g, 10h, 10i, and 12b).
The removed items are associated to the aspects of visual clarity, clutter effects, signal/noise ratio, actions (no. of mouse movements per action—no. of preliminary steps before the execution of the operation—no. of steps per operation). Below the reasons that justify the removing of the previous questions are given:
- Visual clarity and clutter effect refer to how the elements on the display appear. These factors do not appear relevant due to limited number of elements on the GUI that are needed to use the system. If these are very low in number, they are also distinct and with no perception of masking effect, confusion and cluttering.
- Signal/noise ratio refers to the disturbance during the execution of the application. This is not relevant because the VGS does not cause any significant noise during its execution. However, the disturbances that come from the workplace are surely much more relevant compared to it.
- Terminology concerns potential causes of misunderstandings. The words used in the interface are very concise to avoid errors.
- Action refers to the difficulty in the management of collisions with the system and/or the software. In general, if the number of actions is really small (just a single click); that is to say that, given the ease of the actions, no worker paid attention to the number of mouse movements to start, stop and reset the application.
To investigate whether the results are affected by the gender of workers, a cluster analysis has been addressed by taking into account two scenarios: (i) the entire set of 53 questions assigned to the 43 workers and (ii) the only 37 questions considered reliable by Cronbach’s alpha analysis. The combination “metric-clustering algorithm” that provided the highest value of the cophenetic correlation coefficient was “euclidean distance - average linkage”. The resulting dendrograms are, respectively, shown in Figure 5 and Figure 6.
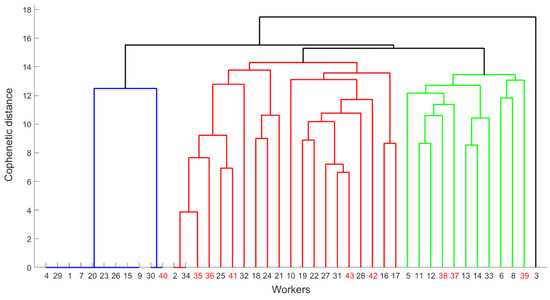
Figure 5.
Dendrogram representative of the whole set of questions. Men are denoted by black numbers, women by red ones. The clusters are indicated by different colours.
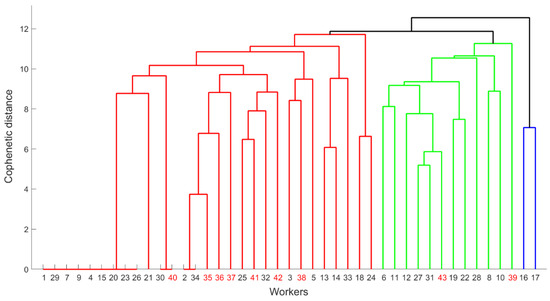
Figure 6.
Dendrogram representative of the reduced set of questions. Men are denoted by black numbers, women by red ones. The clusters are indicated by different colours.
As previously mentioned, moving up the tree, from the bottom to the top, the objects that are similar to each other are combined into branches, which are themselves fused at a higher height. The higher the level of the fusion, the less similar the objects are. Therefore, cutting the dendrogram at a given distance, it is possible to get the desired information on the resulting different clusters, defined by different colours in the figures. Figure 5 reveals that, when the entire set of questions is considered, three main clusters (coloured in blue, red and green) are formed (excluding the isolated case of the worker #3, whose response appears to be quite dissimilar from the rest of the group). Except for the first cluster (denoted in blue), which is composed almost entirely by men (most of which provided the same replies to all questions), all the other groups are heterogeneous in gender. By excluding those questions considered unreliable by Cronbach’s alpha analysis a slightly different classification of workers is obtained, as reported in Figure 6. This figure indicates that, apart from the isolated cluster formed by workers 16 and 17 (depicted in blue); the rest may be subdivided into two clusters (red and green). However, also in this case, the distribution is heterogeneous in gender, confirming that the replies provided by workers do not depend by worker’s sex.
The same conclusion as that of the cluster analysis has been obtained with the one-way ANOVA. Results are given for the 14 groups of questions in Table 4, the analysis has been made for the entire initial set of questions and then for the 37 questions considered reliable by Cronbach’s alpha analysis. The difference between the two groups (men and women) was not statistically significant except for the group 12 for the analysis made on the entire set.
Table 4.
One-way ANOVA results.
The final questionnaire allowed
defining the feeling in using the safety device, by means of the elaboration of the information captured with the selected questions by 20 workers. The answers are judgements that refer to a range from 1 to 7 (1= extremely bad, 2 = very bad, 3 = bad, 4 = average, 5 = good, 6 = very good and 7 = extremely good). In Table 5, the average score
and the standard deviation (σ) have been given per group of questions and individual question. In the same table, the interpretation of the results is also provided. According to these results, the VGS criticalities are currently associated with the lightening changes in the working area and the industrial complexity, these affect the clarity of the perceived information and dynamics of the perception due to their temporary variability. The system should be improved to give a better feeling also with respect to these issues.
Table 5.
Judgement about the human–machine interaction (HMI) and interpretation.
4.4. Discussion
Some considerations can be made about the approach adopted in this work. The analysis is in line with the issue highlighted by Ling et al. [36], which stated that generally the evaluations of human–machine interactions through displays focus on three dimensions of usability of the system, i.e., usefulness, information quality and interface quality. A full assessment should also take into account the level of mental workload experienced by users to complete their tasks. The mental workload is related to differences between the amount of the resources demanded by a task and the available mental resources. This aspect is also underlined by Xing [37] and even more recently by Ramakrishnan et al. [38]. The proposed methodology aligns and integrates these implementation ideas in order to offer a more complete assessment of the complexity of safety devices, which in some cases must operate in critical environments. The stress for the operator is obviously amplified by the complexity of the working area (for example the case study deals with the case of a major accident hazard industry), therefore, also due to other sources of stress, while designing a safety device, it is also necessary to solve the problem of alleviation of the human workload of informing the machine of the operator’s activity [39,40]. As regards the application presented in this work, the crane operators consider the aspects mentioned above to be relevant, although the VGS is positively evaluated from this point of view, precisely for its simplicity of use and the limited number of actions to be performed. It should be added that in the case of more complex systems than the one discussed in this study, the results of the HMI assessment are also conditioned by the ways of workers’ training [41].
Finally, it is important to mention the usefulness of the method also in support of the design in line with the concept of the user-centred design approach. It must be always remembered that a product, which was designed to be usable and useful to the user, can contribute to companies’ profit that is the economic perspective of sustainable manufacturing [42]. According to our thinking, this is not enough because it must also aim at worker safety and environmental protection. Although safety and profit are closely linked, this is often not sufficiently understood because the profit from increasing levels of safety and environmental protection is linked only to the avoided costs for accidents and not to an economic return linked to sales [43].
5. Conclusions
The investigation of human factors presented in this study represents a case of user-centred approach to the design of smart safety devices. The investigation of the complexity factors has been made to develop a more complete conceptual framework for identifying, organising and assessing the factors. The approach took advantage from previous studies and included proper metrics to account for the mental process of strategies’ elaboration of the worker. Although it is structured in such a way as to identify a sufficiently high number of factors and is adaptable to other contexts, attention must be paid to the contextualisation of the method to the various types of human–machine interaction, systems and other workplaces. The main benefit is that the overall approach supports researchers and designers in systematically understanding and tackling the emerging risks deriving from the human–machine interaction; therefore, it could be an effective tool for conceptualising how complexity factors can be identified and integrated into a comprehensive picture as shown for the analysed system.
The application of the method to the VGS, which has been conducted through the first questionnaire, allowed the identification of the factors considered relevant in the use of the device. This first phase of the assessment made it possible to identify the elements of the system on which the attention has to be focused on the design phase. The use of the final version of the questionnaire allowed the assessment of the importance of the relevant factors in the use of the VGS for the handling/lifting of loads. The final analysis, therefore, permitted the identification of the elements of the device that must necessarily be implemented in the future. The study was possible thanks to the willingness to test the system in a major accident hazard context and to participate in the survey by a number of crane operators with at least 5 years’ experience with overhead cranes. The group, having a varied composition of men and women, provided results that do not depend on the sex of the operator as can be seen from the results of the cluster analysis and the one-way ANOVA.
As regards the VGS, a new version is expected to be developed, which will be adapted to other typologies of crane and integrate more advanced functionalities. All the improvements, required to solve the main criticalities that are currently associated with the lightening changes in the working area, will be made. Proper investigations will be needed to adapt the system to exiting cabins of cranes or new generations one by always looking at their ergonomics [44,45]. The use of the approach proposed in this paper allowed designing a device that is usable and useful to the user, as it contributes not only to increase the productivity of the company but also to the safety of the workers.
6. Patents
The prototype of the Visual Guidance System (VGS) has completed the patenting procedure. The Italian patent no. P4522IT00 has the title “Dispositivo di sicurezza per la conduzione di operazioni di movimentazione di carichi” (inventors: Milazzo M.F., Scionti G., Ancione G., Spasojević Brkić V. and Bragatto P.
Author Contributions
Conceptualization, M.F.M. and G.A.; methodology, M.F.M. and G.A.; software, G.C.; validation, M.F.M., G.A. and G.C.; formal analysis, G.A.; investigation, G.A.; resources, M.F.M. and G.A.; data curation, M.F.M. and G.A.; writing—original draft preparation, M.F.M.; writing—review and editing, M.F.M., G.A. and G.C.; visualization, G.A.; supervision, M.F.M.; project administration, M.F.M.; funding acquisition, M.F.M. All authors have read and agreed to the published version of the manuscript.
Funding
This research was partially funded by INAIL, grant number 22 Project SPRINCE/2nd call SAF€RA.
Institutional Review Board Statement
Not applicable.
Informed Consent Statement
Informed consent was obtained from all subjects involved in the study.
Data Availability Statement
The data presented in this study are available in the article.
Acknowledgments
This study is the continuation of a research that was started within a SAF€RA project funded by INAIL (SPRINCE Project). INAIL is acknowledged for the support at the begin of the research.
Conflicts of Interest
The authors declare no conflict of interest.
Appendix A
Table A1.
Questionnaire for the assessment of human factors.
Table A1.
Questionnaire for the assessment of human factors.
| Category | Sub-Category (Metric) | Complexity Factor | Group of Questions |
|---|---|---|---|
| 1. Overall reactions to the Interface | |||
| Perception | Numeric size | Display size (monitor’s characteristics) | 1a—Is the display large enough to allow a comfortable viewing? |
| 2. Screen | |||
| Perception | Numeric size | Number of visual elements of the interface | 2a—Can you capture at a glance the most important parts shown on the screen? 2b—Can you clearly distinguish the elements shown on the screen? |
| 3. Variety of Elements | |||
| Perception | Variety | Text size | 3a—Are the elements of the interface readable with respect to the text size? |
| Perception | Variety | Main window size | 3b—Are the elements of the interface readable with respect to the main window size? |
| Perception | Variety | Brightness and contrast | 3c—Are the elements of the interface readable with respect to the brightness and contrast? |
| Perception | Variety | Colours of groups | 3d—Are the elements of the interface readable with respect to their colours? |
| Perception | Variety | Workplace’s lightening | 3e—Are the elements of the interface readable with respect to the workplace lightening? |
| 4. Clarity of the Information Perception | |||
| Perception | Relations | Masking effects | 4a—In the case of complex environments, is the view of the working-area (through the main window) clear? |
| Perception | Relations | Visual clarity | 4b—Do the elements, provided on the display, appear distinct (there is no perception of masking effects)? |
| Perception | Relations | Comfort | 4c—Are all the windows of the interface always in the foreground? |
| Perception | Relations | Degree of confusion | 4d—Is each window clearly displayed on the screen? |
| Perception | Relations | Degree of clutter | 4e—Does the overall information, provided by means of the screen, appear comfortable? 4f—Does the overall information, provided by means of the screen, appear confused? 4g—Does the overall information, provided by means of the screen, appear cluttered? |
| Perception | Relations | Signal/noise ratio | 4h—How would you rate the signal/noise ratio during the execution of the application? |
| Perception | Relations | Physical and psychological stress during the use of the system | 4i—In your opinion, how much physical stress does the use of the system cause? 4l—In your opinion, how much psychological stress does the use of the system cause? |
| 5. Dynamics of the Perception | |||
| Perception | Temporal variability | Rate of acquisition of the overall view | 5a—In your opinion, is the identification (perception) of the most important parts of the interface rapid? |
| Perception | Temporal variability | Change of workplace’s lightning | 5b—How much does the change of illumination of the working area affect (over time) the perception of the information through the interface? |
| Perception | Temporal variability | Uniformity and heterogeneity of the working space | 5c—Depending on if the working area is uniform or heterogeneous, how much does the area’s complexity affect the perception of the information through the interface? |
| 6. Understanding of the Information Provided by the Interface | |||
| Cognition | Numeric size | Load navigation by the use of the GUI | 6a—Are the interface tools sufficient for the execution of the operation (load navigation)? |
| Cognition | Numeric size | Acquisition of the reality by the real-time video | 6b—Does the information acquired at the screen allow the understanding of reality? |
| Cognition | Numeric size | Terminology used by the interface | 6c—Is the interface’s terminology appropriate (that is it does not create misunderstandings)? |
| Cognition | Numeric size | Amount of information to be memorized during the work (short-term memory) | 6d—In your opinion, how much is the amount of information that must be memorized to perform the work? |
| Cognition | Numeric size | Amount of information from the existing knowledge to be used during the work (long-term memory) | 6e—In your opinion, how much is the amount of from the existing knowledge to be used during the work? |
| 7. Understanding of the Alarm | |||
| Cognition | Variety | Response to the alarm through the main window | 7a—How much would you rate the effectiveness of alarm through the main window? |
| Cognition | Variety | Response to the alarm through the red blinking of the GUI | 7b—How much would you rate the effectiveness of alarm through the red blinking of the GUI? |
| 8. Comprehension of the Interface’s Elements and Goal | |||
| Cognition | Relations | Organisation of elements | 8a—Are the interface’s elements well-grouped? |
| Cognition | Relations | Level of comprehension of how to prevent the collision | 8b—If a potential collision is occurring, are there enough elements that permit its prevention? 8c—In your opinion, what is the level of difficulty associated with the management of potential collisions? |
| Cognition | Relations | Level of comprehension of how to recovery from crashes of the application | 8d—If a problem occurs during the running of the application (e.g., crashes), are there enough elements that permit its recover?8e—In your opinion, what is the level of difficulty associated with the reset of the system? |
| Cognition | Relations | Learning process to operate the system | 8f—How easy was to learn operating the system? |
| 9. Dynamics of the Comprehension of the Alarm | |||
| Cognition | Temporal variability | Time for the information update with respect to the prevention of the collision | 9a—Is the information returned on the screen updated in an appropriate manner that is in real time or at least in a time acceptable for the prevention of undesirable events? |
| Cognition | Temporal variability | Disturb when receiving the alarm due to the update of information on the main window | 9b—How much disturb is given by the information updating over the time in the main window (that is disturb when receiving the alarm by the red blinking of the GUI)? |
| 10. Complexity of Tasks in Terms of Number of Actions | |||
| Action | Numeric size | Number of mouse movement per action (task) | 10a—How many mouse’s movements do you need to configure the application before to press the button “Start application”? 10b—How many mouse’s movements do you need to start the application? 10c—How many mouse’s movements do you need to stop the application? 10d—How many mouse’s movements do you need to reset the application? |
| Action | Numeric size | Number of preliminary steps before the execution of the operation (tasks) | 10e. Are there preliminary actions to execute before using the application? |
| Action | Numeric size | Number of steps per operation | 10f—How many actions do you need to start the application? 10g—How many actions do you need to stop the application? 10h—How many actions do you need to reset the application? 10i—In case of warning from the interface, how many operations must be undertaken to safely restore the situation? |
| 11. Complexity of Tasks in Terms of Variety of Actions | |||
| Action | Variety | Variety of actions amongst tasks | 11a—Is there a clear distinction between the actions to execute when configuring, starting, stopping and resetting the application? |
| 12. Hierarchy and Relations Amongst Actions | |||
| Action | Relations | Hierarchy of actions | 12a—In your opinion, are the steps to perform an operation hierarchically organized? |
| Action | Relations | Criterion adopted for the setting of the area to be monitored | 12b—Based on the experience gained with the use of the application, which extension for the area to be monitored would you select? (that means do you feel safe in using the application?) |
| Action | Relations | Complexity of the selection of the area to be monitored | 12c—Is the operation (task) for the selection of the area to be monitored complex? |
| Action | Relations | Task uncertainty | 12d—Which are the elements, operations, etc. that make, in your opinion, uncertain the interaction with the interface? |
| 13. Dynamics of Actions | |||
| Action | Temporal variability | Time for the area setting | 13a—Is the task for setting the area time-demanding? |
| Action | Temporal variability | Rate of response of the application | 13b—In your opinion, does the system quickly respond to the commands (with mouse)? |
| 14. System Capabilities | |||
| Impressions on system capabilities | 14a—Which score would you give to the whole system? 14b—In your opinion, can the system provide benefit to the crane operator when he/she is lifting loads? (open answer) 14c—Which suggestion would you give to the developer based on your experience? (open answer) | ||
References
- Ansaldi, S.M.; Agnello, P.; Bragatto, P.A. Smart safety systems: Are they ready to control the hazard of major accidents? In WIT Transactions on the Built Environment (Safety and Security Engineering VII); Brebbia, C.A., Garzia, F., Lombardi, M., Eds.; WIT Press: Lisbon, Portugal, 2018; Volume 174, pp. 169–180. [Google Scholar]
- Sheridan, T.B. Human and Automation: System Design and Research Issues, 1st ed.; John Wiley: New York, NY, USA, 2002. [Google Scholar]
- Shepherd, G.W.; Kahler, R.J.; Cross, J. Crane fatalities—A taxonomic analysis. Saf. Sci. 2000, 36, 83–93. [Google Scholar] [CrossRef]
- Peraza, D.B.; Travis, J.A. Crane safety—An industry in flux. In Proceedings of the Forensic Engineering Conference, Washington, DC, USA, 11–14 November 2009; ASCE Library: Reston, VA, USA, 2010; pp. 556–566. [Google Scholar]
- Milazzo, M.F.; Ancione, G.; Spasojevic Brkic, V.; Vališ, D. Investigation of crane operation safety by analysing main accident causes. In Risk, Reliability and Safety: Innovating Theory and Practice, Proceedings of the 26th European Safety and Reliability Conference, ESREL 2016, Glasgow, Scotland, 25–29 September 2016; Walls, L., Revie, M., Bedford, T., Eds.; CRC Press/Balkema: London, UK, 2017; p. 15. [Google Scholar]
- Aneziris, O.N.; Papazoglou, I.A.; Mud, M.L.; Damen, M.; Kuiper, J.; Baksteen, H.; Ale, B.J.; Bellamy, L.J.; Hale, A.R.; Bloemhoff, A.; et al. Towards risk assessment for crane activities. Saf. Sci. 2008, 46, 872–884. [Google Scholar] [CrossRef]
- Lingard, H.; Cooke, T.; Zelic, G.; Harley, J. A qualitative analysis of crane safety incident causation in the Australian construction industry. Saf. Sci. 2021, 133, 105028. [Google Scholar] [CrossRef]
- Wickens, C.D.; Hollands, J.G. Engineering Psychology and Human Performance, 3rd ed.; Prentice Hall: Upper Saddle River, NJ, USA, 2000. [Google Scholar]
- EU-OSHA, European Agency for Safety and Health at Work. Priorities for Occupational Safety and Health Research in the EU-25. Available online: https://osha.europa.eu/en/publications/report-priorities-occupational-safety-and-health-research-eu-25 (accessed on 26 December 2020).
- EU-OSHA, European Agency for Safety and Health at Work. Second European Survey of Enterprises on New and Emerging Risks (ESENER-2) Overview Report: Managing Safety and Health at Work. Available online: https://osha.europa.eu/en/publications/second-european-survey-enterprises-new-and-emerging-risks-esener-2-overview-report (accessed on 26 December 2020).
- De Rademaeker, E.; Suter, G.; Pasman, H.J.; Fabiano, B. A review of the past, present and future of the European loss prevention and safety promotion in the process industries. Process Saf. Environ. 2014, 92, 280–291. [Google Scholar] [CrossRef]
- Fabiano, B.; Pistritto, F.; Reverberi, A.; Palazzi, E. Ethylene-air mixtures under flowing conditions: A model-based approach to explosion conditions. Clean Technol. Environ. 2015, 1, 1261–1270. [Google Scholar] [CrossRef]
- Laurent, A.; Pey, A.; Gurtel, P.; Fabiano, B. A critical perspective on the implementation of the EU Council Seveso Directives in France, Germany, Italy and Spain. Process Saf. Environ. Prot. 2021, 148, 47–74. [Google Scholar] [CrossRef]
- Sarodnick, F.; Brau, H. Methoden der Usability Evaluation. Available online: http://www.ciando.com/img/books/extract/3456955979_lp.pdf (accessed on 26 December 2020). (In German).
- Koller, F.; Beu, A.; Burmester, M. Benutzerzentrierter Gestaltungsprozess interaktiver Systeme. In Benutzerzentrierte Gestaltung von Augmented Reality; Luczak, H., Schmidt, L., Koller, F., Eds.; VDI Verlag: Düsseldorf, Germany, 2004; pp. 15–26. (In German) [Google Scholar]
- Ham, D.H.; Park, J.; Jung, W. Model-based identification and use of task complexity factors of human integrated systems. Reliab. Eng. Syst. Saf. 2012, 100, 33–47. [Google Scholar] [CrossRef]
- Baumann, K.; Lanz, H. Mensch-Maschine-Schnittstellen elektronischer Geräte. In Leitfaden für Design und Schaltungstechnik; Springer: Berlin/Heidelberg, Germany, 1998. (In German) [Google Scholar]
- Charwat, J. Lexikon der Mensch-Maschine-Kommunikation; Oldenbourg: München, Germany, 1992. (In German) [Google Scholar]
- Dahm, M. Grundlagen der Mensch-Computer-Interaktion; Pearson Studium: München, Germany, 2006. (In German) [Google Scholar]
- Ham, D.H.; Park, J.; Jung, W. A Framework-Based Approach to Identifying and Organizing the Complexity Factors of Human-System Interaction. IEEE Syst. J. 2011, 5, 213–222. [Google Scholar] [CrossRef]
- Rasmussen, J.; Lind, M. Coping with complexity. In Proceedings of the European Conference on Human Decision and Manual Control, Risø National Laboratory, Delft, The Netherlands, 25–27 May 1981; pp. 1–28. Available online: https://core.ac.uk/download/pdf/13791481.pdf (accessed on 26 December 2020).
- Spasojević Brkić, V.; Milazzo, M.F.; Brkić, A.; Maneski, T. Emerging risks in smart process industry cranes survey: SAF€RA research project SPRINCE. Serb. J. Manag. 2015, 10, 247–254. [Google Scholar] [CrossRef]
- Ancione, G.; Kavasidis, I.; Merlino, G.; Milazzo, M.F. Real-time guidance system for cranes to manage risks due to releases of hazardous materials. In Risk, Reliability and Safety: Innovating Theory and Practice, Proceedings of the 26th European Safety and Reliability Conference, ESREL 2016, Glasgow, Scotland, 25–29 September 2016; Walls, L., Revie, M., Bedford, T., Eds.; CRC Press/Balkema: Strathclyde, UK, 2017; p. 118. [Google Scholar]
- Vicente, K.J. Cognitive Work Analysis; Lawrence Erlbaum: Hillsdale, NJ, USA, 1999. [Google Scholar]
- Thelwell, P.J. What Defines Complexity? In Proceedings of the Ergonomics Society Annual Conference, Warwick, UK, 19–22 April 1994; pp. 89–94. [Google Scholar]
- Xing, J. Measures of Information Complexity and Implications for Automation Design; Report no. DOT/FAA/AM-04/17; Office of Aerospace Medicine: Washington, DC, USA, 2004. Available online: https://citeseerx.ist.psu.edu/viewdoc/download?doi=10.1.1.62.1894&rep=rep1&type=pdf (accessed on 26 December 2020).
- Ancione, G.; Kavasidis, I.; Milazzo, M.F. Improving safety of crane-related operations in chemical industry by the support of a real-time computer-aided visual guidance system. In Safety and Reliability Theory and Applications, Proceedings of the 27th European Safety and Reliability Conference, ESREL 2017, Portorož, Slovenia, 18–22 June 2017; Cepin, M., Bris, R., Eds.; Taylor & Francis Group: London, UK, 2017; pp. 1787–1792. [Google Scholar]
- Cronbach, L.J. Coefficient alpha and the internal structure of tests. Psychometrika 1951, 16, 297–334. [Google Scholar] [CrossRef]
- Tavakol, M.; Dennick, R. Making sense of Cronbach’s alpha. Int. J. Med. Educ. 2011, 2, 53–55. [Google Scholar] [CrossRef] [PubMed]
- Streiner, D. Starting at the beginning: An introduction to coefficient alpha and internal consistency. J. Personal. Assess. 2003, 80, 99–103. [Google Scholar] [CrossRef] [PubMed]
- Taber, K.S. The Use of Cronbach’s Alpha when developing and reporting research instruments in science education. Res. Sci. Educ. 2018, 48, 1273–1296. [Google Scholar] [CrossRef]
- Abu-Jamous, B.; Fa, R.; Nandi, A.K. Integrative Cluster Analysis in Bioinformatics; Wiley & Sons: Hoboken, NJ, USA, 2015. [Google Scholar]
- Tan, P.N.; Steinbach, M.; Karpatne, A.; Kumar, V. Introduction to Data Mining; Pearson: London, UK, 2019. [Google Scholar]
- Xing, J.; Heeger, D. Quantification of contrast-dependent center-surround interaction. Vis. Res. 2001, 41, 581–583. [Google Scholar]
- Joseph, K.W.; Chun, M.; Nakayama, K. Attentional requirements in a “preattentive” feature search task. Nature 1997, 387, 805–807. [Google Scholar] [CrossRef] [PubMed]
- Ling, C.; Lopez, M.; Shehab, R. Complexity Questionnaires of Visual Displays: A Validation Study of Two Information Complexity Questionnaires of Visual Displays. Hum. Factors Ergon. Manuf. 2013, 23, 391–411. [Google Scholar] [CrossRef]
- Ramakrishnan, P.; Balasingam, B.; Biondi, F. Cognitive load estimation for adaptive human–machine system automation. In Learning Control—Applications in Robotics and Complex Dynamical Systems; Elsevier: Amsterdam, The Netherlands, 2021; pp. 35–58. [Google Scholar]
- Xing, J. Information Complexity in Air Traffic Control Displays; Report no. DOT/FAA/AM-07/26; Office of Aerospace Medicine: Washington, DC, USA, 2007. Available online: https://rauterberg.employee.id.tue.nl/amme/xing-2007.pdf (accessed on 4 February 2021).
- Hoc, J.M. From human-machine interaction to human-machine cooperation. Ergonomics 2000, 43, 833–843. [Google Scholar] [CrossRef]
- Voronkova, O.V.; Semenova, Y.E.; Lukina, O.V.; Panova, A.Y.; Ostrovskaya, E.N. Assessment of the Influence of Human Factor on the Working Process Effectiveness as a Factor for Improving the Efficiency of Production Management at Industrial Enterprises. Espacios 2018, 39, 25–35. [Google Scholar]
- Vališ, D.; Pokora, O.; Koláček, J. System failure estimation based on field data and semi-parametric modelling. Eng. Fail. Anal. 2019, 101, 473–484. [Google Scholar] [CrossRef]
- Jasiulewicz-Kaczmarek, M.; Saniuk, A. Human Factor in Sustainable Manufacturing. In Proceedings of the International Conference on Universal Access in Human-Computer Interaction UAHCI 2015, Los Angeles, CA, USA, 2–7 August 2015; pp. 444–455. [Google Scholar]
- Abrahamsen, E.B.; Selvik, J.T.; Milazzo, M.F.; Langdalen, H.; Dahl, R.E.; Bansal, S.; Abrahamsen, H.B. On the use of the ‘Return Of Safety Investments’ (ROSI) measure for decision-making in the chemical processing industry. Reliab. Eng. Syst. Saf. 2021. [Google Scholar] [CrossRef]
- Spasojević Brkić, V.K.; Veljković, Z.A.; Golubović, T.; Brkić, A.D.; Kosić Šotić, I. Workspace design for crane cabins applying a combined traditional approach and the Taguchi method for design of experiments. Int. J. Occup. Saf. Ergo. 2016, 22, 228–240. [Google Scholar] [CrossRef] [PubMed]
- Essdai, A.; Spasojević Brkić, V.K.; Golubović, T.; Brkić, A.; Popović, V. Crane cabins’ interior space multivariate anthropometric modelling. Work 2018, 59, 557–570. [Google Scholar] [CrossRef] [PubMed]


Publisher’s Note: MDPI stays neutral with regard to jurisdictional claims in published maps and institutional affiliations. |
© 2021 by the authors. Licensee MDPI, Basel, Switzerland. This article is an open access article distributed under the terms and conditions of the Creative Commons Attribution (CC BY) license (http://creativecommons.org/licenses/by/4.0/).