Article

Evaluation and Prediction of Ecosystem Service Value in the Zhoushan Islands Based on LUCC

1
School of Marine Science and Technology, Zhejiang Ocean University, Zhoushan 316022, China
2
School of Economics and Management, Zhejiang Ocean University, Zhoushan 316022, China
3
School of International Affairs and Public Administration, Ocean University of China, Qingdao 266100, China
*
Author to whom correspondence should be addressed.
Sustainability 2021, 13(4), 2302; https://doi.org/10.3390/su13042302
Submission received: 10 December 2020 / Revised: 10 February 2021 / Accepted: 12 February 2021 / Published: 20 February 2021
(This article belongs to the Special Issue Assessing and Valuing Ecosystem Services)

Abstract

:
Islands are the confluence of terrestrial ecology and marine ecology. With urban expansion and economic development, the ecological environment of islands is facing serious threats. In order to study the island area land use change/cover (LUCC) and its impact on the ecosystem service value (ESV), this study was conducted. This study evaluated the ESV of Zhoushan Islands based on the LUCC, using the equivalent coefficient method, and simulated and analyzed the ESV of Zhoushan Islands in 2025 under different scenarios using the "Future Land Use Simulation Model". The results showed: (1) From 2000 to 2020, the ESV of Zhoushan Islands showed a "∧" type change trend, and the total amount decreased by 14.1141 million yuan. (2) The spatial distribution and changes of ESV have a certain regularity. The ESV in the center of the island and in the water system area is relatively high but does not change significantly over time, while the ESV of urban buildings and cultivated areas on the edge of the island is low, and, over time, the change is significant. (3) Compared with 2020, the total ESV under the business-as-usual (BAU) scenario shows a slow downward trend, the ESV under the socio-economic development (SED) scenario shows a significant downward trend, and the total ESV under the ecological protection priority (EPP) scenario has increased. This research provides a theoretical basis and support for the development and utilization of island space and the improvement of "eco-economy-society" benefits; in addition, the research results provide support for scientific decision-making on the sustainable use of resources in island areas (island cities) and the sustainable management of ecosystems.

1. Introduction

Ecosystem services are the direct or indirect products and services produced by the ecosystem through its functions [1,2], and are obtained through the structure, process, and function of the ecosystem [3]. These types of services form the basis of ecological environment stability and sustainable development and are closely related to human well-being [4]. Although ecosystems have made very important contributions to the development of human society [5,6,7,8,9], with the development of time, the value of global ecosystem services is gradually decreasing [10,11,12,13]. Evaluation of ecosystem services (ESs) is a topic of great interest in research on the analysis and quantification of the significance of ecosystems to human well-being in order to form better decisions regarding the sustainable utilization and management of ESs [14,15,16]. Costanza et al. developed the Global Ecosystem Service Value Assessment System in 1997, making ecosystem service a hot research topic in ecology [1,17]. Since then, ecosystem service values (ESVs) have been extensively studied globally and have become a popular and cutting-edge issue for global or regional organizations and their scientific communities [18,19,20]. Subsequently, many scholars estimated the ESV by referring to or improving these methods on different scales [21,22]. Costanza et al. (2014) has provided an updated estimate on the global ESV and compared it with the results obtained in 1997 by using the same methods implemented in 1997 [11]. According to the actual conditions in China, the equivalent coefficient table for ESV based on the model was introduced by Xie et al. (2003) [23], Xie et al. [24], and Xie et al. [25] and has been widely used.
Land use change/cover (LUCC) is a crucial way in which human activities affect ecosystems and can change the behavior and procedure of ecosystem functioning, and thereby influences ESV [20,26,27]. The Millennium Ecosystem Assessment (MA) report noted that LUCC has been the most important driving force of the change in terrestrial ESV since the 1950s [10,28]. Global scholars have focused increasing attention on the impact of LUCC on ecosystem service value and have conducted extensive research on the global scale [8,11,29], national scale [30,31], and regional scale [32,33,34,35,36], achieving remarkable results. There are also various methods used to assess ecosystem service values, which mainly include monetary models [37,38], value coefficients of ecosystem services [39,40], GIS-based models [41,42], and models such as InVEST, GLOBIO, and ARIES [43,44]. Among them, scenario simulation based on LUCC can more effectively evaluate and predict ecosystem services value and has been widely studied and applied [35,45,46,47]. However, most of the current researches are focused on terrestrial ecosystem services, and there are few studies on coastal areas or islands.
The island is an important fulcrum for the development of marine economy, and the sustainable supply of island ecosystem services is the basis for island development and utilization [48,49]. At the same time, the island has the characteristics of isolation and ecological fragility, and it is difficult to repair once damaged. In recent years, rapid economic and social development, island development, urban expansion, and other human activities have led to tremendous changes in island land use. The ecological environment is facing serious threats, and the continuous degradation of island ecosystem services threatens island ecology and marine economy sustainable development [50]. The Zhoushan Islands archipelago was selected as the study area because this is a typical area of high intensity development of human activities in the coastal zone of China. The main objectives of this study are to assess the ESV of the Zhoushan Islands, predict the future distribution of LUCC by multi-scenario simulation analysis, estimate variations in ESV resulting from the impacts of LUCC on the Zhoushan Islands, and provide support for scientific decision-making in sustainable ecosystem management.

2. Materials and Methods

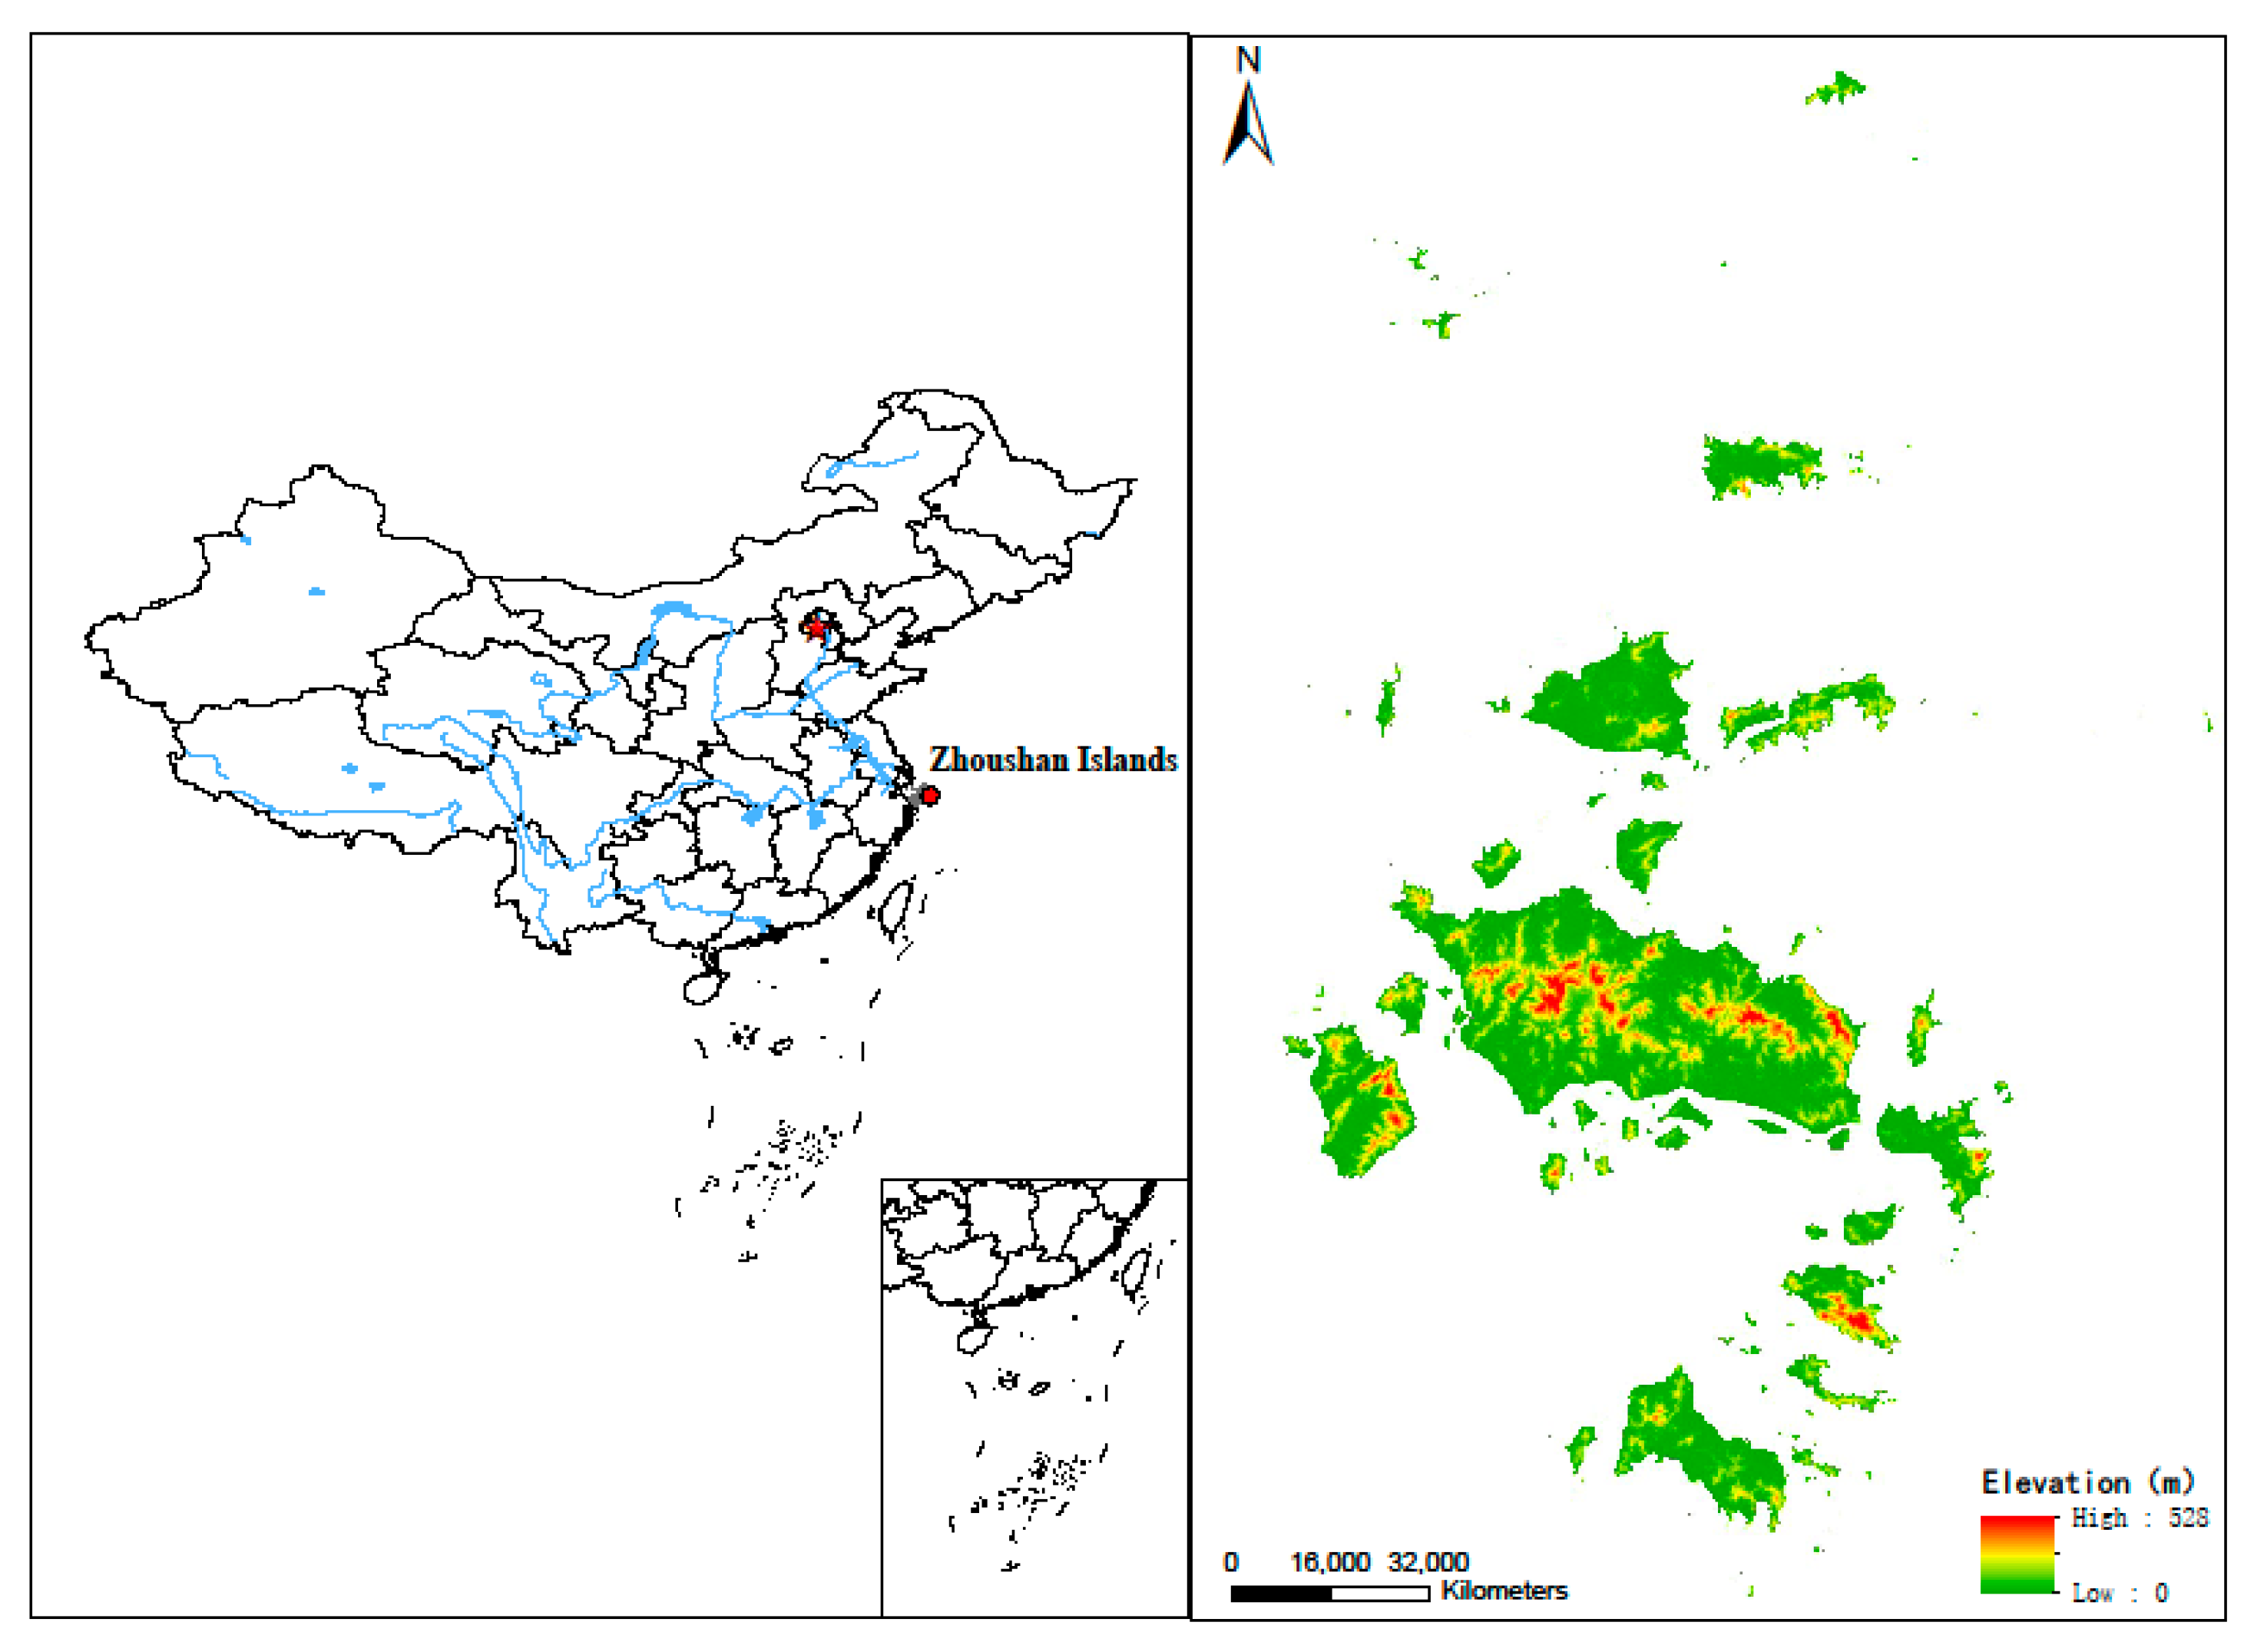
2.1. Regions for This Study

The Zhoushan Islands are located off the coast of eastern China, south of the Yangtze River Delta. The range is about 121.5° E–123.4° E, 29.5° N–31.0° N (Figure 1). It is China’s largest archipelago and an important ecological barrier in the southeast coastal area of China which consists of 1400 islands. The Zhoushan Islands are an important economic zone in the Yangtze River Delta, located in the fragile and complex ecological environment of the Yangtze River Basin. Its sea area is 22,000 km2, and its land area is about 1371 km2. It has a subtropical maritime monsoon climate, with mild and humid climate, and an average annual temperature of about 16 °C. The Zhoushan Islands are not only China’s largest seafood production, processing, and sales base, but also one of the few natural deep-water ports in China. It has a very important strategic location and advantages in developing marine economy. However, in recent years, with rapid economic and social development, human activities such as land reclamation and urban expansion have led to great changes in the land use patterns of the Zhoushan Islands, and the ecological environment is facing serious threats, which is more obvious than in other coastal areas in China [51]. The important geographical location and the particularity of the islands’ urban ecology make Zhoushan Islands a suitable case study for assessing ESV changes and simulating future ESV changes in LUCC.

2.2. Methodological Steps and Data Resources

This research uses the following steps to conduct research (Figure 2). First, reclassify the obtained LUCC data of Zhoushan Islands from 2000 to 2020 into forest land, grassland, cultivated land, water area, and construction land, and calculate the ESV of Zhoushan Islands from 2000 to 2020 based on the annual value of LUCC and ES per hectare dynamic. Second, according to existing research and actual conditions, select the driving factor data set for LUCC multi-scenario simulation, and spatialize it through ArcGIS software. Third, use GeoSOS-FLUS simulation software to simulate the LUCC distribution of the Zhoushan Islands in 2025 based on the 2000–2020 LUCC and simulation drive data sets, and explore the 2025 Zhoushan Islands’ ESV according to land use changes and the annual value of ES per hectare. Finally, analyze the temporal and spatial changes and distribution of LUCC and ESV in Zhoushan Islands from 2000 to 2020 and 2025.
LUCC data come from the Resource and Environmental Science Data Center of the Chinese Academy of Sciences (http://www.resdc.cn/), including LUCC data products in 2000, 2005, 2010, 2015, and 2020, with a resolution of 30 m. Land use/cover types are divided into five categories by the ArcGIS reclassification tool: forest land, grassland, cultivated land, water area, and construction land. The driving factor data set used for LUCC multi-scene simulation comes from the geospatial data cloud (http://www.gscloud.cn/), and there are 10 driving factors in total including digital elevation model (DEM), slope (generated by DEM), distance to highway, distance to administrative center, distance to coastline (obtained through Euclidean distance analysis), temperature and precipitation, population density, GDP, and urbanization rate. Other socioeconomic data come from the Zhoushan City Statistics Bureau (http://zstj.zhoushan.gov.cn/).

2.3. Assessment of Ecosystem Service Values

The equivalent coefficient of ESV per unit area served as the basis of the evaluation. In 1997, Costanza et al. published an article in the journal Nature and constructed a table of equivalent coefficients of ecosystem service value and estimated the ESV on a global scale. In 2008, Xie et al. revised the equivalent coefficients of ecosystem service value based on China’s specific ecosystem and socio-economic status by conducting a questionnaire survey on a total of 700 ecology experts (Table 1). Therefore, the value per unit area of ecosystem services featured in this study refers to the one from previous studies. The standard equivalent factor was further derived from the average net value of the three main food products (rice, wheat, and corn) and determined as 2181.78 yuan/ha [52]. Finally, the table of the ecosystem service value per unit area of different land use types was constructed (Table 1). The ESV was calculated using the following equations:
ESV k = f A k × V C k f
ESV f = k A k × V C k f
ESV = k f A k × V C k f
where ESVk, ESVf, and ESV refer to the ESV of the type k ecosystems, the ability category of ESVf, and the total ESV, respectively. Ak is the area (expressed in ha) of the type k ecosystem and VCkf (expressed in yuan/hm2) denotes the value coefficient for land use type k and ecosystem service function type f.

2.4. Multi-Scenario Simulation of Land Use/Cover Change

LUCC simulation models are effective and reproducible tools for analyzing both the causes and the consequences of future landscape dynamics under various scenarios [53]. In this paper, GeoSOS-FLUS software was used to facilitate the LUCC multi-scenario simulation by coupling human and natural effects (available for free download at http://www.geosimulation.cn/flus.html). GeoSOS-FLUS is a powerful tool that can facilitate more convenient and efficient LUCC simulations and can be easily used for several purposes [54]. According to the current situation and characteristics of land use and social-economic development in the Zhoushan Islands, a total of three scenarios, i.e., business-as-usual (BAU), socio-economic development (SED), and ecological protection priority (EPP) scenarios, were established. The BAU scenario refers to the continued development without changing the development strategy under the current development trend. SED scenario refers to a further focus on economic and social development under the current development trend. The EPP scenario refers to a further focus on ecological and environmental protection under the current development trend.
Before starting the simulation, the LUCC driving factors in 2018 (for example, DEM, slope, distance to railway, distance to administrative center, temperature, precipitation, coastline length, population, density, GDP, and urbanization rate) needed to be spatialized. Then, using the land use data in 2018 and 10 driving factors as input data, the neural network algorithm (ANN) was used to calculate the occurrence probability of each land use type in each pixel in the study area. At the same time, it was necessary to calculate the probability matrix of land use transfer in the Zhoushan Islands from 1990 to 2018. Finally, the land use data in 2018 was used as the input data, and the transition probability matrix and the classification conversion constraint matrix was modified to obtain the spatial distribution data of LUCC under the BAU, SED, and EPP scenarios in 2025.

3. Results

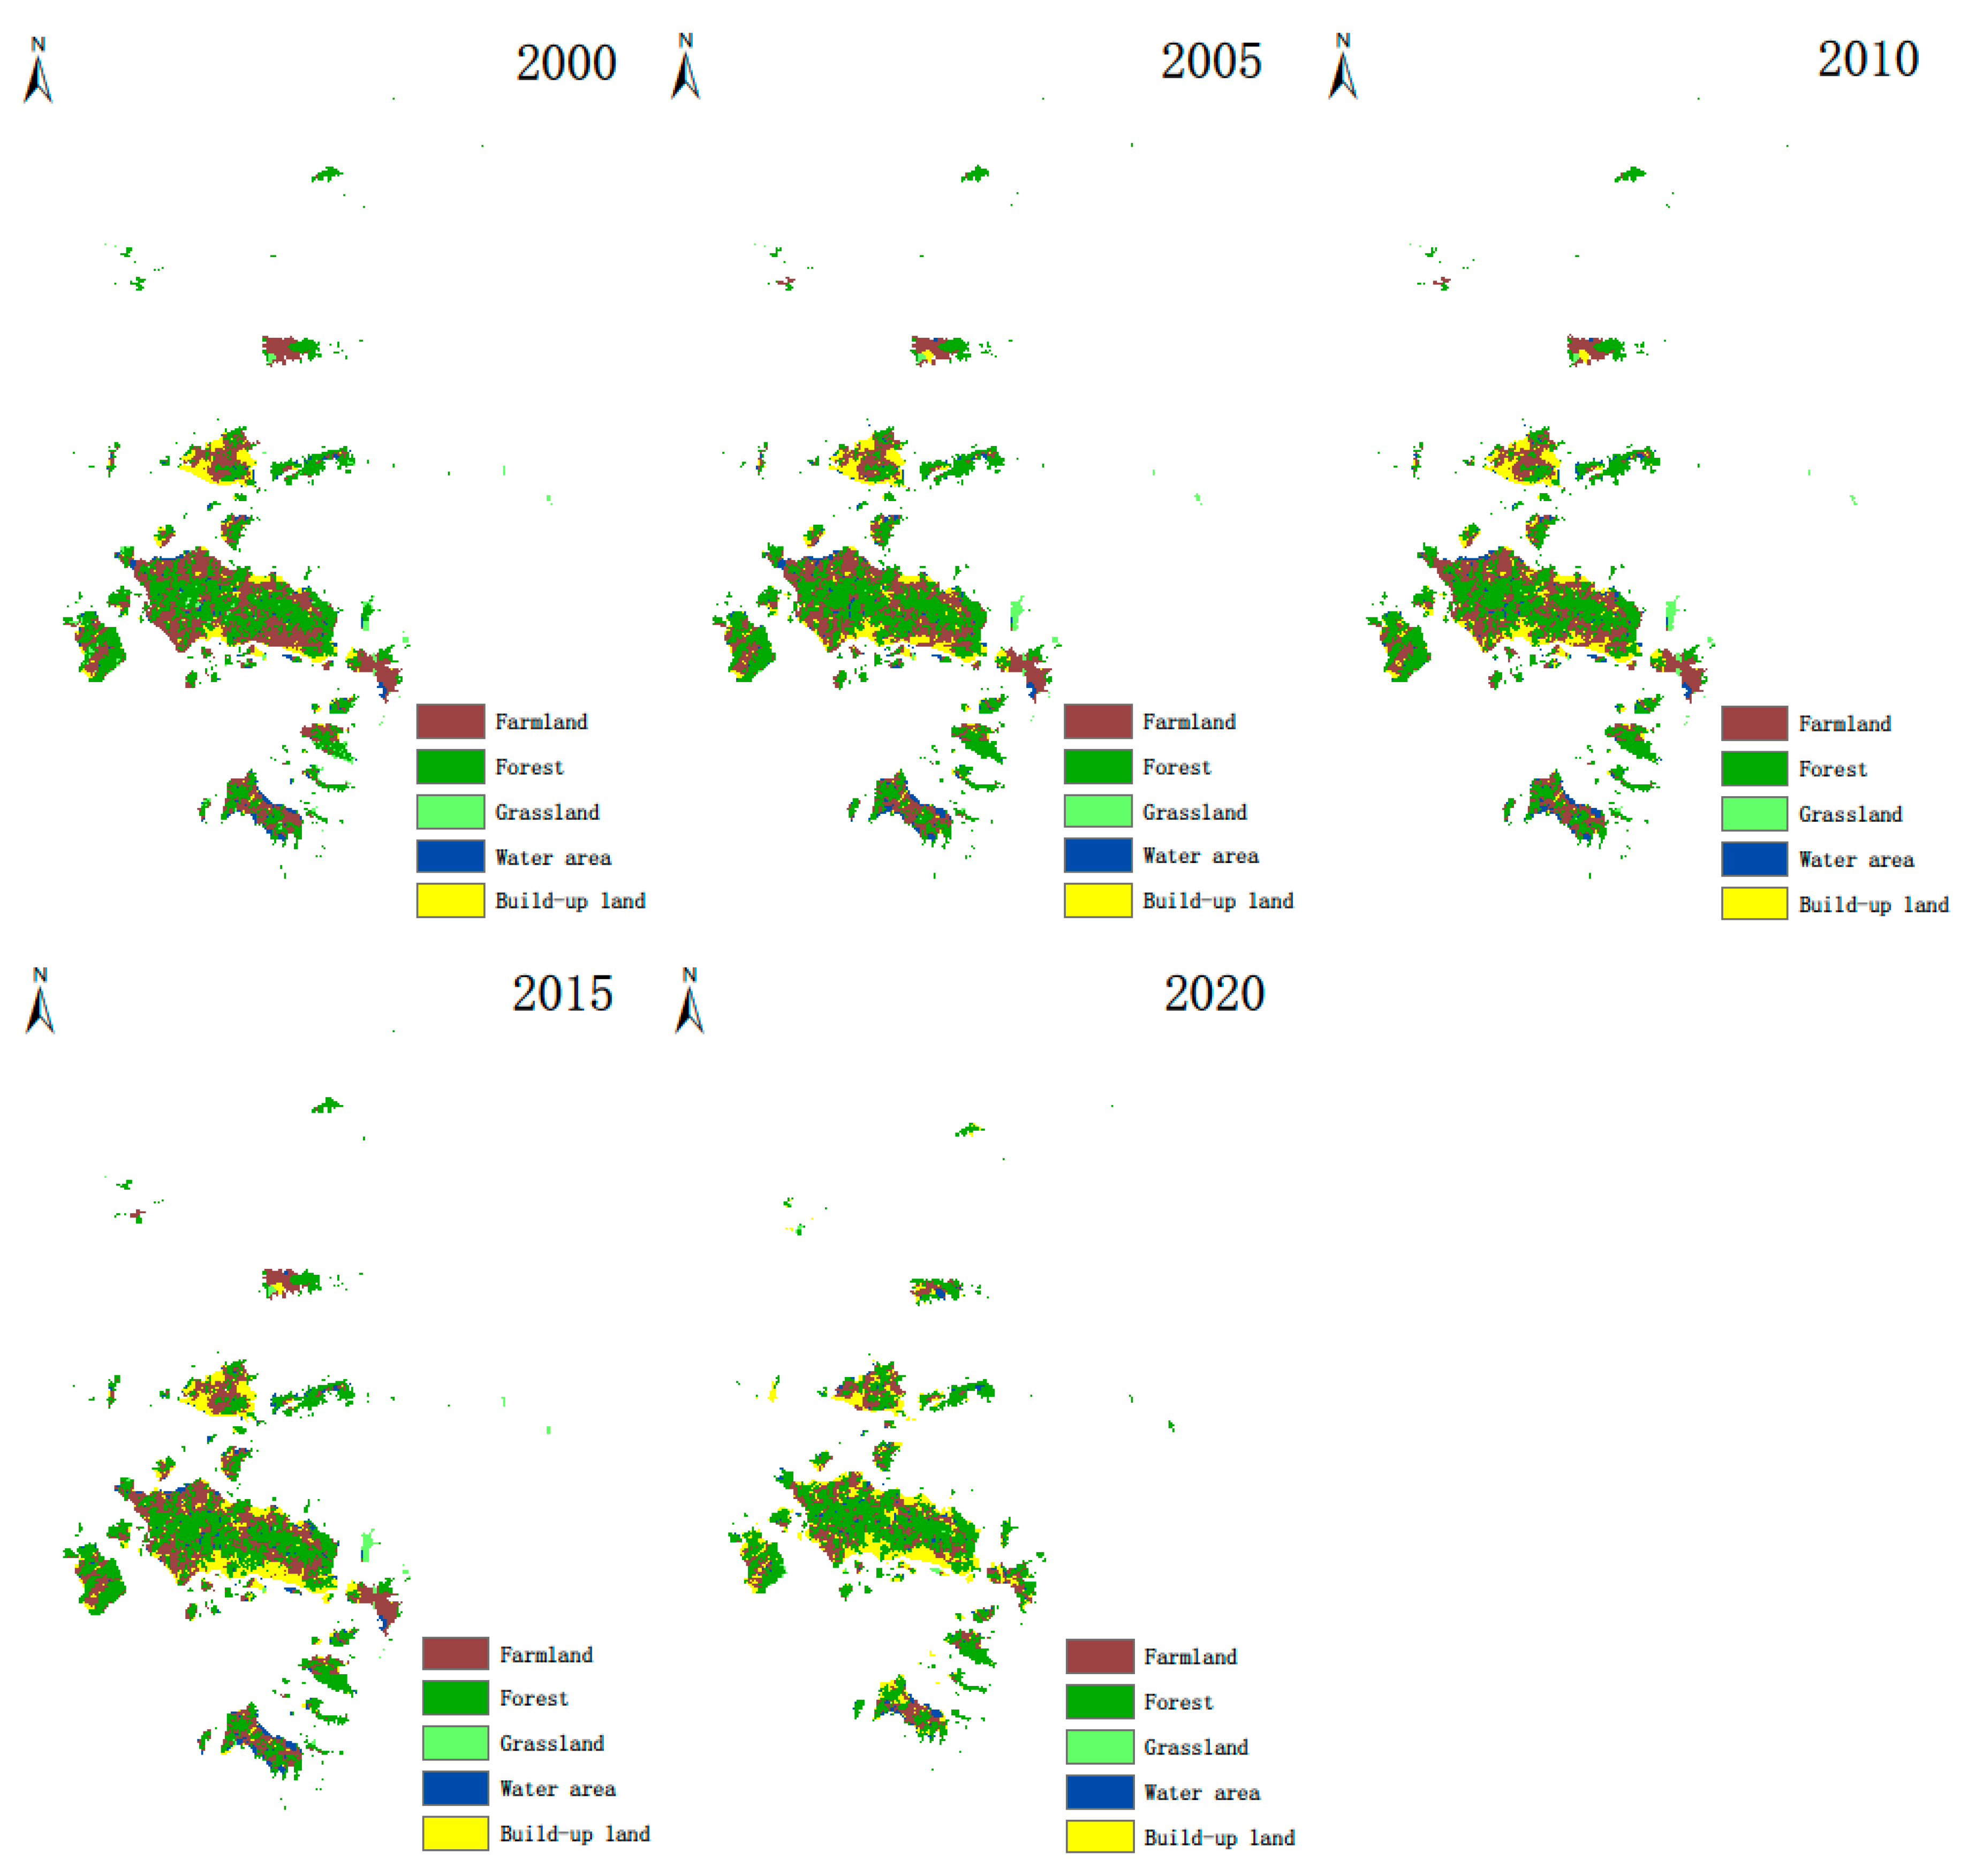
3.1. Land Use/Cover Change during 2000–2020

From 2000 to 2020, the total land area of Zhoushan Islands increased by 2.33%. According to the ratio of land use/cover, woodland is the main coverage type in Zhoushan Islands, accounting for more than 50%, followed by cultivated land. From 2000 to 2020, the area of arable land in Zhoushan Islands continued to decrease, with a reduction rate of 10.80%. The area of woodland increased by 3.48%, the area of grassland decreased by 1.51%, the area of water systems decreased by 0.46%, and the area of buildings continued to increase significantly, with a growth rate of 9.29%.
Land use/cover changes show the characteristics of different periods (Table 2). Among them, the land use/cover area changed the most in 2015–2020, with a growth rate of 2.22%, and the change rate in 2010–2015 was the smallest, with a growth rate of 0.02%, while the total land use/cover area decreased by 0.04% in 2005–2010. From 2000 to 2005, the area of arable land and grassland decreased by 4.17% and 1.22%, respectively, and the area of woodland, water system, and buildings increased by 1.59%, 0.62%, and 3.19%, respectively. From 2005 to 2010, the area of arable land and woodland decreased by 0.16% and 0.55%, respectively, and the area of grassland, water system, and buildings increased by 0.02%, 0.06%, and 0.63%, respectively. From 2010 to 2015, the area of arable land, woodland, grassland and water system all decreased, and only the area of buildings increased by 1.48%. From 2015 to 2020, the area of arable land, grassland, and water system decreased by 5.14%, 0.30%, and 1.03%, but the area of woodland and buildings increased by 2.49% and 3.99%, respectively.
From a spatial perspective the cultivated land, woodland, and grassland of the Zhoushan Islands are mainly distributed in the central part of the island. The water system and buildings are mainly distributed on the edge of the island. It can be seen from the Figure 3 that the arable land in Zhoushan Islands has decreased significantly, while the buildings have increased significantly, and a large amount of arable land has been converted into urban construction land. The spatial distribution of forests has not change significantly, grasslands are distributed in fragments, water systems are distributed on the edge of islands, and parts of the water systems are converted into construction land. Arable land and urban buildings are distributed on several major large islands, while some small islands are uninhabited, and their main land cover/use types are woodland and grassland, without buildings and arable land.

3.2. Changes in Ecosystem Service Values from 2000 to 2020

From 2000 to 2020, the ESV of Zhoushan Islands was 4,148,411,900 yuan, 432,061,600 yuan, 413,629,900 yuan, 4,270,485,500 yuan, and 4,134,297,800 yuan, showing a trend of increasing first and then decreasing. Among them, 2000–2005 increased by 4.33%, 2005–2010 decreased by 0.33%, 2010–2015 decreased by 1.00%, and 2015–2020 decreased by 3.19%.
From the perspective of different land use/cover types, forest land has the largest ESV, followed by water systems and cultivated land, and buildings have the smallest ESV. From 2000 to 2015, the ESV of cultivated land showed a continuous downward trend, with a decrease of 92.0948 million yuan. The ESV of forest land has fluctuated, with an increase of 88,765,900 yuan in 2000–2005, a decrease of 33,138,700 yuan in 2005–2015, and an increase of 19,696,964 yuan in 2015–2020. The ESV of grassland has been reduced by RMB 67,823,200. The ESV of the water system has been reduced by 111,114,900 yuan. The ESV of the building increased by 4,495,300 yuan (Table 3).
The spatial distribution of ESV in the Zhoushan Islands shows a certain pattern (Figure 4). Specifically, the forests in the central part of the island and the water system at the edge of the island have higher ESV, while the cultivated land and construction areas have lower ESV, especially the southern part of the central island and the western part of the second largest island. These areas have the lowest ESV. Both are in the heart of island cities. From 2000 to 2020, there were areas where ESV declined and increased in Zhoushan Islands, but the areas where declines were generally distributed were more widespread, and the ESV changes on the edge of the island were more obvious than in the middle of the island.

3.3. Multi-Scenario Simulation of Future Changes in Land Use/Cover and Ecosystem Service Values

Under different development scenarios (BAU, SED, and EPP), the spatial pattern of LUCC in Zhoushan Islands is basically similar, but there are differences in some areas (Figure 5). Compared with 2020, the area of each land use type in Zhoushan Islands will change in 2025 (Table 4). In the simulated scenarios, the land use types in the fringe areas of the islands have changed greatly, while the land use types in the central areas of the islands have changed little.
Under the BAU scenario, the area of arable land, grassland, and water system decreased by 68.95 square kilometers, 9.38 square kilometers, and 1.29 square kilometers, respectively, and the area of woodland and buildings increased by 8.3 square kilometers and 17.32 square kilometers, respectively. Under the SED scenario, the area of arable land, woodland, grassland, and water system have all been reduced, of which the area of woodland has decreased by 86.21 square kilometers and the area of buildings has increased by 53.32 square kilometers. Under the EPP scenario, the area of woodland and water system increased by 49.97 square kilometers and 0.96 square kilometers, and the area of buildings only increased by 8.32 square kilometers. The area of arable land and grassland still showed a downward trend, but the decline rate was significantly reduced. Compared with 2020, the cities under the three scenarios have expanded. Under the SED scenario, the effect of urban expansion is the most obvious, and there is a trend of expanding inland from the edge of the island. In the EPP scenario, urban expansion is not obvious.
Table 5 shows the ESV of Zhoushan Islands in 2025 under different scenarios. Under the BAU scenario, the total value of ESV has decreased. Under the SED scenario, the total value of ESV has decreased the most, while under the EPP scenario, the total value of ESV has increased. Under the BAU scenario, the ESV of cultivated land, grassland, and water system decreased by RMB 58.517 million, RMB 40,298,800, and RMB 35.246 million, respectively, and forest land and buildings increased by RMB 41,803,100 and RMB 755,600 respectively. Under the SED scenario, the ESV of cultivated land, woodland, grassland, and water system all decreased, and the ESV of water system decreased the most, reaching 8457.56 yuan. Under the EPP scenario, the ESV of cultivated land and grasslands were reduced by 89,070,800 yuan and 35,659,200 yuan, while the ESV of forest land, water system, and buildings increased by 251,725,300, 26,416, and 362,900 yuan, respectively.
Different purposes under different scenarios led to different trends in the value of ecosystem services. In the SED scenario, for example, in pursuit of economic benefits and urban development, a large amount of arable land and woodland was converted into construction land, leading to a rapid decline in the ESV of the Zhoushan Islands. In the EPP scenario, the purpose of environmental protection replaced unilateral economic development and protected forest land, grassland, and water system to a certain extent, which increased the ESV of Zhoushan Islands and improved the ecological environment.

4. Discussion

4.1. LUCCs and Their Impact on ESV

Land use and land cover change (LUCC) is the most fundamental manifestation of the coupling relationship between human activities and terrestrial ecosystems. It is also an important driving factor in the transformation of ecosystem service functions [55]. In the process of land use change, there are changes in the ecosystem service function, structure, and process, causing the ESV also to change [56]. Changyan Wua (2020) [57] et al. studied the impact of LUCC on ESV in Jiangsu Province, China, and found that land transfer is the main driving factor of changes in ESV, and changes in forest land and cultivated land have the most significant impact on ESV. Yubin Liu (2020) [28] et al. evaluated ESV in the Bohai Rim region based on LUCC and found that farmland is the main land cover type in the Bohai Rim region, and the change of farmland area affects the ESV change in the Bohai Rim region. Yang Wang et al. (2020) [3] studied the spatiotemporal evolution characteristics of ESV in the Tarim Basin based on LUCC and found that water system is the land use type with the largest reduction in the area of Tarim, and is the main factor affecting ESV changes in Tarim. Therefore, ESV changes in different regions have different influencing factors.
This study was based on the LUCC study of ESV in Zhoushan Islands and found that, from 2000 to 2020, the total ESV of Zhoushan Islands first increased and then decreased, and the change of LUCC was basically the same as that of ESV. From 2000 to 2005, the total ESV increased. Specifically, the ESV of forest land and water system increased, while the ESV of cultivated land and grassland decreased. From 2005 to 2020, the total ESV showed a downward trend. Specifically, the ESV of cultivated land, woodland, grassland, and water system showed an overall downward trend. Forest land and water systems have the largest ESV coefficients and have the greatest impact on the total ESV. From the analysis of ESV changes over the years, woodland is the main driving factor for the changes in the total ESV of Zhoushan Islands.

4.2. Effectiveness and Limitations of ESV Based on LUCC

Although many scholars have studied ESV in various regions based on LUCC, including cities, forests, and watersheds [28,58,59], no one has studied the LUCC and ecosystem service value of island cities. Based on LUCC data and economic and social data, this study evaluated the ecosystem service value of the Zhoushan Islands from 2000 to 2020, and used FLUS software to simulate and predict the LUCC and ESV of the Zhoushan Islands in 2025, providing a new way for the evaluation of the island city ecosystem. The research ideas and methods provide a scientific reference for the sustainable development of resources, environment, and economic society in island regions around the world. However, there are still some limitations to the study, as follows:
First, it ignores the impact of ecosystem structure and function changes on the value of ecosystem services, and does not consider the correlation and heterogeneity between ecosystem service types. Second, the LUCC data come from the Resource and Environmental Science Data Center of the Chinese Academy of Sciences (obtained from the interpretation of 30-resolution remote sensing images). The land use data are divided into five categories: cultivated land, woodland, grassland, water system, and buildings. There are no more detailed LUCC data, which in turn affects the accuracy of ESV assessment. Third, this study uses the equivalent coefficient method [11,30] to evaluate ESV, which reflects the results of the Zhoushan Islands ESV to a certain extent, but this method is associated with certain doubts and criticisms in the field and needs further improvement.

5. Conclusions

Based on LUCC, this study conducted a study on the ecosystem service value of Zhoushan Islands from 2000 to 2020, and simulated and predicted ESV in 2025. The main conclusions are as follows:
(1) From 2000 to 2020, the total ESV of Zhoushan Islands has decreased. Woodland is the main land use/cover type in the Zhoushan Islands and contributes the main ESV, with a contribution rate of about 70%. The area of buildings and ESV increased the fastest. In addition, the distribution of ESV has a certain regularity. The forest and water system areas in the middle of the island have the highest ESV, which did not change significantly over time, while the urban area on the edge of the island has the lowest ESV, and the change is very obvious.
(2) Compared with 2020, the ecological environment under different scenarios is quite different. Under the BAU scenario, the ESV of Zhoushan Islands showed a slow decreasing trend. Under the SED scenario, the ESV decreased very significantly, but under the EPP scenario, the total ESV showed an increasing trend.
(3) As a composite system of land and sea, islands have become an important platform for promoting land and sea coordination, protecting the marine environment, and maintaining ecological balance. However, island ecosystems are easily destroyed and not easy to recover. Therefore, in future island development and urban construction, more attention should be paid to the protection of forests and water systems, and the control of urban expansion should be strengthened to promote ecological protection and sustainability of island areas.

Author Contributions

Conceptualization, H.X. and W.C.; methodology, H.X.; software, H.X. and L.C.; validation, H.X., M.C., and C.X.; formal analysis, L.C.; investigation, W.C., H.X., M.C., and C.X.; resources, W.C.; data curation, H.X. and L.C.; writing—original draft preparation, H.X. and W.C.; writing—review and editing, H.X.; visualization, H.X.; supervision, C.X.; and project administration, W.C. All authors have read and agreed to the published version of the manuscript.

Funding

This research was funded by The National Social Science Fund of China (20BZZ063) and Ministry of Education Humanities and Social Sciences Planning Fund of China (19YJA810018).

Institutional Review Board Statement

Not applicable.

Informed Consent Statement

Not applicable.

Data Availability Statement

The data presented in this study are available from the authors on request.

Conflicts of Interest

The authors declare no conflict of interest.

References

  1. Costanza, R.; d’Arge, R.; De Groot, R.; Farberk, S.; Belt, M.V.D. The value of the world’s ecosystem services and natural capital. Nature 1997, 387, 253–260. [Google Scholar] [CrossRef]
  2. Loomes, R.; O’Neill, K. Nature’s services: Societal dependence on natural ecosystems. Pac. Conserv. Biol. 1997, 6, 220–221. [Google Scholar] [CrossRef] [Green Version]
  3. Wang, Y.; Zhang, S.; Zhen, H.; Chang, X.; Shataer, R.; Li, Z. Spatiotemporal evolution characteristics in ecosystem service values based on land use/cover change in the Tarim River Basin, China. Sustainability 2020, 12, 7759. [Google Scholar] [CrossRef]
  4. Zhang, X.; Xie, H.; Shi, J.; Lv, T.; Liu, W. Assessing changes in ecosystem service values in response to land cover dynamics in Jiangxi province, China. Int. J. Environ. Res. Public Health 2020, 17, 3018. [Google Scholar] [CrossRef]
  5. Bartkowski, B. Are diverse ecosystems more valuable? Economic value of biodiversity as result of uncertainty and spatial interactions in ecosystem service provision. Ecosyst. Serv. 2017, 24, 50–57. [Google Scholar] [CrossRef]
  6. Braat, C.L.; de Groot, R. The ecosystem services agenda: Bridging the worlds of natural science and economics, conservation and development, and public and private policy. Ecosyst. Serv. 2012, 1, 4–15. [Google Scholar] [CrossRef] [Green Version]
  7. Costanza, R.; Groot, R.D.; Braat, L.; Kubiszewski, I.; Fioramonti, L.; Sutton, P.; Farber, S.; Grasso, M. Twenty years of ecosystem services: How far have we come and how far do we still need to go? Ecosyst. Serv. 2017, 28. [Google Scholar] [CrossRef]
  8. De Groot, R.; Brander, L.; van der Ploeg, S.; Costanza, R.; Bernard, F.; Braat, L.; Christie, M.; Crossman, N.; Ghermandi, A.; Hein, L.; et al. Global estimates of the value of ecosystems and their services in monetary units. Ecosyst. Serv. 2012, 1, 50–61. [Google Scholar] [CrossRef]
  9. Kubiszewski, I.; Costanza, R.; Anderson, S.; Sutton, P. The future value of ecosystem services: Global scenarios and national implications—ScienceDirect. Ecosyst. Serv. 2017, 26, 289–301. [Google Scholar] [CrossRef]
  10. Assessment, M.E. Ecosystems and human well-being: Desertification synthesis. Millenn. Ecosyst. Assess. 2005, 1–100. [Google Scholar] [CrossRef]
  11. Costanza, R.; de Groot, R.; Sutton, P.; van der Ploeg, S.; Anderson, S.J.; Kubiszewski, I.; Farber, S.; Turner, R.K. Changes in the global value of ecosystem services. Glob. Environ. Chang. 2014, 26, 152–158. [Google Scholar] [CrossRef]
  12. Gashaw, T.; Tulu, T.; Argaw, M.; Worqlul, W.A.; Tolessa, T.; Kindu, M. Estimating the impacts of land use/land cover changes on Ecosystem Service Values: The case of the Andassa watershed in the Upper Blue Nile basin of Ethiopia. Ecosyst. Serv. 2018, 31, 219–228. [Google Scholar] [CrossRef]
  13. Sutton, C.P.; Costanza, R.; Kubiszewski, I.; Anderson, J.S. The ecological economics of land degradation: Impacts on ecosystem service values. Ecol. Econ. 2016, 129, 182–192. [Google Scholar] [CrossRef]
  14. Song, W.; Deng, X.Z.; Yuan, Y.W. Impacts of land-use change on valued ecosystem service in rapidly urbanized North China Plain. Ecol. Model. 2015, 318, 245–253. [Google Scholar] [CrossRef]
  15. Ashournejad, Q.; Amiraslani, F.; Moghadam, M.K.; Toomanian, A. Assessing the changes of mangrove ecosystem services value in the Pars Special Economic Energy Zone. Ocean Coast Manage. 2019, 179, 104838. [Google Scholar] [CrossRef]
  16. Chi, W.F.; Zhao, Y.Y.; Kuang, W.H. Impacts of anthropogenic land use/cover changes on soil wind erosion in China. Sci. Total Environ. 2019, 668, 204–215. [Google Scholar] [CrossRef]
  17. Constanza, R.; Cumberland, J.; Daly, H.; Goodland, R.; Norgaard, R. An Introduction to Ecological Economics; St. Lucie Press: Boca Raton, FL, USA, 1998. [Google Scholar]
  18. Arowolo, A.O.; Deng, X.; Olatunji, O.A.; Obayelu, A.E. Assessing changes in the value of ecosystem services in response to land-use/land-cover dynamics in Nigeria. Sci. Total Environ. 2018, 636, 597–609. [Google Scholar] [CrossRef]
  19. Odgaard, M.V.; Turner, K.G.; Bøcher, P.K.; Svenning, J.C.; Dalgaard, T. A multi-criteria, ecosystem-service value method used to assess catchment suitability for potential wetland reconstruction in Denmark. Ecol. Indic. 2017, 77, 151–165. [Google Scholar] [CrossRef]
  20. Song, X.P. Global estimates of ecosystem service value and change: Taking into account uncertainties in satellite-based land cover data. Ecol. Econ. 2018, 143, 227–235. [Google Scholar] [CrossRef]
  21. Senbeta, F.; Tolessa, T.; Abebe, T. Land use/land cover analysis and ecosystem services valuation in the central highlands of Ethiopia. For. Trees Livelihoods 2017, 26, 111–123. [Google Scholar]
  22. Farley, J.; Costanza, R. Payments for ecosystem services: From local to global. Ecol. Econ. 2010, 69, 2060–2068. [Google Scholar] [CrossRef]
  23. Xie, G.D.; Lu, C.X.; Leng, Y.F.; Zheng, D.U.; Li, S.C. Ecological assets valuation of the Tibetan Plateau. J. Nat. Resour. 2003, 18, 189–196. [Google Scholar]
  24. Xie, G.D.; Zhen, L.; Lu, C.X.; Cao, S.Y.; Xiao, Y. Supply, consumption and valuation of ecosystem services in China. Resour. Sci. 2008, 38, 1152–1161. [Google Scholar]
  25. Xie, G.D.; Zhen, L.; Lu, C.X.; Xiao, Y.; Chen, C. Expert knowledge based valuation method of ecosystem services in China. J. Nat. Resour. 2008, 23, 911–919. [Google Scholar]
  26. Costanza, R.; D’Arge, R.; de Groot, R.; Farber, S.; Grasso, M.; Hannon, B.; Limburg, K.; Naeem, S.; O’Neill, R.V.; Paruelo, J.; et al. The value of ecosystem services: Putting the issues in perspective. Ecol. Econ. 1998, 25, 67–72. [Google Scholar] [CrossRef]
  27. Tolessa, T.; Senbeta, F.; Kidane, M. The impact of land use/land cover change on ecosystem services in the central highlands of Ethiopia. Ecosyst. Serv. 2017, 23, 47–54. [Google Scholar] [CrossRef]
  28. Liu, Y.; Hou, X.; Li, X.; Wang, C. Assessing and predicting changes in ecosystem service values based on land use/cover change in the Bohai Rim coastal zone. Ecol. Indic. 2020, 111, 106004. [Google Scholar] [CrossRef]
  29. Sannigrahi, S.; Bhatt, S.; Rahmat, S. Estimating global ecosystem service values and its response to land surface dynamics during 1995–2015. J. Environ. Manag. 2018, 223, 115–131. [Google Scholar] [CrossRef]
  30. Song, W.; Deng, X. Land-use/land-cover change and ecosystem service provision in China. Sci. Total Environ. 2017, 576, 705–719. [Google Scholar] [CrossRef]
  31. Frelichova, J.; Vackar, D.; Partl, A.; Louckova, B.; Harmackova, Z.V.; Lorencova, E. Integrated assessment of ecosystem services in the Czech Republic. Ecosyst. Serv. 2014, 8, 110–117. [Google Scholar] [CrossRef]
  32. Tan, Z.; Guan, Q.; Lin, J. The response and simulation of ecosystem services value to land use/land cover in an oasis, Northwest China. Ecol. Indic. 2020, 118, 106711. [Google Scholar] [CrossRef]
  33. Aziz, T. Changes in land use and ecosystem services values in Pakistan, 1950–2050. Environ. Dev. 2020, 100576. [Google Scholar] [CrossRef]
  34. Kindu, M.; Schneider, T.; Teketay, D.; Knoke, T. Changes of ecosystem service values in response to land use/land cover dynamics in Munessa–Shashemene landscape of the Ethiopian highlands. Sci. Total Environ. 2016, 547, 137–147. [Google Scholar] [CrossRef]
  35. Song, F.; Su, F.; Mi, C.; Sun, D. Analysis of driving forces on wetland ecosystem services value change: A case in Northeast China. Sci. Total Environ. 2020, 751, 141778. [Google Scholar] [CrossRef]
  36. Schirpke, U.; Tscholl, S.; Tasser, E. Spatio-temporal changes in ecosystem service values: Effects of land-use changes from past to future (1860–2100). J. Environ. Manage. 2020, 272, 111068. [Google Scholar] [CrossRef] [PubMed]
  37. Sinclair, M.; Vishnu Sagar, M.K.; Knudsen, C.; Sabu, J.; Ghermandi, A. Economic appraisal of ecosystem services and restoration scenarios in a tropical coastal Ramsar wetland in India. Ecosyst. Serv. 2021, 47, 101236. [Google Scholar] [CrossRef]
  38. Obeng, E.A.; Obiri, B.D.; Oduro, K.A.; Pentsil, S.; Anglaaere, L.C.; Foli, E.G.; Ofori, D.A. Economic value of non-market ecosystem services derived from trees on cocoa farms. Curr. Res. Environ. Sustain. 2020, 2, 100019. [Google Scholar] [CrossRef]
  39. Zheng, D.; Wang, Y.; Hao, S.; Xu, W.; Lv, L.; Yu, S. Spatial-temporal variation and tradeoffs/synergies analysis on multiple ecosystem services: A case study in the Three-River Headwaters region of China—ScienceDirect. Ecol. Indic. 2020, 116, 106494. [Google Scholar] [CrossRef]
  40. Sannigrahi, S.; Chakraborti, S.; Joshi, P.K.; Keesstra, S.; Sen, S.; Paul, S.K.; Kreuter, U.; Sutton, P.C.; Jha, S.; Dang, K.B. Ecosystem service value assessment of a natural reserve region for strengthening protection and conservation. J. Environ. Manage. 2019, 244, 208–227. [Google Scholar] [CrossRef]
  41. Schägner, J.P.; Brander, L.; Paracchini, M.L.; Maes, J.; Gollnow, F.; Bertzky, B. Spatial dimensions of recreational ecosystem service values: A review of meta-analyses and a combination of meta-analytic value-transfer and GIS. Ecosyst. Serv. 2018, 31, 395–409. [Google Scholar] [CrossRef]
  42. Sherrouse, B.C.; Clement, J.M.; Semmens, D.J. A GIS application for assessing, mapping, and quantifying the social values of ecosystem services. Appl. Geogr. 2011, 31, 748–760. [Google Scholar] [CrossRef]
  43. Grafius, D.R.; Corstanje, R.; Warren, P.H.; Evans, K.L.; Hancock, S.; Harris, J.A. The impact of land use/land cover scale on modelling urban ecosystem services. Landsc. Ecol. 2016, 31, 1509–1522. [Google Scholar] [CrossRef] [Green Version]
  44. Ma, S.; Wang, L.-J.; Zhu, D.; Zhang, J. Spatiotemporal changes in ecosystem services in the conservation priorities of the southern hill and mountain belt, China. Ecol. Indic. 2021, 122, 107225. [Google Scholar] [CrossRef]
  45. Li, Z.-T.; Li, M.; Xia, B.-C. Spatio-temporal dynamics of ecological security pattern of the Pearl River Delta urban agglomeration based on LUCC simulation. Ecol. Indic. 2020, 114, 106319. [Google Scholar] [CrossRef]
  46. Akhtar, M.; Zhao, Y.; Gao, G.L.; Gulzar, Q.; Samie, A. Assessment of ecosystem services value in response to prevailing and future land use/cover changes in Lahore, Pakistan. Reg. Sustain. 2020, 1, 37–47. [Google Scholar] [CrossRef]
  47. Hong, Z.; Xiaoli, L.; Tianlin, Z. Evaluation of ecosystem service based on scenario simulation of land use in Yunnan Province. Phys. Chem. Earth. 2018, 104, 58–65. [Google Scholar]
  48. Ottaviani, G.; Keppel, G.; Götzenberger, L.; Harrison, S.; Opedal, Ø.H.; Conti, L.; Liancourt, P.; Klimešová, J.; Silveira, F.A.O.; Jiménez-Alfaro, B.; et al. Linking plant functional ecology to island biogeography. Trends Plant Sci. 2020, 25, 329–339. [Google Scholar] [CrossRef]
  49. Wu, Y.; Zhang, T.; Zhang, H.; Pan, T.; Zhang, J. Factors influencing the ecological security of island cities: A neighborhood-scale study of Zhoushan Island, China. Sustain. Cities Soc. 2020, 55, 102029. [Google Scholar] [CrossRef]
  50. Frauendorf, T.C.; Mackenzie, R.A.; Tingley, R.W.; Frazier, A.G.; Riney, M.H.; El-Sabaawi, R.W. Evaluating ecosystem effects of climate change on tropical island streams using high spatial and temporal resolution sampling regimes. Glob. Chang. Biol. 2019, 25, 1344–1357. [Google Scholar] [CrossRef] [PubMed]
  51. Chen, J.; Pan, D.; Mao, Z.; Ninghua, Z.; Jianhua, L. Land-cover reconstruction and change analysis using multisource remotely sensed imageries in Zhoushan islands since 1970. J. Coast. Res. 2014, 30, 272–282. [Google Scholar] [CrossRef]
  52. Xie, G.; Zhang, C.; Zhen, L.; Zhang, L. Dynamic changes in the value of China’s ecosystem services. Ecosyst. Serv. 2017, 26, 146–154. [Google Scholar] [CrossRef]
  53. Liu, X.; Liang, X.; Li, X.; Xu, X.; Wang, S. A future land use simulation model (FLUS) for simulating multiple land use scenarios by coupling human and natural effects. Landsc. Urban Plan. 2017, 168, 94–116. [Google Scholar] [CrossRef]
  54. Liang, X.; Liu, X.; Li, D.; Zhao, H.; Chen, G. Urban growth simulation by incorporating planning policies into a CA-based future land-use simulation model. Int. J. Geogr. Inf. Sci. 2018, 32, 2294–2316. [Google Scholar] [CrossRef]
  55. Mooney, H.A.; Duraiappah, A.; Larigauderie, A. Evolution of natural and social science interactions in global change research programs. Proc. Natl. Acad. Sci. USA 2013, 110, 3665–3672. [Google Scholar] [CrossRef] [PubMed] [Green Version]
  56. Shifaw, E.; Sha, J.M.; Li, X.M.; Bao, Z.C.; Zhou, Z.L. An insight into land-cover changes and their impacts on ecosystem services before and after the implementation of a comprehensive experimental zone plan in Pingtan Island, China. Land Use Policy 2019, 82, 631–642. [Google Scholar] [CrossRef]
  57. Wu, C.; Chen, B.; Huang, X.; Wei, Y.H.D. Effect of land-use change and optimization on the ecosystem service values of Jiangsu province, China. Ecol. Indic. 2020, 117, 106507. [Google Scholar] [CrossRef]
  58. Vardon, M.; Keith, H.; Lindenmayer, D. Accounting and valuing the ecosystem services related to water supply in the Central Highlands of Victoria, Australia. Ecosyst. Serv. 2019, 39, 101004. [Google Scholar] [CrossRef]
  59. Jiang, W.; Fu, B.; Yihe, L. Assessing Impacts of Land Use/Land Cover Conversion on Changes in Ecosystem Services Value on the Loess Plateau, China. Sustainability 2020, 12, 7128. [Google Scholar] [CrossRef]
Figure 1. Location of the Zhoushan Islands.
Sustainability 13 02302 g001
Figure 2. Methodological steps.
Sustainability 13 02302 g002
Figure 3. 2000–2020 Zhoushan Islands LUCC spatial pattern.
Sustainability 13 02302 g003
Figure 4. ESV spatial pattern in Zhoushan Islands.
Sustainability 13 02302 g004
Figure 5. Spatial distribution of land use/cover types in Zhoushan Islands under different scenarios.
Sustainability 13 02302 g005
Table 1. Table of equivalent coefficients for ecosystem service value (ESV) per unit area.
Ecosystem ClassificationProvisioning ServicesRegulating ServicesSupporting ServicesCultural Services
Food SupplyMaterial SupplyWater SupplyAir Quality RegulationClimate RegulationWaste TreatmentRegulation of Water FlowsErosion PreventionMaintenance of Soil FertilityHabitat ServicesCultural Services
Farmland1.360.09−2.631.110.570.172.720.010.190.210.09
Forest0.310.710.372.357.031.993.512.860.222.601.14
Grassland0.380.560.311.975.211.723.822.400.182.180.96
Water area0.800.238.290.772.295.55102.240.930.072.551.89
Built-up land0.000.000.000.0200.100.030.0200.020.01
Table 2. 2000–2020 Zhoushan Islands land use change/cover (LUCC) pattern.
LUCCArea/km2
Proportion/%
Area Change/km2
Dynamic Rate of Change/%
200020052010201520202000–20052005–20102010–20152015–20202000–2020
Farmland393.46349.50347.71333.57284.95−43.96−1.79−14.14−48.62−108.51
36.96%32.79%32.63%31.30%26.16%−4.17%−0.16%−1.33%−5.14%−10.80%
Forest525.29542.91536.78536.33575.3917.62−6.13−0.4539.0650.1
49.34%50.93%50.38%50.33%52.82%1.59%−0.55%−0.05%2.49%3.48%
Grassland30.3917.3217.5417.5114.60−13.070.22−0.03−2.91−15.79
2.85%1.63%1.65%1.64%1.34%−1.22%0.02%−0.01%−0.30%−1.51%
Water area37.7444.4145.0243.9533.696.670.61−1.07−10.26−4.05
3.55%4.17%4.23%4.12%3.09%0.62%0.06%−0.11%−1.03%−0.46%
Built-up land77.66111.76118.43134.32180.6834.16.6715.8946.36103.02
7.30%10.49%11.12%12.60%16.59%3.19%0.63%1.48%3.99%9.29%
Total1064.541065.901065.491065.681089.311.36−0.410.1923.6324.77
100%100%100%100%100%0.13%−0.04%0.02%2.22%2.33%
Table 3. ESV of different land use/cover types (ten thousand yuan).
FarmlandForestGrasslandWater AreaBuilt-Up LandTotal
200033,393.38264,624.8513,054.67103,429.39338.89414,841.19
200529,662.09273,501.447441.53121,713.41487.69432,806.16
201029,510.16270,415.177535.10123,385.69516.78431,362.90
201528,310.70270,187.577523.88120,440.71586.09427,048.95
202024,183.90289,867.216272.3592,317.90788.42413,429.78
Table 4. Land use/cover change in Zhoushan Islands under different scenarios.
LUCCArea/km2
BAUSEDEPP2020
Farmland216.00198.74180.00284.95
Forest583.69567.00625.36575.39
Grassland5.224.976.3014.60
Water area32.4030.6034.6533.69
Built-up land198.00234.00189.00180.68
Table 5. 2025 ESV in Zhoushan Islands under different scenarios.
LUCCESV/Ten Thousand Yuan
BAUSEDEPP2020
Farmland18,332.1916,867.0615,276.8224,183.90
Forest294,047.52285,639.29315,039.74289,867.21
Grassland2242.472136.542706.436272.35
Water area88,793.3083,860.3494,959.5092,317.90
Built-up land863.981021.07824.71788.42
Total404,279.46389,524.30428,807.20413,429.78
Publisher’s Note: MDPI stays neutral with regard to jurisdictional claims in published maps and institutional affiliations.

