
Does Information about Personal Emissions of Carbon Dioxide Improve Individual Environmental Friendliness? A Survey Experiment

Abstract
1. Introduction
2. Methods
2.1. Concepts of Measurement
2.2. Subjects
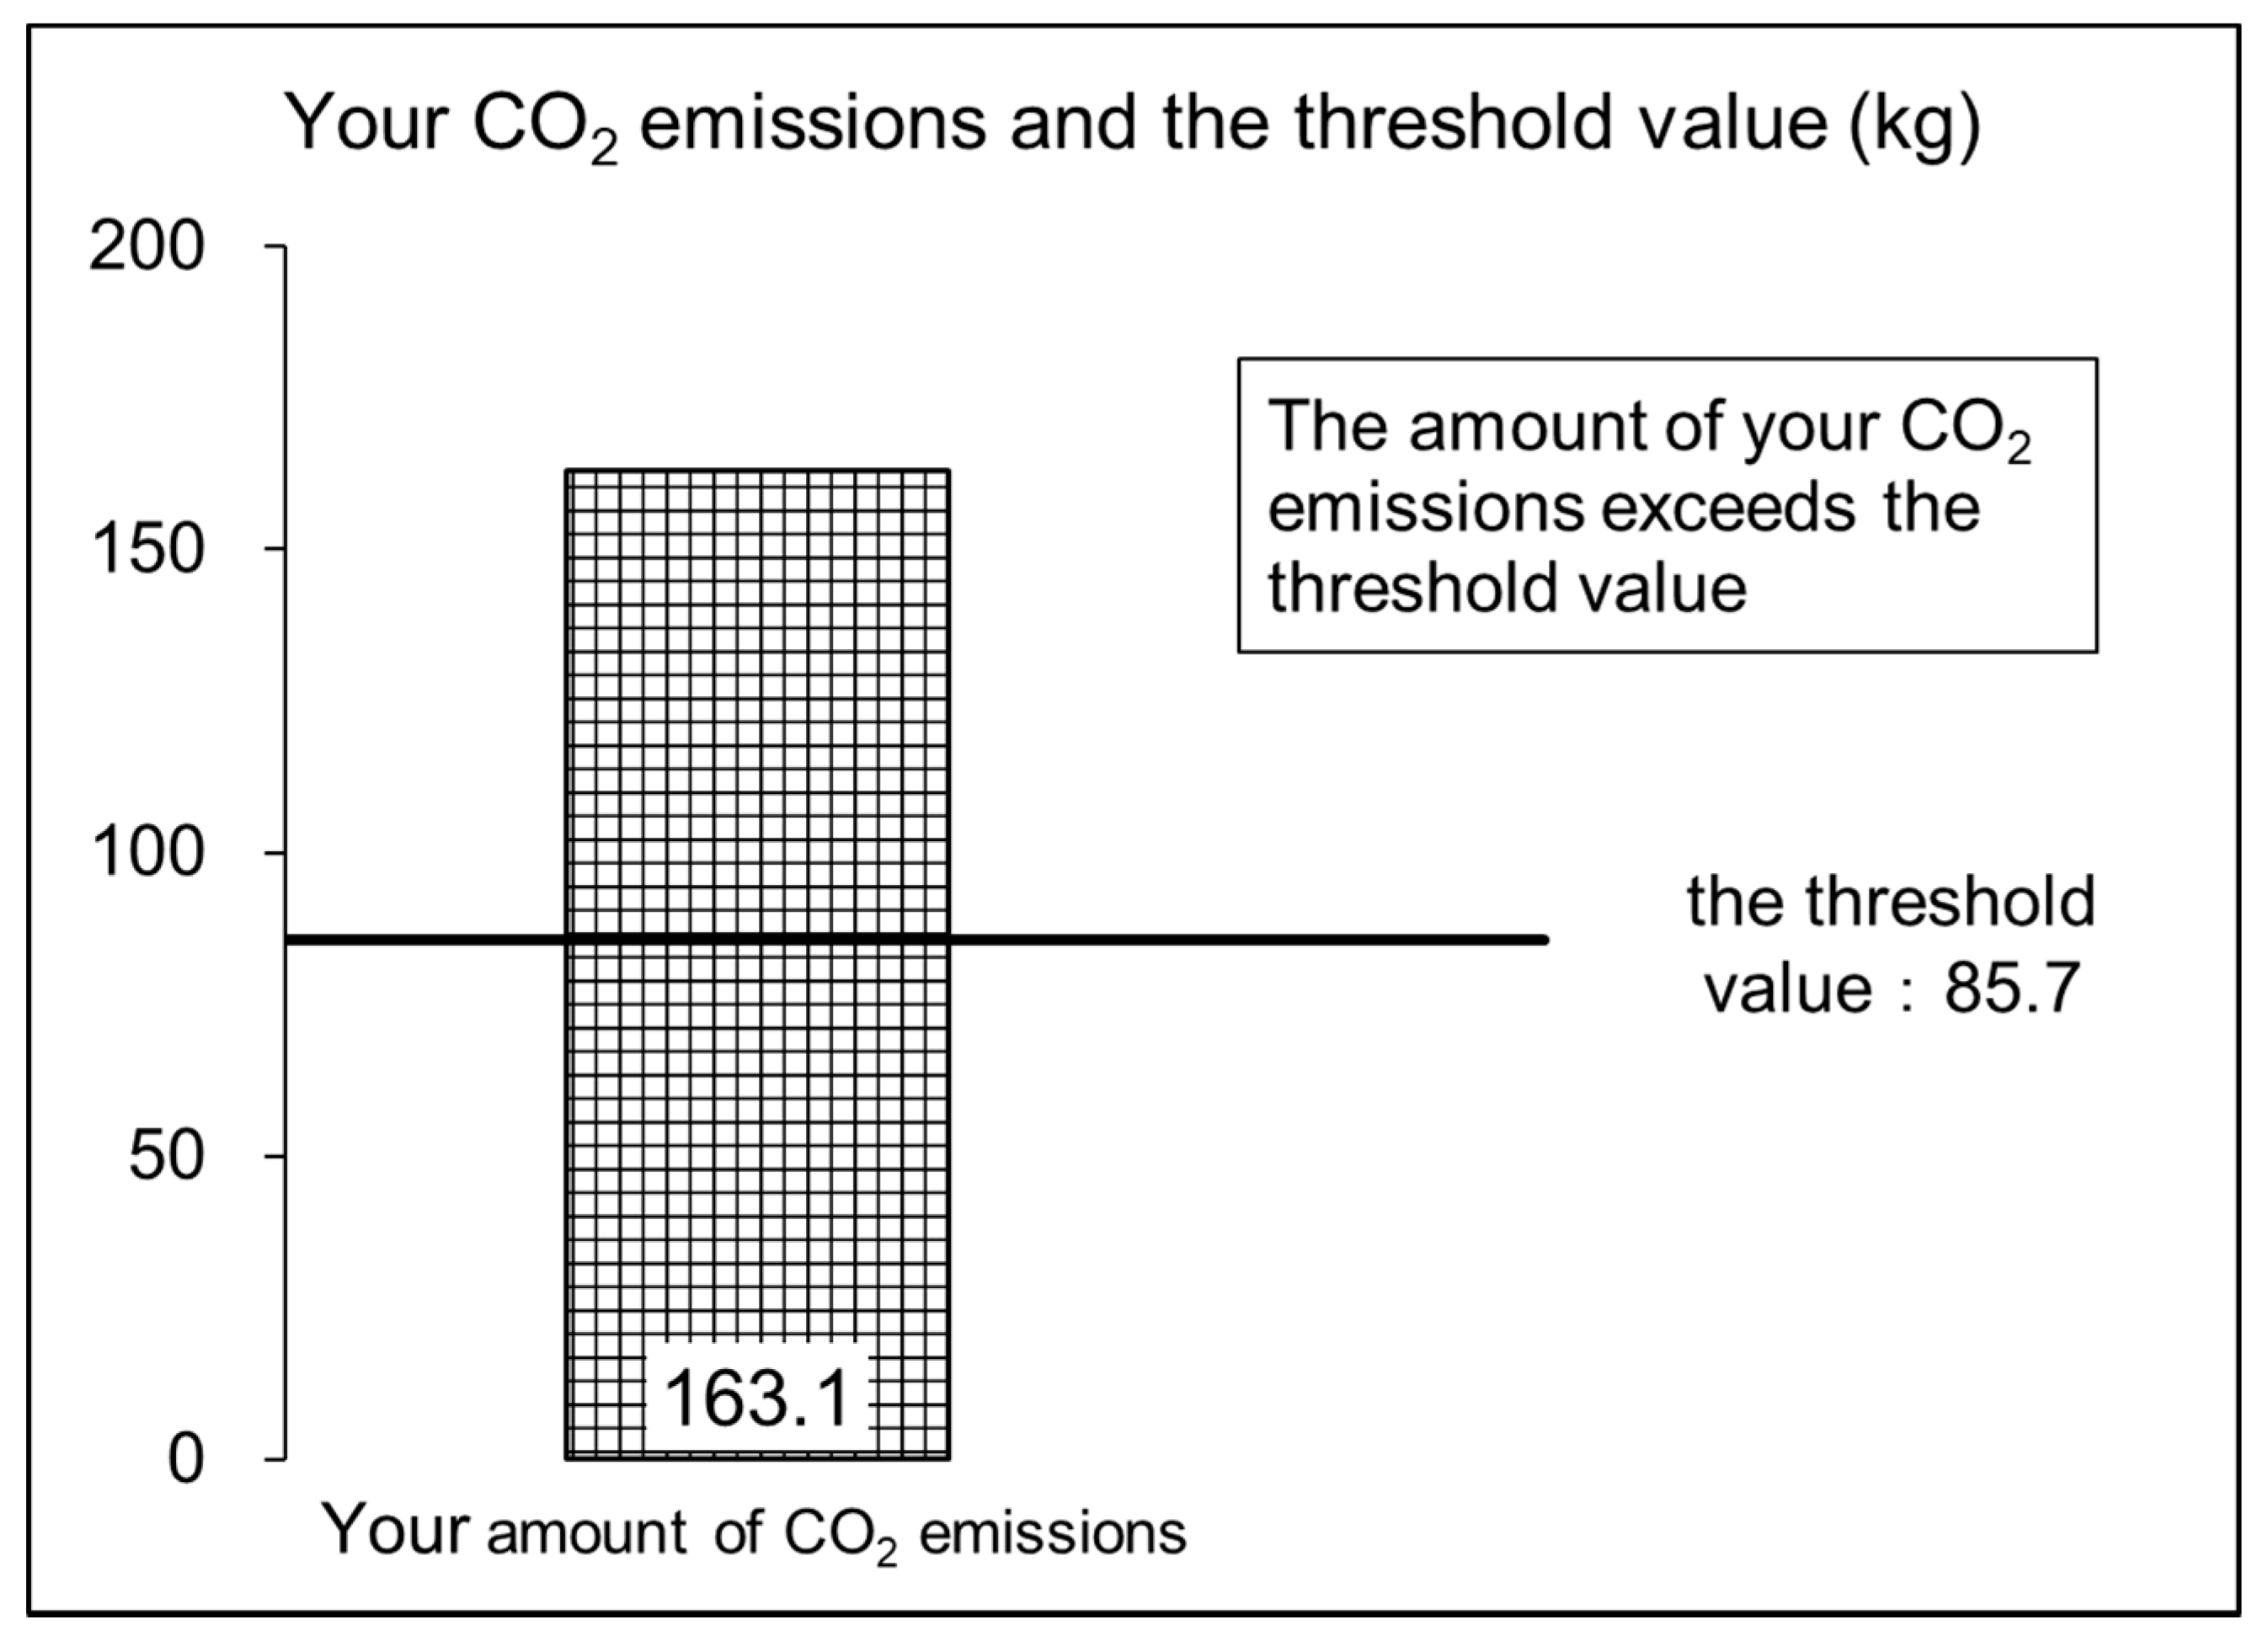
2.3. Experimental Design
2.4. Data Analysis
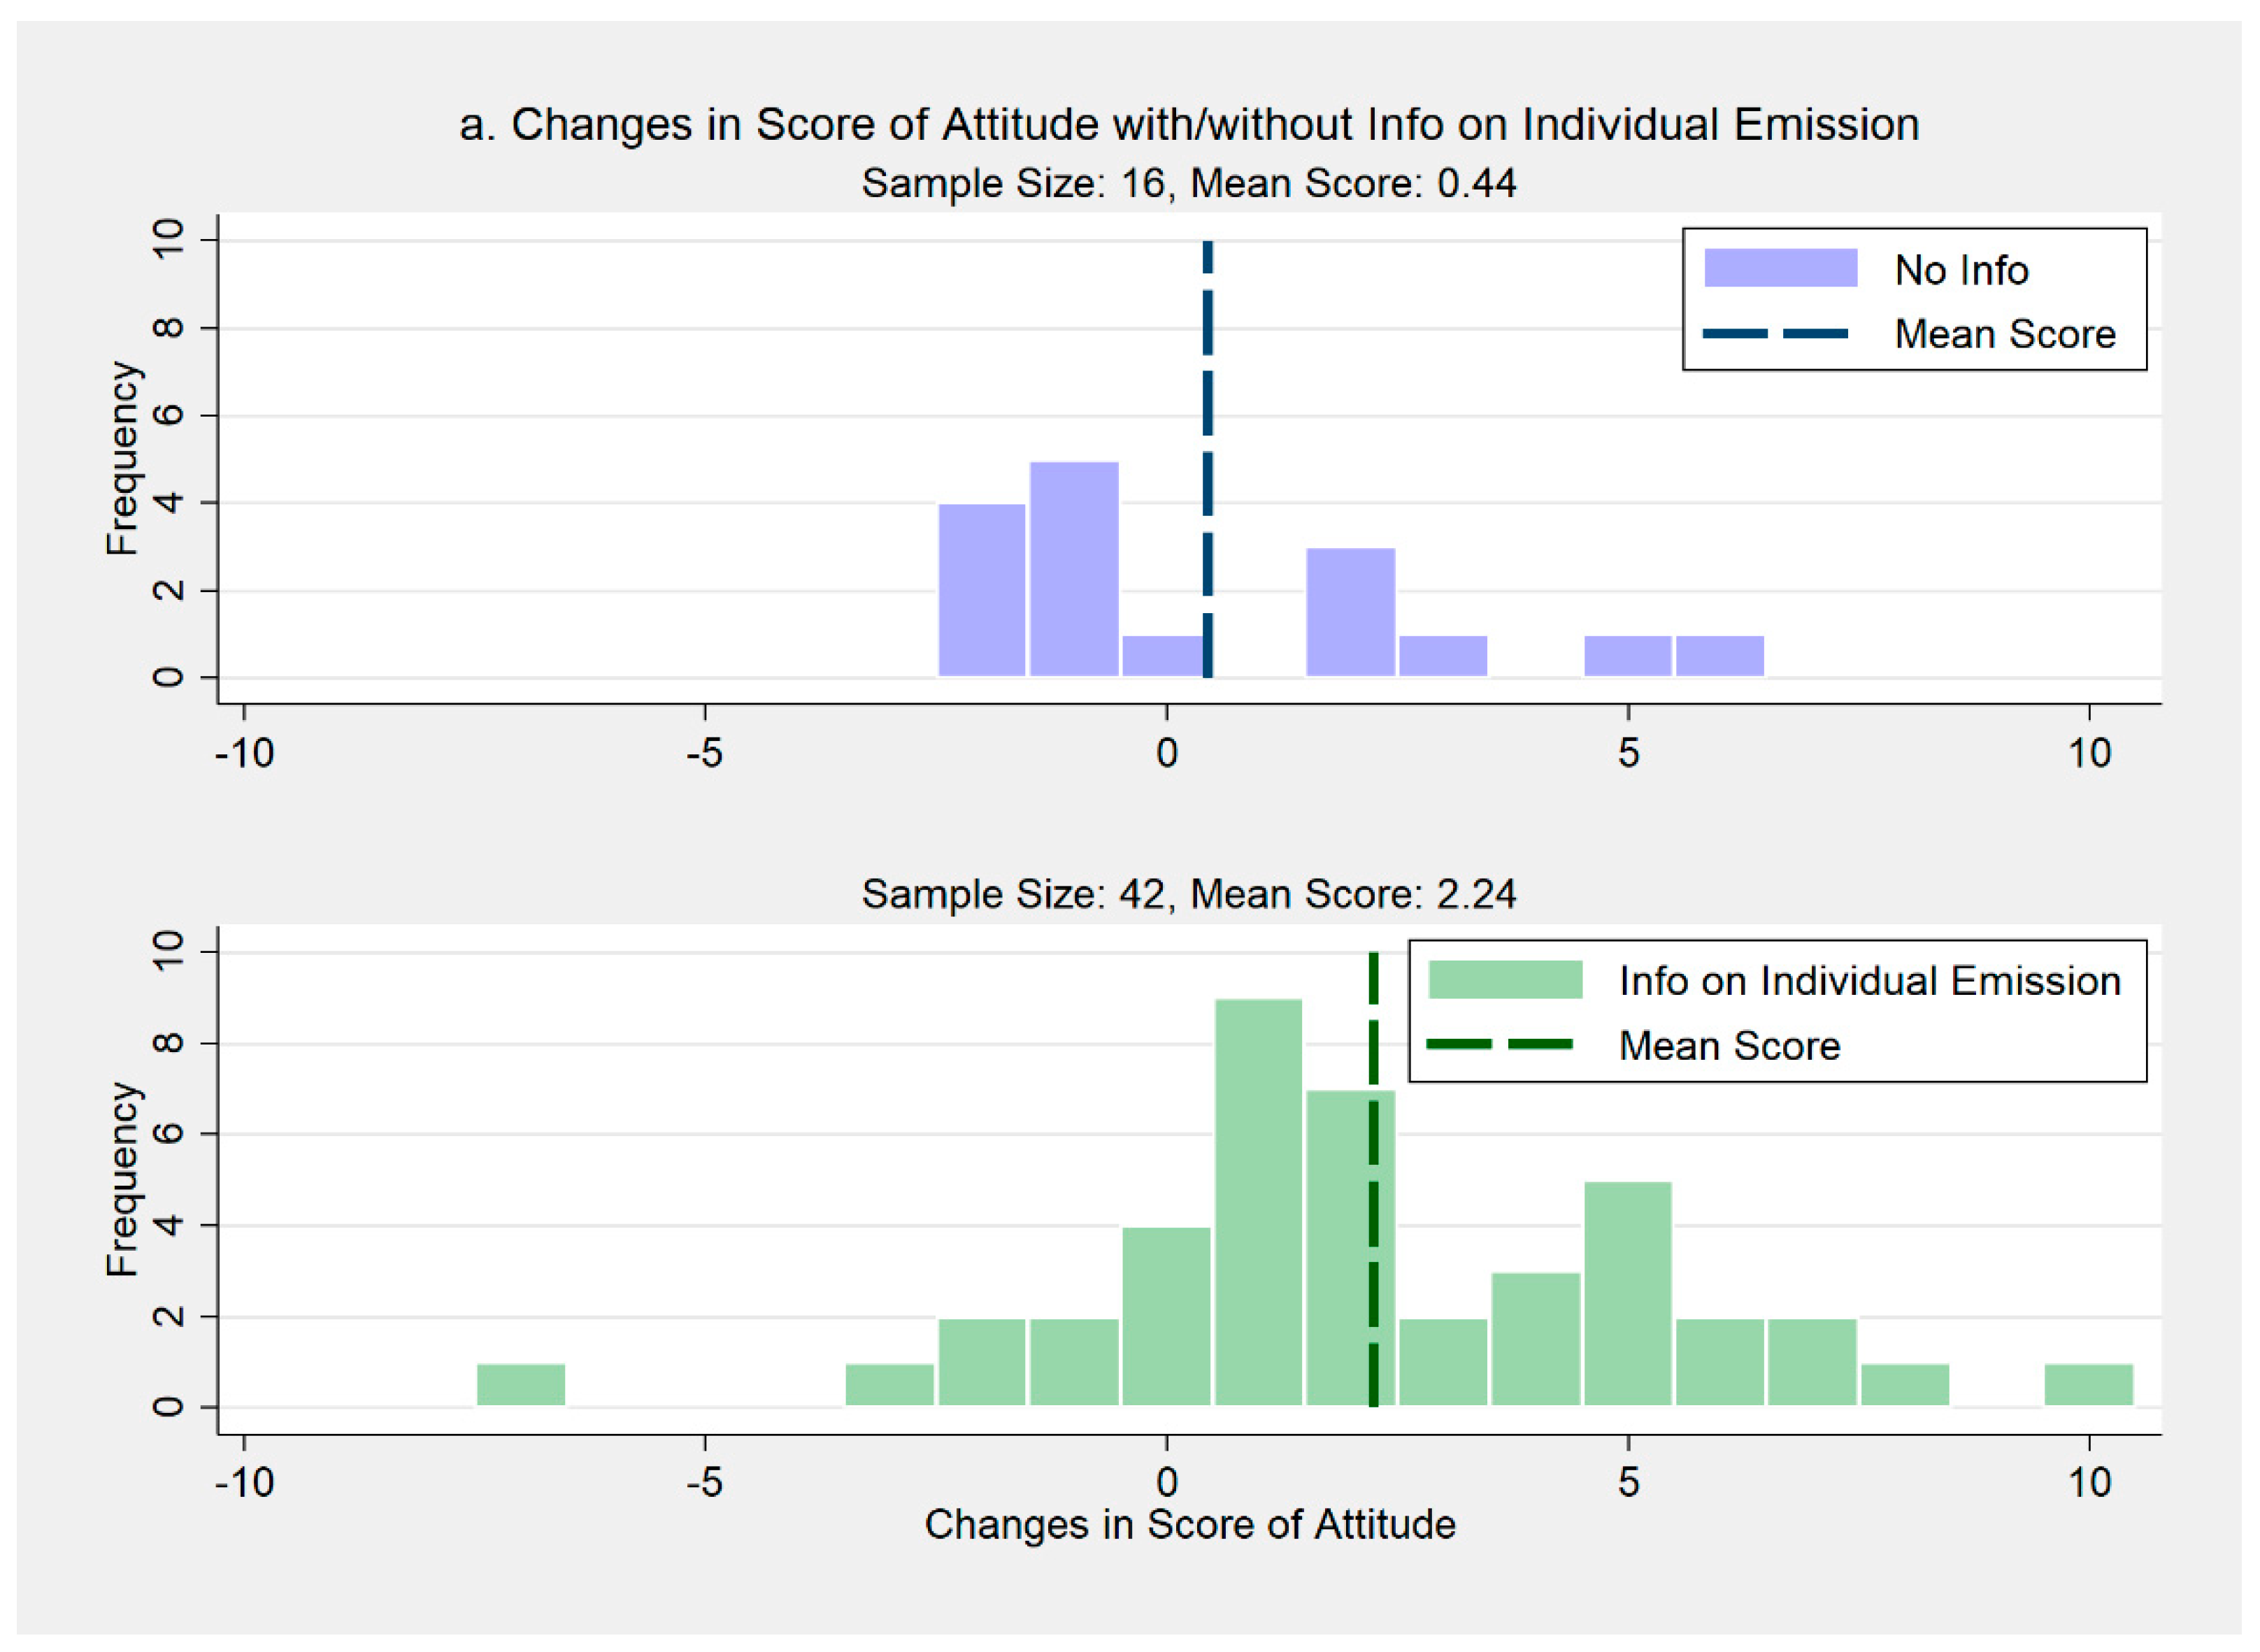
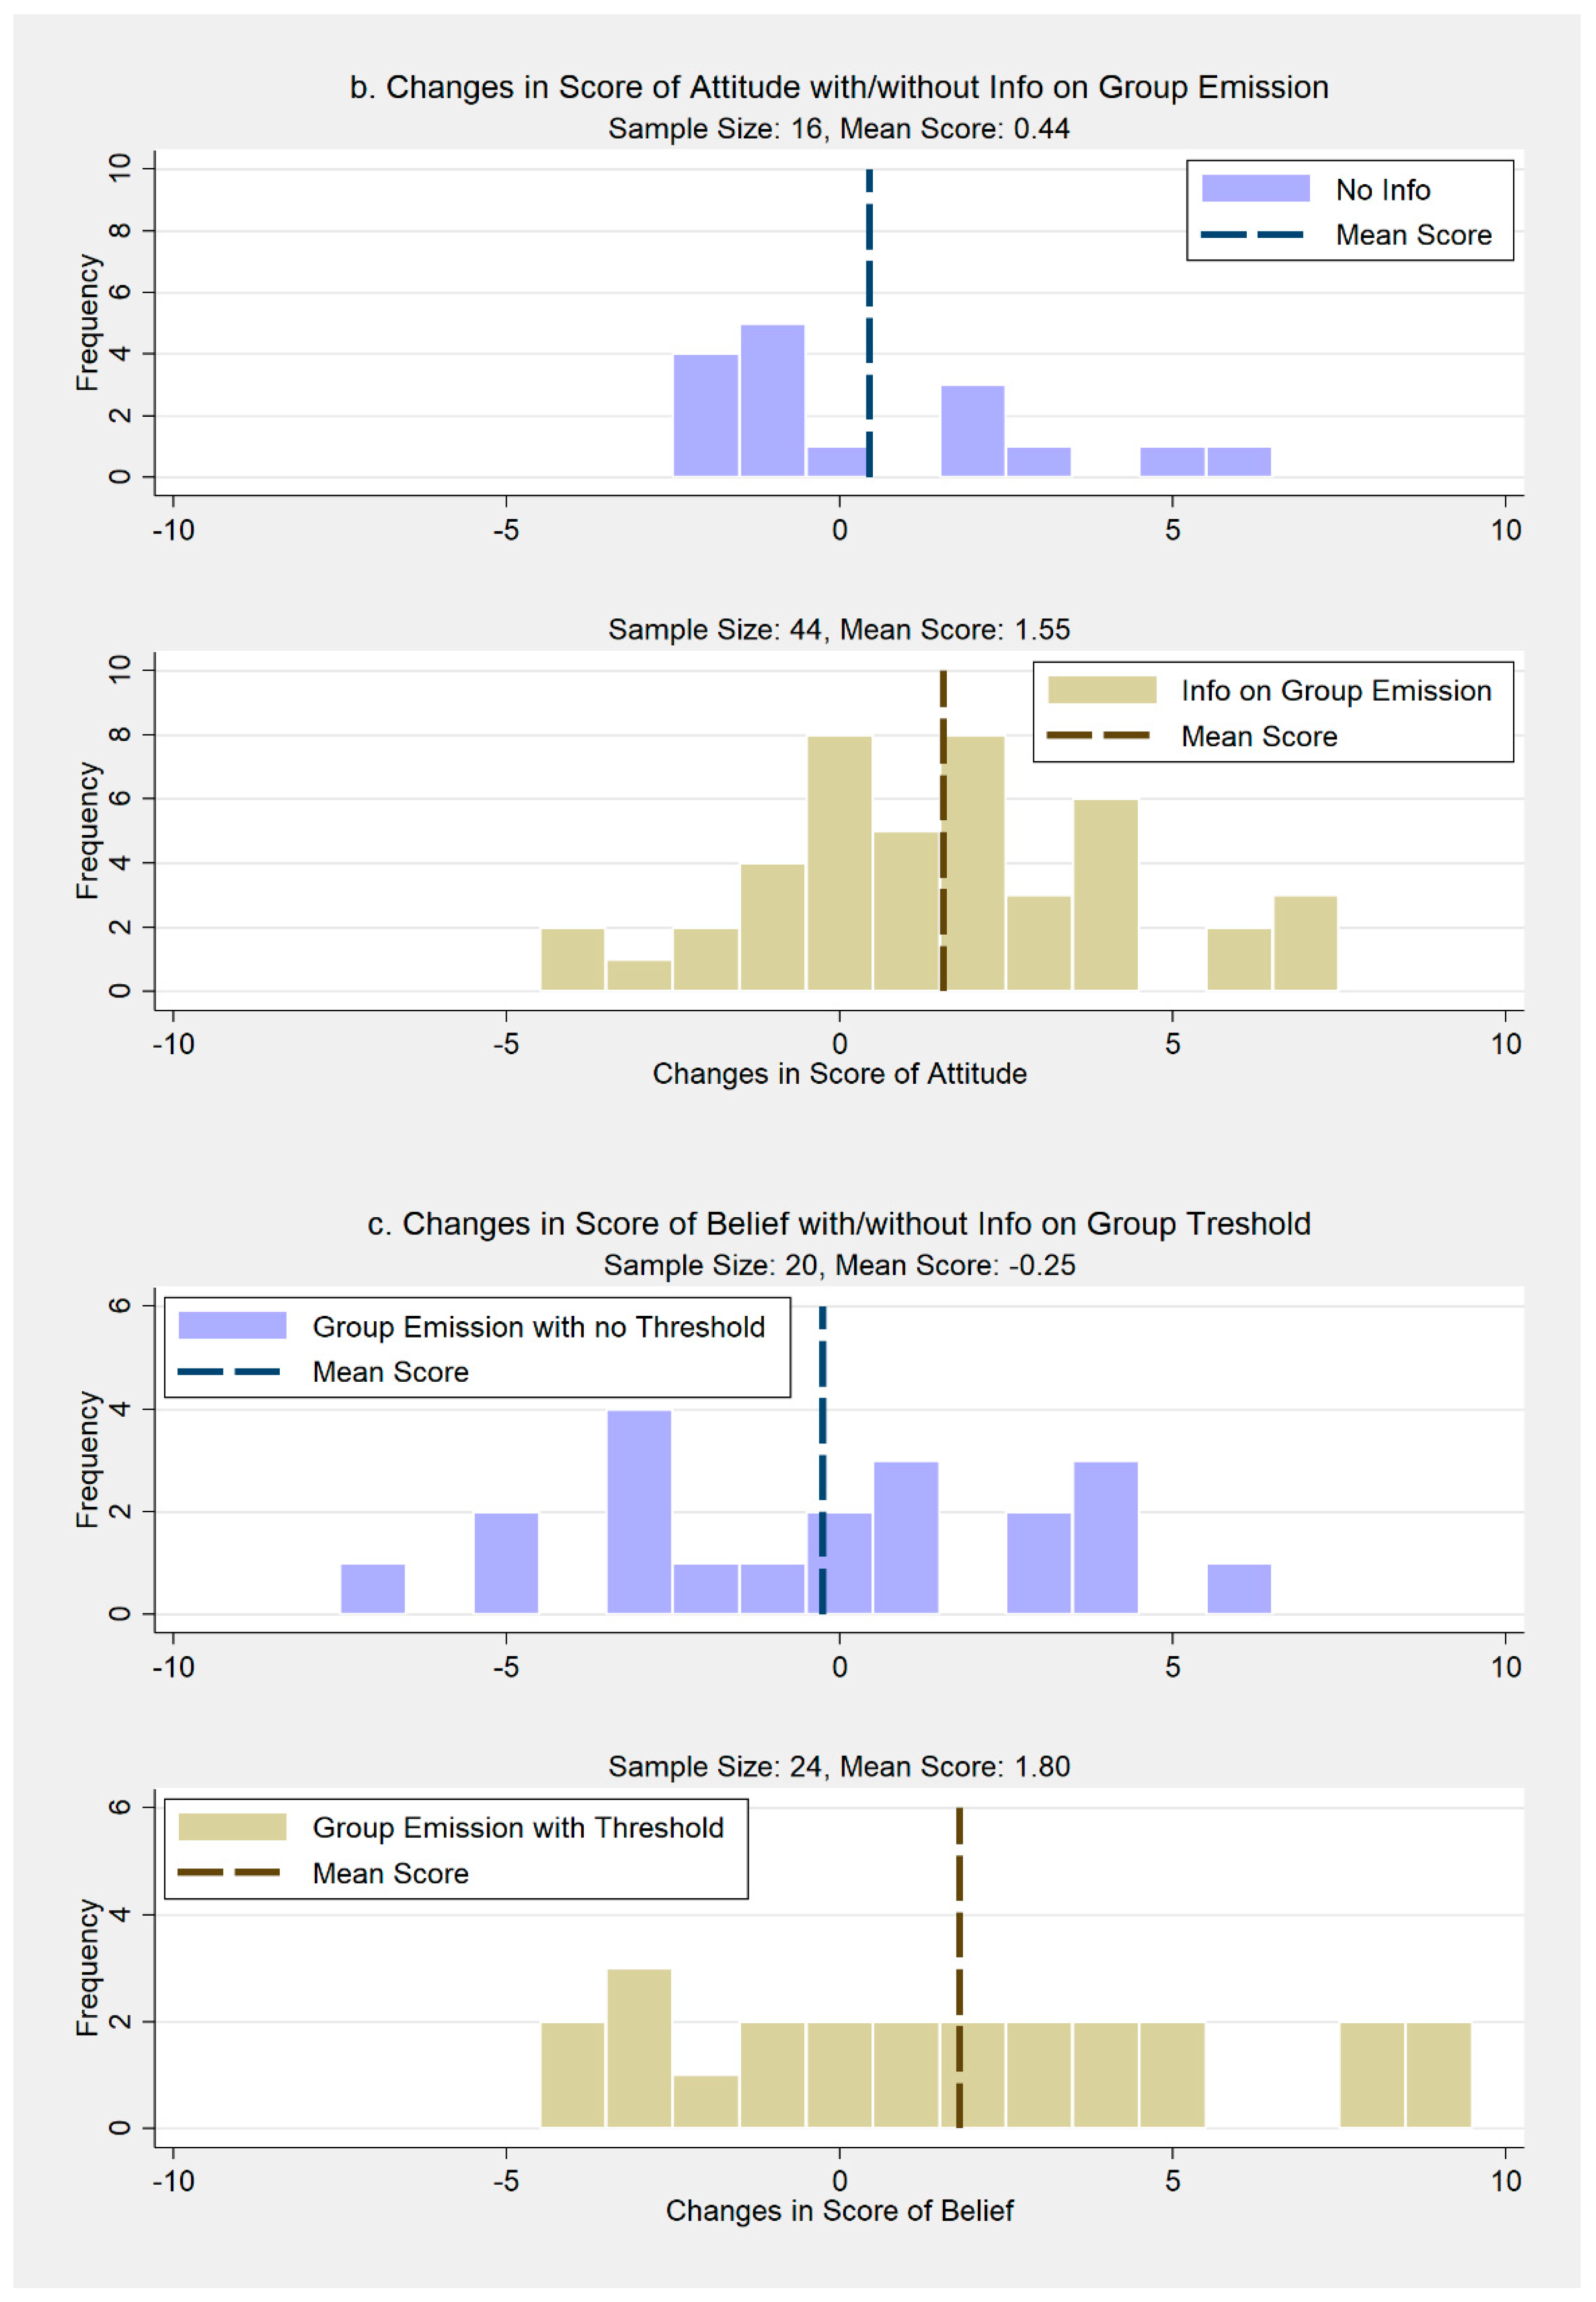
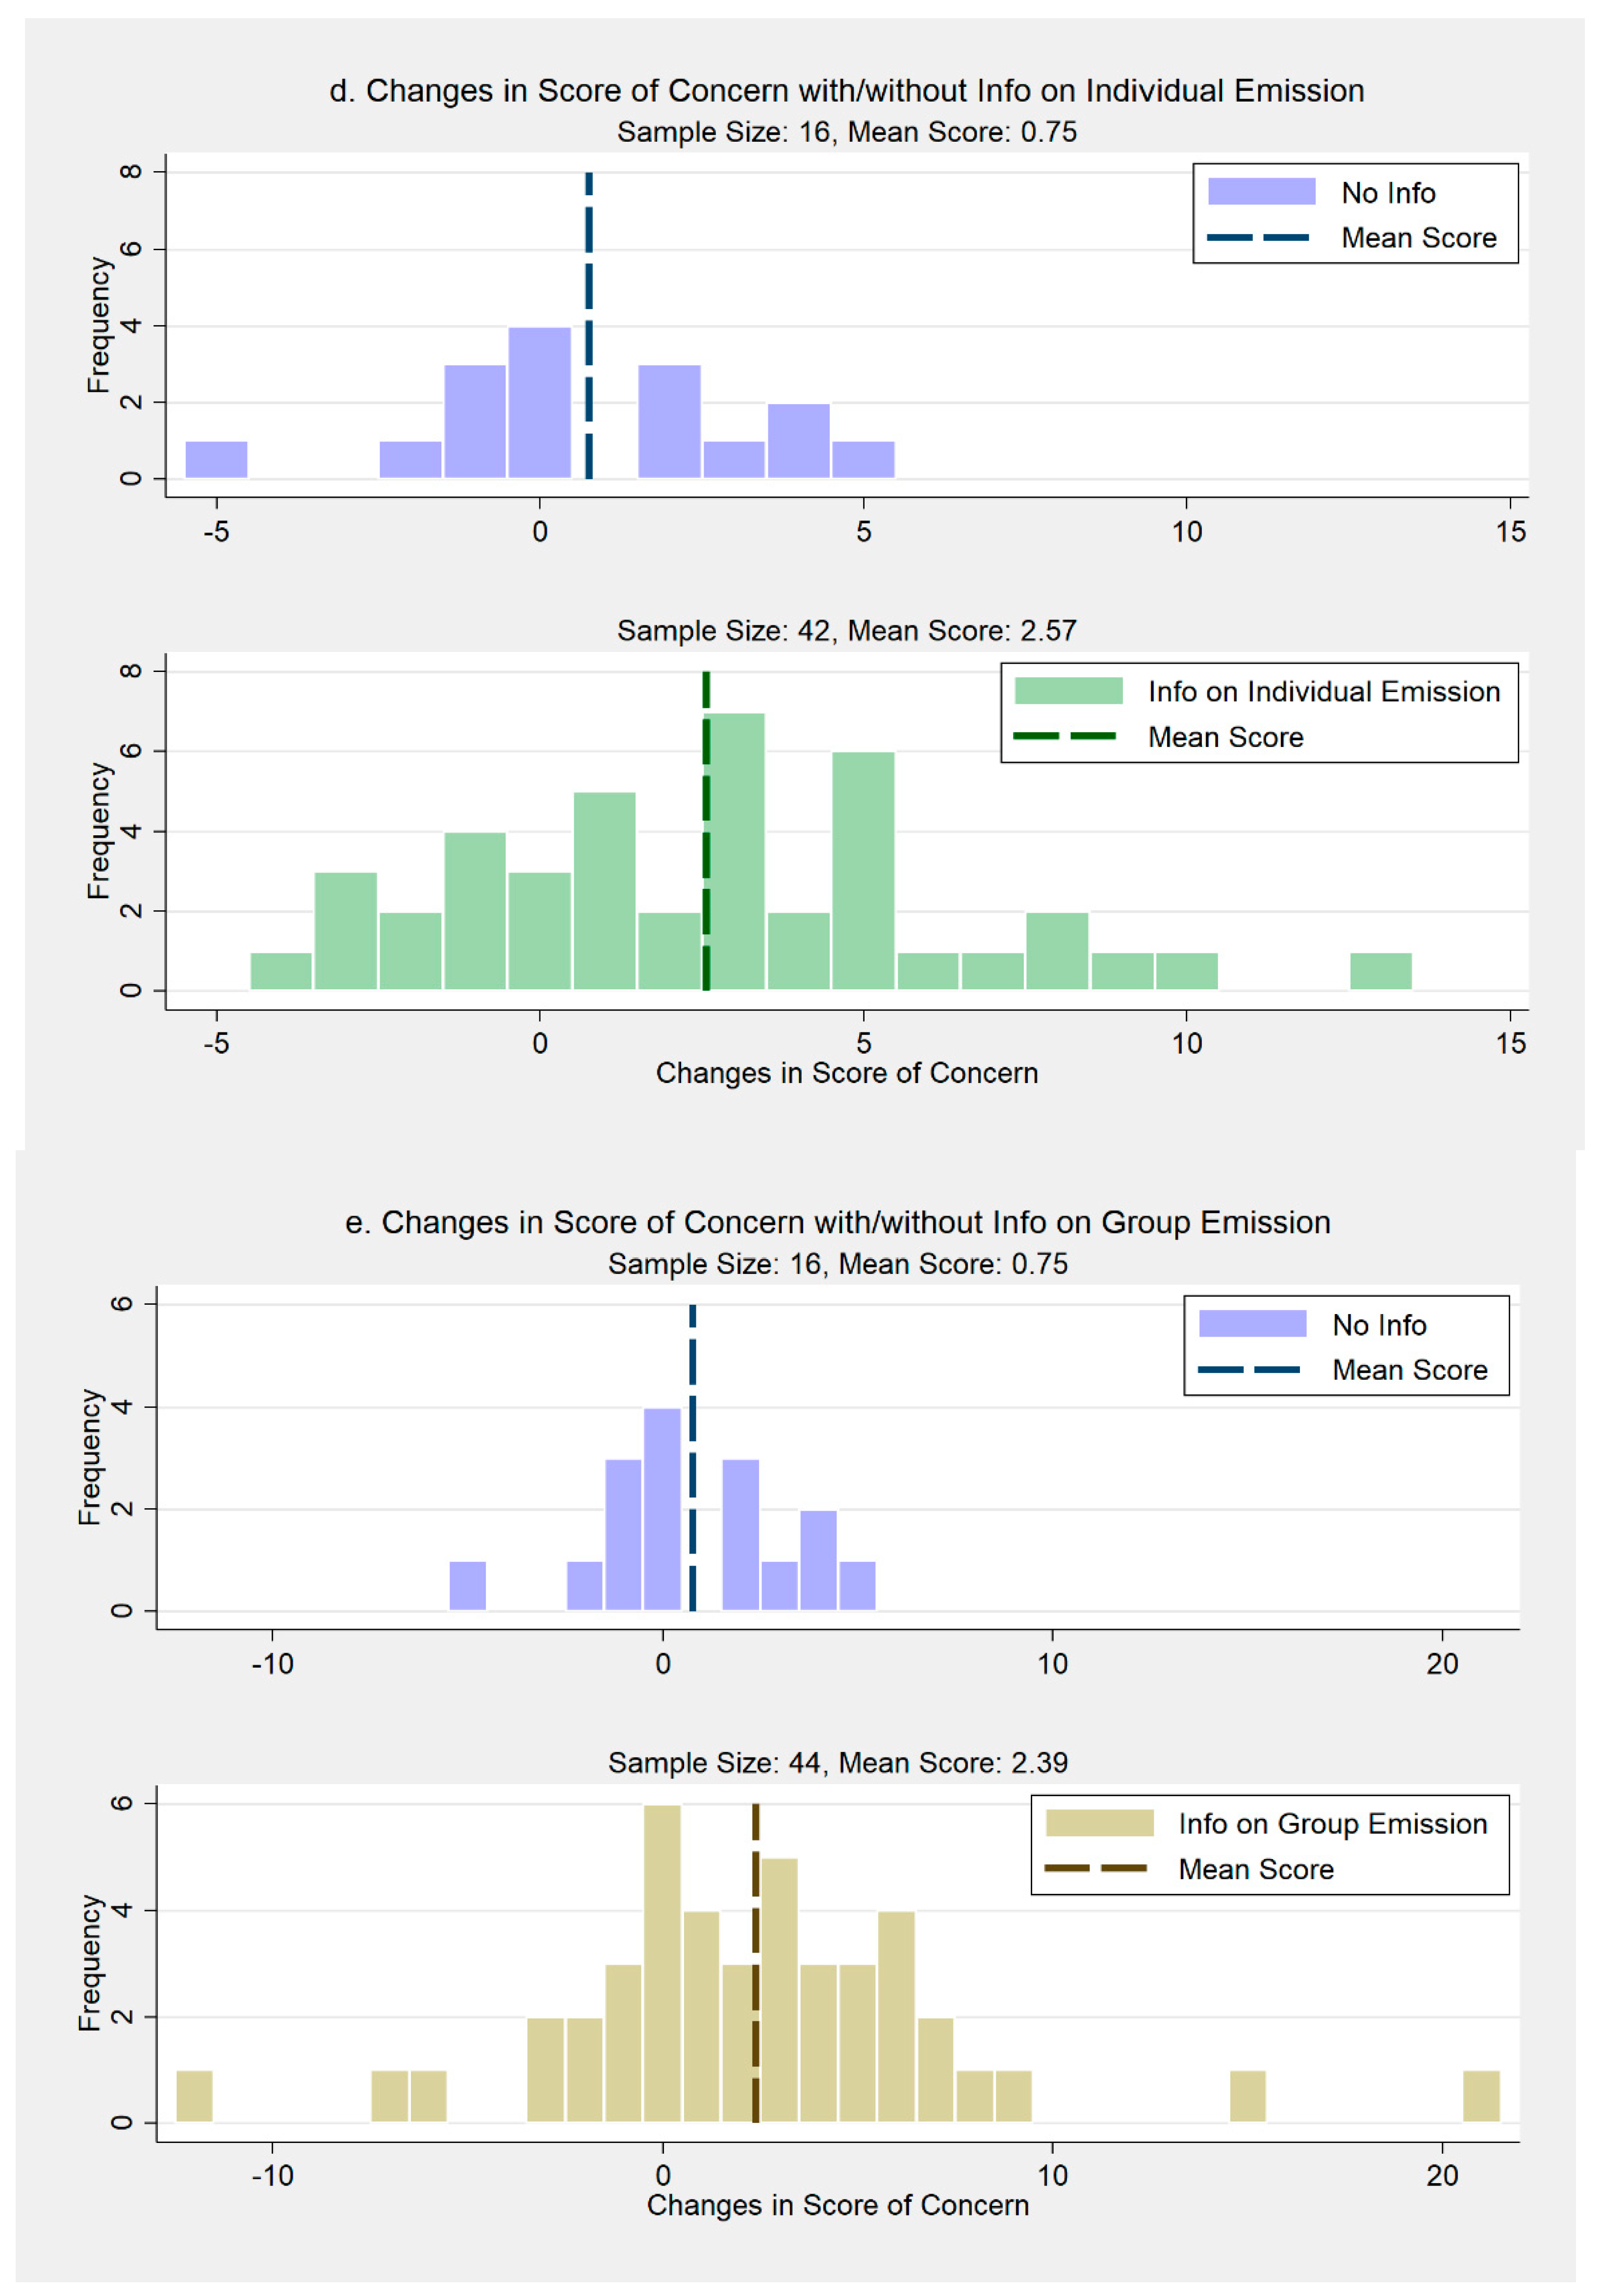
3. Results
4. Discussion
4.1. Importance of Information about Individual CO2 Emissions
4.2. Effects of Threshold Value on Individual Environmental Friendliness
4.3. Impact of Communication on Environmental Friendliness
4.4. Income Effects on Environmental Friendliness
4.5. Other Significant Findings
5. Conclusions
Author Contributions
Funding
Institutional Review Board Statement
Informed Consent Statement
Data Availability Statement
Acknowledgments
Conflicts of Interest
Appendix A


| Questions | Reference | |
|---|---|---|
| VAL-1 | All living organisms on earth have rights as equally as human beings have. (地球上のすべての生物は人間と同等の権利を持っている) | [29,45] |
| VAL-2 | Human beings need to address environmental issues (e.g., climate change) for future generations. (将来世代のために、気候変動問題などの環境問題解決に取組む必要がある) | - |
| VAL-3 | All countries including developed and developing ones should equally make efforts to mitigate climate change. (先進国・発展途上国を問わず、全ての国が気候変動問題軽減の努力を等しく行うべきである) | - |
| VAL-4 | Everyone should obey rules such as international agreements, treaties, laws, and regulations. (国際合意・条約・法律・規制などのルールは守るべきである) | - |
| VAL-5 | Governments should aim to solve environmental issues. (政府は環境問題解決に取組むべきである) | - |
| VAL-6 | Firms should aim to solve environmental issues. (企業は環境問題解決に取組むべきである) | - |
| VAL-7 | Human beings have the right to fully use natural resources and the environment. (人間には、天然資源・自然環境を好きなだけ利活用する権利がある) | [29,43] |
| VAL-8 | You should be responsible for nature, considering the impact of what you are doing on nature and the environment. (環境に影響を与える行為を含め、自分が行うことはすべて、自然に対して責任を負わなければならない) | [45] |
| VAL-9 | Extinction of a species is inevitable. (絶滅する生物種がいても仕方ない) | [19] |
| VAL-10 | Lifestyles should be changed for solving climate change issues. (気候変動問題を解決するためには自分たちのライフスタイルを変えなければならない) | - |
| Response alternatives | 1: agree, 2: slightly agree, 3: neither agree nor disagree, 4: slightly disagree, 5: disagree |
| Questions | Reference | |
|---|---|---|
| BEL-1 | Environmentalists exaggerate environmental issues to justify their activities. (環境活動家は自らの活動を正当化するために環境問題を大げさに語っている) | - |
| BEL-2 | Human beings can change natural environments, but they cannot perfectly control them. (人間は自然環境を変える能力を持っているが、思い通りに自然をコントロールすることはできない) | - |
| BEL-3 | Rules are beneficial to everyone. (ルールは全ての人に恩恵を与えるものだ) | [49] |
| BEL-4 | Conditions of the environment on earth improve without any help. (何も手を打たなくても、地球環境全体の状態は改善する) | - |
| BEL-5 | Human populations and the level of human economic activity are approaching the limit above which human beings cannot live on earth. (人口や経済活動水準は、人間が地球に住める限界レベルに近づいている) | [43] |
| BEL-6 | Climate change is caused by CO2 emissions due to human economic activities. (人間の経済活動によって排出された二酸化炭素が気候変動の原因である) | - |
| BEL-7 | When human beings change nature, they often face dreadful outcomes. (人間が自然に手を加えると、しばしば悲惨な結果となる) | [43] |
| BEL-8 | Technological innovation can solve environmental issues. (技術革新によって環境問題は解決するはずだ) | - |
| BEL-9 | Resilience of nature is strong enough to endure environmental burdens generated by human economic activities. (自然界の回復力は、わたしたちの経済活動が生み出す環境負荷に対応できるほど十分強い) | [43] |
| BEL-10 | My action affects neighbors’ and friends’ happiness. (私の行動は、周囲の人や知人の幸福度に影響を与える) | [49] |
| Response alternatives | 1: agree, 2: slightly agree, 3: neither agree nor disagree, 4: slightly disagree, 5: disagree |
| Questions | Reference | |
|---|---|---|
| CTL-1 | You can reduce the amount of electricity consumption, being careful about it. (自分の心がけ次第で、電気使用量を減らすことができる) | - |
| CTL-2 | My actions do not affect solutions of environmental issues that happen at the place far away from my place. (私の行動が地球の遠く離れたどこかの環境問題解決に影響を与えることはないと思う) | [29] |
| CTL-3 | Changes in your lifestyle could solve climate change issues. (自分たちがライフスタイルを変えれば、気候変動問題の解決に貢献できる) | - |
| CTL-4 | Cooperative actions could solve climate change issues. (みんなが協力すれば、気候変動問題は解決に向かう) | - |
| CTL-5 | It will be difficult to get others’ cooperation even if you take pro-environmental actions. (自分一人が環境配慮的行動を取っても、多くの人に協力してもらうことは難しい) | - |
| CTL-6 | It is unlikely to conserve biodiversity because of uncertainty in nature. (自然では予測できないことが起きるので、生物多様性を保全できる可能性は低い) | - |
| CTL-7 | It is too costly to address environmental issues. (環境問題の解決にはお金がかかりすぎるので、実際には取り組むことができない) | - |
| CTL-8 | Refusing plastic bags is not enough to contribute to solving global environmental issues. (レジ袋をもらわないくらいでは、地球環境問題の解決に貢献できないと思う) | - |
| CTL-9 | It is almost impossible to reduce the amount of emissions of greenhouse gases, considering the current economic activities. (現在の経済活動を考えると、温室効果ガスの排出削減はほとんどできないと思う) | - |
| CTL-10 | An individual can do nothing to solve global environmental issues. (グローバル環境問題解決に対して個人で取り組めることはないと思う) | - |
| Response alternatives | 1: agree, 2: slightly agree, 3: neither agree nor disagree, 4: slightly disagree, 5: disagree |
| Questions | Reference | |
|---|---|---|
| CON-1 | (……) services and goods that generate as small amount of CO2 emissions as possible. (CO2をできるだけ排出しないサービス・商品) | - |
| CON-2 | (……) the amount of my electricity consumption. (消費電力) | - |
| CON-3 | (……) electric, hydrogen, and hybrid vehicles. (電気自動車・水素自動車・ハイブリッド車) | - |
| CON-4 | (……) renewable energy. (再生可能エネルギー) | - |
| CON-5 | (……) the amount of plastic rubbish (e.g., plastic bottles). (プラスチック(ペットボトルを含む)ごみの量) | - |
| CON-6 | (……) risk of landslides and floods caused by a storm or/and a blizzard. (暴風雨・暴風雪による土砂災害・水害リスク) | - |
| CON-7 | (……) new technologies to reduce the amount of CO2 emissions and the development of such technologies. (新しい二酸化炭素排出削減の技術・その技術の開発) | - |
| CON-8 | (……) governmental actions on climate change issues. (政府の気候変動問題解決に向けた取り組み) | - |
| CON-9 | (……) environmental issues caused by CO2 emissions: such as Antarctic ice loss, degradation of coral reefs, biodiversity loss, sea level rise, oceanic acidification, and heatwave. (二酸化炭素排出を原因とする環境問題(南極の氷の減少・サンゴ礁の劣化・生物多様性の損失・海水面上昇・海洋酸性化・熱波など)) | - |
| CON-10 | (……) the amount of my gas consumption. (ガスの使用量) | - |
| Response Alternatives | 1: I am interested in, 2: I am slightly interested in, 3: I am neither interested in nor not interested in, 4: I am little interested in, 5: I am not interested in |
| Questions | Reference | |
|---|---|---|
| ATT-1 | I sometimes consider the causes and effects of issues that human beings have faced. (私は人類の直面する問題の原因やその影響について考えることがある) | [49] |
| ATT-2 | I do not want the temperature in summer to rise more. (これ以上夏場の気温が上昇したら困る) | - |
| ATT-3 | I disapprove of government’s inaction on environmental issues. (政府が環境問題に対処していないと、腹立たしい) | [44] |
| ATT-4 | I am sad about a decrease in beaches due to sea level rise. (海面上昇によって浜辺が減ると悲しい) | - |
| ATT-5 | I like spending time in nature. (自然と触れ合うのが好きだ) | - |
| ATT-6 | I feel sad when I see trees cut down. (伐採された森林を見ると悲しくなる) | [47] |
| ATT-7 | It is inevitable that typhoons often come. (台風がたくさん来るのは仕方がない) | - |
| ATT-8 | I feel sad, seeing the Earth polluted by human activities. (我々の活動によって地球が汚染されていると思うと、悲しい) | - |
| ATT-9 | I have affinity with variety of animals and plants. (多様な動植物に対し親近感を覚える) | [48] |
| ATT-10 | I am willing to change my lifestyle for environmental conservation and preservation. (環境保全・環境保護のためなら、自らのライフスタイルを変えてもよい) | - |
| Response alternatives | 1: similar to my idea, 2: slightly similar to my idea, 3: neither similar nor different 4: slightly different, 5: different |
| Questions | Reference | |
|---|---|---|
| INT-1 | I want to share the necessity of pro-environmental behavior with my family and friends. (環境配慮行動の必要性について、家族や友人と共有したい) | [46] |
| INT-2 | I will make efforts in order not to consume fossil fuels in near future. (近い将来、化石燃料を使わないように努力するつもりだ) | - |
| INT-3 | I want to preserve and conserve nature for future generations. (将来世代のために環境保全・環境保護を行いたい) | - |
| INT-4 | I want to buy products and services produced by environmentally friendly firms. (環境配慮行動を取っている企業の製品・サービスを購入したい) | - |
| INT-5 | I am going to change my lifestyle for environmental preservation and conservation. (環境保全・環境保護のために、自らのライフスタイルを変えていくつもりだ) | - |
| INT-6 | I will avoid using automobiles and airplanes if possible. (できるだけ自動車や飛行機を利用しないつもりだ) | [44] |
| INT-7 | I want to avoid producing rubbish as much as possible. (できるだけごみを出したくない) | - |
| INT-8 | I want to participate in an environmental organization. (環境保全・保護活動団体に所属・参加したい) | - |
| INT-9 | I am willing to donate my daily wage once a year for supporting environmental conservation. (環境保全・保護運動を支援するために、年に1回、1日分の収入を寄付してもよい) | [44] |
| INT-10 | I will meet the standard of emissions when it is set. (排出基準が設定されたら、その排出基準を守るつもりだ) | - |
| Response alternatives | 1: similar to my idea. 2: slightly similar to my idea, 3: neither similar nor different, 4: slightly different, 5: different |
| Questions | Reference | |
|---|---|---|
| BEH-1 | I move by bicycle or/and on foot as frequently as possible. (できるだけ自転車・徒歩で移動する) | [44] |
| BEH-2 | I buy goods that have low food mileage. (商品を購入する際、フードマイレージの低い商品を購入する) | [44] |
| BEH-3 | I do not buy beverages in a plastic bottle. (ペットボトル飲料は購入しない) | - |
| BEH-4 | I use a heater in winter because I do not want to wear winter clothes in a room. (冬場、部屋で防寒着を着なくて済むように暖房をつける) | [46] |
| BEH-5 | I avoid buying plastic products. (プラスチック製品の購入を避ける) | - |
| BEH-6 | I use public transportation in urban areas. (都市部では、公共交通を利用する) | [46] |
| BEH-7 | I point out other’s environmentally unfriendly behavior. (他人の非環境配慮的行動を指摘する) | [46,47] |
| BEH-8 | I avoid producing rubbish as much as possible. (できるだけごみを出さない) | [49] |
| BEH-9 | I turn off lights when I leave a room. (部屋を出るとき、電気を消している) | [49] |
| BEH-10 | I get plastic or/and paper bags when I go shopping. (買い物の際、ビニール袋・紙袋をもらう) | - |
| Response alternatives | 1: similar to my behavior. 2: slightly similar to my behavior, 3: neither similar nor different, 4: slightly different, 5: different |
| Independent Variables | Definition | Mean | S.D. |
|---|---|---|---|
| individual emissions | Dummy variable (=1 if information on the amount of individual emissions was provided) | 0.41 | 0.49 |
| group emissions | Dummy variable (=1 if information on the amount of group emissions was provided) | 0.43 | 0.50 |
| individual threshold | Dummy variable (=1 if information on the individual threshold of the emissions was provided) | 0.21 | 0.41 |
| group threshold | Dummy variable (=1 if information on the group threshold of the emissions was provided) | 0.24 | 0.43 |
| communication | Dummy variable (=1 if participant had an opportunity of communication) | 0.49 | 0.50 |
| female | Dummy variable (=1 for female) | 0.43 | 0.50 |
| environmental study | Dummy variable (=1 if participant takes a class of environment) | 0.23 | 0.42 |
| economics | Dummy variable (=1 if participant majors economics) | 0.82 | 0.38 |
| monthly income | 2.5: if monthly income is 0–50,000 yen 7.5: 50,000–100,000 yen 12.5: 100,000–150,000 yen 17.5: 150,000–200,000 yen 27.5: 250,000–300,000 yen 52.5: more than 500,000 yen | 8.87 | 8.85 |
References
- Pachauri, R.K.; Allen, M.R.; Barros, V.R.; Broome, J.; Cramer, W.; Christ, R.; Church, J.A.; Clarke, L.; Dahe, Q.; Dasgupta, P.; et al. Climate change 2014: Synthesis report. In Contribution of Working Groups I, II and III to the Fifth Assessment Report of the Intergovernmental Panel on Climate Change; IPCC: Geneva, Switzerland, 2014. [Google Scholar]
- Masson-Delmotte, T.W.V.; Zhai, P.; Pörtner, H.O.; Roberts, D.; Skea, J.; Shukla, P.R.; Pirani, A.; Moufouma-Okia, W.; Péan, C.; Pidcock, R.; et al. IPCC, 2018: Summary for policymakers. In Global Warming of 1.5 C. An IPCC Special Report on the Impacts of Global Warming of 1.5 C above Pre-Industrial Levels and Related Global Greenhouse Gas Emission Pathways, in the Context of Strengthening the Global; IPCC: Geneva, Switzerland, 2018. [Google Scholar]
- Rockström, J.; Steffen, W.; Noone, K.; Persson, Å.; Chapin, F.S., III; Lambin, E.; Lenton, T.M.; Scheffer, M.; Folke, C.; Schellnhuber, H.J.; et al. Planetary boundaries: Exploring the safe operating space for humanity. Ecol. Soc. 2009, 14, 32. [Google Scholar] [CrossRef]
- Steffen, W.; Richardson, K.; Rockström, J.; Cornell, S.E.; Fetzer, I.; Bennett, E.M.; Biggs, R.; Carpenter, S.R.; De Vries, W.; De Wit, C.A.; et al. Planetary boundaries: Guiding human development on a changing planet. Science 2015, 347, 1259855. [Google Scholar] [CrossRef]
- Mathias, J.D.; Anderies, J.M.; Janssen, M.A. On our rapidly shrinking capacity to comply with the planetary boundaries on climate change. Sci. Rep. UK 2017, 7, 42061. [Google Scholar] [CrossRef]
- Hardin, G. The tragedy of the commons. Science 1968, 162, 1243–1248. [Google Scholar] [CrossRef]
- Hardin, G. Extensions of “the tragedy of the commons”. Science 1998, 280, 682–683. [Google Scholar] [CrossRef]
- Paavola, J. Governing atmospheric sinks: The architecture of entitlements in the global commons. Int. J. Commons 2008, 2. [Google Scholar] [CrossRef][Green Version]
- Cole, D.H. Advantages of a polycentric approach to climate change policy. Nat. Clim. Chang. 2015, 5, 114–118. [Google Scholar] [CrossRef]
- Dietz, T.; Ostrom, E.; Stern, P.C. The struggle to govern the commons. Science 2003, 302, 1907–1912. [Google Scholar] [CrossRef] [PubMed]
- Ostrom, E. Polycentric systems for coping with collective action and global environmental change. Glob. Environ. Chang. 2010, 20, 550–557. [Google Scholar] [CrossRef]
- Dumay, J.; Guthrie, J.; Farneti, F. GRI sustainability reporting guidelines for public and third sector organizations: A critical review. Public Manag. Rev. 2010, 12, 531–548. [Google Scholar] [CrossRef]
- López, M.V.; Garcia, A.; Rodriguez, L. Sustainable development and corporate performance: A study based on the Dow Jones sustainability index. J. Bus. Ethics 2007, 75, 285–300. [Google Scholar] [CrossRef]
- Montiel, I. Corporate social responsibility and corporate sustainability: Separate pasts, common futures. Organ. Environ. 2008, 21, 245–269. [Google Scholar] [CrossRef]
- Rondinelli, D.; Vastag, G. Panacea, common sense, or just a label?: The value of ISO 14001 environmental management systems. Eur. Manag. J. 2000, 18, 499–510. [Google Scholar] [CrossRef]
- Wilson, J.; Tyedmers, P.; Spinney, J.E. An exploration of the relationship between socioeconomic and well-being variables and household greenhouse gas emissions. J. Ind. Ecol. 2013, 17, 880–891. [Google Scholar] [CrossRef]
- Steinhorst, J.; Klöckner, C.A.; Matthies, E. Saving electricity—For the money or the environment? Risks of limiting pro-environmental spillover when using monetary framing. J. Environ. Psychol. 2015, 43, 125–135. [Google Scholar] [CrossRef]
- Steinhorst, J.; Klöckner, C.A. Effects of monetary versus environmental information framing: Implications for long-term pro-environmental behavior and intrinsic motivation. Environ. Behav. 2018, 50, 997–1031. [Google Scholar] [CrossRef]
- Dorsch, M.J.; Flachsland, C. A polycentric approach to global climate governance. Glob. Environ. Polit. 2017, 17, 45–64. [Google Scholar] [CrossRef]
- Allcott, H. Social norms and energy conservation. J. Public Econ. 2011, 95, 1082–1095. [Google Scholar] [CrossRef]
- Daziano, R.A.; Waygood, E.O.D.; Patterson, Z.; Kohlová, M.B. Increasing the influence of CO2 emissions information on car purchase. J. Clean Prod. 2017, 164, 861–871. [Google Scholar] [CrossRef]
- Schultz, P.W.; Nolan, J.M.; Cialdini, R.B.; Goldstein, N.J.; Griskevicius, V. The constructive, destructive, and reconstructive power of social norms. Psychol. Sci. 2007, 18, 429–434. [Google Scholar] [CrossRef]
- Schultz, P.W.; Messina, A.; Tronu, G.; Limas, E.F.; Gupta, R.; Estrada, M. Personalized normative feedback and the moderating role of personal norms: A field experiment to reduce residential water consumption. Environ. Behav. 2016, 48, 686–710. [Google Scholar] [CrossRef]
- Delmas, M.A.; Lessem, N. Saving power to conserve your reputation? The effectiveness of private versus public information. J. Environ. Econ. Manag. 2014, 67, 353–370. [Google Scholar] [CrossRef]
- Ferraro, P.J.; Price, M.K. Using nonpecuniary strategies to influence behavior: Evidence from a large-scale field experiment. Rev. Econ. Stat. 2013, 95, 64–73. [Google Scholar] [CrossRef]
- Andor, M.A.; Fels, K.M. Behavioral economics and energy conservation—A systematic review of non-price interventions and their causal effects. Ecol. Econ. 2018, 148, 178–210. [Google Scholar] [CrossRef]
- Ajzen, I. The theory of planned behavior. Organ. Behav. Hum. Dec. 1991, 50, 179–211. [Google Scholar] [CrossRef]
- Matthies, E.; Selge, S.; Klöckner, C.A. The role of parental behaviour for the development of behaviour specific environmental norms–The example of recycling and re-use behaviour. J. Environ. Psychol. 2012, 32, 277–284. [Google Scholar] [CrossRef]
- Nisbet, E.K.; Zelenski, J.M.; Murphy, S.A. The nature relatedness scale: Linking individuals’ connection with nature to environmental concern and behavior. Environ. Behav. 2009, 41, 715–740. [Google Scholar] [CrossRef]
- Schultz, P.W.; Zelezny, L. Values as predictors of environmental attitudes: Evidence for consistency across 14 countries. J. Environ. Psychol. 1999, 19, 255–265. [Google Scholar] [CrossRef]
- Stern, P.C.; Dietz, T.; Abel, T.; Guagnano, G.A.; Kalof, L. A value-belief-norm theory of support for social movements: The case of environmentalism. Hum. Ecol. Rev. 1999, 6, 81–97. [Google Scholar]
- Carrus, G.; Passafaro, P.; Bonnes, M. Emotions, habits and rational choices in ecological behaviours: The case of recycling and use of public transportation. J. Environ. Psychol. 2008, 28, 51–62. [Google Scholar] [CrossRef]
- Donald, I.J.; Cooper, S.R.; Conchie, S.M. An extended theory of planned behaviour model of the psychological factors affecting commuters’ transport mode use. J. Environ. Psychol. 2014, 40, 39–48. [Google Scholar] [CrossRef]
- Mannetti, L.; Pierro, A.; Livi, S. Recycling: Planned and self-expressive behaviour. J. Environ. Psychol. 2004, 24, 227–236. [Google Scholar] [CrossRef]
- Andrews, T.M.; Delton, A.W.; Kline, R. High-risk high-reward investments to mitigate climate change. Nat. Clim. Chang. 2018, 8, 890–894. [Google Scholar] [CrossRef]
- Fehr, E.; Gachter, S. Cooperation and punishment in public goods experiments. Am. Econ. Rev. 2000, 90, 980–994. [Google Scholar] [CrossRef]
- Jacquet, J.; Hagel, K.; Hauert, C.; Marotzke, J.; Röhl, T.; Milinski, M. Intra-and intergenerational discounting in the climate game. Nat. Clim. Chang. 2013, 3, 1025–1028. [Google Scholar] [CrossRef]
- Krieg, J.; Samek, A. When charities compete: A laboratory experiment with simultaneous public goods. J. Behav. Exp. Econ. 2017, 66, 40–57. [Google Scholar] [CrossRef]
- Smith, V.L.; Suchanek, G.L.; Williams, A.W. Bubbles, crashes, and endogenous expectations in experimental spot asset markets. Econometrica 1988, 56, 1119–1151. [Google Scholar] [CrossRef]
- Davis, D.D.; Holt, C.A. Experimental Economics; Princeton University Press: Princeton, NJ, USA, 1993; pp. 179–212. [Google Scholar]
- Japanese Ministry of the Environment. The List of Emission Factors in Japan (Written in Japanese). Available online: https://ghg-santeikohyo.env.go.jp/files/calc/itiran2019.pdf (accessed on 5 May 2020).
- Japan Sanitary Equipment Industry Association. Emission Factor of Water (Written in Japanese). Available online: https://www.sanitary-net.com/trend/standard/standard-co2.html (accessed on 5 May 2020).
- Dunlap, R.E.; Van Liere, K.D.; Mertig, A.G.; Jones, R.E. New trends in measuring environmental attitudes: Measuring endorsement of the new ecological paradigm: A revised NEP scale. J. Soc. Issues 2000, 56, 425–442. [Google Scholar] [CrossRef]
- Fraj, E.; Martinez, E. Ecological consumer behaviour: An empirical analysis. Int. J. Consum. Stud. 2007, 31, 26–33. [Google Scholar] [CrossRef]
- Kaiser, F.; Ranney, M.; Hartig, T.; Bowler, P. Ecological behavior, environmental attitude, and feelings of responsibility for the environment. Eur. Psychol. 1999, 4, 59–74. [Google Scholar] [CrossRef]
- Kaiser, F.; Wolfing, S.; Fuhrer, U. Environmental attitude and ecological behavior. J. Environ. Psychol. 1999, 19, 1–19. [Google Scholar] [CrossRef]
- Kaiser, F.G.; Hartig, T.; Brügger, A.; Duvier, C. Environmental protection and nature as distinct attitudinal objects: An application of the Campbell paradigm. Environ. Behav. 2013, 45, 369–398. [Google Scholar] [CrossRef]
- Mayer, F.S.; Frantz, C.M. The connectedness to nature scale: A measure of individuals’ feeling in community with nature. J. Environ. Psychol. 2004, 24, 503–515. [Google Scholar] [CrossRef]
- Uitto, A.; Boeve-de Pauw, J.; Saloranta, S. Participatory school experiences as facilitators for adolescents’ ecological behavior. J. Environ. Psychol. 2015, 43, 55–65. [Google Scholar] [CrossRef]
- Japanese Ministry of the Environment. Submission of Japan’s Intended Nationally Determined Contribution (INDC). Available online: https://www.env.go.jp/en/earth/cc/2030indc_mat01.pdf (accessed on 5 May 2020).
- GIO (Greenhouse Gas Inventory Office of Japan). Available online: http://www-gio.nies.go.jp/aboutghg/nir/2020/NIR-JPN-2020-v3.0_GIOweb.pdf (accessed on 5 May 2020).
- Beattie, G. Psychological effectiveness of carbon labelling. Nat. Clim. Chang. 2012, 2, 214–217. [Google Scholar] [CrossRef]
- Camilleri, A.R.; Larrick, R.P.; Hossain, S.; Patino-Echeverri, D. Consumers underestimate the emissions associated with food but are aided by labels. Nat. Clim. Chang. 2019, 9, 53–58. [Google Scholar] [CrossRef]
- Vandenbergh, M.P.; Dietz, T.; Stern, P.C. Time to try carbon labelling. Nat. Clim. Chang. 2011, 1, 4–6. [Google Scholar] [CrossRef]
- Frank, R.H.; Gilovich, T.; Regan, D.T. Does studying economics inhibit cooperation? J. Econ. Perspect. 1993, 7, 159–171. [Google Scholar] [CrossRef]
- Konow, J. Can ethics instruction make economics students more pro-social? J. Econ. Behav. Organ. 2019, 166, 724–734. [Google Scholar] [CrossRef]
- Marwell, G.; Ames, R.E. Economists free ride, does anyone else. J. Public Econ. 1981, 15, 295–310. [Google Scholar] [CrossRef]
- Lee, K. Gender differences in Hong Kong adolescent consumers’ green purchasing behavior. J. Consum. Mark. 2009, 26, 87–96. [Google Scholar] [CrossRef]
- Meyers-Levy, J.; Loken, B. Revisiting gender differences: What we know and what lies ahead. J. Consum. Psychol. 2015, 25, 129–149. [Google Scholar] [CrossRef]
- Zelezny, L.C.; Chua, P.P.; Aldrich, C. New ways of thinking about environmentalism: Elaborating on gender differences in environmentalism. J. Soc. Issues 2000, 56, 443–457. [Google Scholar] [CrossRef]
- Kary, A.; Newell, B.R.; Hayes, B.K. What makes for compelling science? Evidential diversity in the evaluation of scientific arguments. Glob. Environ. Chang. 2018, 49, 186–196. [Google Scholar] [CrossRef]
- Van der Werff, E.; Steg, L.; Keizer, K. It is a moral issue: The relationship between environmental self-identity, obligation-based intrinsic motivation and pro-environmental behaviour. Glob. Environ. Chang. 2013, 23, 1258–1265. [Google Scholar] [CrossRef]
- Yang, J.; Zhou, Q.; Liu, X.; Liu, M.; Qu, S.; Bi, J. Biased perception misguided by affect: How does emotional experience lead to incorrect judgments about environmental quality? Glob. Environ. Chang. 2018, 53, 104–113. [Google Scholar] [CrossRef]


| Treatment | |||||
|---|---|---|---|---|---|
| Group | N | Communication | Individual Emissions | Group Emissions | Threshold |
| 1 | 9 | ||||
| 2 | 7 | ✓ | |||
| 3 | 11 | ✓ | |||
| 4 | 10 | ✓ | ✓ | ||
| 5 | 10 | ✓ | ✓ | ||
| 6 | 11 | ✓ | ✓ | ✓ | |
| 7 | 10 | ✓ | |||
| 8 | 10 | ✓ | ✓ | ||
| 9 | 12 | ✓ | ✓ | ||
| 10 | 12 | ✓ | ✓ | ✓ | |
| Test | Description of Two Groups | N | Comparison Groups |
|---|---|---|---|
| 1 | with communication | 52 | 2, 4, 6, 8, and 10 |
| without communication | 50 | 1, 3, 5, 7, and 9 | |
| 2 | without any information about emissions | 16 | 1 and 2 |
| with information about individual emissions | 42 | 3, 4, 5, and 6 | |
| 3 | without any information about emissions | 16 | 1 and 2 |
| with information about group emissions | 44 | 7, 8, 9, and 10 | |
| 4 | information about individual emissions | 42 | 3, 4, 5, and 6 |
| information about group emissions | 44 | 7, 8, 9, and 10 | |
| 5 | information about individual emissions with their threshold value | 21 | 5 and 6 |
| information about individual emissions without their threshold value | 21 | 3 and 4 | |
| 6 | information about group emissions with their threshold value | 24 | 9 and10 |
| information about group emissions without their threshold value | 20 | 7 and 8 |
| VAL-3 | VAL-5 | VAL-6 | VAL-8 | VAL-9 | |
|---|---|---|---|---|---|
| individual emissions | 1.082 * | 0.567 | −0.624 | −0.107 | 0.0188 |
| (0.640) | (0.737) | (0.734) | (0.633) | (0.625) | |
| group emissions | 0.572 | −0.210 | −0.253 | 1.105 * | −0.457 |
| (0.650) | (0.756) | (0.721) | (0.654) | (0.650) | |
| individual emissions X individual threshold | −0.619 | −1.147 | −1.334 * | −0.131 | −0.133 |
| (0.584) | (0.699) | (0.702) | (0.576) | (0.623) | |
| group emissions X group threshold | −0.170 | 0.0514 | −1.241 * | −0.132 | 0.668 |
| (0.589) | (0.697) | (0.694) | (0.584) | (0.620) | |
| communication | −0.195 | −0.322 | 0.523 | 0.861 ** | 0.176 |
| (0.379) | (0.449) | (0.439) | (0.386) | (0.390) | |
| female | 0.485 | 0.365 | 0.185 | −0.554 | −0.442 |
| (0.411) | (0.468) | (0.448) | (0.394) | (0.407) | |
| economics | −1.115 ** | −0.632 | −0.443 | −0.350 | 1.015 * |
| (0.546) | (0.625) | (0.596) | (0.496) | (0.532) | |
| monthly income | 0.0272 | 0.0404 * | −0.0320 | 0.0327 | −0.0226 |
| (0.0196) | (0.0226) | (0.0267) | (0.0202) | (0.0205) | |
| environmental study | 0.173 | 1.257 ** | 0.251 | −0.160 | 0.143 |
| (0.457) | (0.541) | (0.510) | (0.444) | (0.469) | |
| Observations | 102 | 102 | 102 | 102 | 102 |
| Pseudo R-squared | 0.0273 | 0.0640 | 0.0702 | 0.0690 | 0.0253 |
| Log-likelihood | −140.1 | −82.18 | −92.22 | −126.8 | −126.5 |
| BEL-2 | BEL-3 | BEL-6 | BEL-7 | BEL-8 | BEL-9 | BEL-10 | |
|---|---|---|---|---|---|---|---|
| individual emissions | 1.863 ** | 1.287 * | −1.047 | −0.376 | −0.474 | 0.642 | 1.532 ** |
| (0.763) | (0.662) | (0.703) | (0.617) | (0.614) | (0.629) | (0.631) | |
| group emissions | 0.845 | 1.636 ** | −0.384 | −0.381 | −0.248 | −0.223 | −0.450 |
| (0.725) | (0.658) | (0.674) | (0.636) | (0.582) | (0.624) | (0.662) | |
| individual emissions X individual threshold | −0.686 | −0.367 | 1.125 * | −0.119 | 0.384 | −1.537 ** | 0.109 |
| (0.720) | (0.594) | (0.640) | (0.569) | (0.595) | (0.621) | (0.582) | |
| group emissions X group threshold | 1.508 ** | −0.283 | 0.763 | 0.104 | 0.382 | −0.383 | 1.348 ** |
| (0.722) | (0.572) | (0.610) | (0.582) | (0.547) | (0.586) | (0.639) | |
| communication | 0.0141 | 0.692 * | 0.799 * | −0.269 | 0.0384 | −0.0782 | −0.236 |
| (0.434) | (0.383) | (0.408) | (0.376) | (0.366) | (0.380) | (0.384) | |
| female | 0.00476 | −0.202 | 0.158 | 0.989 ** | −0.251 | 0.00183 | 0.521 |
| (0.459) | (0.394) | (0.423) | (0.402) | (0.387) | (0.401) | (0.402) | |
| economics | −0.371 | −0.787 | −0.946 * | −0.947 * | −0.0983 | −0.0830 | −1.025 * |
| (0.585) | (0.516) | (0.559) | (0.545) | (0.504) | (0.524) | (0.553) | |
| monthly income | 0.0229 | 0.0425 ** | 0.0367 * | −0.00365 | 0.0172 | −0.0245 | 0.0115 |
| (0.0254) | (0.0202) | (0.0213) | (0.0207) | (0.0219) | (0.0206) | (0.0201) | |
| environmental study | 0.275 | −0.353 | −0.104 | 0.667 | −1.066 ** | −0.301 | 0.318 |
| (0.537) | (0.445) | (0.472) | (0.473) | (0.445) | (0.455) | (0.449) | |
| Observations | 102 | 102 | 102 | 102 | 102 | 102 | 102 |
| Pseudo R-squared | 0.0675 | 0.0607 | 0.0650 | 0.0360 | 0.0278 | 0.0396 | 0.0669 |
| Log-likelihood | −93.74 | −137 | −110.9 | −138.7 | −145.5 | −124.4 | −129.9 |
| CTL-1 | CTL-3 | CTL-4 | CTL-6 | CTL-7 | CTL-8 | CTL-9 | |
|---|---|---|---|---|---|---|---|
| individual emissions | 0.391 | 0.884 | 0.103 | −0.449 | 0.805 | −0.269 | −1.077 * |
| (0.715) | (0.624) | (0.613) | (0.625) | (0.620) | (0.642) | (0.618) | |
| group emissions | −0.539 | 1.095 * | 0.122 | −1.296 ** | −0.223 | 0.343 | −1.160 * |
| (0.704) | (0.637) | (0.627) | (0.639) | (0.628) | (0.661) | (0.630) | |
| individual emissions X individual threshold | 0.000582 | −0.598 | −0.651 | −0.688 | −0.664 | 0.374 | 0.426 |
| (0.646) | (0.596) | (0.555) | (0.568) | (0.574) | (0.570) | (0.572) | |
| group emissions X group threshold | 0.951 | −0.149 | −0.0122 | 0.918 | −0.423 | −0.0380 | −0.368 |
| (0.665) | (0.592) | (0.569) | (0.570) | (0.604) | (0.608) | (0.574) | |
| communication | 0.700 | 0.382 | −0.412 | −0.127 | −0.290 | 0.141 | −0.173 |
| (0.435) | (0.382) | (0.366) | (0.369) | (0.378) | (0.385) | (0.374) | |
| female | 0.381 | −0.286 | 0.476 | −0.140 | 0.929 ** | 0.831 ** | 0.795 ** |
| (0.449) | (0.393) | (0.384) | (0.388) | (0.399) | (0.409) | (0.392) | |
| economics | −0.124 | −0.447 | −0.651 | 0.471 | −1.497 *** | −0.399 | 0.116 |
| (0.584) | (0.556) | (0.541) | (0.480) | (0.578) | (0.562) | (0.504) | |
| monthly income | 0.0389 * | 0.0259 | 0.0348 * | −0.0385 * | −0.00683 | −0.0252 | −0.00257 |
| (0.0219) | (0.0202) | (0.0193) | (0.0212) | (0.0216) | (0.0200) | (0.0205) | |
| environmental study | −0.171 | 0.350 | 0.137 | 0.0106 | 0.607 | −0.237 | −0.295 |
| (0.509) | (0.475) | (0.437) | (0.426) | (0.470) | (0.460) | (0.453) | |
| Observations | 102 | 102 | 102 | 102 | 102 | 102 | 102 |
| Pseudo R-squared | 0.0489 | 0.0284 | 0.0261 | 0.0311 | 0.0578 | 0.0245 | 0.0415 |
| Log-likelihood | −97.13 | −137.4 | −151.9 | −155.1 | −143.5 | −146.3 | −152.7 |
| CON-1 | CON-2 | CON-3 | CON-4 | CON-5 | CON-7 | |
|---|---|---|---|---|---|---|
| individual emissions | 0.718 | 0.357 | 0.544 | 0.649 | 0.874 | −0.931 |
| (0.623) | (0.612) | (0.722) | (0.666) | (0.617) | (0.670) | |
| group emissions | 0.619 | 0.216 | 1.125 | 0.896 | 1.134 * | −0.627 |
| (0.645) | (0.623) | (0.741) | (0.683) | (0.630) | (0.687) | |
| individual emissions X individual threshold | −0.0510 | −0.0937 | 0.260 | −0.185 | 0.538 | 1.121 * |
| (0.573) | (0.574) | (0.620) | (0.617) | (0.569) | (0.666) | |
| group emissions X group threshold | 0.144 | −0.318 | −0.817 | −1.255 ** | −0.294 | −0.584 |
| (0.618) | (0.581) | (0.625) | (0.622) | (0.582) | (0.631) | |
| communication | 0.170 | 0.469 | 0.464 | −0.0872 | −0.343 | 0.248 |
| (0.387) | (0.380) | (0.413) | (0.395) | (0.369) | (0.406) | |
| female | 0.845 ** | −0.731 * | 0.735 * | −0.156 | −0.378 | 0.454 |
| (0.409) | (0.392) | (0.435) | (0.421) | (0.382) | (0.426) | |
| economics | −0.123 | 1.723 *** | −0.0678 | 0.466 | 0.715 | −0.755 |
| (0.529) | (0.602) | (0.569) | (0.556) | (0.506) | (0.561) | |
| monthly income | 0.0281 | −0.0122 | 0.0137 | 0.0247 | −0.00994 | −0.00992 |
| (0.0195) | (0.0232) | (0.0228) | (0.0240) | (0.0224) | (0.0211) | |
| environmental study | 0.0580 | −0.0718 | 0.217 | −0.135 | −0.155 | 0.986 ** |
| (0.460) | (0.454) | (0.498) | (0.475) | (0.457) | (0.485) | |
| Observations | 102 | 102 | 102 | 102 | 102 | 102 |
| Pseudo R-squared | 0.0318 | 0.0431 | 0.0365 | 0.0312 | 0.0334 | 0.0571 |
| Log-likelihood | −123.8 | −136.5 | −107.3 | −113.2 | −152.9 | −111.3 |
| ATT-2 | ATT-3 | ATT-4 | ATT-7 | ATT-8 | ATT-10 | |
|---|---|---|---|---|---|---|
| individual emissions | 0.00187 | 1.316 ** | 0.460 | 1.529 ** | 2.624 *** | −0.170 |
| (1.072) | (0.653) | (0.623) | (0.698) | (0.716) | (0.656) | |
| group emissions | −2.391 ** | 0.539 | −0.312 | 1.516 ** | 1.774 ** | −0.0778 |
| (1.071) | (0.641) | (0.627) | (0.704) | (0.711) | (0.681) | |
| individual emissions X individual threshold | −1.006 | −0.129 | −0.789 | −1.762 *** | −1.201 * | 0.484 |
| (1.039) | (0.607) | (0.577) | (0.682) | (0.614) | (0.615) | |
| group emissions X group threshold | 1.922 ** | 0.336 | 0.527 | −0.786 | 0.284 | 1.297 ** |
| (0.970) | (0.605) | (0.594) | (0.620) | (0.619) | (0.631) | |
| communication | −0.00584 | 0.439 | −0.437 | −0.249 | −0.336 | 0.136 |
| (0.599) | (0.391) | (0.380) | (0.405) | (0.397) | (0.395) | |
| female | 0.0622 | −0.278 | −0.740 * | −0.441 | 0.398 | −0.245 |
| (0.624) | (0.402) | (0.399) | (0.426) | (0.421) | (0.413) | |
| economics | 0.0880 | 0.801 | 1.011 * | −0.248 | −1.419 *** | 0.475 |
| (0.811) | (0.548) | (0.526) | (0.542) | (0.549) | (0.527) | |
| monthly income | 0.0545 * | 0.00357 | 0.0206 | −0.0179 | −0.00933 | −0.00292 |
| (0.0309) | (0.0208) | (0.0199) | (0.0229) | (0.0245) | (0.0225) | |
| environmental study | −0.180 | 0.402 | −0.711 | −0.436 | 0.780 | 0.00852 |
| (0.730) | (0.462) | (0.454) | (0.516) | (0.486) | (0.475) | |
| Observations | 102 | 102 | 102 | 102 | 102 | 102 |
| Pseudo R-squared | 0.101 | 0.0415 | 0.0442 | 0.0671 | 0.0940 | 0.0335 |
| Log-likelihood | −51.97 | −121.3 | −137.3 | −106.3 | −106.8 | −117.4 |
| INT-4 | INT-5 | INT-6 | INT-9 | INT-10 | |
|---|---|---|---|---|---|
| individual emissions | 1.527 ** | −0.173 | −0.162 | 0.417 | 0.546 |
| (0.667) | (0.673) | (0.624) | (0.626) | (0.640) | |
| group emissions | 0.668 | 0.671 | −0.450 | −0.0193 | −0.416 |
| (0.685) | (0.651) | (0.661) | (0.683) | (0.646) | |
| individual emissions X individual threshold | −0.767 | 0.488 | −0.367 | −0.310 | −0.660 |
| (0.577) | (0.639) | (0.543) | (0.592) | (0.601) | |
| group emissions X group threshold | 0.306 | −0.219 | 0.694 | −0.655 | −0.705 |
| (0.623) | (0.588) | (0.595) | (0.633) | (0.585) | |
| communication | −0.0626 | 0.537 | −0.316 | −0.503 | −0.813 ** |
| (0.391) | (0.399) | (0.373) | (0.392) | (0.396) | |
| female | 0.912 ** | −0.109 | −0.217 | 0.437 | 0.530 |
| (0.422) | (0.415) | (0.389) | (0.409) | (0.407) | |
| economics | 0.632 | −0.384 | −0.565 | 0.238 | −1.182 ** |
| (0.561) | (0.510) | (0.530) | (0.518) | (0.553) | |
| monthly income | 0.0180 | 0.0460 ** | 0.0547 ** | 0.0562 ** | −0.00366 |
| (0.0207) | (0.0201) | (0.0241) | (0.0228) | (0.0214) | |
| environmental study | 0.498 | 0.224 | −0.271 | −0.0286 | 1.142 ** |
| (0.471) | (0.466) | (0.442) | (0.481) | (0.474) | |
| Observations | 102 | 102 | 102 | 102 | 102 |
| Pseudo R-squared | 0.0558 | 0.0396 | 0.0346 | 0.0548 | 0.0711 |
| Log-likelihood | −127.6 | −114.3 | −146 | −113 | −127.5 |
| BEH-1 | BEH-2 | BEH-3 | BEH-5 | BEH-6 | BEH-7 | BEH-10 | |
|---|---|---|---|---|---|---|---|
| individual emissions | −0.684 | 0.376 | 0.174 | −0.0643 | 2.201 ** | 0.463 | 0.285 |
| (0.661) | (0.672) | (0.737) | (0.630) | (0.870) | (0.648) | (0.628) | |
| group emissions | −1.705 ** | 0.168 | 0.573 | 0.525 | 0.959 | 0.709 | 0.957 |
| (0.710) | (0.654) | (0.744) | (0.652) | (0.804) | (0.624) | (0.632) | |
| individual emissions X individual threshold | −0.169 | −1.063 | 0.771 | 0.251 | −1.635 ** | −0.499 | 0.185 |
| (0.652) | (0.651) | (0.666) | (0.605) | (0.801) | (0.603) | (0.598) | |
| group emissions X group threshold | 1.295 * | −0.977 | −0.258 | 0.270 | −0.816 | −0.743 | −0.852 |
| (0.668) | (0.623) | (0.673) | (0.589) | (0.719) | (0.592) | (0.588) | |
| communication | 0.793 * | −0.737 * | −0.902 ** | −0.0517 | −0.954 * | −0.672 * | 0.00289 |
| (0.425) | (0.415) | (0.453) | (0.385) | (0.499) | (0.391) | (0.382) | |
| female | −0.0329 | −0.762 * | 0.533 | 0.550 | −0.581 | −0.188 | −0.204 |
| (0.438) | (0.429) | (0.459) | (0.407) | (0.507) | (0.396) | (0.395) | |
| economics | −0.0943 | 0.106 | −0.00320 | −0.403 | −0.983 | −0.283 | 0.896 * |
| (0.538) | (0.561) | (0.580) | (0.549) | (0.683) | (0.563) | (0.514) | |
| monthly income | 0.0467 ** | 0.0149 | −0.00921 | 0.0278 | −0.0259 | 0.00851 | −0.0682 *** |
| (0.0203) | (0.0199) | (0.0261) | (0.0232) | (0.0238) | (0.0214) | (0.0227) | |
| environmental study | 0.338 | 1.002 ** | −0.107 | −1.202 ** | 1.075 * | 0.366 | 0.450 |
| (0.519) | (0.489) | (0.570) | (0.496) | (0.585) | (0.469) | (0.477) | |
| Observations | 102 | 102 | 102 | 102 | 102 | 102 | 102 |
| Pseudo R-squared | 0.0647 | 0.0588 | 0.0382 | 0.0454 | 0.111 | 0.0221 | 0.0523 |
| Log-likelihood | −116.6 | −120.8 | −87.79 | −126.9 | −77.23 | −137.9 | −144.7 |
Publisher’s Note: MDPI stays neutral with regard to jurisdictional claims in published maps and institutional affiliations. |
© 2021 by the authors. Licensee MDPI, Basel, Switzerland. This article is an open access article distributed under the terms and conditions of the Creative Commons Attribution (CC BY) license (http://creativecommons.org/licenses/by/4.0/).
Share and Cite
Yamashita, H.; Kyoi, S.; Mori, K. Does Information about Personal Emissions of Carbon Dioxide Improve Individual Environmental Friendliness? A Survey Experiment. Sustainability 2021, 13, 2284. https://doi.org/10.3390/su13042284
Yamashita H, Kyoi S, Mori K. Does Information about Personal Emissions of Carbon Dioxide Improve Individual Environmental Friendliness? A Survey Experiment. Sustainability. 2021; 13(4):2284. https://doi.org/10.3390/su13042284
Chicago/Turabian StyleYamashita, Hideki, Shinsuke Kyoi, and Koichiro Mori. 2021. "Does Information about Personal Emissions of Carbon Dioxide Improve Individual Environmental Friendliness? A Survey Experiment" Sustainability 13, no. 4: 2284. https://doi.org/10.3390/su13042284
APA StyleYamashita, H., Kyoi, S., & Mori, K. (2021). Does Information about Personal Emissions of Carbon Dioxide Improve Individual Environmental Friendliness? A Survey Experiment. Sustainability, 13(4), 2284. https://doi.org/10.3390/su13042284