
Lean–Green Improvement Opportunities for Sustainable Manufacturing Using Water Telemetry in Agri-Food Industry

 ,
,  , , and
Abstract
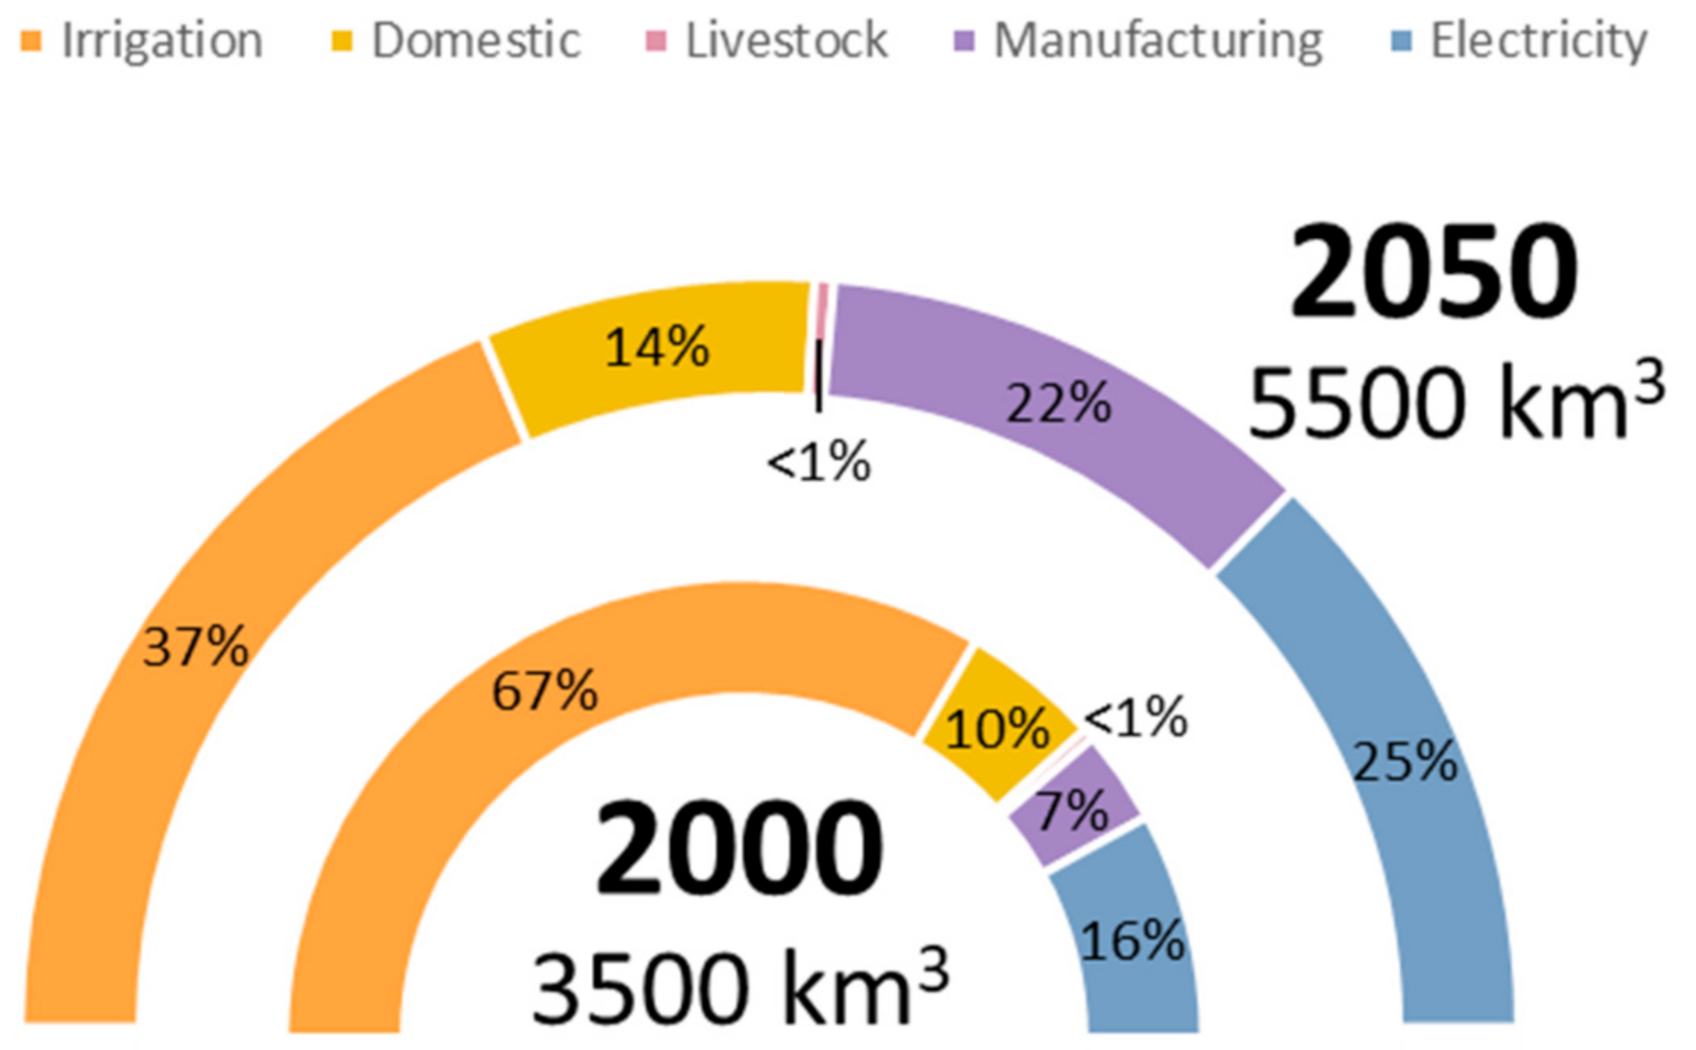
1. Introduction
2. Literature Review
- Real-time measurements. This will make it possible to simultaneously study the operation process with water consumption telemetry. Operations managers will be able to analyse consumption in detail to identify new improvement process opportunities that had not yet been detected due to lack of detailed information.
- Real estimations of economic and environmental impacts. Having this detailed information on the water consumption of different activities in a process will make it possible not only to identify these improvement opportunities but also to estimate their profitability from an operational and environmental point of view, since the impact of the improvements would be attributed to the real water consumption of each process and activity.
- Lean–green strategies. Only by having this detailed information associated with the most critical activities of the process (the ones that consume the most water) will it be possible to propose new integrated lean–green strategies based on responsible and sustainable water management.
3. Materials and Methods
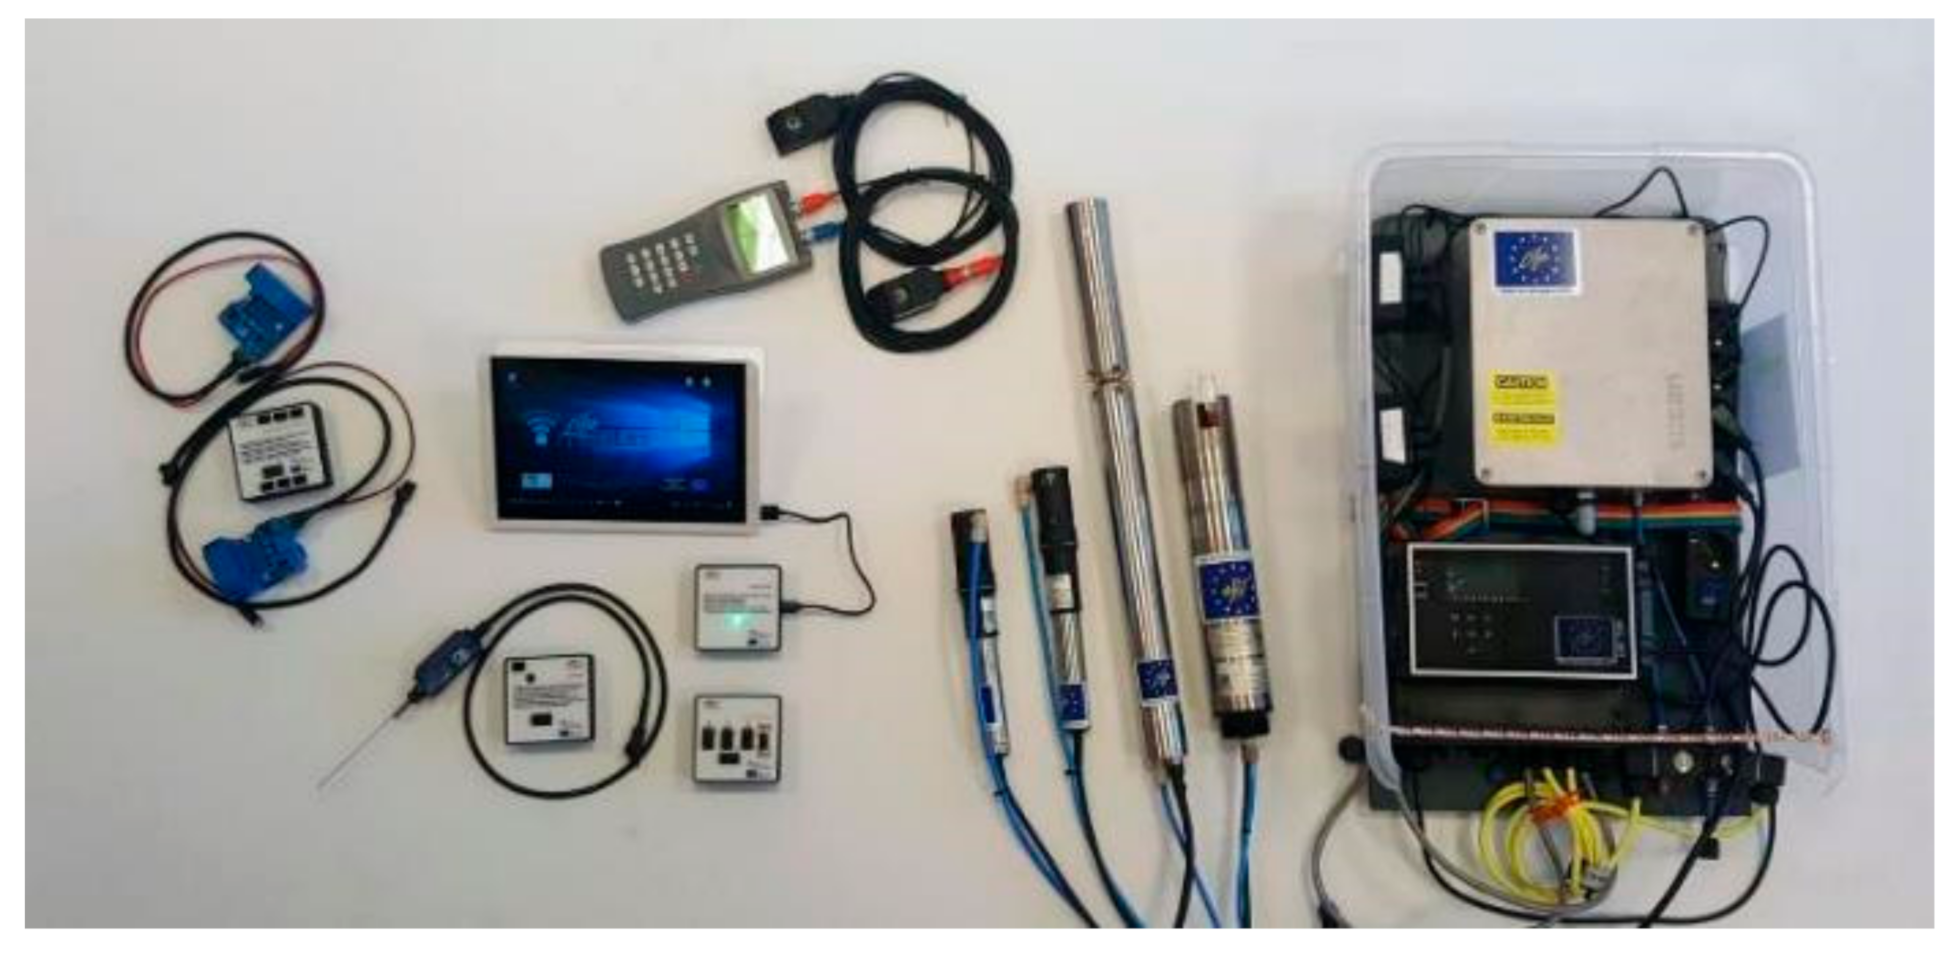
- In this paper, we would like to compare this data with real-time monitoring records. In gathering the real-time data, we used a device for monitoring called Plug&Lean [33], which was adapted [38] in a research project (Figure 2) to integrate a set of commercial probes, sensors and commercial devices (such as ultrasonic flow meters or transducers). The device is easy to install and it allows real-time monitoring at low energy consumption.
4. Case Studies
4.1. Importance of Telemetry: Cooling Process Case Study
4.2. Sequential Lean–Green Strategy
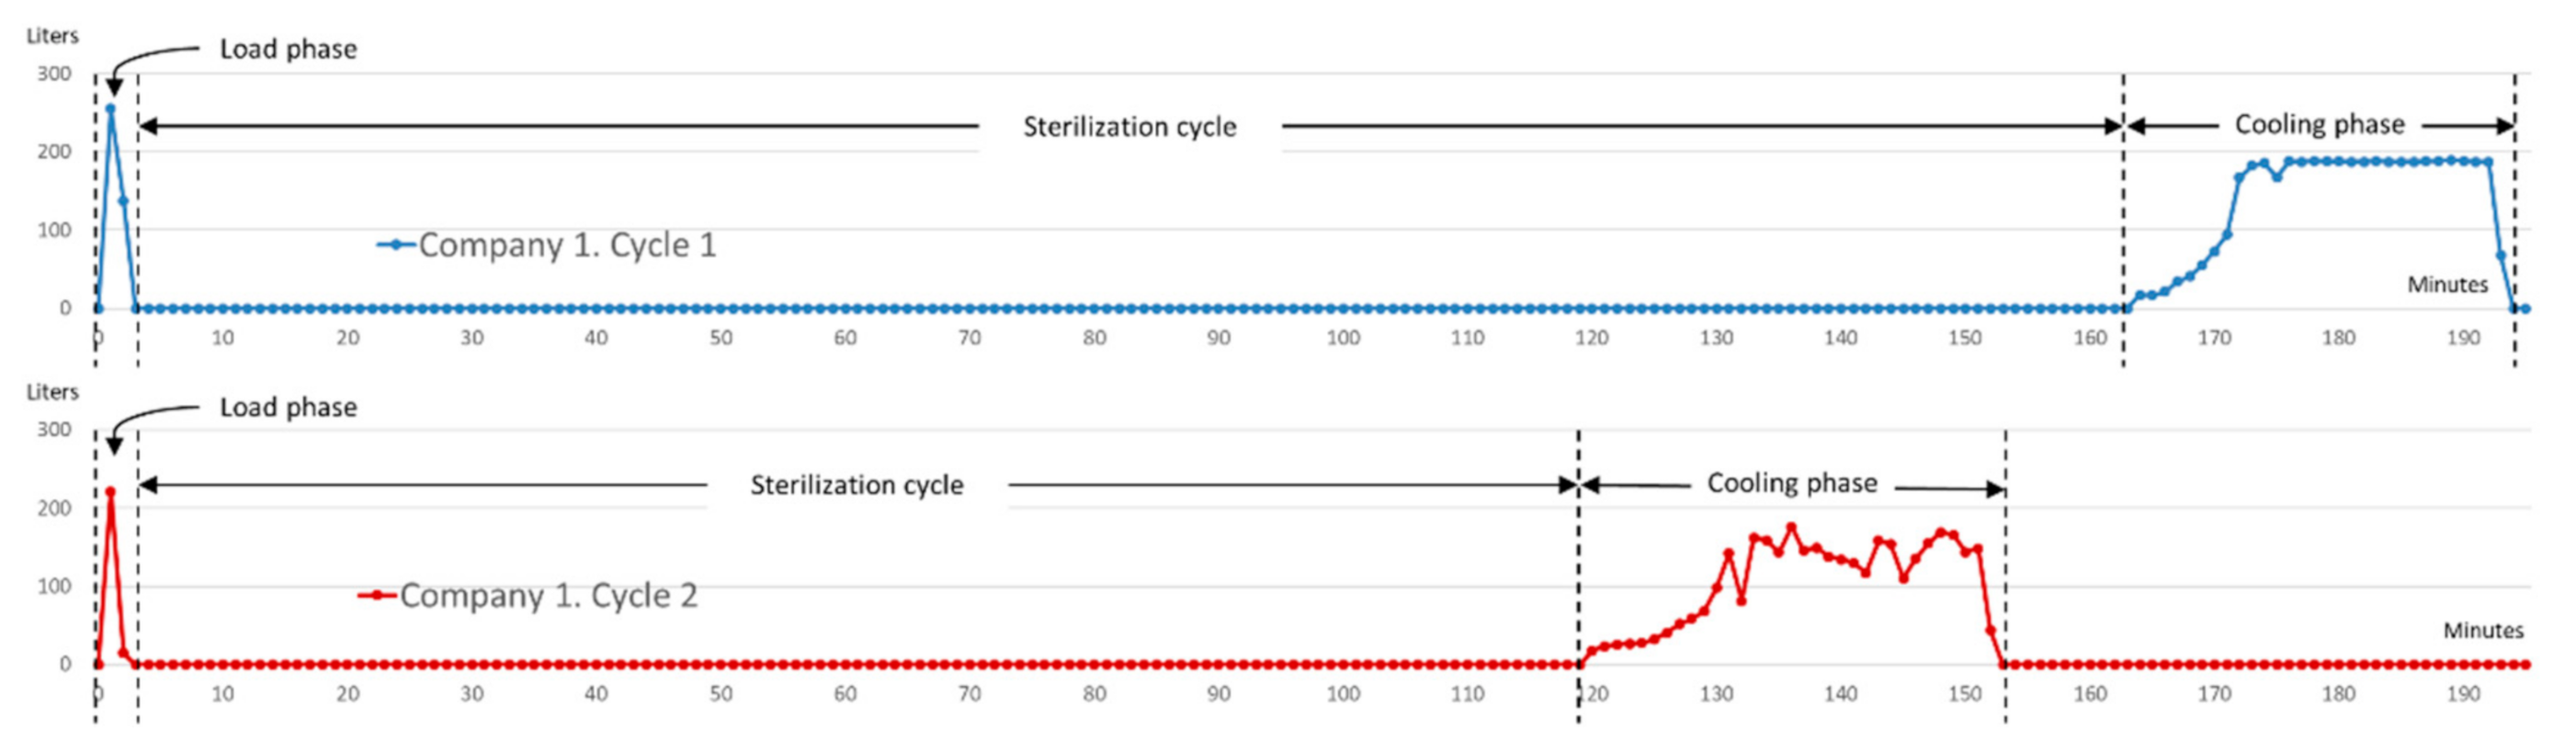
4.2.1. Autoclave Case Study I
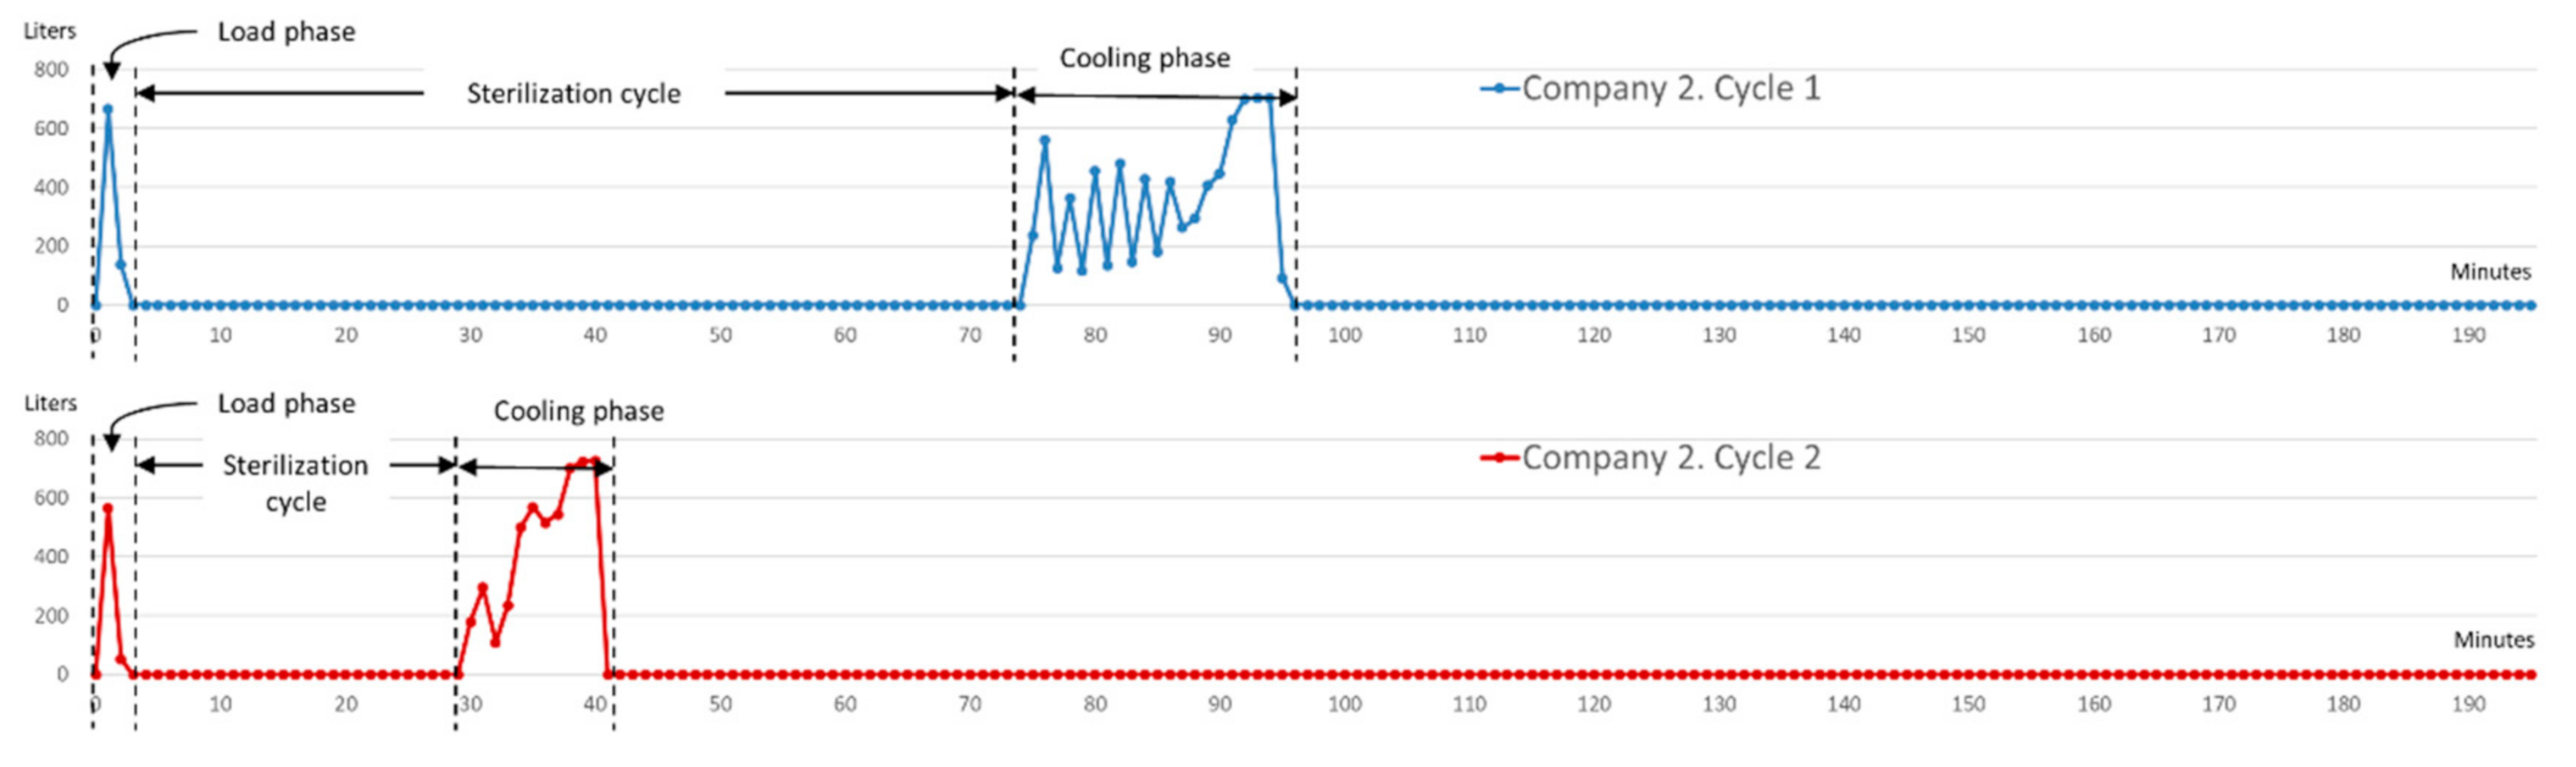
4.2.2. Autoclave Case Study II
4.3. Simultaneous Lean–Green Strategy
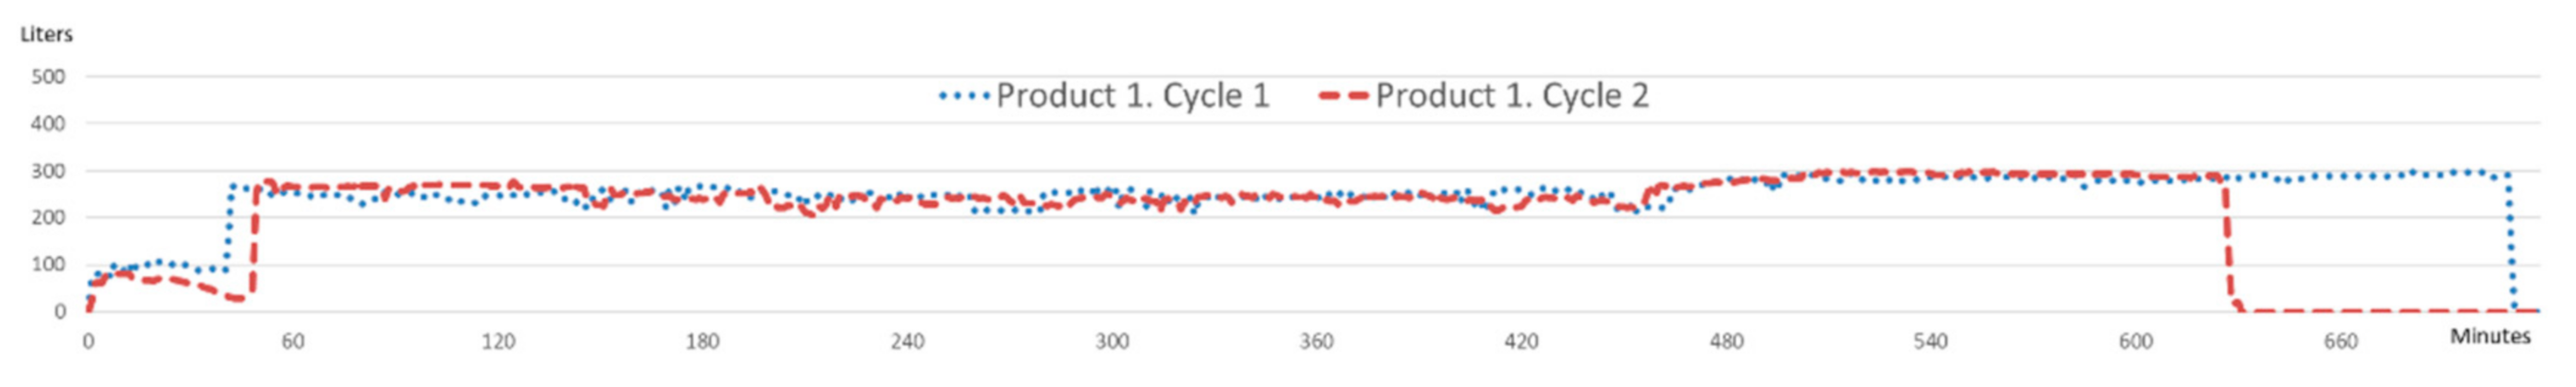
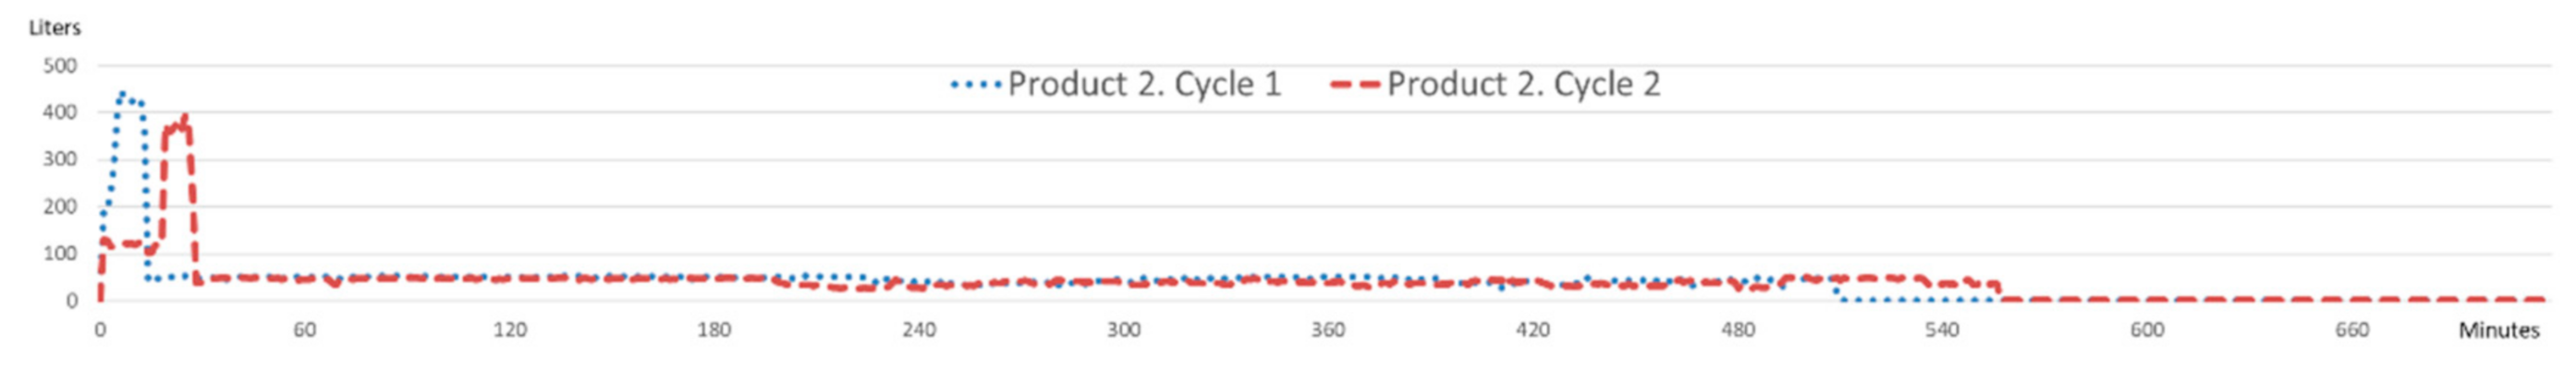
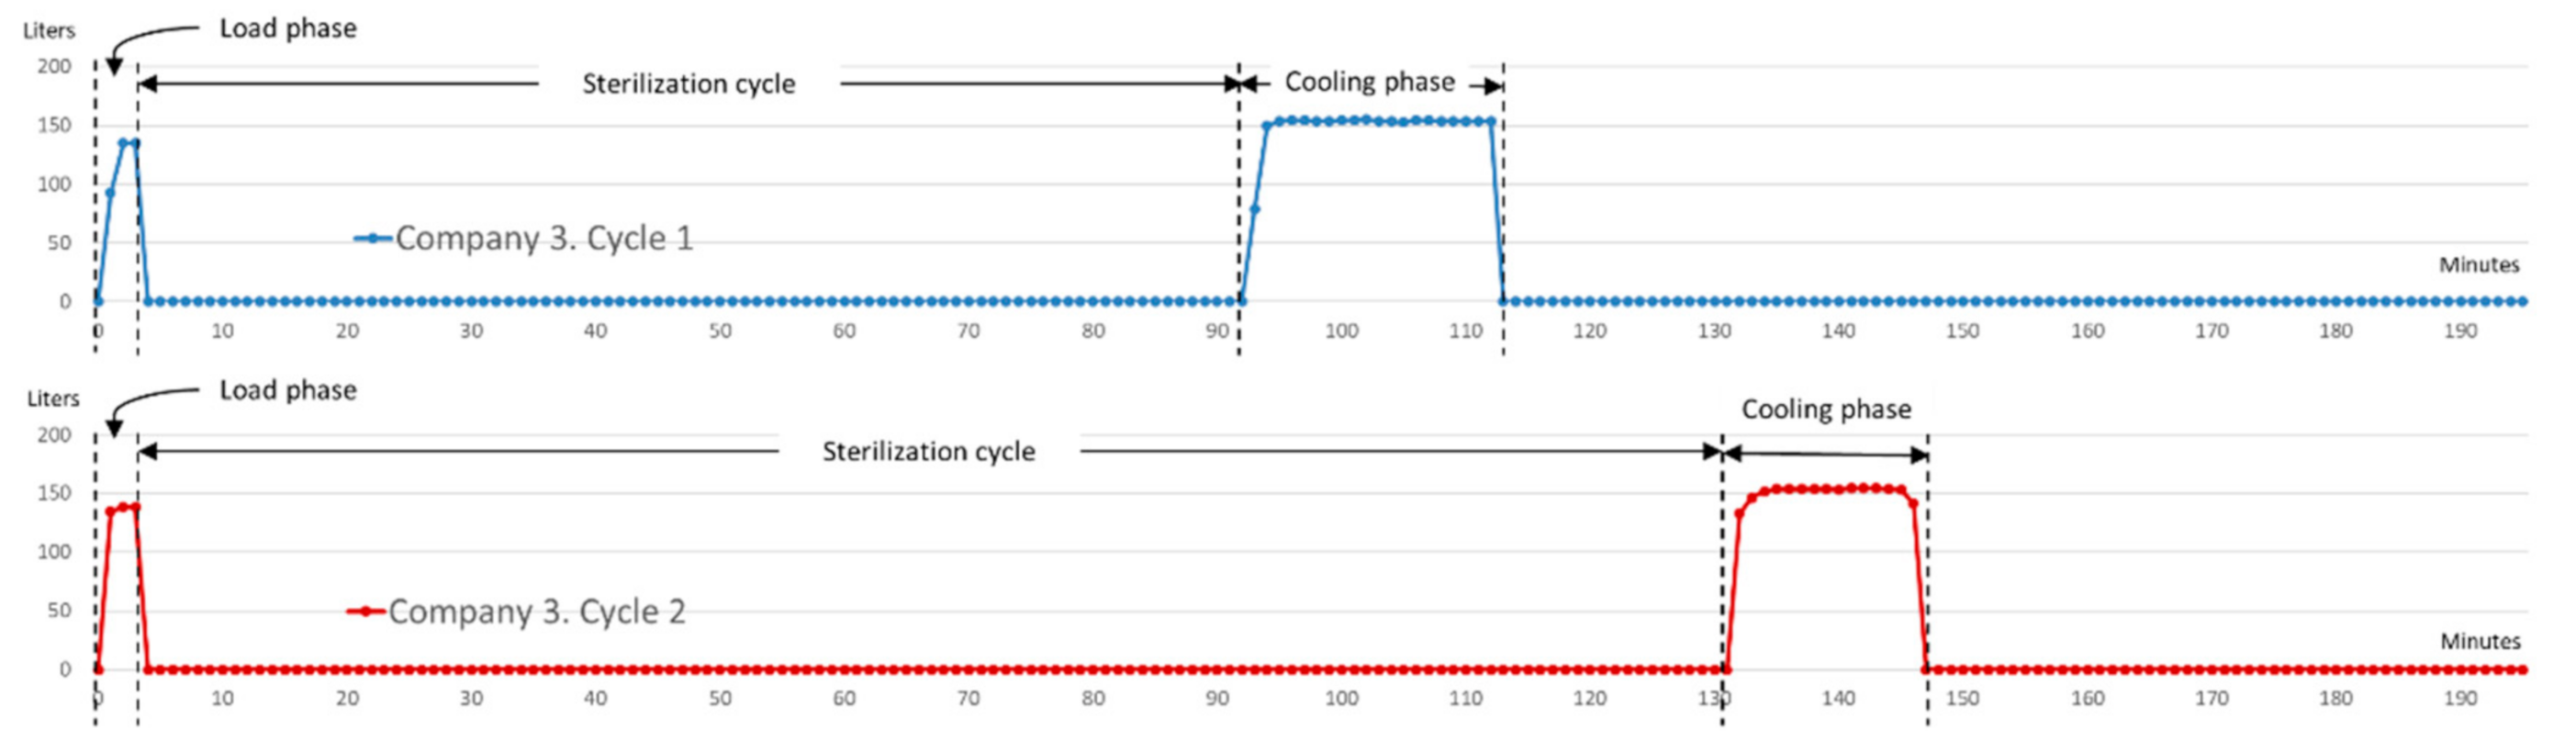
4.3.1. Autoclave Case Study III
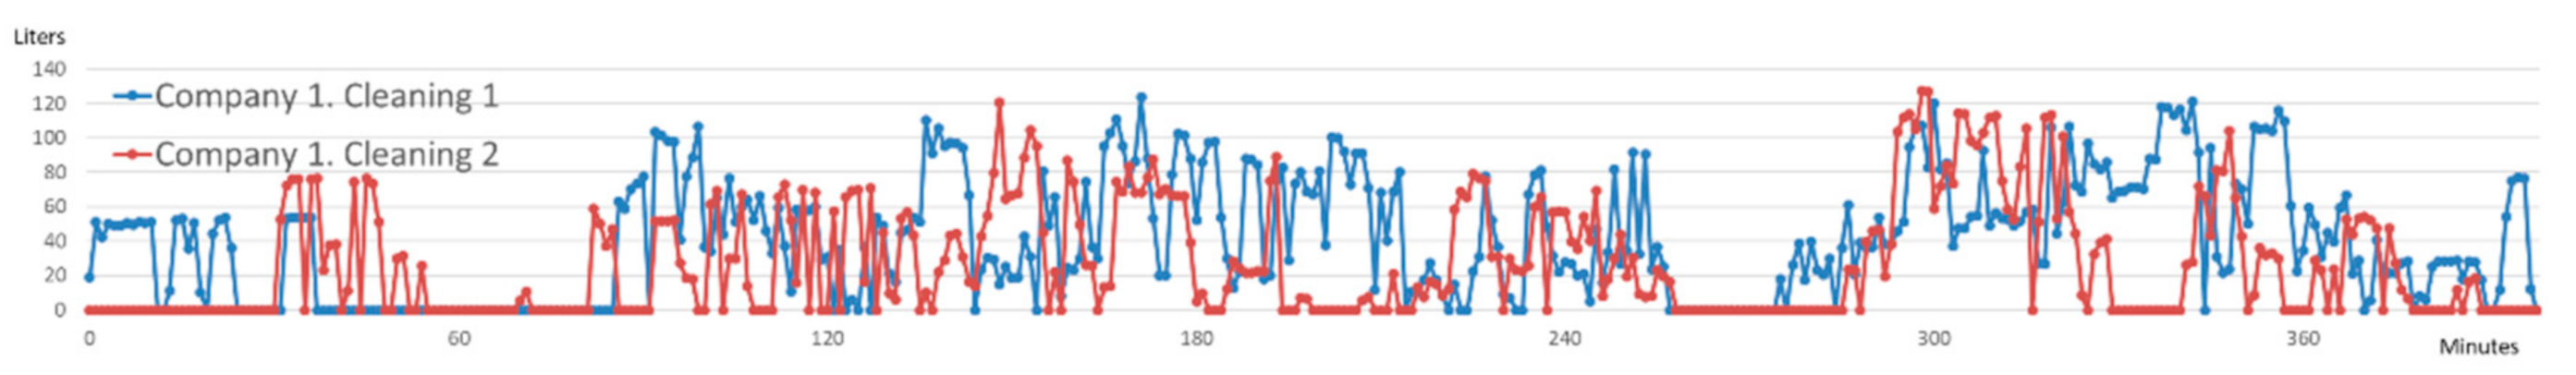
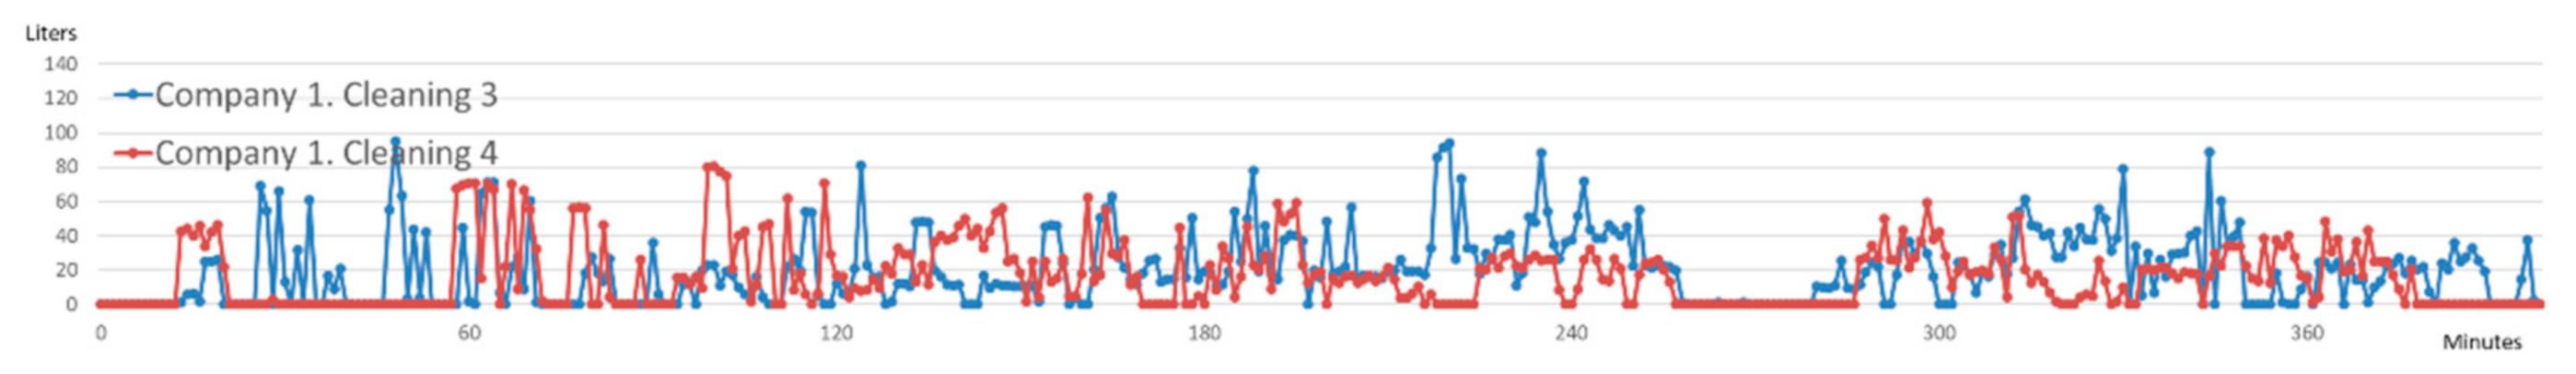
4.3.2. Manual Cleaning Case Study
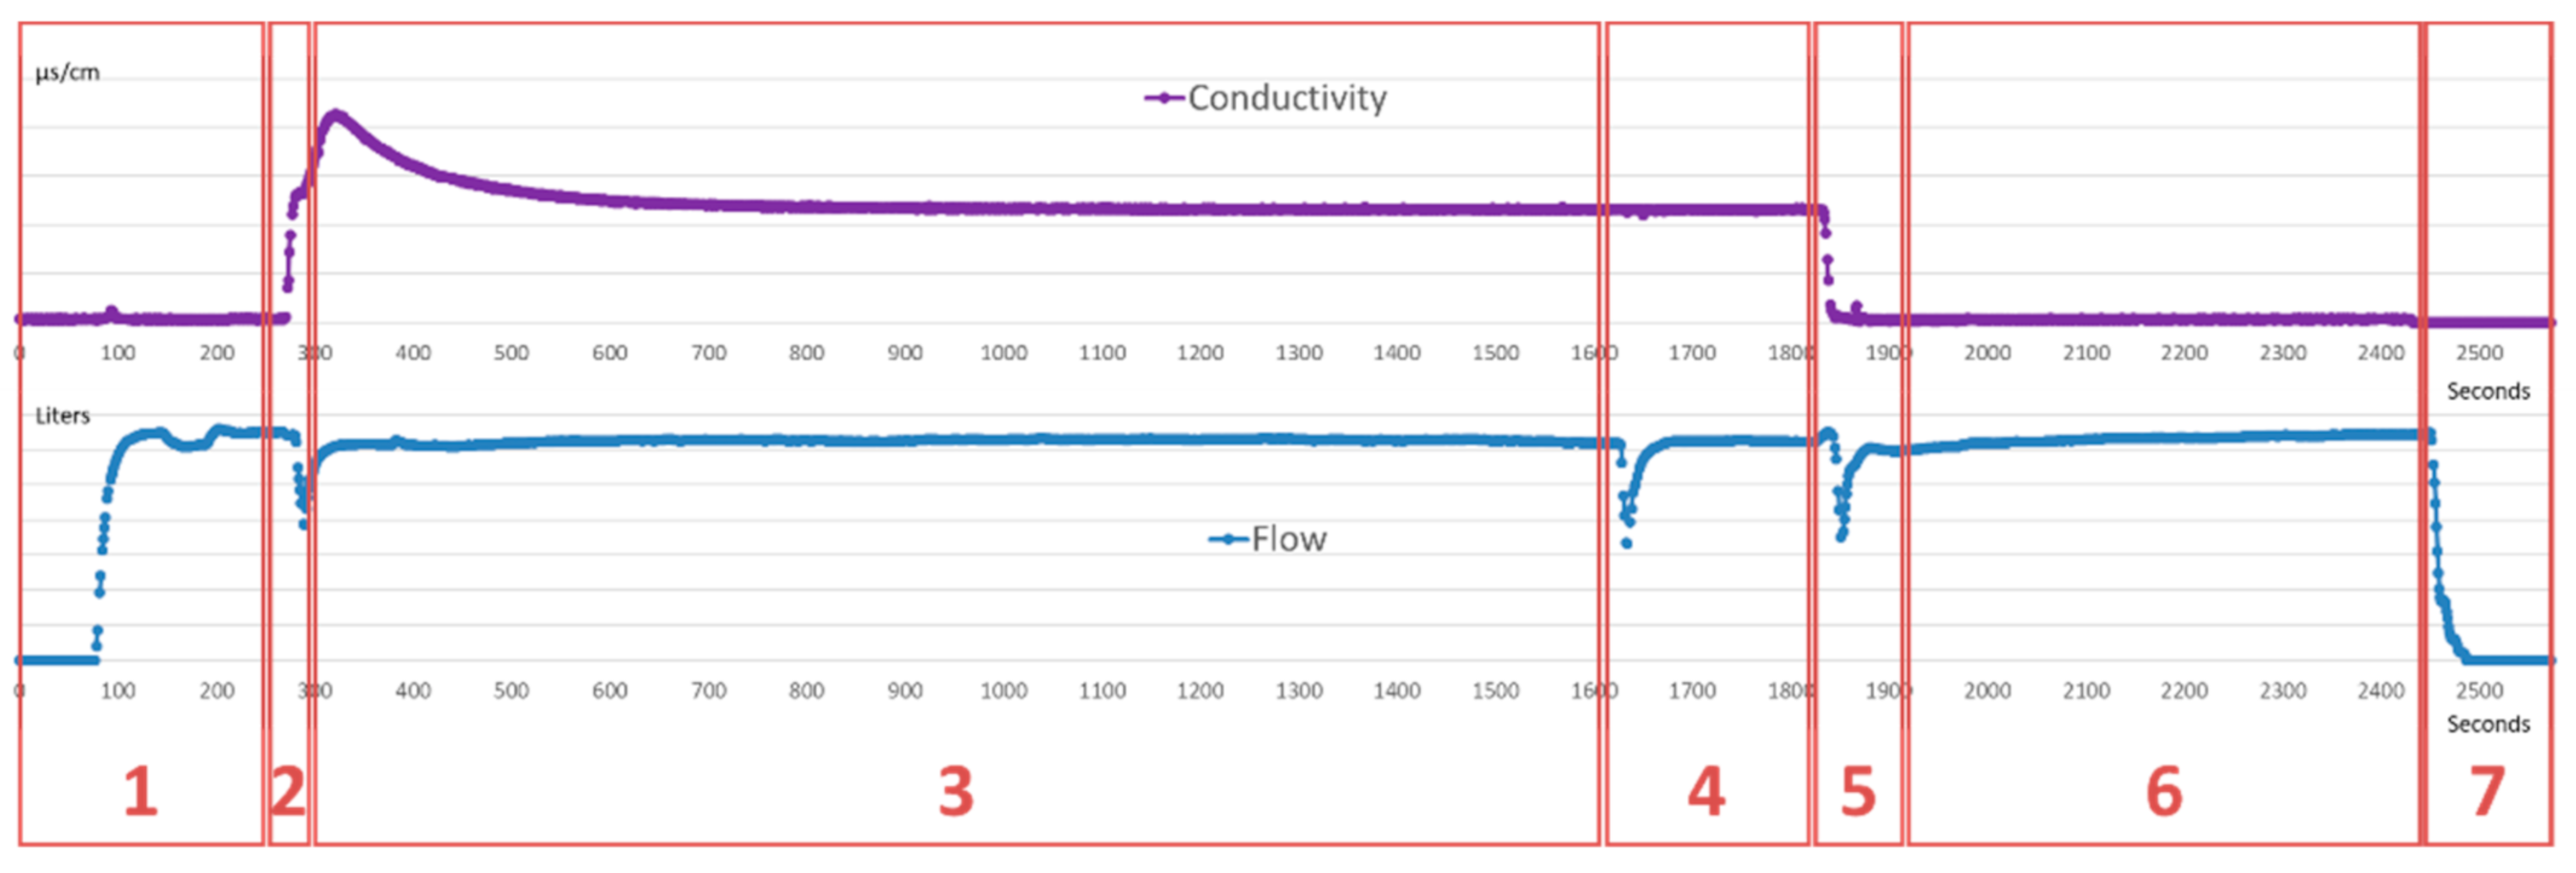
4.3.3. CIP Cleaning Case Study
- The interfaces (stages 2 and 5) are very narrow (only a few seconds), so the caustic soda and water barely mix, meaning that the water circulating in the pipe is clean water.
- Stages 1 and 4 could be used to estimate the length of the pipe because the valves operate at the beginning of the system.
- Taking this length of pipe into account, in the final rinse phase (6), the pipe is filled twice with clean water, which is discarded. This consumption behaviour means about 10 m3 of water is used for each cleaning, although this data will depend on the length of the pipes being cleaned.
5. Discussion and Conclusions
- Wireless measurement systems are increasingly being used for data capture in industrial applications. These systems allow detailed information to be collected, for example data about water consumption, with relatively low energy costs.
- Analysing how and how much water is consumed (by relating the consumption to specific process activities) increases the information available and provides more comprehensive knowledge about processes used in relation to the consumption of critical resources.
- The use of these wireless measurement systems for collecting detailed knowledge of process water consumption will allow industrial companies to better define strategies to establish increasingly sustainable production processes.
- Some of the real cases analysed can be used as practical examples of the use of an integrated lean–green strategy.
Author Contributions
Funding
Institutional Review Board Statement
Informed Consent Statement
Data Availability Statement
Conflicts of Interest
References
- Chen, S.; Chen, B. Urban energy–water nexus: A network perspective. Appl. Energy 2016, 184, 905–914. [Google Scholar] [CrossRef]
- United Nations World Water Assessment (UNWWA). The United Nations World Water Development Report 2015: Water for a Sustainable World; UNESCO: Paris, France, 2015; ISBN 978-92-3-100071-3. [Google Scholar]
- Khan, Z.; Linares, P.; García-González, J. Integrating water and energy models for policy driven applications. A review of contemporary work and recommendations for future developments. Renew. Sustain. Energy Rev. 2017, 67, 1123–1138. [Google Scholar] [CrossRef]
- OECD. OECD Environmental Outlook to 2050; OECD Environmental Outlook; OECD Publishing: Paris, France, 2012; ISBN 9789264122161. [Google Scholar] [CrossRef]
- Schellekens, J.; Heidecke, L.; Nguyen, N.; Spit, W. The Economic Value of Water-Water as a Key Resource for Economic Growth in the EU; ECORYS: Rotterdam, The Netherlands, 2018. [Google Scholar]
- Sun, S.; Liu, J.; Wu, P.; Wang, Y.; Zhao, X.; Zhang, X. Comprehensive evaluation of water use in agricultural production: A case study in Hetao Irrigation District, China. J. Clean. Prod. 2016, 112, 4569–4575. [Google Scholar] [CrossRef]
- European-Commission Closing the loop-An EU action plan for the Circular Economy. Available online: https://eur-lex.europa.eu/legal-content/EN/TXT/?uri=CELEX:52015DC0614 (accessed on 27 October 2020).
- European-Commission On a Monitoring Framework for the Circular Economy. Available online: https://eur-lex.europa.eu/legal-content/EN/TXT/?uri=COM%3A2018%3A29%3AFIN (accessed on 27 October 2020).
- MAPAMA España Circular 2030. Estrategia Española de Economía Circular. Available online: https://www.miteco.gob.es/images/es/180206economiacircular_tcm30-440922.pdf (accessed on 27 October 2020).
- Martínez León, H.C.; Calvo-Amodio, J. Towards lean for sustainability: Understanding the interrelationships between lean and sustainability from a systems thinking perspective. J. Clean. Prod. 2017, 142, 4384–4402. [Google Scholar] [CrossRef]
- Susana, D.; Cruz-Machado, V. Modelling lean and green: A review from business models. Int. J. Lean Six Sigma 2013, 4, 228–250. [Google Scholar] [CrossRef]
- Pampanelli, A.B.; Found, P.; Bernardes, A.M. A Lean&Green Model for a production cell. J. Clean. Prod. 2014, 85, 19–30. [Google Scholar] [CrossRef]
- Dieste, M.; Panizzolo, R.; Garza-Reyes, J.A. Evaluating the impact of lean practices on environmental performance: Evidences from five manufacturing companies. Prod. Plan. Control 2020, 31, 739–756. [Google Scholar] [CrossRef]
- Garza-Reyes, J.A. Lean and green–a systematic review of the state of the art literature. J. Clean. Prod. 2015, 102, 18–29. [Google Scholar] [CrossRef]
- Pang, R.; Zhang, X. Achieving environmental sustainability in manufacture: A 28-year bibliometric cartography of green manufacturing research. J. Clean. Prod. 2019, 233, 84–99. [Google Scholar] [CrossRef]
- Simpson, D.F.; Power, D.J. Use the supply relationship to develop lean and green suppliers. Supply Chain Manag. An Int. J. 2005, 10, 60–68. [Google Scholar] [CrossRef]
- King, A.A.; Lenox, M.J. Lean and green? An empirical examination of the relationship between lean production and environmental performance. Prod. Oper. Manag. 2009, 10, 244–256. [Google Scholar] [CrossRef]
- Luthra, S.; Kumar, A.; Zavadskas, E.K.; Mangla, S.K.; Garza-Reyes, J.A. Industry 4.0 as an enabler of sustainability diffusion in supply chain: An analysis of influential strength of drivers in an emerging economy. Int. J. Prod. Res. 2020, 58, 1505–1521. [Google Scholar] [CrossRef]
- Garza-Reyes, J.A.; Kumar, V.; Chaikittisilp, S.; Tan, K.H. The effect of lean methods and tools on the environmental performance of manufacturing organisations. Int. J. Prod. Econ. 2018, 200, 170–180. [Google Scholar] [CrossRef]
- Henao, R.; Sarache, W.; Gómez, I. Lean manufacturing and sustainable performance: Trends and future challenges. J. Clean. Prod. 2019, 208, 99–116. [Google Scholar] [CrossRef]
- Bhattacharya, A.; Nand, A.; Castka, P. Lean-green integration and its impact on sustainability performance: A critical review. J. Clean. Prod. 2019, 236, 117697. [Google Scholar] [CrossRef]
- Farias, L.M.S.; Santos, L.C.; Gohr, C.F.; de Oliveira, L.C.; da Amorim, M.H.S. Criteria and practices for lean and green performance assessment: Systematic review and conceptual framework. J. Clean. Prod. 2019, 218, 746–762. [Google Scholar] [CrossRef]
- Navarro-Ramírez, V.; Ramírez-Hernandez, J.; Gil-Samaniego, M.; Eliana Rodríguez-Burgueño, J. Methodological frameworks to assess sustainable water resources management in industry: A review. Ecol. Indic. 2020, 119, 106819. [Google Scholar] [CrossRef]
- Fercoq, A.; Lamouri, S.; Carbone, V. Lean/Green integration focused on waste reduction techniques. J. Clean. Prod. 2016, 137, 567–578. [Google Scholar] [CrossRef]
- EPA Baxter Healthcare Corporation. Available online: https://www.epa.gov/sustainability/baxter-healthcare-corporation (accessed on 27 October 2020).
- Prashar, A. Adopting Six Sigma DMAIC for environmental considerations in process industry environment. TQM J. 2020. [Google Scholar] [CrossRef]
- Walsh, B.P.; Bruton, K.; O’Sullivan, D.T.J. The true value of water: A case-study in manufacturing process water-management. J. Clean. Prod. 2017, 141, 551–567. [Google Scholar] [CrossRef]
- Pinto Junior, M.J.A.; Mendes, J.V. Operational practices of lean manufacturing: Potentiating environmental improvements. J. Ind. Eng. Manag. 2017, 10, 550. [Google Scholar] [CrossRef]
- Sartal, A.; Ozcelik, N.; Rodríguez, M. Bringing the circular economy closer to small and medium enterprises: Improving water circularity without damaging plant productivity. J. Clean. Prod. 2020, 256, 120363. [Google Scholar] [CrossRef]
- Muñoz-Villamizar, A.; Santos, J.; Grau, P.; Viles, E. Trends and gaps for integrating lean and green management in the agri-food sector. Br. Food J. 2019, 121, 1140–1153. [Google Scholar] [CrossRef]
- Chugani, N.; Kumar, V.; Garza-Reyes, J.A.; Rocha-Lona, L.; Upadhyay, A. Investigating the green impact of Lean, Six Sigma and Lean Six Sigma. Int. J. Lean Six Sigma 2017, 8, 7–32. [Google Scholar] [CrossRef]
- Bressanelli, G.; Perona, M.; Saccani, N. Challenges in supply chain redesign for the Circular Economy: A literature review and a multiple case study. Int. J. Prod. Res. 2019, 57, 7395–7422. [Google Scholar] [CrossRef]
- Santos, J.; Muñoz-Villamizar, A.; Ormazábal, M.; Viles, E. Using problem-oriented monitoring to simultaneously improve productivity and environmental performance in manufacturing companies. Int. J. Comput. Integr. Manuf. 2019, 32, 183–193. [Google Scholar] [CrossRef]
- Clifford, E.; Mulligan, S.; Comer, J.; Hannon, L. Flow-Signature Analysis of Water Consumption in Nonresidential Building Water Networks Using High-Resolution and Medium-Resolution Smart Meter Data: Two Case Studies. Water Resour. Res. 2018, 54, 88–106. [Google Scholar] [CrossRef]
- Pamela, B. Susan Jack Qualitative Case Study Methodology: Study Design and Implementation for Novice Researchers. Qual. Rep. 2008, 13, 544–559. [Google Scholar]
- Al Qur’an, M.N. Determinants of successful international expansion of professional service firms: A case study of Arabian firms. World J. Entrep. Manag. Sustain. Dev. 2011, 6, 119–132. [Google Scholar] [CrossRef]
- Yin, R.K. Applications of Case Study Research; SAGE Publications: Thousand Oaks, CA, USA, 2011; ISBN 9781412989169. [Google Scholar]
- Santos, J.; García, M.-P.; Arcelus, M.; Viles, E.; Uranga, J. Development of a wireless Plug&Lean system for improving manufacturing equipment diagnosis. Int. J. Comput. Integr. Manuf. 2011, 24, 338–351. [Google Scholar] [CrossRef]


Publisher’s Note: MDPI stays neutral with regard to jurisdictional claims in published maps and institutional affiliations. |
© 2021 by the authors. Licensee MDPI, Basel, Switzerland. This article is an open access article distributed under the terms and conditions of the Creative Commons Attribution (CC BY) license (http://creativecommons.org/licenses/by/4.0/).
Share and Cite
Viles, E.; Santos, J.; Muñoz-Villamizar, A.; Grau, P.; Fernández-Arévalo, T. Lean–Green Improvement Opportunities for Sustainable Manufacturing Using Water Telemetry in Agri-Food Industry. Sustainability 2021, 13, 2240. https://doi.org/10.3390/su13042240
Viles E, Santos J, Muñoz-Villamizar A, Grau P, Fernández-Arévalo T. Lean–Green Improvement Opportunities for Sustainable Manufacturing Using Water Telemetry in Agri-Food Industry. Sustainability. 2021; 13(4):2240. https://doi.org/10.3390/su13042240
Chicago/Turabian StyleViles, Elisabeth, Javier Santos, Andrés Muñoz-Villamizar, Paloma Grau, and Tamara Fernández-Arévalo. 2021. "Lean–Green Improvement Opportunities for Sustainable Manufacturing Using Water Telemetry in Agri-Food Industry" Sustainability 13, no. 4: 2240. https://doi.org/10.3390/su13042240
APA StyleViles, E., Santos, J., Muñoz-Villamizar, A., Grau, P., & Fernández-Arévalo, T. (2021). Lean–Green Improvement Opportunities for Sustainable Manufacturing Using Water Telemetry in Agri-Food Industry. Sustainability, 13(4), 2240. https://doi.org/10.3390/su13042240