Article

A Relationship between Supply Chain Practices, Environmental Sustainability and Financial Performance: Evidence from Manufacturing Companies in Jordan

1
Department of Logistic Sciences, School of Management and Logistic Sciences, German Jordanian University, Amman 11180, Jordan
2
Department of Management Systems and Logistics, Rzeszow University of Technology, 35-959 Rzeszow, Poland
3
Research Institute of Business Analytics and Supply Chain Management, College of Management, Shenzhen University, Shenzhen 518060, China
*
Authors to whom correspondence should be addressed.
Sustainability 2021, 13(4), 2152; https://doi.org/10.3390/su13042152
Submission received: 24 January 2021 / Revised: 8 February 2021 / Accepted: 12 February 2021 / Published: 17 February 2021
(This article belongs to the Section Sustainable Management)

Abstract

:
Pursuing sustainable development creates competitiveness for manufacturing firms in the market, however the financial pressure of adopting sustainable environmental practices is still a major concern. Few studies were found on the inter-relationships between supply chain management practices, environmental sustainability, and firm financial performance. Moreover, manufacturing companies are compelled by different pressure groups across the globe to maintain environmental standards while conducting their business and supply chain activities. Therefore, the current study aims to investigate the impact of supply chain practices on environmental sustainability and financial performance. In addition, the role of environmental sustainability as a mediator between supply chain management and financial performance was analyzed to improve sustainable development. A well-designed questionnaire was administered to manufacturing companies in Jordan for data collection. A total of 376 responses were analyzed and the proposed hypotheses were tested by using Structural Equation Modelling (SEM) approach. The results reveal that environmental sustainability was tested significantly and influenced by supply chain practices such as relationship with customers, postponement, level of information sharing, and information quality. Whereas environmental sustainability had a significant direct effect on financial performance. Finally, environmental sustainability mediated the relationship of all supply chain management practices with financial performance except strategic supplier partnership dimension. The study provides policy guidelines to decision makers while simultaneously assists the managers to improve sustainability practices in manufacturing companies.

1. Introduction

In the context of sustainable development, the Supply Chain Management (SCM), practices need to be introduced not only to encourage business and overall SC efficiency but also to concentrate on environmental, economic, and social issues [1,2,3,4,5]. According to Council of Logistics Management (CLM) SCM is the systematically and strategically association of the conventional business processes and strategies through a single organization and across businesses to enhance long-term efficiency [6]. Therefore, SCM practices should be utilized to simultaneously fulfil two objectives, including enhancement of firm’s performance as an entity and the performance of all supply chain members in the competitive marketplace [7]. Besides, firms need to be responsible about social and environmental issues in the SCM and help other sustainable businesses to comply with environmental standards [8]. As noted by De et al. [9], due to the challenges created by conventional industrial practices and regulations implemented by stakeholders and policymakers, sustainability has become an imperative obligation for companies to thrive in today’s society. Simultaneously, sustainability has three pillars, including environmental, economic, and social aspects [10]. Environmental performance is a holistic consideration of all environmental aspects in SC including GSC practices while sustainable performance is a broader concept that integrates all aspects of sustainability within the core SC activities including social, economic, and environmental dimensions [11,12]. The measurement of sustainable performance depends on the importance of sustainability aspects to the firms. In literature, there is a growing interest in connecting SCM practices such as lean practices to environmental sustainability [13]. Previous researches investigate how the SCM practices help to improve the performance of business processes [6,7]; the influence of lean SC principles on organizational performance [14]; the relationship of SC activities and firm’s financial sustainability [15]; the effect of SC practices on sustainability performance [9,16,17]; the impact of SC practices on environmental outcome [18]; how the green SC practices affect the sustainability performance [6,10,17]; and the nexus between SCM and environmental performance [19]. However, the existing studies did not cover the integrated relationship between SCM practices, environmental sustainability, and financial performance in a broader perspective. Besides, most of the past studies investigated the impact of overall SCM practices [6], overall green SCM [19], and overall lean practices [14] on one dimension only such as sustainability performance or organizational performance. SC practices adapted by different types of businesses have provided the clear picture of practices that play a vital role to develop sustainability and improve these businesses financial performance [16]. Moreover, to the best of the author’s knowledge, the impact of SCM activities on financial performance by using the mediating impact of sustainable environment remains under-researched. Therefore, this study aims to fill the literature gap through developing a multi-perspective framework by investigating how the SCM practices help to improve sustainable development. Moreover, the study contributes in various ways; first we investigate deeper the nexus among supply chain activities and financial performance of manufacturing companies; second, environmental sustainability is considered a mediator to investigate the integrated effect on financial performance by using Structural Equation Modelling (SEM) technique. Finally, this study is the first of its kind to highlight the severe environmental issue and its impact on manufacturing companies’ financial performance in the context of Jordan.
The structure of the paper comprises the following sections. The Section 2 presents the formulation of hypothesis based on enrich literature review of SCM practices, environmental sustainability, and financial performance. Section 3 describes the data collection information and methodology. Section 4 presents the main result and discussion. Finally, conclusion, policy implications, and future recommendations are presented in the last section of study.

2. Literature Review

2.1. Nexus Between Supply Chain Practices and Sustainable Performance

SCM defines as combination of system activities conducted in an organization to effectively manage the different members of the supply chain group [6]. Li et al. [6] observed how sustainable supply chain activities turn the organization competitively in the market and improve firm overall performance. Besides, the performance of the company is positively affected by competitive advantage due to sustainable SCM. The impact of SC activities on firm performance varied based on the supply chain role that is held by the organization [7,20]. Moreover, environmental outcomes were significantly and positively affected by the lean SC practices including supplier relationship, process and equipment, customer relations, product design, and human resource [18]. Moreover, previous studies showed that there is a significant association among continuous improvement in business processes, Just in Time (JIT) delivery system, and green SC practices along with their combined effect on environmental performance; likewise, sustainability performance was significantly influenced by the dimensions and practices of green SCM [10,19]. Green SC activities such as green product design and development have favorable effects on three types of performance including social and financial performance and green SC practices are significantly correlated with environmental performance [8,21]. Similarly, some studies showed that sustainable performance was significantly and positively influenced by customer relationships, process and equipment, product design, and supplier relationships [16,18]. The impact of process and equipment practices and supplier relationship practices on sustainability was moderated positively by lean culture [18]. A prior research conducted by Yang et al. [14] illustrated a positive relationship between practices of environmental management and lean manufacturing. Conversely, the environmental management practices showed the negative effect on the market and financial performance, which was reduced with improved environmental performance [15]. In addition, inventory leanness partially mediated the relationship among lean production and financial sustainability [15]. A qualitative study was conducted to explore where lean and sustainability-oriented innovation (SOI) is considered input criteria and economic, organizational, environmental, and social aspects are regarded as output criteria. The results show that combined lean and SOI lead to the sustainability of the supply chain for SMEs [9]. SCM practices such as reverse logistics, ISO 14001 certification, and flexible sourcing practices including elimination of waste, managing SC risk, and implementing the Cleaner Production (CP) practices have positive effect on sustainable development [17,22].
By reviewing several previous studies, it has been noticed that there are some common practices of SCM related to the upstream side of SC (e.g., supplier relationship), SCM practices related to the downstream side of SC (e.g., customer relationship), and SCM practices related to all SC members (e.g., information sharing) [6,7,16]. Cook et al. [7] identified six dimensions of SCM (e.g., information sharing, long-range relationships, professional planning systems, internet leveraging, structure of supply connections, and structure of distribution channels) and assessed their impact on organizational performance. Li et al. [6] proposed five SCM activities, including strategic supplier relationship, building relationships with customers, the degree of information sharing, quality level of information sharing, and postponement, whereas Iranmanesh et al. [16] measured five SCM practices including maintenance process, quality planning and monitoring activities, human resources and administration management, product designing and development, supplier relationship practices, and customer complaints and satisfaction on the firms sustainability performance.
Given the broader scope of SCM practices and the variety of their activities across previous studies, SCM practices suggested by Li et al. [6] were adopted in this study as these practices are common in several studies [7,16] and simultaneously consider supply chain upstream and downstream practices. Table 1 shows a brief explanation of each SCM practice.

2.2. Environmental Sustainability

According to the World Commission on Environment and Development (WCED), sustainability is the means of the economic practices that fulfil the requirements of the present generation without compromising the ability to fulfill the needs of future generations [23]. Sustainability comprises three main dimensions, namely, environment, economic, and social, which have direct importance and significance for research in operations and SCM [24]. Studies showed that the economic success of an organization is a direct consequence of the implementation of sustainable practices [25,26]. Chardine-Baumann and Botta-Genoulaz [27] argued that the effect of SCM on sustainability should be determined based on the three key dimensions of sustainability including environmental performance, social responsibility, and economic benefit. However, as noted by Marshall et al. [24], environmental aspects have received more focus from previous literature on sustainability. However, this focus is on environmental sustainability due to different types of pressure groups including government legislation and numerous stakeholders, such as investors, consumers, workers, non-governmental organizations, and local communities that force businesses to reduce their impacts on the environment and to comply with environmental standards [18]. Moreover Wisner et al. [28] conducted research and showed that firms’ internal performance is significantly influenced by good environmental practices. Hence, managers should strive for utilizing environmental sustainability practices to improve the firm performance. Environmental sustainability can be defined as the practices, actions, and methods that have an obvious positive effect on the natural environment [29]. Environmental practices have been studied as enablers to an industry such as a study by Goyal et al. [12] who identified 12 environmental sustainability enablers and classified them into four significant categories of SC practices. On the other hand, some researchers conducted studies to differentiate between environmental practices in terms of their impact. Näyhä and Horn [11] classified environmental sustainability practices into high and low impact in order to develop proper environmental evaluation for the industry. Similarly, several studies linked the environmental practices with the environmental commitment of companies [29,30]. Sendawula et al. [29] concluded that environmental commitment can significantly predict practices of environmental sustainability in manufacturing firms. The common issues investigated in previous studies of environmental sustainability focused on minimizing air emissions, reduction of waste, minimizing solid wastes, reduction in using hazardous toxic materials, decreasing occurrence of environmental accidents, and improving a firm’s environmental overall situation [29,30,31,32]. Shamout et al. [33] stated that Jordanian cities are facing many challenges related to sustainability including environmental sustainability; therefore, policymakers should develop policies to integrate sustainability with resilience. Moreover, Abu Hajar et al. [34] emphasized that Jordan is moving toward being environmentally sustainable since the government launched the National Green Growth Plan in 2017. Al-Ghwayeen and Abdallah [35] examined the effect of GSCM on environmental and export performance for manufacturing firms in Jordan. Likewise, Abdallah and Al-Ghwayeen [36] investigated the relationship between GSCM practices, and business performance having operational and environmental performances as mediators. However, there is a gap in studies investigating the relationships between SC practices and environmental sustainability in the context of Jordan as a developing country [35,36]. To fill the literature gap, the present study aims to check the association between SCM practices, environmental sustainability, and financial performance by focusing on the common practices of environmental sustainability extracted from the literature.

2.3. Financial Performance

Numerous studies such as [37,38,39] investigated the effect of various SCM-related activities on organizational performance. There are many indicators of businesses’ performance that can be conceptualized through two dimensions, namely, market performance and financial performance. Several studies focus on financial performance since it reflects the success of a company’s plans and operations numerically [14,15,40]. Hence, financial performance can be described as the degree to which profit-oriented objectives (e.g., sales return and return on investment or ROI) are produced by an organization [14]. There are many measures of a financial performance of organization. Hofer et al. [15] measured the firm’s financial performance using sales and sales growth, and other measures such as return on assets (ROA) are also utilized in several studies. This study measured the financial performance of individual manufacturing firms as well as the performance compared to the competitors based on two indicators, such as ROS and ROI proposed by [14] to have a better reflection of firm’s financial situation and performance. Table 2 presents the summary of most relevant studies investigating the relationship among SCM practices, environmental sustainability, and financial performance.

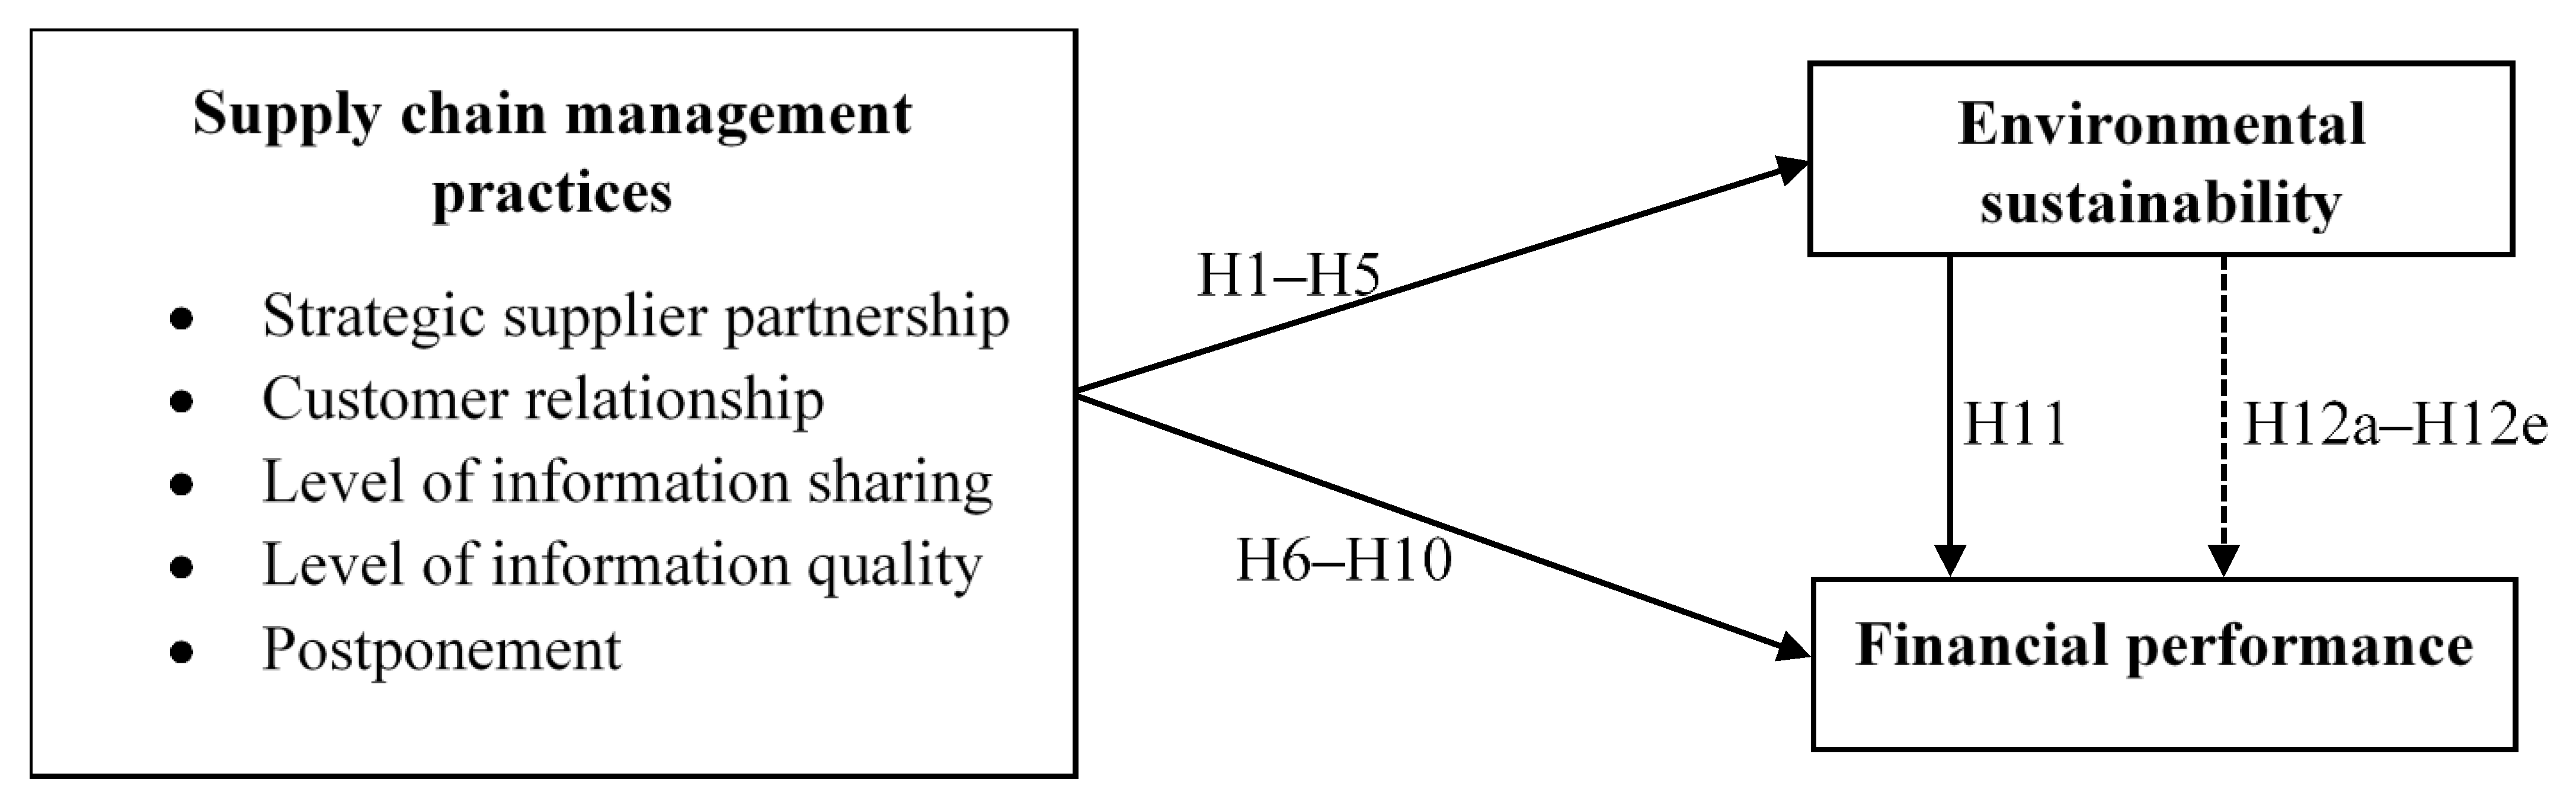
2.4. Hypotheses Development and Conceptual Framework

2.4.1. Supply Chain Practices towards Environmental Sustainability

Several studies examined the relationship between SCM practices and environmental sustainability such as Bandehnezhad et al. [18] observed that lean SC practices, including process and equipment, human resources, product design, and customer relationships, have significantly and positively affected environmental performance. Researchers such as Green et al. [19], Yildiz and Sezen, [10] and Le [8] found the significant association between SC practices especially green practices and environmental performance. Whereas process and equipment, product blueprint, and supplier and customer relationships have profoundly and positively affected sustainable results [16]. Given the broad range of SC activities, SCM practices suggested by Li et al. [6] were adopted on basis of prior discussion. The development of hypotheses are as follows:
Hypothesis H1.
Strategic supplier partnership positively influences the firm’s sustainable environmental performance.
Hypothesis H2.
Customer relationship positively influences the firm’s sustainable environmental performance.
Hypothesis H3.
Level of information sharing positively influences the firm’s sustainable environmental performance.
Hypothesis H4.
Level of information quality positively influences the firm’s sustainable environmental performance.
Hypothesis H5.
Postponement positively influences the firm’s environmental sustainable performance.

2.4.2. Effect of SCM Practices on Firm’s Financial Performance

The significant association concerning practices of SCM and performance has been explored in several studies [6,7]. Li et al. [6] identified five practices of SCM, including strategic supplier relationship, building relationships with customers, the degree of information sharing, quality level of information sharing, and postponement. Findings showed that all the practices as a whole significantly affected core competency and firm performance in terms of market and financial outcomes. A study conducted by Cook et al. [7] found that two practices namely information sharing, and design of the distribution network significantly influenced the performance of the organization; whereas Hofer et al. [15] proved that there is a significant relationship between lean SC practices and financial performance. Moreover, Feng et al. [40] conducted a study on 126 automobile manufacturers located in China and suggest that green SC practices indirectly leads to better financial performance. Based on the previous discussion, the following hypotheses were suggested
Hypothesis H6.
Strategic supplier partnership positively influences the firm’s financial performance.
Hypothesis H7.
Customer relationship positively influences the firm’s financial performance.
Hypothesis H8.
Level of information positively influences the firm’s financial performance.
Hypothesis H9.
Level of information quality sharing positively influences the firm’s financial performance.
Hypothesis H10.
Postponement positively influences the firm’s financial performance.

2.4.3. Nexus among Firm’s Financial Performance and Environmental Sustainability

Several studies indicate the positive and significant relationship between environmental sustainability and firm’s financial performance [14,41,42]. Moreover, higher financial performance is correlated with environmental performance in terms of reduced pollution, waste reduction, and less on-site waste disposal [41,43]. Because of changes in environmental efficiency, good corporate social performance can also contribute to the higher market value of companies [42,44,45]. Moreover, Yang et al. [14] observed that environmental sustainability positively influences the firm’s financial performance. Similarly, Feng et al. [40] suggest that environmental and operational performance are directly led to better financial performance. Therefore, based on the results of previous studies that show a direct relationship between sustainable environment and firm’s financial performance, the study suggests:
Hypothesis H11.
Environmental sustainability positively influences the firm’s financial performance.

2.4.4. Mediating Effect of Environmental Sustainability on the SCM Practices and Firm’s Financial Performance

Few studies explored the nexus between SCM practices and firm’s financial performance by using the mediating effect of environmental sustainability. Yang et al. [14] found the negative impact of environmental management practices on market and financial performance. The study of Feng et al. [40] investigated the operational and environmental performance mediates the relationship between Green Supply Chain Management (GSCM) and financial performance and showed that how environmental and operational performance positively influences the GSCM and firm’s financial performance. Based on the previous argument, the last hypotheses were developed:
Hypothesis H12a.
Environmental sustainability mediates positively influences the strategic supplier partnership and firm’s financial performance.
Hypothesis H12b.
Environmental sustainability mediates positively influences the customer relationship and firm’s financial performance.
Hypothesis H12c.
Environmental sustainability mediates positively influences the level of information sharing and firm’s financial performance.
Hypothesis H12d.
Environmental sustainability mediates positively influences the level of information quality and firm’s financial performance.
Hypothesis H12e.
Environmental sustainability mediates positively influences the postponement and firm’s financial performance.

2.4.5. Conceptual Framework

As can be noticed from the reviewed articles in Table 2, there are several studies that focus on the association among SC activities and environmental sustainability practices. Other studies investigate the impact of SC practices on firm’s financial sustainability and few studies explore the relationship between environmental sustainability and firm financial performance. However, according to best of authors knowledge, there is no study focused on exploring the nexus among SC activities, environmental sustainability practices, and financial performance. Thus, the following conceptual framework has been developed to fill the gap exists in literature (Figure 1).

3. Research Methodology

3.1. Sampling and Data Collection

The study targeted a population that consisted of manufacturing companies from Jordan. The sampling frame includes managers from manufacturing companies in Amman, the capital of Jordan. The study used a non-probability technique due to cost and time considerations; therefore, a convenience sampling approach was adopted in this study. However, good estimates of population characteristics can be made by using non-probability sampling [46]. A quantitative survey approach was used and information was obtained through a structured questionnaire. A quantitative design was used to objectively evaluate the hypothesized relationships between the study variables and to generalize the findings of the sample broadly [47,48]. The sample size for this study was estimated to be 370 companies in total, assuming a confidence level of 95% and a margin of error of 5% [49]. Manufacturing firms were contacted to fill out an online questionnaire. Four hundred and fifty questionnaires distributed and 376 were usable, representing an 83.5% response rate, and data were collected during October to December 2020.

3.2. Study Measures

The items related to the dimensions of SCM were taken from Li et al. [6]. Measurement items related to environmental sustainability were adopted from Näyhä and Horn [11], Green et al. [19], Yildiz Çankaya and Sezen [10], and Sendawula et al. [29]. Finally, financial performance items were extracted from Yang et al. [6] and Hofer et al. [15]. All the study constructs and their measurement items are presented in Table 3. The initial portion of the questionnaire contains demographic characteristics of respondents. The second part addresses questions related to the components of SCM practices, environmental sustainability, and financial performance. A 5-point Likert scale was adopted to measure the SCM performance ranging from strongly disagree to strongly agree, where respondents were asked to rate their level of agreement or disagreement. To 2 = a little bit; 3 = moderate level; 4 = good level; 5 = higher level. Finally, financial performance was measured by considering the last three years of the firm’s performance where, 1 = likely to achieve more than 10%, 2 = stayed about the same, 3 = likely to achieve between 10–30%, 4 = likely to achieve between 30–50% and 5 = likely to achieve more than 50%. In addition, financial performance was measured in comparison to the competitors where 1 = comparatively lower to 5 = comparatively measure environmental sustainability, a 5-point scale was used where 1 = low lower level; higher.

3.3. Respondents’ Profiles

Figure 2 shows different classifications of manufacturing firms including chemicals, construction, engineering and electrical industries, food and supply, furniture, garments, mining and minerals, plastic products, printing and paper, and therapeutics. The results showed that participants are distributed among the industries, however the maximum participants were from the food and supply sector (29.8%) followed by the plastic products sector (20.2%).
The demographic information of the respondents including gender, years of experience, level of education, position, and number of employees is presented in Table 4.
The sample has been classified into small, medium, and large organizations, according to the number of employees in each—medium (51.1%), small (36.4%), and large (12.5%) organizations.

4. Results

The ‘SPSS’ version 25 statistics package was mainly used for data cleaning and preparation, demographic analysis, descriptive statistics, reliability analysis, and multicollinearity tests. To test the conceptual model and proposed hypotheses, Structural Equation Modelling (SEM) was performed. SEM analyses involved measurement model assessment, e.g., convergent validity by factor loading, composite reliability, average variance extracted (AVE), and discriminants validity. Further, the structural model covers to analyze the evaluating path coefficients, the structural model’s predictive capacity and testing of hypotheses. Therefore, SEM is a multivariate analysis technique used to simultaneously estimate multiple relationships among constructs formulated in the conceptual framework. In this study, SmartPLS is used to run variance based SEM and it measured both the measurement model including validity and reliability checks and the structural model including estimating the path coefficients [50].

4.1. Descriptive Statistics

Single composite scores were measured for each of the latent constructs (e.g., strategic supplier partnership) by combining the corresponding measurement items to determine summary statistics of the latent constructs. Customer relationship has the highest mean score (M = 4.18, SD = 1.07), as illustrated in Table 5. On the other hand, the lowest mean score was generated by financial performance (M = 3.35, SD = 0.74). The other means of the variables fall between these two means.

4.2. Multicollinearity Diagnosis

Multicollinearity among the independent variables may affect the estimated path coefficients. Therefore, the variance inflation factor (VIF) tolerance values were used to detect multicollinearity. There was no such multicollinearity found as all the VIF values are below 5 and tolerance above 0.10, as demonstrated in Table 6 [47].

4.3. Measurement Model Analysis

The relationship is a definite study between observed or measured variables (measurement items) and a latent variable is defined by the measurement model analysis [51]. Several numerical values of measurement items were gathered from the respondents of the research to calculate the latent variables. The reliability and validity of the measurement items should therefore be identified. A partial least square structural equation modelling (PLS-SEM) technique was used to test the proposed model [50].

4.3.1. Convergent Validity and Reliability

The construct reliability can be assessed through Cronbach’s alpha and composite reliability (CR) that should have values above 0.70 [51]. The results in Table 7 showed that Cronbach’s alpha and CR value of all the latent variables were above 0.70 and therefore, the construct reliability was established.
Moreover, convergent validity is determined by the factor loading value that should be above 0.70 and the average variance extracted (AVE) that should have a value above 0.50 [47]. As shown in Table 7, the majority of the factor loading values are above 0.70 and thus acceptable. Besides, an AVE of 0.50 or more has been achieved for latent variables, which means that the latent construct items account for 50% or more of the variance in the observed variables.

4.3.2. Discriminant Validity

Table 8 shows the values of discriminant validity for the study constructs. If the value of square root of AVE is higher than the correlation coefficients among all the constructs, then discriminant validity can be achieved [52]. The diagonal values reflected the AVE’s square root and inter-construct correlations were represented by the off-diagonal values. As shown in Table 8, all the AVE values of the square root were higher than the correlation coefficients between all the constructs. Thus, the discriminating validity of the latent variables was thus confirmed.
Another indicator of discriminant validity is Heterotrait-Monotrait Ratio (HTMT), which estimates the real correlations between constructs [51]. HTMT values below 0.90 suggest that discriminant validity is present. As shown in Table 9, the majority of the values were well below the recommended value of 0.90.

4.4. Structural Equation Modeling (SEM)

To achieve the validity of complete measurement model, the structural model is tested and has been achieved [47]. To test the hypotheses suggested in the conceptual model, SEM is used. Analysis of the structural model accepts or rejects the mentioned hypotheses that indicate the significance of the relationship [53,54]. In this study, a bootstrapping method with a subsample of 1000 was applied to estimate the structural model [50]. Figure 3 showed the estimate of the suggested model.
To test hypotheses, t value should be statistically significant. This statistically significance range of t value must be out of the range between −1.96 and +1.96, whereas the p-value should be lower than 5% [53]. Table 10 shows the results of structural model testing including path coefficients (β), t statistics, and p values. The direct effects showed that 7 out of 11 paths were significant at p < 0.05. In other words, environmental sustainability was significantly influenced by customer relationship, level of information sharing, level of information quality, and postponement. However, strategic supplier partnership did not significantly affect environmental sustainability. Besides, strategic supplier partnership and postponement are significantly influenced financial performance. However, customer relationship, level of information sharing, and level of information quality did not significantly affect financial performance. Finally, environmental sustainability significantly influenced financial performance. Thus, hypotheses H2, H3, H4, H5, H6, H10, and H11 were supported. On the other hand, hypotheses number H1, H7, H8, and H9 were rejected. The findings also indicated that environmental sustainability had the highest path coefficients (β = 0.454), which indicated that when environmental sustainability is increased by 1 standard deviation unit, financial performance will be increased by 0.454 standard deviation units.
Table 11 showed that customer relationship, level of information sharing, level of information quality, and postponement had a significant indirect effect on financial performance. In other words, environmental sustainability significantly mediated the positive relationship between customer relationship and financial performance, level of information sharing and financial performance, level of information quality and financial performance, postponement and financial performance. Thus, hypotheses H12b, H12c, H12d, and H12e were supported.

4.5. Determination of Model Explanatory Power

Coefficient of determination (R2), the effect size (f2), and cross-validated redundancy (Q2) were used to test the effect size and predictive capacity of the exogenous (independent) constructs (Hair et al., 2019).

4.5.1. Coefficient of Determination (R2)

The coefficient of determination or R2 is used to assess the explanatory power structural model. R2 can range from 0 to 1 [47]. The higher values indicate a better prediction power. As shown in Table 12, the highest r square value of 0.552 indicated that around 55.2% of the change in firm’s financial performance was observed by all the independent variables including strategic supplier partnership, customer relationship, level of information sharing, level of information quality, postponement, and environmental sustainability.

4.5.2. F Square

Effect size (f2) is used to measure the impact of eliminating an exogenous or an independent construct on endogenous or outcome constructs [47]. In other words, if one of the predictor variables (e.g., customer relationship) is omitted, the f2 value denotes what changes in the endogenous construct (e.g., financial performance) can occur. The f2 values of 0.02, 0.15, and 0.35, respectively, can be explained by small, medium, and large effects. As seen in Table 13, postponement elimination will have a major impact on environmental sustainability, and environmental sustainability removal will have a medium impact on financial performance.

4.5.3. Predictive Relevance

To check the predictive accuracy of the exogenous constructs, the predictive relevance (Q2) is also used (e.g., postponement) on the endogenous construct (e.g., financial performance) [47]. If the Q2 value is higher than 0, this represents predictive accuracy. As mentioned in Table 14, all Q2 values were above 0, suggesting predictive relevance of exogenous constructs.

5. Discussion

The study aims at examining the impact of five main SCM activities on financial performance along with the mediation of environmental sustainability. However, identifying the practices of SCM that significantly contribute to the financial performance of an organization along with an assessment of environmental sustainability has received less attention by past studies [3,19,40]. Accordingly, the findings of the study would add to the field of sustainability literature. The study revealed that SCM practices significantly leads to financial performance and environmental sustainability, in addition to the significant effect of financial performance as a mediation variable in the association among SCM practices and financial performance of manufacturing firms in Jordan. More specifically, the study results showed that environmental sustainability was significantly influenced by four SCM practices including customer relationship, level of information sharing, level of information quality, and postponement. However, strategic supplier partnership did not significantly affect environmental sustainability. The insignificant association among strategic supplier partnership and environmental sustainability in the current study is not in line with prior research since customer relationship was found to have significant effects on sustainability by prior studies [16,18]. Bandehnezhad et al. [18] noted that practices in supplier relationships can create significant opportunities for improving joint productivity and environmental performance.
Further, this study showed that strategic supplier partnership significantly influenced financial performance and there is no significant mediation of environmental sustainability between strategic supplier partnership and financial performance. This suggests that strategic supplier partnership has direct effects on financial performance. Therefore, managers should prioritize and maintain a strategic partnership with the suppliers to have better financial performance [20]. The findings of this study are endorsed by the study of Li et al. [6] that showed a significant impact of SCM practices on organization’s performance in terms of market and financial performance. Thus, this study supports the significant associations between strategic supplier partnership and financial performance in the current study.
Moreover, the study indicates that three SCM practices including customer relationship, information sharing, and information quality practices did not have any significant direct effects on financial performance. Nonetheless, these SCM practices are fully mediated by environmental sustainability. The insignificance of the direct effects of information sharing is not consistent with Cook et al. [7] who observed that the firm’s performance was positively influenced by the distribution network and sharing of information. Similarly, the insignificance of customer relationship, information sharing, and information quality practices was not supported by the study of Li et al. [6]. However, these practices were found to have an indirect effect on financial performance through the mediating effect of environmental sustainability. The indirect effects can be supported by the work of Feng et al. [40] who found that the association among GSCM and financial performance was fully mediated by organizational and environmental performance. Moreover, Yang et al. [14] found that improved environmental efficiency decreases the negative effect of environmental management policies on business and financial performance. Therefore, organizations should adopt environmental sustainability practices along with customer relationship, information sharing, and information quality practices to improve financial performance of manufacturing firms. As for the fifth SCM practice, the study results found that postponement significantly influenced financial performance and there is a positively influence mediating impact of sustainable environment on the postponement and firm’s financial performance. Thus, the findings suggest that decision-makers of the supply chain should adopt a postponement strategy, which leads to the improved financial performance where the relationship is enhanced by the presence of environmental sustainability. Finally, environmental sustainability practices significantly influenced financial performance. This result is similar with previous studies, which found a significant association among environmental sustainability and financial outcome [41,42,55,56,57,58]. Thus, managers in manufacturing firms in Jordan should pay a great deal of attention to the improvement of firms; environmental situation, to reduce waste and air emission, decrease the consumption of toxic materials, and avoid environmental accidents. SC managers should adopt and evaluate these environmental practices to enhance their adoption in the firm.

6. Conclusions, Implications, and Further Research

The present study examined specific practices related to SCM that prove to have a significant contribution to sustainable development. The study proposed a conceptual model that investigates the relationships between SCM practices, environmental sustainability practices, and financial performance. Moreover, the mediation effect of environmental sustainability between SCM practices and financial performance was measured. The study has investigated the direct effect of five main SCM practices on two independent variables including environmental sustainability and financial performance of manufacturing firms. It has been concluded that four SCM practices (customer relationship, level of information sharing, level of information quality, and postponement) significantly affect environmental sustainability. Moreover, two SCM practices (strategic supplier and postponement) have direct significant effects on firms’ financial performance. In addition, the study examined the mediating effect of environmental sustainability on the relationship between SCM practices and financial performance. It has been found that environmental sustainability mediates the relationship of four SCM practices (customer relationship, level of information sharing, level of information quality, postponement) on financial performance. Lastly, a significant relationship was found between environmental sustainability practices and financial performance.
The study has several implications to academicians, SC managers, and the community. The study contributes to the existing literature by suggesting the preliminary empirical evidence on the strong association among SC practices and environmental sustainability and the significant role of environmental sustainability as a mediator between SCM practices and financial outcome with an evidence from Jordan’s manufacturing firms. Furthermore, SC managers need to encourage decision makers in firms to become more committed to environmental sustainability and get ready to undertake actions that will foster its implementation since the study proves that environmental sustainability has a direct effect on financial performance. Additionally, the study can help SC managers to make it priority among SCM practices. Moreover, in accordance with their supply chain strategies, environmental sustainability practices that have a significant mediating association with SCM practices and the firm’s financial performance should be made a priority. Lastly, society needs to appreciate environmental initiatives from manufacturing firms in an effort to encourage firms to adopt more socially responsible activities.
Manufacturing companies in Jordan should focus on SSP through selecting suppliers based on quality, allowing two-way communication of complaints and suggestions to improve quality of products and engaging suppliers in planning and development of new products. In addition, Jordanian manufacturing firms can improve CS by having a transparent mechanism for customer satisfaction, review customer needs on a regular basis, and improve relationships with customers through physical and online channels. SSP and CS could be enhanced through IS. Manufacturing firms in Jordan should establish a strong IS with SC members and use shared information in improving business planning, processes, and future events. This can be enhanced through increasing the level of IQ by providing complete, adequate, and timely information that benefit all SC members. Finally, firms in the Jordanian manufacturing sector can be efficient when applying PP activities that include implementing assembly modulation concept, postponing shipments until customer orders received, and delaying assembly processes according to the nearest possible location to customer in the SC.
The study framework has been empirically examined with a relatively larger sample size (n = 376) related to different manufacturing companies in Jordan. However, due to the non-probability nature of sampling, the generalization of the results to a larger context may be a challenge, which can be overcome by future studies through the application of probability sampling method. Furthermore, a growing tendency of the current literature was noticed in the field of sustainability to green SCM practices [14,17,19] and sustainability to lean SC practices [9,16,17]. As a result, future studies can be undertaken to investigate the effect of specific green SCM practices and lean SC principles that significantly affect the financial performance of firms. The current study has considered the environmental aspect solely among three dimensions of sustainability. Therefore, future studies can focus on other dimensions such as social and economic sustainability. Finally, this study can also be replicated across different countries and industries.

Author Contributions

Conceptualization, L.J. and D.Z.; methodology, L.J.; validation, L.J.; formal analysis, L.J., D.Z., and M.I; investigation, L.J.; resources, L.J.; data curation, L.J.; writing—original draft preparation, L.J., D.Z., and M.I.; writing—review and editing, L.J. and M.I; supervision, L.J., D.Z. and M.I. All authors have read and agreed to the published version of the manuscript.

Funding

This research received no external funding.

Institutional Review Board Statement

Not applicable.

Informed Consent Statement

Not applicable.

Data Availability Statement

The data presented in this study are available on request from the corresponding author. The data are not publicly available due to privacy.

Conflicts of Interest

The authors declare no conflict of interest.

References

  1. Alzaman, C. Green supply chain modelling: Literature review. Int. J. Bus. Perform. Supply Chain Model. 2014, 6, 16–39. [Google Scholar] [CrossRef]
  2. Amin, S.H.; Zhang, G. Closed-loop supply chain network configuration by a multi-objective mathematical model. Int. J. Bus. Perform. Supply Chain Model. 2014, 6, 1–15. [Google Scholar] [CrossRef]
  3. Ikram, M.; Sroufe, R.; Mohsin, M.; Solangi, Y.A.; Shah SZ, A.; Shahzad, F. Does CSR influence firm performance? A longitudinal study of SME sectors of Pakistan. J. Glob. Responsib. 2019, 11, 27–53. [Google Scholar] [CrossRef]
  4. Fonseca, L.M.; Domingues, J.P.; Pereira, M.T.; Martins, F.F.; Zimon, D. Assessment of Circular Economy within Portuguese Organizations. Sustainability 2018, 10, 2521. [Google Scholar] [CrossRef] [Green Version]
  5. Lysenko-Ryba, K.; Zimon, D. Customer Behavioral Reactions to Negative Experiences during the Product Return. Sustainability 2021, 13, 448. [Google Scholar] [CrossRef]
  6. Li, S.; Ragu-Nathan, B.; Ragu-Nathan, T.S.; Subba Rao, S. The impact of supply chain management practices on competitive advantage and organizational performance. Omega 2006, 34, 107–124. [Google Scholar] [CrossRef]
  7. Cook, L.S.; Heiser, D.R.; Sengupta, K. The moderating effect of supply chain role on the relationship between supply chain practices and performance. Int. J. Phys. Distrib. Logist. Manag. 2011, 41, 104–134. [Google Scholar] [CrossRef]
  8. Le, T.T. The effect of green supply chain management practices on sustainability performance in Vietnamese construction materials manufacturing enterprises. Uncertain Supply Chain Manag. 2020, 8, 43–54. [Google Scholar] [CrossRef]
  9. De, D.; Chowdhury, S.; Dey, P.K.; Ghosh, S.K. Impact of Lean and Sustainability Oriented Innovation on Sustainability Performance of Small and Medium Sized Enterprises: A Data Envelopment Analysis-based framework. Int. J. Prod. Econ. 2020, 219, 416–430. [Google Scholar] [CrossRef]
  10. Yildiz Çankaya, S.; Sezen, B. Effects of green supply chain management practices on sustainability performance. J. Manuf. Technol. Manag. 2019, 30, 98–121. [Google Scholar] [CrossRef]
  11. Näyhä, A.; Horn, S. Environmental sustainability—aspects and criteria in forest biorefineries. Sustain. Account. Manag. Policy J. 2012, 3, 161–185. [Google Scholar] [CrossRef]
  12. Goyal, S.; Routroy, S.; Shah, H. Measuring the environmental sustainability of supply chain for Indian steel industry. Bus. Process Manag. J. 2018, 24, 517–536. [Google Scholar] [CrossRef]
  13. Martínez-Jurado, P.J.; Moyano-Fuentes, J. Lean Management, Supply Chain Management and Sustainability: A Literature Review. J. Clean. Prod. 2014, 85, 134–150. [Google Scholar] [CrossRef]
  14. Yang, M.G.M.; Hong, P.; Modi, S.B. Impact of lean manufacturing and environmental management on business performance: An empirical study of manufacturing firms. Int. J. Prod. Econ. 2011, 129, 251–261. [Google Scholar] [CrossRef]
  15. Hofer, C.; Eroglu, C.; Rossiter Hofer, A. The effect of lean production on financial performance: The mediating role of inventory leanness. Int. J. Prod. Econ. 2012, 138, 242–253. [Google Scholar] [CrossRef]
  16. Iranmanesh, M.; Zailani, S.; Hyun, S.; Ali, M.; Kim, K. Impact of Lean Manufacturing Practices on Firms’ Sustainable Performance: Lean Culture as a Moderator. Sustainability 2019, 11, 1112. [Google Scholar] [CrossRef] [Green Version]
  17. Govindan, K.; Azevedo, S.G.; Carvalho, H.; Cruz-Machado, V. Impact of supply chain management practices on sustainability. J. Clean. Prod. 2014, 85, 212–225. [Google Scholar] [CrossRef]
  18. Bandehnezhad, M.; Zailani, S.; Fernando, Y. An empirical study on the contribution of lean practices to environmental performance of the manufacturing firms in northern region of Malaysia. Int. J. Value Chain Manag. 2012, 6, 144–168. [Google Scholar] [CrossRef]
  19. Green, K.W.; Inman, R.A.; Sower, V.E.; Zelbst, P.J. Impact of JIT, TQM and green supply chain practices on environmental sustainability. J. Manuf. Technol. Manag. 2019, 30, 26–47. [Google Scholar] [CrossRef]
  20. Jum′a, L. The effect of value-added activities of key suppliers on the performance of manufacturing firms. Pol. J. Manag. Stud. 2020, 22, 231–246. [Google Scholar] [CrossRef]
  21. Zimon, D. ISO 14001 and the creation of SSCM in the textile industry. Int. J. Qual. Res. 2020, 14, 739–748. [Google Scholar] [CrossRef]
  22. Ikram, M.; Sroufe, R.; Rehman, E.; Shah SZ, A.; Mahmoudi, A. Do quality, environmental, and social (QES) certifications improve international trade? A comparative grey relation analysis of developing vs. developed countries. Phys. A Stat. Mech. Its Appl. 2020, 545, 123486. [Google Scholar] [CrossRef]
  23. Imperatives, S. Report of the World Commission on Environment and Development: Our Common Future; United Nations: New York, NY, USA, 1987. [Google Scholar]
  24. Marshall, D.; McCarthy, L.; Heavey, C.; McGrath, P. Environmental and social supply chain management sustainability practices: Construct development and measurement. Prod. Plan. Control 2015, 26, 673–690. [Google Scholar] [CrossRef]
  25. Baliga, R.; Raut, R.D.; Kamble, S.S. Sustainable supply chain management practices and performance. Manag. Environ. Qual. Int. J. 2019, 31, 1147–1182. [Google Scholar] [CrossRef]
  26. Panigrahi, S.S.; Bahinipati, B.; Jain, V. Sustainable supply chain management. Manag. Environ. Qual. Int. J. 2019, 30, 1001–1049. [Google Scholar] [CrossRef]
  27. Chardine-Baumann, E.; Botta-Genoulaz, V. A framework for sustainable performance assessment of supply chain management practices. Comput. Ind. Eng. 2014, 76, 138–147. [Google Scholar] [CrossRef]
  28. Wisner, P.S.; Epstein, M.J.; Bagozzi, R.P. Environmental proactivity and performance. Adv. Environ. Account. Manag. 2009, 4, 105–127. [Google Scholar] [CrossRef]
  29. Sendawula, K.; Bagire, V.; Mbidde, C.I.; Turyakira, P. Environmental commitment and environmental sustainability practices of manufacturing small and medium enterprises in Uganda. J. Enterp. Communities People Places Glob. Econ. 2020. [Google Scholar] [CrossRef]
  30. Vu, T.T.; Dang, V.T.W. Environmental Commitment and Firm Financial Performance: A Moderated Mediation Study of Environmental Collaboration with Suppliers and CEO Gender. Int. J. Ethics Syst. 2020. [Google Scholar] [CrossRef]
  31. Singh, R.K.; Modgil, S.; Tiwari, A.A. Identification and evaluation of determinants of sustainable manufacturing: A case of Indian cement manufacturing. Meas. Bus. Excell. 2019, 23, 24–40. [Google Scholar] [CrossRef]
  32. Ikram, M.; Zhou, P.; Shah, S.A.A.; Liu, G.Q. Do environmental management systems help improve corporate sustainable development? Evidence from manufacturing companies in Pakistan. J. Clean. Prod. 2019, 226, 628–641. [Google Scholar] [CrossRef]
  33. Shamout, S.; Boarin, P.; Wilkinson, S. The shift from sustainability to resilience as a driver for policy change: A policy analysis for more resilient and sustainable cities in Jordan. Sustain. Prod. Consum. 2021, 25, 285–298. [Google Scholar] [CrossRef]
  34. Abu Hajar, H.A.; Tweissi, A.; Abu Hajar, Y.A.; Al-Weshah, R.; Shatanawi, K.M.; Imam, R.; Murad, Y.Z.; Abu Hajer, M.A. Assessment of the municipal solid waste management sector development in Jordan towards green growth by sustainability window analysis. J. Clean. Prod. 2020, 258, 120539. [Google Scholar] [CrossRef]
  35. Al-Ghwayeen, W.S.; Abdallah, A.B. Green supply chain management and export performance: The mediating role of environmental performance. J. Manuf. Technol. Manag. 2018, 29, 1233–1252. [Google Scholar] [CrossRef]
  36. Abdallah, A.B.; Al-Ghwayeen, W.S. Green supply chain management and business performance: The mediating roles of environmental and operational performances. Bus. Process. Manag. J. 2019, 26, 489–512. [Google Scholar] [CrossRef]
  37. Menor, L.J.; Kristal, M.M.; Rosenzweig, E.D. Examining the Influence of Operational Intellectual Capital on Capabilities and Performance. Manuf. Serv. Oper. Manag. 2007, 9, 559–578. [Google Scholar] [CrossRef]
  38. Boon-itt, S.; Yew Wong, C. The moderating effects of technological and demand uncertainties on the relationship between supply chain integration and customer delivery performance. Int. J. Phys. Distrib. Logist. Manag. 2011, 41, 253–276. [Google Scholar] [CrossRef]
  39. Zimon, G. Financial Liquidity Management Strategies in Polish Energy Companies. Int. J. Energy Econ. Policy 2020, 10, 365–370. [Google Scholar] [CrossRef]
  40. Feng, M.; Yu, W.; Wang, X.; Wong, C.Y.; Xu, M.; Xiao, Z. Green supply chain management and financial performance: The mediating roles of operational and environmental performance. Bus. Strategy Environ. 2018, 27, 811–824. [Google Scholar] [CrossRef] [Green Version]
  41. King, A.; Lenox, M. Exploring the Locus of Profitable Pollution Reduction. Manag. Sci. 2002, 48, 289–299. [Google Scholar] [CrossRef] [Green Version]
  42. Eng Ann, G.; Zailani, S.; Abd Wahid, N. A study on the impact of environmental management system (EMS) certification towards firms’ performance in Malaysia. Manag. Environ. Qual. Int. J. 2006, 17, 73–93. [Google Scholar] [CrossRef]
  43. Renukappa, S.; Akintoye, A.; Egbu, C.; Goulding, J. Carbon emission reduction strategies in the UK industrial sectors: An empirical study. Int. J. Clim. Chang. Strateg. Manag. 2013, 5, 304–323. [Google Scholar] [CrossRef]
  44. Russo, M.V.; Fouts, P.A. A Resource-Based Perspective on Corporate Environmental Performance and Profitability. Acad. Manag. J. 1997, 40, 534–559. [Google Scholar] [CrossRef] [Green Version]
  45. Luo, X.; Bhattacharya, C.B. The Debate over Doing Good: Corporate Social Performance, Strategic Marketing Levers, and Firm-Idiosyncratic Risk. J. Mark. 2009, 73, 198–213. [Google Scholar] [CrossRef] [Green Version]
  46. Malhotra, N.K. Marketing Research: An Applied Orientation, 6th ed.; Prentice Hall: Upper Saddle River, NJ, USA, 2010. [Google Scholar]
  47. Hair, J.F.; Black, W.C.; Babin, B.J.; Anderson, R.E. Multivariate Data Analysis: A Global Perspective, 8th ed.; Cengage Learning (EMEA): Andover, UK, 2019. [Google Scholar]
  48. Creswell, J.W. Research Design: Qualitative, Quantitative, and Mixed Methods Approaches, 3rd ed.; Sage Publications: Thousand Oaks, CA, USA, 2009. [Google Scholar]
  49. Sekaran, U.; Bougie, R. Research Methods for Business a Skill-Building Approach; John Wiley & Sons: Chichester, UK, 2016. [Google Scholar]
  50. Ringle, C.M.; Wende, S.; Becker, J.-M. 2015 “SmartPLS 3.” Boenningstedt: SmartPLS GmbH. Available online: http://www.smartpls.com (accessed on 5 January 2021).
  51. Cox, T.F. An Introduction to Multivariate Data Analysis (Neuausg); Wiley: Hoboken, NJ, USA, 2005. [Google Scholar]
  52. Claes, F.; Larcker, D.F. Evaluating structural equation models with unobservable variables and measurement error. J. Mark. Res. 1981, 18, 39–50. [Google Scholar]
  53. Byrne, B.M. Structural Equation Modeling with AMOS: Basic Concepts, Applications, and Programming; Routledge: New York, NY, USA, 2013. [Google Scholar]
  54. Schumacker, R.E.; Lomax, R.G. A Beginner′s Guide to Structural Equation Modeling; Psychology Press: New York, NY, USA, 2004. [Google Scholar]
  55. Lin, C.; Chow, W.S.; Madu, C.N.; Kuei, C.-H.; Pei, Y.P. A structural equation model of supply chain quality management and organizational performance. Int. J. Prod. Econ. 2005, 96, 355–365. [Google Scholar] [CrossRef]
  56. Madzík, P. Capture and evaluation of innovative ideas in early stages of product development. TQM J. 2019, 31, 908–927. [Google Scholar] [CrossRef]
  57. Hristov, I.; Appolloni, A.; Chirico, A.; Cheng, W. The role of the environmental dimension in the Performance Management System: A systematic review and conceptual framework. J. Clean. Prod. 2021, 126075. [Google Scholar] [CrossRef]
  58. Zimon, G.; Dankiewicz, R. Trade Credit Management Strategies in SMEs and the COVID-19 Pandemic—A Case of Poland. Sustainability 2020, 12, 6114. [Google Scholar] [CrossRef]
Figure 1. Conceptual framework.
Sustainability 13 02152 g001
Figure 2. Type of firms.
Sustainability 13 02152 g002
Figure 3. Structural Equation Modelling results. SSP = Strategic supplier partnership, CR = Customer relationship, IS =, Level of information sharing IQ =, Level of information quality PP = Postponement, ES = Environmental sustainability, FP = Financial performance.
Sustainability 13 02152 g003
Table 1. Definitions of Supply Chain Management (SCM) practices dimensions.
DimensionsDescription
Strategic supplier partnershipThe partnership among the company and its stakeholders over the long term. It is intended to harness strategic capabilities and operational capabilities of the participating suppliers to help them gain substantial continuing benefits.
Customer relationshipThe SC practices used for the managing the customer grievances, strongly building the customer long term relationship, and enhancing client satisfaction.
Level of information sharingThe degree to which sensitive and confidential information is shared with one’s partner of the supply chain.
Level of information qualityRefers to information which has timeliness, accurate, adequate and reputable.
PostponementThe method of transferring one or more tasks or activities forward (making, procurement and delivery) in the supply chain to a far later stage.
Table 2. Summary of SCM-related studies.
AuthorSCM SystemsPerformanceModerating/
Mediating Effect
Country/
Region
Li et al. (2006)SC activities, competitive
advantage
Organizational
performance
N/AUSA
Cook et al. (2011)SC PracticesOrganizational performanceSupply chain rolesNorth American
Yang et al. (2011)Lean SC
practices
Market performance & financial performance Environmental
Practices
International
Bandehnezhad et al. (2012)Lean SC practicesEnvironmental outcomeN/AMalaysia
Hofer et al. (2012)Lean SC practicesFinancial performanceInventory
leanness
USA
Govindan et al. (2014)Lean and green SCM practicesSupply chain sustainabilityN/APortugal
Al-Ghwayeen & Abdallah (2018)GSCMExport performanceEnvironmental performance Jordan
Feng et al. (2018)Green SC practicesFinancial performanceEnvironmental and operational performanceChina
Goyal et al. (2018)Environmental sustainability enablersCategories of SCN/AIndia
Abdallah & Al-Ghwayeen (2019)GSCMBusiness performanceEnvironmental and operational performanceJordan
Green et al. (2019)JIT, TQM and
green SC practices
Environmental performanceN/AUSA
Iranmanesh et al. (2019)SCM practicesSustainable performanceLean
culture
Malaysia
Yildiz Çankaya and Sezen (2019)Green SC practicesEconomic, environmental and social performanceN/ATurkey
De et al. (2020)Lean SC practices and sustainability-oriented innovation
(SOI)
Supply chain sustainabilitN/AIndia
Le (2020)Green SC practicesSustainable
performance
N/AVietnam
Table 3. Constructs and measurement items.
ConstructsCodeItems
Strategic supplier partnership (SSP)SSP1When we select suppliers, quality considered based on criterion
SSP2We have a centralized supplier complaint management system and operationalized at daily basis.
SSP3We give feedback to our suppliers in order to improve the quality of product.
SSP4We have incorporated the quality continuous management system and integrated with our key suppliers.
SSP5We have a standard operating procedure in which our suppliers are performing the key roles in planning process.
SSP6We fully involved our active suppliers in process of product development.
Customer relationship (CR)CR1We have a strong communication network with our customers which assist us to set reliability, responsiveness and to communicate with customers frequently
CR2We have a transparent customer satisfaction mechanism which measure the level of customer satisfaction on regular basis.
CR3We always focus on customer needs and expectation on regular basis.
CR4We have online customer care facility to assist customers.
CR5We assess the relationship with our customers periodically.
Level of information sharing (IS)IS1We timely share the changing needs in advance with our supply chain member.
IS2We have strong share propriety information system with or supply chain members.
IS3Our supply chain members keeping us fully up to date about business improvement opportunities.
IS4Our supply chain members interact and share knowledge with us about our core business processes.
IS5We have information sharing system with our supply chain members helps us in business planning.
IS6We have an effective business partnership with our supply chain members to keep informed about future events.
Level of information quality (IQ) IQ1We have timely exchange of information system between with supply chain members.
IQ2We have an transparent exchange of information between our supply chain members.
IQ3Information exchange between our supply chain members and us is complete.
IQ4Information exchange between our supply chain members and us is adequate.
IQ5We have reliable and accountable Information exchange mechanism with our supply chain members.
Postponement (PP)PP1Our products are designed for sub-assembly activities that leads to assembly modulation.
PP2Our manufacturing and supply chain designed on Just in time process and we postpone final product until customer orders received.
PP3We delay product assembly activities at final stage until the last possible location (or nearest to customers) in the supply chain.
Environmental sustainability (ES)ES1Improvement of a firm’ environmental situation.
ES2Reduction in water waste and/or solid waste.
ES3Reduction in air emission.
ES4Decrease the usage of hazardous/harmful/toxic materials.
ES5Decrease environmental accidents frequency.
Financial performance (FP)FP1Compared to last 3 years ago: Return on Sales (ROS).
FP2Compared to last 3 years ago: Return on Investment (ROI).
FP3Relative to our main competitor(s): Return on Sales (ROS).
FP4Relative to our main competitor(s): Return on Investment (ROI).
Table 4. Profile of the respondents.
CategorySubcategoryFrequency (n)Percent (%)
GenderMale33589.1
Female4110.9
Work experienceLess than 5 Years10527.9
5–10 Years15340.7
More than 10 Years11831.4
Education levelDiploma degree154.0
Bachelor’s degree30881.9
Master’s degree and above5314.1
PositionFirst-line managers27071.8
Middle managers6517.3
Top managers4110.9
Number of employeesLess than 2013736.4
20–9919251.1
100 and more4712.5
Table 5. Descriptive statistics of survey data (N = 376).
ConstructMeanStd.
Deviation
SkewnessStd.
Error
KurtosisStd.
Error
Strategic supplier partnership3.970.93−1.9970.1263.4860.251
Customer relationship4.181.07−1.7960.1261.9510.251
Level of information sharing4.020.89−2.1320.1263.4910.251
Level of information quality3.880.89−1.7260.1262.9200.251
Postponement3.960.91−1.6800.1263.0300.251
Environmental sustainability3.870.99−1.4860.1262.0780.251
Financial performance3.350.74−1.2650.1261.7780.251
Table 6. Collinearity statistics.
Latent VariablesEnvironmental SustainabilityFinancial Performance
ToleranceVIFToleranceVIF
Strategic supplier partnership0.5741.7430.5741.743
Customer relationship0.5831.7150.5831.715
Level of information sharing0.5111.9570.5111.957
Level of information quality0.5501.8180.5501.818
Postponement0.9051.1050.9051.105
Table 7. Results of measurement model analysis.
Latent VariablesItemsFactor LoadingsCronbach’s
Alpha
Composite ReliabilityAverage Variance Extracted (AVE)
Strategic supplier partnershipSSP10.9410.9650.9710.850
SSP20.921
SSP30.904
SSP40.938
SSP50.928
SSP60.898
Customer relationshipCR10.9530.9720.9780.898
CR20.949
CR30.931
CR40.950
CR50.955
Level of information sharingIS10.9070.9450.9560.785
IS20.857
IS30.858
IS40.912
IS50.885
IS60.894
Level of information qualityIQ10.9370.9630.9710.871
IQ20.944
IQ30.927
IQ40.944
IQ50.913
PostponementPP10.9580.9550.9710.917
PP20.966
PP30.949
Environmental sustainabilityES10.9580.9780.9830.919
ES20.960
ES30.967
ES40.954
ES50.955
Financial performanceFP10.7860.8220.8820.652
FP20.783
FP30.832
FP40.827
Table 8. Discriminant validity (Fornell–Larcker criterion).
1234567
1. Customer relationship0.948
2. Environmental sustainability0.4950.959
3. Financial performance0.4700.6990.807
4. Level of information quality0.5470.5420.4640.933
5. Level of information sharing0.5800.5760.5110.5820.886
6. Postponement0.2360.5330.4940.2290.2300.958
7. Strategic supplier partnership0.4870.4440.4760.5540.5760.2810.922
Note: The diagonal elements are the square root of AV and the off-diagonal elements are the correlation between constructs.
Table 9. Discriminant validity (Heterotrait-Monotrait Ratio—HTMT).
1234567
1.Customer relationship
2.Environmental sustainability0.507
3. Financial performance0.5240.779
4. Level of information quality0.5640.5570.519
5. Level of information sharing0.6060.5990.5800.610
6. Postponement0.2440.5510.5560.2390.242
7. Strategic supplier partnership0.5010.4560.5330.5740.6020.293
Table 10. Results of structural model analysis (direct effect).
Direct PathsPath Coefficients (β)T Statisticsp-ValuesResults
H1: Strategic supplier partnership → Environmental sustainability−0.0200.3810.703Rejected
H2: Customer relationship → Environmental sustainability0.1152.1670.030 *Accepted
H3: Level of information sharing → Environmental sustainability0.3006.2140.000 *Accepted
H4: Level of information quality → Environmental sustainability0.2264.9940.000 *Accepted
H5: Postponement → Environmental sustainability0.3917.1160.000 *Accepted
H6: Strategic supplier partnership → Financial performance0.1333.2240.001 *Accepted
H7: Customer relationship → Financial performance0.0901.8660.062Rejected
H8: Level of information sharing → Financial performance0.0741.4090.159Rejected
H9: Level of information quality → Financial performance0.0120.2360.813Rejected
H10: Postponement → Financial performance0.1733.8130.000 *Accepted
H11: Environmental sustainability → Financial performance0.4547.6240.000 *Accepted
Note: * p < 0.05, based on two-tailed test; t = 1.96.
Table 11. Results of structural model analysis (indirect effect).
Indirect EffectPath Coefficients (β)T Statisticsp ValuesResults
H12a: Strategic supplier partnership → Environmental sustainability → Financial performance−0.0090.3800.704Rejected
H12b: Customer relationship → Environmental sustainability → Financial performance0.0522.1490.032Accepted
H12c: Level of information sharing → Environmental sustainability → Financial performance0.1364.7440.000Accepted
H12d: Level of information quality → Environmental sustainability → Financial performance0.1034.4210.000Accepted
H12e: Postponement → Environmental sustainability → Financial performance0.1774.6000.000Accepted
Table 12. Coefficient of determination (R square).
Latent VariablesR SquareR Square AdjustedComment
Environmental sustainability0.5510.545Moderate
Financial performance0.5520.545Moderate
Table 13. F Square.
Table 13. F Square.
Latent VariablesEnvironmental SustainabilityFinancial Performance
Customer relationship0.0170.010
Environmental sustainability 0.207
Level of information quality0.0630.000
Level of information sharing0.1020.006
Postponement0.3080.046
Strategic supplier partnership0.0010.022
Table 14. Construct cross-validated redundancy.
Latent VariablesSSOSSEQ2 (=1-SSE/SSO)
Customer relationship1880.0001880.000
Environmental sustainability1880.000937.7850.501
Financial performance1504.000981.2870.348
Level of information quality1880.0001880.000
Level of information sharing2256.0002256.000
Postponement1128.0001128.000
Strategic supplier partnership2256.0002256.000
Publisher’s Note: MDPI stays neutral with regard to jurisdictional claims in published maps and institutional affiliations.

