Abstract
Sustainability and social responsibility are goals that are currently aimed for by companies, entities and institutions as well as national and international agendas. In a globalized and highly connected world, the achievement of both goals must be pursued. This means more than mere compliance with agendas approved by national and international agencies; it means that all of these entities, each in their own field and area of responsibility, become co-responsible for their own social, environmental and economic situation. Because of this co-responsibility, their decisions and activities must contribute to the deployment of a jointly responsible and sustainable model of innovation, development and social transformation. In this context, this article aims to propose a model based on the principles of total quality management that will make it possible to explore the degree of territorial social responsibility and sustainability linked to the companies and institutions of a territory. The validity of this model is based on the application of the model of the European Foundation for Quality Management (EFQM) and its applicability to all types of organizations. The empirical validation was carried out in the specific region of Girona (Spain) with the participation of the University Social Responsibility (USR) Chair of the University of Girona (UdG).
1. Introduction
Social responsibility and sustainability are currently very poplar ideas. Since 1953, when Howard R. Bowen [1] called for corporate social responsibility (CSR) in Social Responsibilities of the Businessman, the concept has evolved considerably. Bowen’s idea considered CSR in terms of production as well as giving back to society. The term is now perceived as the responsibility of companies and institutions towards the impact of their activities and decisions on employees, society and the environment. Over the last 20 years, the concept has been extended, giving rise to a set of terms that define the promotion of social responsibility in all areas of society: corporate social responsibility (CSR), administrative social responsibility (ASR), university social responsibility (USR) and territorial social responsibility (TSR). All these concepts share the notion that organizations and institutions are co-responsible for their social, environmental and economic situation. This co-responsibility is understood as the capacity to contribute to a model of innovation, development and social transformation in a responsible, supportive and sustainable way [2].
The concept of sustainability appeared for the first time in the United Nations Brundtland Report in 1987 [3], which warned, for the first time, about the negative environmental consequences of economic development and globalization. A few years later, in 1992, the Rio Summit was held, and the term “sustainable development” (SD) was globalized, giving rise to the approval of United Nations Agenda 21, a comprehensive plan of action which led to the Johannesburg Summit on Sustainable Development (2002), the Rio Summit (2012) and the New York Summit (2015). The most recent edition in New York approved the 2030 Agenda for Sustainable Development and the application of the Sustainable Development Goals (SDG). Consequently, sustainability is now a concept that is underpinned by three essential pillars—environmental protection, social development and economic growth—extending across all activities and objectives of the 2030 Agenda.
Sustainability and social responsibility (SR) are closely related. Both concepts underline the importance of assessing the impact of an activity itself on different stakeholders, but sustainability makes several key additions to the definition of CSR by including a long-term vision of the exercise of responsibility and by highlighting areas of particular importance if sustainability is to be achieved. As with the environment, resources used by the company are not unlimited, nor can the environment in which the company operates absorb the whole impact of its productive activity. This is why business sustainability is part of an organization’s social responsibility and must be translated into a specific management vision and strategic plan [4].
The social responsibility of businesses and institutions refers to the set of business practices that meet or exceed the economic, legal, ethical and philanthropic expectations of society, including the relationship of the organization as a whole with its stakeholders [5]. For that reason, economic and social agents increasingly agree that companies must provide benefits to society and have instruments in place through which they are able to measure both the positive and negative impacts of their daily economic activity. Sustainable Development Goal 12 of the 2030 Agenda focuses on responsible production and consumption by calling for cooperation between all actors in society, encouraging businesses and institutions to unite in a common effort. To achieve this objective, it is necessary to apply reliable management models that share fundamental principles and philosophies.
As discussed above, CSR is intrinsically linked to the concept of sustainability and the management of the economic, social and environmental impacts of the activities of organizations. Some previous studies [5,6,7] suggest that quality management practices lead environmental management development, require ethical behavior and a stakeholder focus and may facilitate the development of socially responsible activities. Consequently, SR principles have been integrated into quality management systems such as the widely-used EFQM (European Foundation for Quality Management) Excellence Model and the ISO standards. The EFQM is a management framework which provides a blueprint for organizations to develop a management philosophy based on a global strategy for delivering quality products, services and processes, as well as creating quality relationships with their environment and stakeholders [8]. Medne’s [8] study suggests that the EFQM Excellence Model could provide a comprehensive overview with which to identify the implementation of advancement activities on the road to SR [8] and management practices compatible with the ideals of social responsibility [5].
Although the literature recognizes the relationship between SR and the principles of total quality management (TQM) [5,9], no previous studies have adapted and applied the EFQM excellence model to portray a territory in an attempt to assess its level of TSR and sustainability. Against this background, this article has the following objectives: (1) to propose a model for measuring TSR and sustainability based on the EFQM Excellence Model, and (2) to analyze the relevance of the proposed model in a certain region. To achieve the proposed objectives, the EFQM Excellence Model 2013 was taken as a reference for two main reasons: (1) previous findings have identified the relevance of the EFQM model to influence social, technical and strategic factors with social results [5] and sustainable development [9]; and (2) it is the most widely-used model to implement TQM principles. The latest version of the 2020 EFQM model includes a specific “society results” criterion [9] setting out an explicit approach to sustainability.
This study is divided into five sections. The introduction is followed in Section 2 by a literature review in which the principles and approaches of TQM, CSR and TSR are analyzed, the proposed model is presented by explaining the EFQM model in detail and the research questions to be tested are presented. This is followed in the next section by the methodology and data analysis description. The results presented in Section 4 are followed in the final section by discussion and related conclusions, indicating limitations and future research lines.
2. Theoretical Background and Research Questions
2.1. Corporate Social Responsibility (CSR): Principles and Models
To date, there is no universal or academically accepted definition of CSR, as Mikołajek-Gocejna [10] explains. However, one of the most widely-used definitions is that of the World Business Council for Sustainable Development (WBCSD), according to which CSR is “the continuing commitment by business to behave ethically and contribute to economic development while improving the quality of life of the workforce and their families as well as of the local community and society at large” [11]. Several authors have recently suggested that it might be more accurate not to use the term CSR, because of the tendency to associate the word corporate with large companies, when in fact small-medium-sized enterprises (SMEs) also have a major role to play [12]. In SMEs, for instance, CSR policies come from personal motivations in contrast to other motivations such as a marketing approach. Therefore, when a firm engages in socially responsible activities, the owner–manager is the person responsible for the development and implementation of those activities [13]. CSR is the practice by which a business, no matter its size or number of employees, views itself as a member of society with certain implicit social obligations regarding environmental considerations and issues [13]. Several scholars have offered some classifications of the concept based on the chronological development of CSR and have summarized the evolution of cooperation phenomena between businesses [14].
Yevdokimova [14] shares and reinforces the CSR concept from the viewpoint of four categories of cooperation phenomena between business and society developed by Garriga and Mele [15]. The first category includes instrumental theories, whereby economic goals are achieved through social activities assuming that enterprises are instruments for wealth creation. The second group includes political theories, whereby responsible business power is used responsibly in the political arena. This group of theories assumes that the social power of enterprises leads them to accept some social duties by cooperating. The third group includes integrative theories, which are concentrated on the integration of social needs. Integrative theories show that businesses must integrate social demands because they depend on society to survive and grow. Last but not least, Yevdokimova [14] and Garriga and Mele [15] propose a fourth group consisting of ethical theories. The ethical theories are concentrated on the appropriate means of attaining the goal of a good society. Therefore, companies must assume responsibilities determined by the ethical values that are implicit in the business–society relationship. This last point, according to Calvo-Mora et al. [5], is one of the greatest points of coincidence between CSR and TQM principles, because of the ethical foundation of both models [16]. The ethical principles of both models, CSR and TQM, together with the entrepreneur’s principles and leadership style enhance the organization and all its processes and outcomes [5].
Corporate social responsibility has been studied widely, evolving from the philanthropic activities of business entrepreneurs to becoming a strategic component of business policies. Today, these policies are understood as a much broader concept which includes sustainable development, defined by the 2030 Agenda as “development that meets the needs of the present without compromising the ability of future generations to meet their own needs” [17]. To expand the comprehension and applicability of the contemporary CSR construct, scholars such as Mikołajek-Gocejna [10] have embraced the ESG factors (environment, society and governance) and refer to “sustainability or sustainable development, which encompasses social welfare, protection of the environment, efficient use of natural resources, and economic well-being” [10], (p. 70).
Other authors such as Galetska et al. [18] also understand CSR in a broader sense, as a reflection of society’s values, involving different stages of responsibility (legal, economic, professional, moral, political, etc.) and agree on the need for business models that take SD into account and uphold long-term commitments to society. To create shared value, the interests of stakeholders and citizens must be known, and new trends and current challenges must be incorporated into business management [12]. The above-mentioned stages of social responsibility can be summarized into three groups of key elements of CSR, according to Calvo-Mora et al. and Galetska et al. [5,18]:
- The external environment (relationships with the community, consumers, suppliers and shareholders): Concerning the social dimension of CSR, analyzing the external environment is a practice that allows stakeholders’ needs to be determined and balanced [19].
- The internal environment (the culture of environmental protection, working conditions, empowerment and involvement): Both the external and internal environment are linked with enterprises’ responsibilities to employees and society [19].
- Ethical awareness (codes of behavior and ethical values): A study developed by Valentine and Barnett [20] explains that higher levels of organizational commitment to employees largely depend on the awareness of the existence of an ethical code. However, this relationship could be mediated by factors such as the values of the organization or the culture [19].
As mentioned Rodriguez-Gomez et al. [19], the implementation of human resources principles in social responsibility models is perceived as part of the social dimension. The implementation of these principles depends on the role of the state and the mechanism of interaction between social relations subjects. Researchers point to at least three different models: the European, American and Japanese CSR models [21]. In the American model, state intervention in the economy is limited, and social responsibility (SR) mainly takes the form of philanthropy or patronage. SR is understood as a voluntary action. In the Japanese model, attention is focused on the company’s internal environment, and the role of the state is significant. In contemporary Europe, however, three models of SR coexist and are conditioned by the national and religious values of the society of each country [21]. The Central European model (Austria, Germany and France) combines business autonomy with a high level of regulation of social and labor relations. In Northern Europe (Belgium, Norway and Sweden), on the other hand, the state regulates social and labor relations at individual, business, and state levels. Finally, the United Kingdom model combines the American model with that of continental Europe. This plurality of models has also been detected in the analysis developed by Diaz-Carrion et al. [22] about socially responsible human resource management (SR-HRM).
Regardless of the models used to implement CSR, in recent decades, we have seen how companies have made greater commitments to society and increased their degree of responsibility, in many cases exceeding what is established by the regulations in their countries. The motivations are diverse: the particular interests of shareholders and their need to participate in the construction of an effective CSR system because of the benefits it brings [23], the altruistic inclination of the region and the benefits associated with socially responsible activity [24] or greater concern for sustainable development goals [25]. Nonetheless, the SR trend represents an opportunity for greater engagement and involvement by all social and business actors involved in economic growth.
2.2. Territorial Social Responsibility (TSR): Sustainable Regions and Corporate Involvement
As the interest of scholars and society in sustainability and SD increases, greater numbers of articles are being published on the subject. Most of these articles are concerned with environmental and agricultural sciences; a smaller number focus on economic sciences [4]. Many articles refer to SD, differentiating between urban [26], rural [5,27,28,29], mining and industrial areas [30,31]. However, SD increasingly requires more multidisciplinary studies that provide new proposals to enhance the capacities of territories to adapt to and resolve overall economic problems [4]. A more integrative approach would involve satisfying social needs such as poverty, social exclusion and unemployment, taking into consideration the economic, social, environmental and political–institutional variables of sustainability [32].
The SD of regions must allow industries to develop while respecting the ecological and environmental situation of their surroundings and the preservation of the region’s resources [29], which can be used for sustainable territorial development [33]. The establishment of public–private partnerships at a regional level can contribute to improving the quality of economic growth [34].
The productive transformation of territories in response to SDG must be supported by institutional policies that promote the creation of alliances and networks involving the participation of all the agents involved [35]. In this respect, a number of authors suggest that territory should be understood as a “socially concerted development project” or “shared resource”, giving CSR a territorial vision [30]. TSR, therefore, “is not just the responsibility of the sum of individuals and institutions” [31]; rather, it means planned action for a sustainable future, which involves a process of profound reflection and social action [30]. Territorial responsibility begins with the production of territorial development plans with strong communication bridges between stakeholders [36] to establish the indicators that encapsulate the needs of the region [37] and establish a combination of market mechanisms and government regulation [30]. As argued in [38], the development of a region is also conditioned by the development of its neighboring regions, and therefore there is a need for policy coordination at both regional and national levels.
The SR of a region’s business network can contribute positively to the sustainability of the territory, but this relationship will only be effective if it is fully integrated at all organizational levels [39]. Indeed, sustainable companies with positive economic profits set an example for SMEs in both emerging and developed markets [40] and contribute to the promotion of SR values. CSR has become an organizational competitiveness factor that can have a long-term impact in the areas in which it operates, developing mutually beneficial relations with the community and improving the public image of companies [27]. Furthermore, the inclusion of territorial vision as an element of CSR can help to avoid the generation of conflicts between business and society [35]. As explained by Tantalo et al. [13], the implicit social obligations in relation to environmental, people (society) and economic considerations and issues have a voluntary nature, depending on the enterprise’s capability to integrate them, and must be perceived as an instrument for value creation.
2.3. The Territorial Responsibility of Enterprises and the EFQM Excellence Model
The EFQM model is a set of guidelines for excellence to assist self-evaluation and continuous improvement in the business environment. Although the model has recently been updated, it continues to be based on three fundamental pillars: (1) customer focus, (2) stakeholder focus and (3) understanding the cause–effect relationships between companies’ actions and their results. The EFQM model is flexible and can be applied to all companies, from the largest to the smallest [41,42,43], independently of the sector in which they operate, whether public [8] or private [44].
The EFQM model seeks to identify the strengths and weaknesses of organizations by focusing on the relationship between personnel, processes and results. Until its recent redefinition, the model consisted of nine criteria, organized into enablers (enabling agents) and four results, as shown in Figure 1. In the EFQM excellence model, each criterion is broken down into several sub-criteria, and each sub-criterion is illustrated with various “guidance points” in order to explain what enterprises have to do in order to accomplish the criteria [45] assessed by following the RADAR (Results–Approach–Deploy–Assess–Refine) logic. For more information, Appendix A includes an exhaustive description of the criteria and sub-criteria of the EFQM model of excellence. The model is based on self-assessment; in other words, it depends on a comprehensive and regular review of an organization’s activities and results against the criteria of the model [45]. The RADAR assessment and management tool is the evaluation method used to score organizations applying for the EFQM Excellence model, where 50% of the points available are allocated to the enablers and 50% are allocated to the results. This is to ensure that an organization can sustain this performance into the future, because when an organization’s performance improves over time, its score against the model will increase [41].
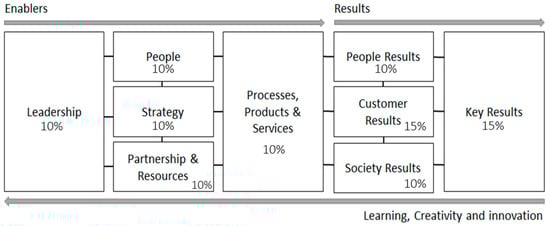
Figure 1.
The European Foundation for Quality Management (EFQM) excellence model. Source: EFQM, 2013.
For this study, the authors used the 2013 EFQM model. This was because, when the research began, the new 2020 model was still emerging and organizations were in a process of transition. The previous version, on the other hand, was well established for both organizations and institutions, and there were clear examples of its successful implementation. The EFQM model focuses on the achievement of standards of excellence through the principles of leadership, the formulation of policies and strategies for the achievement of quality and the proper direction of resources and personnel by orienting all company processes to the customer. These processes seek customer and staff satisfaction, as well as a positive impact on society and excellent economic results that allow the organization to maintain a sustained competitive advantage.
The basic premise of the model is that processes drive and release the skills of staff to produce certain results. In other words, leadership, policy and strategy, partnerships, resources, people and processes are agents that enable certain results. The enablers are the facilitating agents that explain how excellence in results that support the strengths of the organization is achieved. The results are what the company has achieved with respect to overall performance, customers, people and society (see Figure 1).
Self-evaluation within the EFQM model can be undertaken according to at least five different approaches; however, the basic tool used during the evaluation process is the RADAR (Results–Approach–Deploy–Assess–Refine) logic. Companies that implement the model focus on Approach, Deploy, Assess and Refine elements to evaluate the performance of the criteria that make up the group of agents, while the Results element evaluates the performance of the criteria that make up the results group. The RADAR logic is considered a variant of the PDCA (Plan–Do–Check–Act) improvement cycle, with the most significant difference between the two being the cause–effect relationship between the processes. As pointed out by Calvo-Mora et al. [5], according to the RADAR model, the results (Results) required must be determined before planning (Approach) can take place [41].
The pursuit of business excellence is closely related to CSR [41]. In the economic dimension, this relationship involves achieving profitability while benefiting the end-client with competitive prices and delivering high-quality products. In the social dimension, it involves leadership and human resources factors such as the compensation of employees at market levels, motivation through continuous training and work–family conciliation plans. In the environmental dimension, a company that manages its processes by focusing on excellence assumes responsibility for the waste it produces, ensuring that waste is responsibly treated and recycled where possible.
The incorporation of the principles of innovation and creativity, as illustrated in the EFQM model, allows organizations to commit to clean production and to support the community to promote development within their range of action. Given the fact that the quest for business excellence comprises CSR principles based on ethical criteria, transparency and responsibility of the agent’s action [42], a model for excellence management seems to be an appropriate starting point. Despite researchers having postulated that linkages exist between excellence management, social responsibility and sustainability, the usage of those linkages in order to test the social responsibility of a territory has been unspecified. The EFQM Excellence Model, as the most widely-used model for the implementation of TQM principles, and therefore excellence, includes the most significant aspects of CSR in an analysis of social impact, as pointed out by Calvo-Mora et al. [5].
In particular, questions such as “How can enterprises and institutions in the territory of Girona assess their sustainable management practices to contribute to territorial sustainability, and how can these commonalities be used to aid the territory in the diagnosis of the territorial sustainability?” represent some gaps that we aim to address. These questions are focused on a particular region, which is the region of Girona, in Catalonia, Spain; through the Chair of University Social Responsibility of the University of Girona, a close link is maintained with companies and institutions in the territory. Measuring territorial sustainability is an issue that encourages companies, governments and institutions to work together.
These questions summarize how the TQM excellence model positively influences the social responsibility of both enterprises and institutions, which then positively impacts territorial sustainability. The strength of this latter set of relationships is contingent on the extent to which enterprises and institutions believe they are accountable for working in collaboration with each other. The research questions are answered under the earlier edition of the EFQM framework, despite the greater emphasis on sustainability of the current version.
3. Methodology
3.1. Data Collection and Measures
In this research, the sample included enterprises and institutions located in Girona (Spain) committed to the SD of the territory. The data collection process for the empirical analysis consisted of a self-administered online survey designed with the Survey Monkey Tool, based on the EFQM Excellence Model and delivered to a sample of 120 enterprises in different sectors and governmental and non-governmental institutions (up to 250 or more employees/volunteers). The survey consisted of 14 questions in two separate sections for enablers and results criteria, two additional sections collected data on the social function of the organization and number of employees/volunteers, and a final section invited respondents to provide comments and contact information. To encourage the participation of businesses and institutions, the website designed to house the survey offered a sweepstakes dinner, which took place in a recognized restaurant for a small number of employees/volunteers.
The selection of enterprises and institutions was justified in that TSR requires corporate involvement as well as the active participation of institutions appealing for their creativity and innovation to create value for the common good [25]. Despite the historical dissension between business and nonprofit organizations in relation to environmental issues, both types of organizations currently demonstrate collaborative behaviors [43]. Business alliance partners often include at least one nonprofit organization. Moreover, in addition to their economic goals, businesses have begun to include non-economic goals that address social issues [44]. The selection of companies and SMEs, nonprofit and governmental institutions is further justified by the fact that, when a business enters into cooperation with organizations that may seem antagonistic by definition, the aim goes beyond competitive positioning and becomes instead a network of shared values for territorial competitiveness.
Because we intended to analyze TSR, the survey targeted managers and strategically-placed employees, or in the absence of these, employees with higher expertise who also played a key role in decision implementation. To select a representative sample, a deep search was conducted from the University Social Responsibility (USR) Chair of the University of Girona (UdG), selecting enterprises and institutions with their headquarters in the territory of Girona to assess solid territorial networks and the expression of TSR. The sample was sufficiently representative considering its nonprobability character because it accurately represented the target population.
Girona has registered 124 solidarity and cooperation institutions, 80 sports institutions, 205 cultural institutions, 10 women’s rights and elderly associations, 17 environmental associations and three associations for immigration. The obtained sample included all these types of organizations, as well as government institutions and enterprises. For the purpose of the study, which was the first attempt to explore the TSR of the region, the sample size was sufficient to accomplish this goal. Links to the survey were sent by email. A database of email addresses was built from the USR Chair and provided by Advisory Council members. The Advisory Council has 25 full-time members from Girona’s business landscape, nonprofit institutions, governmental institutions, local entrepreneurs and faculty members. This diverse composition ensured a balanced representation of the sensitivities and values common to the territory.
Since its foundation in 2013, the UdG’s USR Chair has concentrated its efforts on fostering social responsibility in all university spheres with close links to the business landscape. Besides, the USR Chair includes financial entities such as Santander Bank as well as the Girona City Hall and Provincial Council. The Chair is an active member of the USR committee of the Catalan Public Universities Association (in Spanish, ACUP) and the ORSALC-IESALC-UNESCO regional observatory.
3.1.1. Measures
The measures used to obtain the data were both perception measures and performance indicators representing the enablers and results of the EFQM excellence model. With regard to the aim of the EQM excellence model, scholars highlighted it is a generic model that allows TQM to be defined and described in a way which management can easily understand and thereby improve the management of an organization’s quality systems [45]. Therefore, for the EFQM model to be useful in assessing territorial sustainability, it was necessary to adjust the criteria and results. This adaptation was firstly based on the analysis of the literature concerning the impact that the different criteria included in the model could have on SD and CSR, for example [5,6,7,8,10,22,23,24,25,26].
The survey resulting from the adapted model was sent to enterprises and SEMs, as well as to government institutions and non-profit organizations. This characteristic of the population partially conditioned the number of questions. Besides, the questions had to be sufficiently generic to be answered by all different social actors. The objective was to design the smallest number of questions per criterion that allowed as much information as possible about the application of the criteria in the sample to be obtained. Given these facts, enabling agents included in four of the five EFQM excellence model criteria and eight of the 19 sub-criteria, while results included three of the four criteria and six of the 13 sub-criteria. An extensive review enabled the identification of the main dimensions that could be included in the study, especially following the findings of both the empirical studies developed by Calvo-Mora et al. [5,6]. However, this is the first time that the EFQM excellence model has been adapted to portray the current situation of a territory regarding its SD, and so the items were developed by the authors of this article based on the factors (criterion) initially gathered. Next, these factors were integrated and reduced in number, retaining the most significant that best corresponded to the conceptualizations of TSR. A panel of experts assessed the appropriateness of removing or rewriting some of the items in each interaction in order to adapt them to the context. Thus, the survey which aimed to explore territorial sustainability was then developed (see Figure 2).
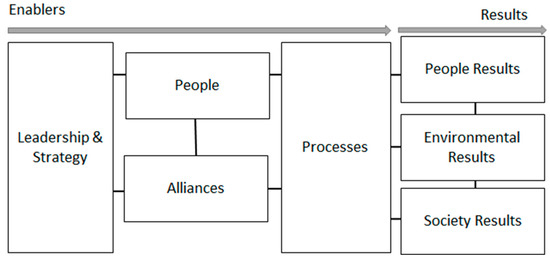
Figure 2.
Adapted EFQM excellence model. Source: Own elaboration.
The final operational measure grouped attributes into two main factors: enablers and results. The enabler factor encompassed four dimensions: strategy and leadership, people, processes and alliances, while the result factor identified three dimensions from which enterprises elicit SD—environmental impact, impact on people and social impact—by adapting the distribution of the EFQM excellence model to facilitate integrating and reducing items. Regarding the factor of “enablers”, the strategy and leadership factors were covered in a single dimension because the EFQM model management philosophy strives for excellence of outcomes with respect to organizational performance under a leadership that is able to drive and encourage business strategy and policy (See Appendix A).
Perception measures categorized the possible perceptions of an organization into four areas: strategy and leadership, people, processes and alliances, instead of partnerships and resources. The results simplified the performance measures into three areas: environmental impact, person-related impacts and social impact. The five enabler factors (that is, how an organization achieved its results) covered everything that an organization has to do and the way it does it, in each of the four areas defined above. On the other hand, the “results” criteria (that is, the results achieved) referred to the organization’s successes in terms of performance and impact. Results became a consequence of the enabler’s management, and as such, they mapped the relationships involved that were worthy of further inquiry in the TSR context.
The dimensions representing the EFQM factors adapted to TSR, as well as the variables for measurement, are shown in Table 1. All indicators were measured by applying a Likert-type scale from 1 to 5, where 1 showed “totally disagree” and 5 represented “totally agree”.

Table 1.
Measurement model description. SR: social responsibility.
3.1.2. Dependent Variables
Territorial social responsibility is measured in terms of economic, environmental and social impact. Therefore, the dependent variables are identified in Table 1 as the “results”. This measure indicates the performance of the mechanism of influence of socially responsible business activities on the socio-economic development of a region, as Zhang et al. [46] explain. According to these authors, economic effects are connected to the expansion of the financial basis of regional and local budgets [46], because socially responsible behavior by business leaders stimulates the creation of new jobs, a commodity mass and additional social programs [47]. The effect on the environment is mainly seen in terms of maintaining biodiversity, minimizing the production impact on the environment and the proper management of resources used in the production process [37]. Another common measure of TSR is the social effect, understood as the improved quality of life of the local community [48] through increased wellbeing. A positive effect for the three criteria improves the image and social stability of the region in the long term.
3.1.3. Independent and Control Variables
The independent variables are identified in Table 1 as the “enablers”. The TSR variable is the main variable of interest for this study. The socially responsible practices adopted by local enterprises and institutions as an expression of local development improving the economic, social, and environmental situation are considered in the enabler variable. As indicated by Rusciano et al. [26], TSR responds to the needs of citizens [49] and is a form of governance cultivated through the diffusion of CSR and sustainability-oriented strategies which are promoted by networks of local actors whose policies are oriented toward SD. The process of local development for sustainability is based on the use of endogenous resources [4] and the notion of common goals to improve quality of life.
The number of employees/volunteers was considered as a control variable and was included to control potential differences in levels of TSR [50] by the influence of staff commitment. To do so, in the data preparation phase, a binary variable based on the number of employees/volunteers was created by considering those enterprises/institutions with (0) more employees than volunteers or no volunteers at all, or (1) more volunteers than employees or no employees at all.
3.1.4. Demographic Information of the Sample
The respondents were enterprises and institutions with their headquarters in Girona which provided a sample size of n = 62. Of the 65 questionnaires completed, 95.38% were valid. The high response index was due to the online nature of the questionnaires, which represented 100% of the total. Table 2 includes the description of the type of organizations involved in the study. Enterprises made up 35.5% (22) of the sample, 27.4% (17) were associations, 14.5% (9) were foundations and 21% (13) were government administration bodies (See Table 2).
Table 2.
Types of organizations in the sample.
Table 3 and Table 4 show the frequency distribution of the number of employees and/or volunteers. Table 3 describes the number of volunteers in each case according to the participants in the study. This table is a reflection of the partnership potential of the Girona area through volunteering. For this study, employees were those who had an employment contract in the analyzed entity; therefore, they received a salary for the work they performed. On the other hand, volunteers were those who carried out some unpaid activity either with or within an organization.
Table 3.
Frequency distribution of the volunteers.
Table 4.
Frequency distribution of the employees.
Among all the organizations studied, 26 out of the 62 enterprises/institutions did not have any volunteers working with them. These 26 cases were distributed as follows: 12 were enterprises, three were associations, three were foundations and seven were government institutions. However, nine enterprises had between one and 50 volunteers, and one enterprise had more than 250 volunteers. Besides, among those surveyed, government administrations had a medium number of volunteers on their staff. None of the associations surveyed had more than 250 volunteers.
Most of the organizations that said that they had volunteers were enterprises (22), associations, foundations and cooperatives (27) and local administrations (13). The activities carried out by some organizations differed in that volunteers linked to companies were involved in the projects of other organizations to which the companies provided support both financially and with company staff. This staff participated on a completely voluntary basis at their own expense or with working hours paid for by the company. In general, they were involved in social and community volunteering projects, dedicated to eradicating poverty and supporting disabled or vulnerable people. On the other hand, volunteers from associations, foundations, cooperatives or administrations acted based on their own solidarity and cooperation projects, whose fields of action were focused on the following:
- Social volunteering: They worked with people who found it difficult to integrate into society—the elderly, the disabled, immigrants, drug addicts, convicts, among others.
- Community volunteering: They facilitated the integration of people into the life of the community—neighborhood associations, community centers, sports clubs, poverty, and support for women, exclusion, support for the sick, disability and development cooperation.
- Cultural volunteering: They participated in educational activities, transmitting knowledge (conferences, courses, etc.), developing creative activities (theatre, music, etc.) or carrying out research tasks.
- Environmental volunteering: Their intervention focused on nature—the detection and awareness of environmental problems, protection of animals and plants and waste control.
- International volunteering: Intervening in favor of underdeveloped countries, either in situations of armed conflict, refugees, humanitarian catastrophes or through technical advice or contributions to economic campaigns to carry out their development.
Focusing on the number of employees at the organizations (Table 4), seven of the surveyed groups declared no workers at their organization. It should be noted that most of the participants had an organizational size of between 1 and 50 employees and were thus considered as SMEs, and only two of the firms were large. In total, only three foundations had more than 250 employees. Finally, with regard to associations and enterprises, six out 17 and one out of 22, respectively, had no employees as part of their staff.
Lastly, the descriptive statistics of the variables are shown in Table 5. Analyzing the coefficients of the skewness and kurtosis, the data studied did not fulfill the requirements of a normal distribution.
Table 5.
Descriptive statistics of dependent and independent variables (n = 62).
4. Results
4.1. Data Analysis: Correlation Coefficients of the Variables
The Spearman’s coefficients between the independent variables were calculated (see Table 6). The coefficients showed that the independent variables were significantly related (p < 0.01). The variable (AL1) describing how an organization ensured that the partners and suppliers were managed for a sustainable benefit and the variable (HR2) describing whether an organization cared about their employees’ work–family conciliation had the highest correlation coefficient (0.79, p < 0.01). The same variable (HR2) and the second variable in the alliances dimension (AL2) measuring the capability of the organization to develop alliances in an ethical and fair way were also closely related (0.52, p < 0.01). Significant and positive correlations (p < 0.01) were likewise obtained between the other variables. Therefore, the dependent variables indicated that, although they were separate indicators, they provided a broad comprehension of the enablers’ factors.
Table 6.
Correlation analyses of the independent variables (n = 62).
Focusing on the dependent variables, the Spearman’s coefficients were also calculated and are shown in Table 7. The variable (EI1) describing the sustainable use of the resources shows the highest correlations with the rest of the variables; for instance, the variable ST1, which captures organizations’ efforts to encourage their employees to participate in volunteering (0.57, p < 0.01). The same STI variable is highly correlated with the PTI variable, which describes the degree to which the organization cares about protecting consumers beyond the legal requirements imposed by the markets in where they operate (0.55, p < 0.01). Significant and positive correlations at different levels were likewise obtained between the remaining dependent variables, providing information about the strength and direction of the association between them.
Table 7.
Correlation analyses of the dependent variables (n = 62).
4.2. Ordinal Logistic Regression (OLR)
Regression analysis is one of the most useful methods to identify the significant factors influencing a phenomenon [51], and this can be applied to the identification of TSR. Within the umbrella of regression, there are a few methods such as logistic regression (LR) that have been proposed as an alternative to the ordinary regression; this is one of the few options available to researchers when some dependent variables have a binary nature. One major issue when using standard regression is that standard regression may result in probability predictions that are negative or larger than 100% [52]. Logistic regression fits a logistic curve to the relationship between x and y when y is binary and x is numerical. The simple logistic model description is as follows:
where π is the probability of the outcome of the interested variable, is the intercept of Y and β is the slope parameter. The logic of the simple logistic regression has been extended to multiple predictors as follows [53]:
Although this is the most traditional logistic regression model, others are suitable for non-binary dependent variables; for instance, when the dependent variable is categorical, whether ordered or unordered. When the dependent variable is categorical but does not have a specific ranking, it is generally preferable to apply the multinomial logistic regression (MLR) model, while if the dependent variable is categorical and ranked, it is generally preferable to use the Ordinal Logistic Regression model (ORL) [54], even though MLR allows data involving ordered categorical dependent variables.
Ordinal logistic regression produces a single set of regression coefficients to estimate relationships between independent and dependent variables. Compared to MLR, OLR generates a more parsimonious representation of the data. Ordinal logistic regression is a better option for ordered, categorical dependent variables as long as it fulfills the proportional odds assumption, which states that the relationship between the dependent and the independent variable is constant, independently of the comparison group [54]. Therefore, considering that the dependent variables included in this study, and in general all the variables that made up the study, were measured using Likert-type scales, the solution that fits best, according to the data, is to apply an ORL model. According to Osborne [54], the model ORL could be described as follows:
Then, applying the ORL general model to this study,
where:
is the probability that a company/institution exhibits a particular result (i.e., a social result);
is the intercept;
, … are the coefficients (effects) of enablers factors;
, … are the variables of the enablers factors.
The research models were tested as shown in Figure 3 by considering the independent variables (enablers) as the predictor variables contributing to each one of the dependent variables (results). Thus, six models were investigated in order to study the influence of the predictors on the six dependent variables.
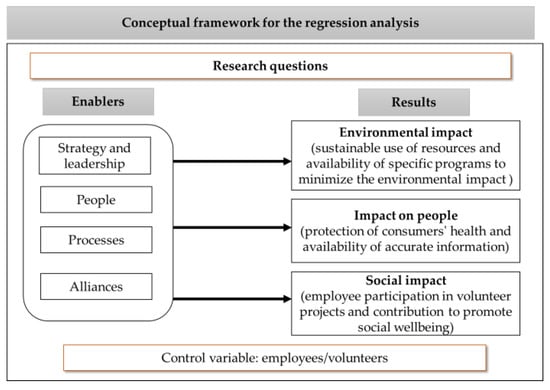
Figure 3.
Conceptual framework.
Model building
The 62 cases of enterprises and institutions were analyzed using SPSS Version 24 by applying the ORL model (logit) for all the variables. The link function was the logit link function because, in ordinal categorical dependent variable models, the responses have a natural ordering and response probabilities depend on the individual predictors. The aim of this function is to take a linear combination of the covariate values (which may take any value between ±∞) and convert those values to the scale of probability; i.e., between 0 and 1 [55]. On the other hand, the ordered categories are based on the Likert type scales defined in the study, which means that the intercept of Y depends of these categories. As mentioned by MacKenzie et al. [55], with an ordinal response (Y) probabilities are set for which the response is one of r different response levels given by the data. Given this fact, each curve at the series of parallel logistic curves has the same design parameters but a different intercept. The methodology employed enabled the authors to assess the impact of the different results (i.e., environmental results) as dependent variables.
4.2.1. Environmental Results
The first OLR analysis was conducted to investigate how enterprises and institutions in the territory of Girona assessed their sustainable management practices to contribute to territorial sustainability considering the environmental impacts (EI1 and EI2), and its results are shown in Table 7. The predicted variables were tested a priori to verify that there was no violation of the assumption of no multicollinearity. The predictor variables ST1, PM2 and HR1 in the OLR analysis were found to contribute to the model by influencing the variable EI1. Here, the binary variable “employees” (taking into account the number of employees) presented a positive and significant impact on environmental results. On the other hand, the predictor variables HR1 and AL1 in the OLR analysis were found to contribute to the model by influencing the variable EI2.The estimated regression coefficients, standard deviation (SE), Wald test, significance and confidence interval at 95% for these two models are summarized in Table 8.
Table 8.
Ordinal logistic regression (OLR) regression output predicting EI1 and EI2 from enablers.
Analyzing the model estimations, it could be interpreted that ST1, PM2 and HR1 were significantly positive predictors of the sustainable use of resources (EI1). Therefore, for every unit increase of the independent variables ST1, PM2 and HR1, there was a predicted increase (0.707, 0.735 and 0.680), respectively, in the odds of an enterprise/institution being in a higher (as opposed to lower) category regarding the sustainable use of resources (EI1). More generally, this indicated that an enterprise/institution that scored higher regarding the availability of an adequate professional/team responsible for SR activities, quick response to complaints and appeals and the encouragement to workers to take additional training were more likely to exhibit a greater sustainable use of resources. Similarly, enterprises/institutions that also scored higher for additional training (HR1) and in deploying purchasing criteria to guarantee origins, environmental care and socially fair production were more likely to exhibit a higher development of specific programs to minimize environmental impact. Nevertheless, the survey did not include any specific question to determine the number of environmental projects in which enterprises/institutions had been involved.
Regardless of this, the control variable introduced in the model (EM) was a significant positive predictor. Since “employees” is a binary variable, the slope represents the difference in log-odds between cases of enterprises/institutions operating with “more employees than volunteers or no volunteers at all” or with “more volunteers than employees or no employees at all”. The log-odds of being at a higher level of the sustainable use of the resources was 1755 points higher on average for those who operated with “more employees than volunteers or no volunteers at all” as compared to those who operated with “more volunteers than employees or no employees at all”.
Table 8 also shows the goodness-of-fit indices for both models. Concerning the goodness-of-fit indices, there is a significant difference between the model established with the independent variables and the initial model indicating a relationship between the dependent and independent variables. The model fit information provides a Pearson’s chi-square value and deviation chi-square value that indicates a significant improvement in the fit of the final model relative to the intercept-only model (higher than 0.05). To validate whether the tested models showed a good data fit, Deviance and Pearson’s Chi-square tests were used as complementary tests. Non-significant results are indicators that the model is a good fit for the data, according to Petrucci [56]. This author concurs with Osborne [54] in that coefficients do not necessarily agree, as is the case for the tested models. Nevertheless, both Pearson and Deviance tests were non-significant, suggesting a good model fit.
Ordinal logistic regression assumes that all the relationships among the independent variables are the same for every comparison containing the dependent variables [54]. Applying the parallel line test is therefore related to the proportional odds derived from that assumption; thus, non-significant results indicate that the assumption is satisfied. In the results from the tested models, we considered the assumption of proportional odds to be satisfied. Finally, there were no major concerns regarding the fit of the models against the thresholds-only model, which was an overall good fit. Lastly, the parallel line test indicates that organizations/institutions contribute to territorial sustainability by developing practices that positively influence the environment. Finally, regardless of the pseudo R2 value, taking into consideration Nagelkerke’s R2 value, the independent variables in the first model explain at least 47% of the dependent variables, and in the second case at least 45%.
4.2.2. Social Results
The second OLR analysis was conducted to investigate how enterprises and institutions in the territory of Girona could assess their sustainable management practices to contribute to territorial sustainability considering social impacts (SI1 and SI2), and its results are shown in Table 8. As in the first analysis, the predicted variables were tested a priori to verify that there was no violation of the assumption of no multicollinearity. The predictor variables ST2, PM1 and HR1 in the analysis were found to contribute to the model by influencing the variable SI1. Here, the control variable “employees” was not a significant predictor. On the other hand, the predictor variables ST1 and PM1 in the OLR analysis were found to contribute to the model by influencing the variable SI2. The estimated regression coefficients, standard deviation (SE), Wald test, significance and confidence interval at 95% for these two models are summarized in Table 9.
Table 9.
OLR regression output predicting SI1 and SI2 from enablers.
The first model in Table 9 allows it to be stated that ST2, PM1 and HR1 were significantly positive predictors of the encouragement tasks carried out for enterprises/institutions in order their employees to participate in volunteering activities (EI1). Therefore, for every unit increase of the independent variables ST2, PM1 and HR1, there was a predicted increase (1.588, 0.871 and 0.586, respectively) in the odds of an enterprise/institution being in a higher (as opposed to lower) category of relevant decisions made at all levels by considering SR criteria (EI1). More generally, this indicates that an enterprise/institution that scored higher in terms of encouraging tasks for volunteering participation, the application of equality criterion to recruitment processes and the encouragement to workers to take additional training were more likely to indicate a more accurate decision-making process at all levels considering the SR criteria. This fact is important as it highlights the higher estimate regression coefficient of the ST2 variable as well as that the variable PM1 is a common predictor of both dependent variables (SI1 and SI2). Finally, the pseudo R2 value, considering Nagelkerke’s R2 value, led us to interpret that the independent variables in the first model explain at least 62% of the dependent variables, and in the second case at least 26%.
The second model tested the predictor variables ST1 and PM1 in the OLR analysis, which were found to contribute to the model by influencing the variable SI2. Therefore, an enterprise/institution that scored higher in terms of supporting the management process in an adequate professional/team responsible for SR activities and applying equality criteria was more likely to indicate a greater contribution to campaigns and projects that promote social wellbeing. As in models one and two, Table 9 summarizes the fit indices analyzed. There is no evidence in the indices that would compromise the acceptance of the model. The fit indices are within the accepted parameters.
4.2.3. Results on People
The third OLR analysis was conducted to investigate how enterprises and institutions in the territory of Girona could assess their sustainable management practices to contribute to territorial sustainability considering results on people (PI1 and PI2) and is shown in Table 10. The same procedure was developed to test the assumption of no multicollinearity. In this analysis, the predictor variables PM1 and AL2 were found to contribute to the model by influencing the variable PI1. As in the previous model, the control variable “employees/volunteers” was not a significant predictor. For the dependent variable PI2, the predictor variables PM2, HR2 and Al2 were found to contribute to the model by influencing the variable PI2. Table 9 summarizes the coefficients for the model and the fit indices of both models.
Table 10.
OLR regression output predicting PI1 and PI2 from enablers.
The first model in Table 9 allows it to be stated that PM1 and AL2 were significant positive predictors of the protection of consumers’ health beyond the legal requirements imposed by the nature of the operations of the company/institution (PI1). Therefore, for every unit increase of the independent variables PM1 and AL2, there was a predicted increase (1.203, 0.753, respectively) in the odds of an enterprise/institution being in a higher (as opposed to lower) category of consumer health protection (PI1). This means that an enterprise/institution that scored higher regarding the application of equality criterion to the recruitment processes and the performance of their activities legally and fairly was more likely to exhibit a greater level of protection of consumer health. Besides, it should be highlighted that the variable AL2 is a common predictor of both dependent variables (PI1 and PI2). Finally, the pseudo R2 value, from Nagelkerke’s R2 value led us to interpret that the independent variables in the first model explain at least 40% of the dependent variables, and in the second case at least 53%.
The tested model for PI2 revealed that the predictor variables PM2, HR2 and AL2 in the OLR analysis were found to contribute to the model by influencing the variable PI2. Therefore, an enterprise/institution that scored higher regarding the application of equality criteria, responding quickly to complaints and appeals and reliably developing their activities was more likely to indicate more complete and accurate information about their products/services to consumers. Table 10 summarizes the fit indices analyzed, which are within the accepted parameters.
5. Discussion and Conclusions
In this study, OLR was applied to determine whether the sustainable management practices of enterprises/institutions contributed to territorial sustainability. This is because there is still a certain degree of uncertainty about how the concept of TSR and corporate social responsibility (CSR) can be determined and the exact meaning of the terms. For this purpose, the TQM excellence model was adapted in an attempt to draw, through the participation of different agents of the territory of Girona, a picture of its level of sustainability. The first step was to review and adapt the dimensions of the EFQM excellence model concerning the overall performance of organizations and the contributions they make to the environment, people, and society.
The adoption of an excellence-based view of TSR and sustainability in organizations and institutions enables the identification of already established and little-considered mechanisms that are shown to be suitable by the application of the model. This approach provides an improved analysis of the model, considering eight enablers divided into four dimensions: strategy and leadership, people, processes and alliances. The results support the predictive power of the adapted EFQM model as a framework for the assessment of the level of TSR, with the consequent impact of EFQM’s intrinsic principles of SR and sustainability on the results of organizations and institutions. Results support previous findings in the literature such as those exposed by Spence et al. [57], Tencati et al. [58] and Tentalo et al. [13] when explaining that “the involvement of the firms in local communities affects the choice of the firm to focus on socially responsible behaviors”. Spence defends the importance of social capital and informal relationships for the success of firms, which are closely related with the behaviors of honesty and integrity.
Given this fact, the interpretation of the results, regardless of the results on people, supports the application of equality criterion to recruitment processes and the conduction of the enterprises/institution legally and fairly as well responding quickly to complaints and appeals with honest concern for consumers and transparency in the information to which those consumers have access. The studies of Spence et al. [57] and Tencati et al. [58] also highlighted the key role played by employees in generating commitment to the enterprises, particularly if those enterprises are SMEs. This commitment is not only developed by the employee but also by their families, which influences the wellbeing of society members. Therefore, the results of this study are consistent in that they confirm that organizations/institutions that score higher regarding the encouragement of employees for volunteering participation and for additional training were likely to integrate the SR criteria in the decision-making process at all levels and to contribute to campaigns and projects that promote social wellbeing and consequently the TSR.
Regarding the relationships between the independent and dependent variables established by the analysis, it is clear that some of the enablers have a greater impact on a given outcome. This fact is consistent with the cause–effect relationships between companies’ actions and their excellent results that the EFQM excellence model aims to determine. For instance, the availability of a professional or a team involved in SR activities or the encouragement of workers to undergo additional training seems to affect all results greatly, meaning that these enablers were considered in almost all results. The findings support the notion that, to achieve excellence in social, environmental, and people-related results, the EFQM excellence model should include a set of enablers or practices confirmed by the principles and the systemic nature of TQM [5,59].
Thus, the adapted EFQM excellence model could be considered useful in the assessment of TSR through the implementation of business excellence in socially responsible practices. Nevertheless, more research is needed to assign a score to each facilitator so that a quantitative result would be possible.
The SR regional entrepreneurial network benefits from the relationships established by the analysis, as several actors of the territory participated, and the evidence of practices that contribute positively to its sustainability. At this point, it is too early to say whether the network is fully integrated at all organizational levels. Nevertheless, organizations, institutions and government administration bodies seem to identify working for people, society and the environment through similar mechanisms.
The main academic implication of this study is its contribution to highlighting the need for the consideration of the adapted TQM excellence model for measuring TSR and sustainability, given that all organizations are continuously striving for excellence and survival in a changing environment. Otherwise, the main limitation of the study is its focus on a single region, although the results are well fitted according to the parameters of the applied analysis and the model has been adapted from a highly generalized model that has been validated by numerous researchers [Reference]. The results should, therefore, be interpreted with caution, and more empirical validation is needed. Future research should also consider other factors to confirm the relationship between the dependent and independent variables, exploring and comparing enterprises and institutions separately.
Author Contributions
Conceptualization, D.E.R.; methodology, D.E.R.; writing—original draft preparation, D.E.R., M.R.T.P., M.H.B.M.; writing—review and editing, D.E.R., M.R.T.P., M.H.B.M. All authors have read and agreed to the published version of the manuscript.
Funding
This research received no external funding.
Institutional Review Board Statement
Not applicable.
Informed Consent Statement
Informed consent was obtained from all subjects involved in the study.
Data Availability Statement
Not applicable.
Acknowledgments
A previous version of the present article was presented at the 4th International Conference on Quality Engineering and Management. The authors are grateful for the support and data provided by the University Social Responsibility (USR) Chair of the University of Girona (UdG).
Conflicts of Interest
The authors declare no conflict of interest.
Appendix A
Table A1.
Criterion and description in the EFQM Excellence model. Source EFQM excellence model 2013.
Table A1.
Criterion and description in the EFQM Excellence model. Source EFQM excellence model 2013.
| Criteria | Definition | Sub-Criterio |
|---|---|---|
| Leadership | Excellent organizations have leaders who shape the future and make it happen, acting as role models for its values and ethics and inspiring trust at all times. They are flexible, enabling the organization to anticipate and react in a timely manner to ensure the on-going success of the organization. | 1a. Leaders develop the Mission, Vision, Values and ethics and act as role models. 1b. Leaders define, monitor, review and drive the improvement of the organization’s management system and performance. 1c. Leaders engage with external stakeholders. 1d. Leaders reinforce a culture of excellence with the organization’s people. 1e. Leaders ensure that the organization is flexible and manages change effectively. |
| Strategy | Excellent organizations implement their Mission and Vision by developing a stakeholder focused strategy. Policies, plans, objectives and processes are developed and deployed to deliver the strategy. | 2a. Strategy is based on understanding the needs and expectations of both stakeholders and the external environment. 2b. Strategy is based on understanding internal performance and capabilities. 2c. Strategy and supporting policies are developed, reviewed and updated. 2d. Strategy and supporting policies are communicated, implemented and monitored. |
| People | Excellent organizations value their people and create a culture that allows the mutually beneficial achievement of organizational and personal goals. They develop the capabilities of their people and promote fairness and equality. They care for, communicate, reward and recognize, in a way that motivates people, builds commitment and enables them to use their skills and knowledge for the benefit of the organization. | 3a. People plans support the organization’s strategy. 3b. People’s knowledge and capabilities are developed. 3c. People are aligned, involved and empowered. 3d. People communicate effectively throughout the organization. 3e. People are rewarded, recognized and cared for |
| Partnerships & Resources | Excellent organizations plan and manage external partnerships, suppliers and internal resources in order to support their strategy, policies and the effective operation of processes. They ensure that they effectively manage their environmental and societal impact | 4a. Partners and suppliers are managed for sustainable benefit. 4b. Finances are managed to secure sustained success. 4c. Buildings, equipment, materials and natural resources are managed in a sustainable way. 4d. Technology is managed to support the delivery of strategy. 4e. Information and knowledge are managed to support effective decision-making and to build the organization’s capability. |
| Processes, Products & Services | Excellent organizations design, manage and improve processes, products and services to generate increasing value for customers and other stakeholders. | 5a. Processes are designed and managed to optimize stakeholder value. 5b. Products and services are developed to create optimum value for customers. 5c. Products and services are effectively promoted and marketed. 5d. Products and services are produced, delivered and managed. 5e. Customer relationships are managed and enhanced. |
| Customer Results | Excellent organizations achieve and sustain outstanding results that meet or exceed the needs and expectations of their customers. | 6a. Perceptions (Perceptions of: Reputation and image, product and service value, product and service delivery, customer service, relationship and support, customer loyalty and engagement). 6b. Performance indicators (i.e., product and service delivery, customer service, relationships and support, complaints handling, involvement of customers and partners in the design of products, processes, etc.). |
| People Results | Excellent organizations achieve and sustain outstanding results that meet or exceed the needs and expectations of their people. | 7a. Perceptions (perceptions of: satisfaction, involvement and engagement, motivation and empowerment, leadership and management, competency and performance management, training and career development, effective communications, working condition, etc.). 7b. Performance indicators (i.e., involvement and engagement activities, competency and performance management activities, leadership performance, training and career development activities, internal communications, etc.) |
| Society Results | Excellent organizations achieve and sustain outstanding results that meet or exceed the needs and expectations of relevant stakeholders within society | 8a. Perceptions (perceptions of: environmental impact, image and reputation, societal impact, workplace impact, awards and media coverage, etc.). 7b. Performance indicators (i.e., environmental, economic and societal activities, regulatory and governance compliance, health and safety performance, responsible sourcing and procurement performance, etc.). |
References
- Bowen, H.R. Social Responsibilities of the Businesman; University of Iowa Press: Iowa, IA, USA, 2013; pp. 3–245. [Google Scholar]
- Voegtlin, C.; Scherer, A.G. Responsible innovation and the innovation of responsibility: Governing sustainable development in a globalized world. J. Bus. Ethics 2017, 143, 227–243. [Google Scholar] [CrossRef]
- Holden, E.; Linnerud, K.; Banister, D. Sustainable development: Our common future revisited. Glob. Environ. Chang. 2014, 26, 130–139. [Google Scholar] [CrossRef]
- Milán-García, J.; Uribe-Toril, J.; Ruiz-Real, J.L.; de Pablo Valenciano, J. Sustainable local development: An overview of the state of knowledge. Resources 2019, 8, 31. [Google Scholar] [CrossRef]
- Calvo-Mora, A.; Domínguez-CC, M.; Criado, F. Assessment and improvement of organizational social impact through the EFQM Excellence Model. Total Qual. Manag. Bus. Excell. 2018, 29, 1259–1278. [Google Scholar] [CrossRef]
- Calvo-Mora, A.; Picón-Berjoyo, A.; Ruiz-Moreno, C.; Cauzo-Bottala, L. The relationships between soft-hard TQM factors and key business results. Int. J. Oper. Prod. Manag. 2014, 34, 115–143. [Google Scholar] [CrossRef]
- Tarí, J.J. Research into quality management and social responsibility. J. Bus. Ethics. 2011, 102, 623–638. [Google Scholar] [CrossRef]
- Medne, A.; Lapina, I.; Zeps, A. Sustainability of a university’s quality system: Adaptation of the EFQM excellence model. Int. J. Qual. Serv. Sci. 2020, 12, 29–43. [Google Scholar] [CrossRef]
- Withanachchi, N.; Handa, Y.; Karandagoda, K.K.W.; Pathirage, P.P.; Tennakoon, N.C.K.; Pullaperuma, D.S.P. TQM emphasizing 5-S principles: A breakthrough for chronic managerial constraints at public hospitals in developing countries. Int. J. Public Sect. Manag. 2007, 20, 168–177. [Google Scholar] [CrossRef]
- Mikołajek-Gocejna, M. The relationship between corporate social responsibility and corporate financial performance. Evidence from empirical studies. Comp. Econ. Res. 2016, 19, 67–84. [Google Scholar] [CrossRef]
- Najam, A. World business council for sustainable development: The greening of business or a greenwash? In Yearbook of International Cooperation on Environment and Development; Routledge: London, UK; Earthscan Publications Ltd.: London, UK, 2000; pp. 65–75. [Google Scholar]
- Lafuente Durán, D. (Ed.) 9 Necesarios Debates Sobre la Responsabilidad Social; 87 Reflexiones de Expertos; Editorial Comares: Granada, Spain, 2019. [Google Scholar]
- Tantalo, C.; Caroli, M.G.; Vanevenhoven, J. Corporate social responsibility and SME’s competitiveness. Int. J. Technol. Manag. 2012, 58, 129–151. [Google Scholar] [CrossRef]
- Yevdokimova, M.; Zamlynskyi, V.; Minakova, S.; Biriuk, O.; Ilina, O. The evolution of corporate social responsibility applied to the concept of sustainable development. J. Secur. Sustain. Issues 2019, 8, 473–480. [Google Scholar] [CrossRef]
- Garriga, E.; Melé, D. Corporate social responsibility theories: Mapping the territory. J. Bus. Ethics 2004, 53, 51–71. [Google Scholar] [CrossRef]
- Leonard, D.; McAdam, R. Corporate social responsibility. Qual Prog. 2003, 36, 7–33. [Google Scholar]
- Brundtland, G.H. Brundtland Report. Report of the World Commission on Environment and Development: Our Common Future. 1987. Available online: https://www.are.admin.ch/are/en/home/sustainable-development/international-cooperation/2030agenda/un-_-milestones-in-sustainable-development/1987--brundtland-report.html (accessed on 19 June 2020).
- Galetska, T.; Topishko, N.; Topishko, I. Corporate social activities in Germany: The experience of companies. Balt. J. Econ. Stud. 2019, 5, 17–24. [Google Scholar] [CrossRef]
- Rodriguez-Gomez, S.; Arco-Castro, M.L.; Lopez-Perez, M.V.; Rodríguez-Ariza, L. Where does CSR come from and where does it go? A review of the state of the art. Adm. Sci. 2020, 10, 60. [Google Scholar] [CrossRef]
- Valentine, S.; Barnett, T. Ethics code awareness, perceived ethical values, and organizational commitment. J. Pers. Sell. Sales Manag. 2003, 23, 359–367. [Google Scholar]
- Kolosok, A. Foreign experience of social responsibility of business and prospects of its application in Ukraine. Econ. J. East Eur. Natl. Lesia Ukr. Univ. 2015, 1, 15–19. [Google Scholar] [CrossRef][Green Version]
- Diaz-Carrion, R.; López-Fernández, M.; Romero-Fernandez, P.M. Evidence of different models of socially responsible HRM in Europe. Bus. Ethics 2019, 28, 1–18. [Google Scholar] [CrossRef]
- Zeng, J.; Lu, Y.; Xu, Q.; Yang, X. Housing demolition attention, social responsibility pressure of manager, and corporate value. Nankai Bus. Rev. Int. 2017, 8, 424–446. [Google Scholar] [CrossRef]
- Jha, A.; Cox, J. Corporate social responsibility and social capital. J. Bank Financ. 2015, 60, 252–270. [Google Scholar] [CrossRef]
- Van der Waal, J.W.; Thijssens, T. Corporate involvement in Sustainable Development Goals: Exploring the territory. J. Clean Prod. 2020, 252, 3–26. [Google Scholar] [CrossRef]
- Rusciano, V.; Scarpato, D.; Civero, G. Territorial social responsibility: A cluster analysis on a case study. Calitatea 2019, 20, 543–548. [Google Scholar]
- Šťastná, M.; Peřinková, V.; Pokorná, P.; Vaishar, A. New approach to sustainability in rural areas comprising agriculture practices–analysis of demonstration farms in the Czech Republic. Sustainability 2019, 11, 2906. [Google Scholar] [CrossRef]
- Calvo, G.; Hoyos, O.I.P.; Amaya, M.C.R. Miradas cruzadas sobre el enfoque territorial de la responsabilidad social, la gobernanza y la sostenibilidad. Rev. Opera 2020, 26, 3–14. [Google Scholar] [CrossRef]
- Vila, H.; Sklavounos, N.; Vergos, E.; Rotsios, K.; Shabanaj, H. The Impact of Corporate Social Responsibility Initiatives on Rural Community Development: The Case of TITAN–Sharrcem in Kosovo. Soc. Sci. 2020, 367–384. [Google Scholar] [CrossRef]
- Vasilyeva, I.A.; Morozova, N.V. Organizational and economic mechanism for the environmentally sustainable development of an industrialized region. In Proceedings of the International Session of Factors of Regional Extensive Development (FRED-2019), Irkutsk, Russia, 27 May–1 June 2019; pp. 492–495. [Google Scholar]
- Nunes Costa, M.A.; Doria Romeo Losicer, C.; Guerra Inácio de Oliveira, J.; Silva Faria, B. The Territorial Social Responsibility in the City of Volta Redonda, Brazil: The Case of CSN. In The Governance of Risk (Developments in Corporate Governance and Responsibility); Crowther, D., Aras, G., Eds.; Emerald Group Publishing Limited: Bingley, UK, 2013; Volume 5, p. 181. [Google Scholar] [CrossRef]
- Mora, M.J.; Martínez, F.R.M. Sustainable local development, corporate social responsibility and social entrepreneurship. Equidad Y Desarrollo 2018, 31, 27–46. [Google Scholar] [CrossRef]
- Voronkova, O.; Yankovskaya, V.; Kovaleva, I.; Epishkin, I.; Iusupova, I.; Berdova, Y. Sustainable territorial development based on the effective use of resource potential. Entrep. Sustain. Issues 2019, 7, 662–673. [Google Scholar] [CrossRef]
- Anopchenko, T.; Gorbaneva, O.; Lazareva, E.; Murzin, A.; Ougolnitsky, G. Modeling public—private partnerships in innovative economy: A regional aspect. Sustainability 2019, 11, 5588. [Google Scholar] [CrossRef]
- Fontana, A.; Sastre-Merino, S.; Baca, M. The territorial dimension: The component of business strategy that prevents the generation of social conflicts. J. Bus. Ethics 2017, 141, 367–380. [Google Scholar] [CrossRef][Green Version]
- Calvo, G.C.; Carvallo, P. From Social Responsibility towards Corporate Territorial Responsibility. In Proceedings of the 3rd International Conference on Social Responsibility in Mining, Antofagasta, Chile, 4–6 November 2015; pp. 1–10. [Google Scholar]
- Kalinka, M.; Geipele, S.; Pudzis, E.; Lazdins, A.; Krutova, U.; Holms, J. Indicators for the Smart Development of Villages and Neighbourhoods in Baltic Sea Coastal Areas. Sustainability 2020, 12, 5293. [Google Scholar] [CrossRef]
- Vaishar, A.; Šťastná, M. Smart village and sustainability. Southern Moravia case study. Eur. Countrys. 2019, 11, 651–660. [Google Scholar] [CrossRef]
- Nunhes, T.V.; Bernardo, M.; Oliveira, O.J.D. Rethinking the way of doing business: A reframe of management structures for developing corporate sustainability. Sustainability 2020, 12, 1177. [Google Scholar] [CrossRef]
- Das, M.; Rangarajan, K.; Dutta, G. Corporate sustainability in SMEs: An Asian perspective. J. Asia Bus. Stud. 2020, 14, 109–138. [Google Scholar] [CrossRef]
- EFQM. (2003, 2010, 2013, 2020). European Foundation for Quality Management. Available online: https://www.efqm.org/ (accessed on 25 June 2020).
- Suárez, E.; Calvo-Mora, A.; Roldán, J.L.; Periáñez-Cristóbal, R. Quantitative research on the EFQM excellence model: A systematic literature review (1991–2015). Eur. Res. Manag. Bus. Econ. 2017, 23, 147–156. [Google Scholar] [CrossRef]
- Ivanova, M.V.; Ul’yana, E.Y. The Formation of the Mechanism of Cooperation between Socially Responsible Business and Regional Authorities in the Arctic Zone of the Russia Federation. Econ. Soc. Chang. Facts Trends Forecast. 2020, 13, 56–69. [Google Scholar] [CrossRef]
- Berger, I.E.; Cunningham, P.H.; Drumwright, M.E. Social Alliances: Company/Nonprofit Collaboration. Calif. Manag. Rev. 2004, 47, 58–90. [Google Scholar] [CrossRef]
- Carlos Bou-Llusar, J.; Escrig-Tena, A.B.; Roca-Puig, V.; Beltrán-Martín, I. To what extent do enablers explain results in the EFQM excellence model? An empirical study. Int. J. Qual. Reliab. Manag. 2005, 22, 337–353. [Google Scholar] [CrossRef]
- Zhang, J.J.; Li, H.J.; Li, V.; Skitmore, M. Internal relationships of market-oriented EFQM enablers in the Chinese construction industry. Eng. Constr. Archit. Manag. 2020. [Google Scholar] [CrossRef]
- Fitzgerald, M.A.; Haynes, G.W.; Schrank, H.L.; Danes, S.M. Socially responsible processes of small family business owners: Exploratory evidence from the national family business survey. J. Small Bus. Manag. 2010, 48, 524–551. [Google Scholar] [CrossRef]
- Johnson, M.P.; Schaltegger, S. Entrepreneurship for sustainable development: A review and multilevel causal mechanism framework. Entrep. Theory Pract. 2020, 44, 1–33. [Google Scholar] [CrossRef]
- Bagnoli, L. Responsabilità Sociale e Modelli di Misurazione; FrancoAngeli: Milan, Italy, 2010; pp. 69–72. [Google Scholar]
- Enquist, B.; Edvardsson, B.; Sebhatu, S.P. Corporate social responsibility for charity or for service business? Aisa J. Qual. 2008, 9, 55–67. [Google Scholar] [CrossRef]
- Tiemann, T.K. Introductory Business Statistics with Interactive Spreadsheets: 1st Canadian Edition; BC Camps: Toronto, ON, Canada, 2010; pp. 69–71. [Google Scholar]
- Alexopoulos, E.C. Introduction to multivariate regression analysis. Hippokratia 2010, 14, 23. [Google Scholar] [PubMed]
- Peng, C.Y.J.; So, T.S.H. Logistic regression analysis and reporting: A primer. Underst. Stat. 2002, 1, 31–70. [Google Scholar] [CrossRef]
- Osborne, W.J. Best Practices for Logistic Regression; SAGE: Los Angeles, CA, USA, 2015. [Google Scholar]
- MacKenzie, D.I.; Nichols, J.D.; Royle, J.A.; Pollock, K.H.; Bailey, L.; Hines, J.E. Occupancy Estimation and Modelling: Inferring Patterns and Dynamics of Species Occurrence; Elsevier: London, UK, 2010; pp. 73–110. [Google Scholar]
- Petrucci, C.J. A Primer for Social Worker Researchers on How to conduct a multinomial logistic regression. J. Soc. Serv. Res. 2009, 35, 193–205. [Google Scholar] [CrossRef]
- Spence, L.J.; Habisch, A.; Schmidpeter, R. Responsibility and Social Capital: The World of Small and Medium Sized Enterprises; Palgrave Macmillan: Basingstoke, UK, 2010; pp. 73–110. [Google Scholar]
- Tencati, A.; Perrini, F.; Pogutz, S. New tools to foster corporate socially responsible behavior. J. Bus. Ethics 2004, 53, 173–190. [Google Scholar] [CrossRef]
- Zenko, Z.; Hrast, A.; Mulej, M. Social responsibility: Measures and measurement as a basis for organizational systemic action. Syst. Pract. Action Res. 2013, 26, 475–484. [Google Scholar] [CrossRef]


Publisher’s Note: MDPI stays neutral with regard to jurisdictional claims in published maps and institutional affiliations. |
© 2021 by the authors. Licensee MDPI, Basel, Switzerland. This article is an open access article distributed under the terms and conditions of the Creative Commons Attribution (CC BY) license (http://creativecommons.org/licenses/by/4.0/).