Abstract
Smart cities offer solutions to environmental, economic, and societal problems in urban agglomerations. We investigate the potential for mutual learning in smart city implementation by comparing German approaches (smaller, local projects) to projects implemented in the MENA region (bigger, national designs). We contrast the outside view on these projects with an inside perspective, surveying key decision-makers in five German and seven MENA smart cities. We assess motivation, technology options, and factors that drive or impede smart city implementation. We find strong similarities in the motives to engage in smart cities, offering common ground for mutual good practice exchange. Energy efficiency solutions and—to a lesser extent—renewable energies are of strong interest to policymakers in all countries. In contrast, the appraisal of mobility solutions strongly diverges, showing that technology deployment is far from being a simple “plug and play” solution. Considering these insights can facilitate the overall deployment of smart cities, not only in the surveyed countries but also in global manner.
Keywords:
smart cities; renewable energy; energy efficiency; mobility; governance; survey; Germany; MENA 1. Introduction
The United Nations estimate that by 2050 more than 80% of the European population and 50% of the Middle East/North Africa (MENA) population will live in cities or urban areas [1]. Urban population pressure can already be seen in Germany, where from 2008 to 2016 the population of Frankfurt and Munich grew by 7% [2]. Similar urban pressure exists in MENA countries [3].
Given their significance, urban spaces offer the best opportunity to reduce energy consumption and mitigate global warming [4,5]. Eurostat estimates [6,7] show that cities are responsible for 70% of total energy consumption (773 Mtoe) and about 75% of greenhouse gas emissions (2796.5 Mio. t CO2) in Europe. MENA cities mirror this, with Qatar among the most energy and carbon-intensive countries in the world [8,9,10]. Hence, the redesign of energy supply and use (incorporating renewable energies and energy efficiency) and of transport infrastructure offer key options for policies and actions that support commitments to the Paris Agreement [11,12].
Smart cities support these options by seeking to link and optimize economic, energy, and resource flows in urban areas using information and communication technology (ICT) [13]. As Lydras and Visvizi note, there has been a rich and dynamic debate on smart cities [14]. This debate has raised many controversial issues related to smart cities. These issues span from data use and privacy [15,16], questions of boundaries and relation to surrounding”s [17,18], and lock-in of infrastructure components and technical biases [19], to the relation between “smart” and “sustainable” [20,21,22,23]. Consensus exists that ICT can benefit all citizens [13,14], whether by improving living conditions [24], facilitating urban management [25], or mediating energy and climate problems [26,27,28]. Other more specific ideas have been developed, often depending on the expertise of the authors. These include the notion of digitalization or “intelligence” [29,30], sustainability [31,32], innovation [33] and green growth [34].
Following up on these aspects and perspectives, it comes as no surprise that numerous definitions of a “smart city” exist [35]. Dameri [36] and Fernadndez-Anez [37] note that smart city development is a bottom-up process which has given rise to several notions. Depending on the focus, distinctions can be made between an “intelligent” city (focus on competences and knowledge, see e.g., [38]), a “digital” city (focus on ICT, components, and their interconnectivity, see e.g., [39,40]), a “technocity” (focus on upgrading infrastructure and governance, see e.g., [41]), or a “sustainable city” (focus on environmental aspects, see e.g., [20,39]). Praharaj and Han [42] observe a multitude of these definitions being applied to Indian smart cities. Clearly these definitions overlap and are not mutually exclusive. For example, the European Commission defines smart cities as “cities using technological solutions to improve the management and efficiency of the urban environment” [43].
For our study, we adopt a broad definition, advanced by the World Bank: a technology-intensive city that delivers “intelligent” energy and mobility solutions in cooperation with its citizens [44]. We add the dimension of “sustainability,” implying both the minimization of resource streams and environmental impacts as well as adaptation to a changing global climate [45,46].
The various perspectives and approaches imply that there is considerable room for mutual learning between the different approaches. The aspect of mutual learning is often the background for external evaluations of smart cities [47,48]. To cite only few examples, mutual learning is conceived by directly comparing city concepts [49], the applied technological solutions [50], or a comparison between countries [50,51]. On this basis, our contribution to mutual learning between smart city approaches analyzes and contrasts smart city projects in Germany/Europe and the MENA region. The choice of cases is motivated by the fact that many German projects were inspired by Abu Dhabi’s Masdar City as a frontrunner of a smart city project. In turn, the German/European solutions identified have been closely analyzed by later projects in the MENA region. Both regions investigated similar energy and mobility solutions, which allows for a comparison. In contrast, both regions stand out in terms of project size and realm. Whereas the European projects focus on redesigning existing infrastructure in often smaller projects, the MENA projects opt for large greenfield projects. This raises the question of mutual learning between the two approaches.
Beside population pressure, energy, and environmental concerns, smart cities are also attractive from an economic point of view: estimates of the economic potential of smart cities vary widely, ranging from USD 1.5 trillion by 2020 [52] to almost USD 3.5 trillion by 2026 [53]. At present, Europe and especially Germany are the leading markets. By 2030, the Asian and MENA markets are expected to have the highest growth in terms of projects and market size [53].
With such potential, the smart city approach can incite decision-makers into viewing it as a kind of “silver bullet” with plug-and-play technologies and installations reproducible from frontrunner approaches such as Masdar City in Abu Dhabi, or the Songdo and Hwaseong Dongtan city projects in South Korea [54]. However, installation approaches vary substantially across regions and cities. Many MENA countries (e.g., UAE, Kuwait) have opted to install new infrastructure based on global best practices; highly dependent on oil exports, these countries view smart city development and related digitalization as an option for economic diversification [55]. Ramady [56] reviews the Gulf Cooperation Council (GCC) country economies, while Griffiths [3] discusses the energy profile of the MENA region. Like Saxena et al. [55], they emphasize the strong pressure to diversify MENA economies to lessen dependence on volatile energy prices. On the energy consumption side, Asif [57] shows the potential for building refurbishment. Ringel, Laidi, and Djenouri [58] highlight the environmental, economic, and social benefits related to using smart appliances as key components of smart cities in the region.
In contrast to the MENA concerns, however, the European/German approach focuses on transforming existing infrastructure and integrating single smart components [59]. This approach focuses on model projects that lead to innovation, thereby creating “first mover advantages” in the markets for smart city components and aligning the German export model with “green growth” [60].
These two distinct perspectives on smart city growth offer an opportunity for a systematic analysis of both strategies. Such analysis can lead to mutual learning and best practice exchange reaching well beyond the present literature [61]. Toward this end, we analyzed the development and deployment strategies behind the European/German and the MENA smart city projects, addressing three questions of comparison:
- (Q1)
- Based on which criteria (key motivation, planning, governance) do decision-makers evaluate smart city projects? Which are relevant stakeholder groups for setting up smart city projects?
- (Q2)
- How do decision-makers evaluate technology choices in the energy and mobility fields? Are these seen as plug-and-play components, which are transferrable from one city to the other?
- (Q3)
- What factors do decision-makers perceive as working for or against smart city projects?
The present study adds to the existing literature in the following ways. Our study is the first to focus specifically on similarities and differences between the two regions with the purpose of identifying fields for mutual learning. Another novelty compared to existing research is the dedicated focus on the inside perspective that decision-makers take on smart city development: we combine a formal external review of projects with in-depth interviews of high-ranking administration and project officials behind the smart city projects. This inside view has so far been neglected in literature but sheds light on project choices and motivations that can be of valuable use for smart city projects in general. We also do not restrict ourselves to looking solely at technology choices, which have been widely researched [62,63,64,65,66,67,68,69]. Instead, we focus on the combination of policy motivations, socioeconomic factors, and technology choices. This perspective encompasses political influences and factors that boost or hinder project development. Our findings uncover not only opportunities for mutual learning, but also prospects for economic diversification in the MENA region, which to date remains in many cases heavily dependent on oil [70]. Given the highly diverging strategies between the two lead regions for smart cities, our findings can be used at a more general level to understand differences in smart city designs and potential for mutual learning.
2. Material and Methods
2.1. Overview of the Research Concept
We compared evolving energy governance and strategy models in MENA and German smart cities using a mixed-methods approach that combines qualitative and quantitative research on decision-making in each of five German and seven MENA smart cities. Figure 1 summarizes the research concept, which is described in detail in Section 2.2, Section 2.3, Section 2.4.
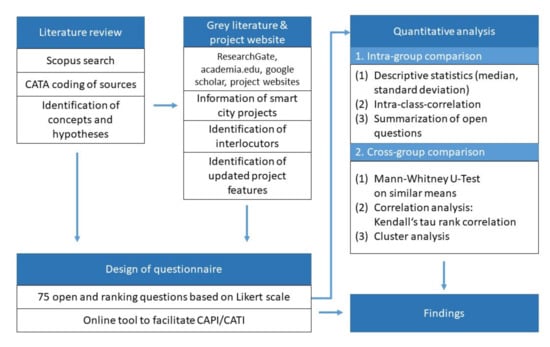
Figure 1.
Research concept.
2.2. Qualitative Review
To inform our research, we performed a literature review distinguishing between two sources:
Peer-reviewed scientific publications:Table 1 lists the search strings used in a Scopus search of research relating German and MENA smart city models after 2014 to governance, energy, and mobility. This helped in narrowing down the total 46,842 hits to a relevant subset. Computer-aided content analysis (CATA) based on MaxQDA software helped identify the most relevant peer-reviewed scientific papers to frame this research. We developed a codebook, based on 91 items that we grouped into four categories and further subgroups ((i) framing data such as country region/relevant cities/city profiles; (ii) topics such as energy technologies, mobility solutions, and governance options; (iii) motivation, drivers, and barriers; and (iv) methodology such as screening, case study, and index). The codebook used is presented in Supplementary Materials Annex A.1.

Table 1.
Search strings applied in Scopus to identify relevant literature.
The narrowed-down articles were reviewed by hand and further narrowed down to a readout of representative smart cities in German and MENA cities. The findings and literature sources used are presented in Section 3.1 and at detailed city level in Supplementary Materials Annex A.2.
Grey literature and website content were analyzed to gain up-to-date and off-record information on recent developments in smart-city projects and identify interview partners. Researchgate.net, Academia.edu, and Google Scholar led to relevant projects and interview partners. The readout of grey literature and relevant website content is included in Annex A.2.
The combined readout of peer-reviewed and grey literature yielded our focus group of seven smart cities in Germany and seven in the MENA region and constituted the basis for our survey.
2.3. Design of Survey
A questionnaire—available in English, Arabic, and German—was developed, comprising 75 questions and taking 60 to 90 min to complete (see Annex 3). To facilitate comparability to literature reviews and online data, the questionnaire followed a four-part design:
- overview of the smart city project and motivation to engage with it;
- planning, governance, and actors;
- technology choices in the energy and mobility fields; and
- drivers and barriers to the implementation of the project.
Regarding stakeholders, we differentiated between national government, local government, business actors, private actors or non-governmental organizations, and external actors such as universities. Our surveyed list of drivers investigated included economic, energy, and environment drivers, as well as better governance and societal needs/pressure. The barrier categories comprised difficult project management, lack of qualified workforce, financial/economic limitations, governance, and coordination problems. The detailed items are presented in the Supplementary Materials.
To ensure comparability to existing works, our set of indicators for assessing decision-makers’ views on technology use in the energy and mobility fields and for motivations to engage in smart cities was built upon the work of the EU Citykey [46] and Morgenstadt [67]. Governance indicators to assess motivations, drivers, and barriers were adapted from the work of [71].
The questionnaire used Likert scales to quantify items and sub items with an even number of points (one to six) to yield clear conclusions and avoid an “average choice bias” [72]. In all scales, one ranked the lowest and six the highest. Additional open-ended questions were used to provide qualitative data and context for the projects. The questionnaire was then transposed into a web tool to support computer-assisted personal interviews (CAPI) and computer-assisted telephone interviews (CATI), enabling both the interviewee and the interviewer to enter data directly into the questionnaire, thus minimizing information loss [73].
Quantitative data was collected from a focus group of experts who work or have worked in smart energy technology development and deployment projects in the surveyed cities. In total, 67 experts in government, project development, and project research were contacted between November 2017 and June 2019. We used data from 22 of these, representing five MENA cities (Cairo, Egypt; Doha, Qatar; Dubai/Ras Al Khaima, UAE; Kuwait City, Kuwait; and Masdar City/Abu Dhabi, UAE) and five German cities (Berlin, Hamburg, Bremen, Cologne, and Munich). Each of these urban areas has a population of at least 1,000,000. Two MENA cities (Casablanca, Morocco and Algiers, Algeria) had to be excluded for lack of sufficient interview partners. Likewise, two German cities (Frankfurt and Stuttgart) had to be excluded due to hierarchical biases in the interviews. Figure 2 presents a mapping of the surveyed cites. Further geological and socio-economic descriptions (GDP per capita, minimum and maximum temperatures, mobility profiles) can be found in Supplementary Materials Annex A.2.
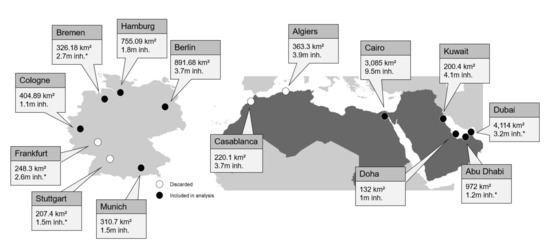
Figure 2.
Mapping of surveyed cities. * Data referring to urban agglomeration.
The relatively small number of interviewees reflects the fact that many government interlocutors operate in a hierarchical structure where a single head is responsible for the project. To quote an interviewee: “You have spoken to my director and I am not in a position to contradict him” (Interviewee 8, MENA city). Other interviewees were willing to provide information privately, but not make it public: “We are presently updating our smart city strategy and would prefer to go out for open discussion at a later point in time. The information I share with you is thus strictly personal” (Interviewee 13, German city). Both types of responses were discarded from our dataset. Despite the small sample, it can still support an exploratory study into the motivations, drivers, and barriers to engage in smart cities.
2.4. Quantitative Analysis of Data
We used IBM’s SPSS data analysis software on the questionnaire data. For each group of cities, German and MENA, descriptive and inferential statistics were calculated to (1) examine motivations and roles of stakeholders, (2) assess technology options in the energy and mobility fields, and (3) survey perceptions that foster or hinder implementation of smart cities. These items were analyzed both intra- and intergroup. We also explored correlations between components to identify whether similar “trigger” or “obstacle” combinations were present in both groups. The methods applied are described in Section 2.4.1 and Section 2.4.2.
2.4.1. Intra-Group (MENA Cities and German Cities)
The intra-group comparison captures the governance features and technology strategy of each smart city project. Identifying similarities and differences within a group was done through:
- I.
- descriptive statistical analysis (median, standard deviation),
- II.
- intra-class correlation coefficient (ICC) tests to check consistency among surveyed experts from the same city, and
- III.
- summarization of open questions to identify strengths and weaknesses of the projects.
2.4.2. Inter-Group (MENA Cities versus German Cities)
The aim was to compare the aggregated characteristics of MENA versus German cities to identify potential areas of cooperation. This analysis comprised:
- I.
- Mann–Whitney U-Test to compare the averages of the two independent groups;
- II.
- correlations analysis: items for governance, technology use, drivers and barriers were tested against each other at aggregate and detailed levels using Kendall’s tau rank, preferred over Spearman’s rank for small sample sizes [74]; and
- III.
- cluster analysis to examine where cities show similarities or divergences, and so opportunities for mutual learning.
Based on this methodology, we now turn to present our findings.
3. Results
3.1. External Assessment of German and MENA Smart City Projects
Results are based on our computer-aided screening of smart city literature.
Presents the results of the coding and the importance of the top smart city aspects addressed in the literature. Sustainability issues are addressed in over 342 publications (299 on the German, 43 on the MENA region), and technology issues are the focus of 220 papers (193 on the German, 27 on the MENA side). These numbers underscore the importance of technology choices and opportunities for mutual learning between decision-makers in the two regions.
The 10 smart city projects identified are largely discussed as successful blueprints in literature. Table 2 summarizes the key features of the researched smart city projects based on our readout of review and grey literature.
Table 2.
Overview of the 20 most reviewed aspects in German and MENA smart city projects.
3.2. Internal Assessment
3.2.1. Assessment of Surveyed Items
We now turn to contrasting this external review with our survey results of decision-makers to investigate the “inner workings” of the projects. Table 3 summarizes our review in terms of (i) motivation to engage in smart city projects and key stakeholders, (ii) technological choices taken, and (iii) drivers and barriers of project implementation. The red line represents German respondent views on key choices associated with smart city design; the blue line represents the views of MENA respondents. The raw data behind these figures can be found in the Supplementary Materials, Annex A.4.
Table 3.
Profiles of researched smart city projects.
As can be seen in Figure 3, decision-makers in MENA and German smart cities depart from the same motivations, rating resources, and energy concerns, as well as climate and environmental concerns, which are rated “high” to “very high”. Note, however, the striking difference between the relevance of actors: universities and business stakeholders are seen as very relevant in the German projects, but strongly less so in the MENA projects. In contrast, the role of the national government in MENA projects is considerably higher than in German ones.
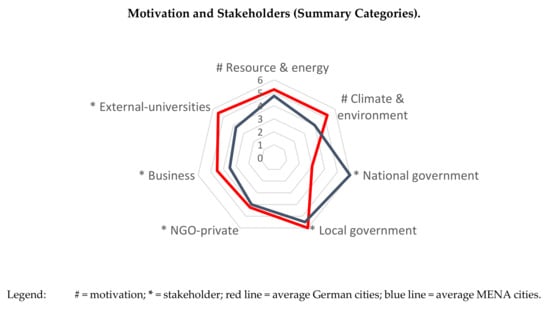
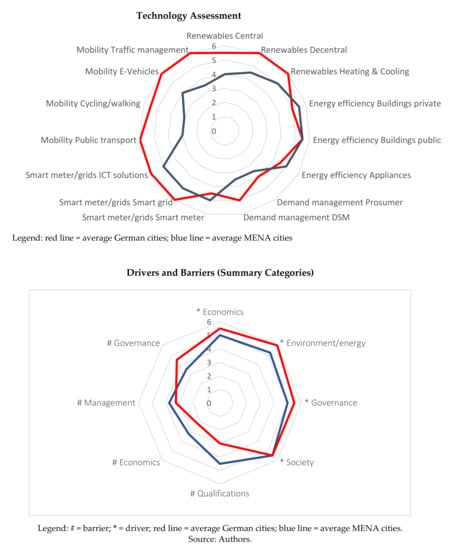
Figure 3.
Evaluation of smart city features.
Regarding the assessment of technology choices, MENA and German decision-makers seem to align around the interest in deploying energy efficiency solutions. Interestingly, this alignment seems to be less pronounced regarding renewable energy technologies. A stark contrast can be seen regarding mobility: whereas mobility solutions are of high interest to German decision-makers, this does not seem to be the case with their MENA counterparts.
Turning to project implementation, the key drivers for implementing a smart city project identified in the literature (population pressure, improving living conditions and economic benefits, environmental and energy concerns) are mirrored in our survey.
The descriptive statistics applied help track focal points of city projects as perceived by the actors. However, they do not allow tracking the coordination and alignment of stakeholders. As Allam & Newman [54] point out, smart cities take shape through myriad stakeholders whose views on the project often diverge.
3.2.2. Alignment of Stakeholders
To test whether the opinions and ratings sampled for one city converged, we applied intraclass correlation (ICC). Table 4 presents our results. Almost all cities show good convergence among stakeholders, with coefficients close to or above 0.7 and high significance rates (p > 0.05). Compared to German projects, MENA city projects show especially strong correlation. The one exception is Berlin, where a low coefficient (0.013) can be observed. The replies to the open questions in our survey explain that Berlin changed from a participatory top-down planning to a bottom-up “marketplace of ideas” following changes in the ruling city government. The low coefficient mirrors the fact that some interviewees developed the initial phase but turned critical when the strategy changed, whereas interviewees that joined later were de facto aligned with the new approach.
Table 4.
Intraclass correlation coefficients (ICC) for respondents of their own smart city project.
3.3. Comparing MENA and German City Projects
3.3.1. Similarity of Perceptions on Key Items
We apply the Mann–Whitney test to compare the perceptions of (1) technology choices, (2) motivation and governance, and (3) drivers and barriers between the two groups of cities. The test allows a comparison between the MENA and German cities based on ranking the individual choices and comparing the median ranks [74]. We report the test statistic U, calculated based on the sample sizes n1 and n2 of groups 1 (German cities) and 2 (MENA cities), where R1 is the sum of ranks for group 1:
In Table 5, Table 6, Table 7 and Table 8 we report the median ranks, p values, and effect sizes, in case p values are statistically significant, implying p ≤ 0.05. Effect size r is calculated as
where z is the z-score that SPSS produces, and N is the size of the study (i.e., of the total observations on which z is based). Effect sizes should be 0.5 or higher to demonstrate a strong effect (“Cohen benchmark”; [74]).
Table 5.
Difference between city groups regarding assessment of technology options.
Table 6.
Group assessments of motivations to engage in smart city project.
Table 7.
Group assessments of relevance of different stakeholders for smart city project.
Table 8.
Assessment of drivers and barriers.
Regarding the assessment of technology choices (Table 5), the two groups of cities did not differ significantly in the case of energy efficiency technologies (mdn. German cities = 11.58, mdn. MENA cities = 11.4). For all other technology options, different assessments can be observed. In the case of renewable energies, German city assessments (mdn. = 14.08) differ significantly from MENA cities (mdn. = 8.4, p = 0.043, r = 0.5). The assessment of mobility choices shows a similarly strong difference between the two city groups (mdn. German cities = 13.83, mdn. MENA cities = 7.22; p = 0.015; r = 0.542).
Table 6 reports the assessment of key motivators and the importance of different stakeholder groups engaging in the respective smart city projects. In German cities, the top motivators identified by the Mann¬–Whitney test are establishing living laboratories (mdn. = 15.3), meeting mobility concerns (mdn. = 14.0), conserving resources (mdn. = 13.7), and adapting to climate change (mdn. = 13.9). In MENA cities, the top motivators are energy independence (mdn. = 13.6), better living conditions for citizens (mdn. = 12.9), and modernizing infrastructure (mdn. = 12.2). A clear and statistically sound difference between the two groups can be observed in the differing priorities given to green growth and mobility concerns.
Table 7 shows that stakeholder importance is mostly rated quite differently between the two groups, although both rate the role of citizens and NGOs similarly (mdn. = 11.583 and 11.4 in German and MENA cities, respectively). National governments as stakeholders have a much stronger relevance in MENA cities (mdn. = 17.2) than in German cities (mdn. = 6.75), an effect both highly significant (p = 0.0) and strong (r = 0.892). Likewise, the role of universities and external stakeholders are assessed quite differently (mdn. German cities = 15.75, mdn. MENA cities = 6.4), an effect that is, again, highly significant (p = 0.0) and strong (r = 0.729).
Table 8 shows assessments of drivers and barriers to smart city development. Here, management barriers refer to missing time and resources, while government barriers could be lengthy procurement procedures. In aggregate, cities in both regions converge in assessments. However, differences appear in the details behind the aggregates (see Supplementary Materials, Section A.4 for detailed results). This is especially so in the case of drivers where the MENA cities rank the cost-effectiveness of measures much higher (mdn. = 15.6) than German cities (mdn. = 8.08, p = 0.006, r = 0.621). Conversely, German cities rank the deployment of ICT-entrepreneurship (start-ups) higher (mdn. = 15.17) than MENA cities (mdn. = 7.1, p = 0.003, r = 0.504). Wide differences exist in two other drivers: reducing CO2 emissions (mdn. German cities = 14.25, mdn. MENA cities = 8.2; p = 0.030; r = 0.562), and improving resource efficiency (mdn. German cities = 14.17, mdn. MENA cities = 8.3; p = 0.036; r = 0.549). In assessing barriers, a strong and significant difference is seen only in “investor hesitation to finance risky projects”, where the barrier appears higher in MENA cities (mdn. = 17.94) than in German (mdn. = 7.68, p = 0.016, r = 0.539).
3.3.2. Correlation Analysis
To assess the interplay between key smart city factors identified in the literature, we applied correlation analysis, seeking to detect patterns of interactions that help explain design choices. We aggregated survey items into three classes for this analysis: (1) motivation and stakeholders, (2) uses of technologies in the energy and mobility fields, and (3) drivers of and barriers to smart city development. Correlations were examined within the group of MENA cities against the group of German cities. To appropriately address the small sample size, Kendall’s tau rank correlation was applied rather than the more common Spearman rank correlation coefficient. Where correlations showed a high significance level (* p < 0.05; ** p < 0.01; *** p < 0.001), bias-corrected and accelerated bootstrap 95% confidence intervals were computed. A readout of relevant and highly significant correlations for both the German and MENA group of cities is summarized in Supplementary Materials, Section A.5. The total correlation analysis is presented in Supplementary Materials, Section A.6.
Overall, a stronger set of correlations could be observed with the sampled MENA cities than within their German counterparts. Cross-group correlations were computed where evidence suggested relations between the two. Relevant findings from the correlation readout and implications from our analysis of the relation between different items are put forward and discussed in Section 4.
3.3.3. Cluster Analysis
We conducted a cluster analysis to examine item choices across smart cities, looking for similarities or strong divergences that point to areas for mutual learning. We applied hierarchical, agglomerative linking. The distance in the assessment of the item groups was computed via the squared Euclidian distance in average linkage. The mean of all possible distances between the data points in cluster 1 and those in cluster 2 was considered. Results are presented in the dendograms of Figure 4.
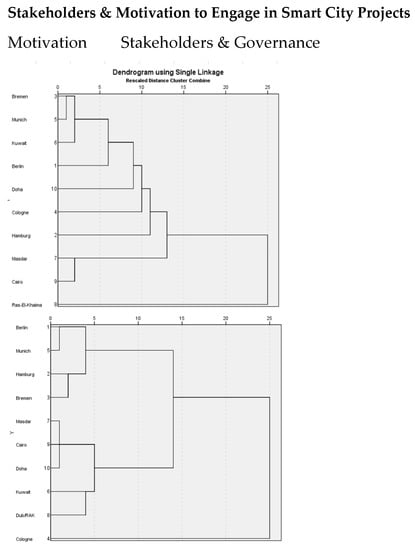
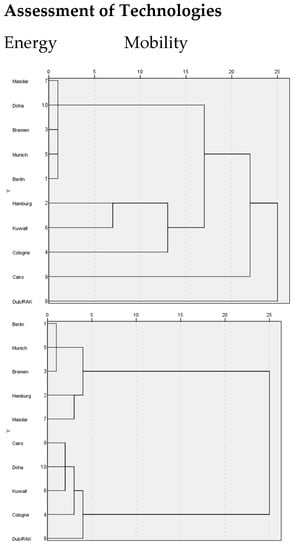
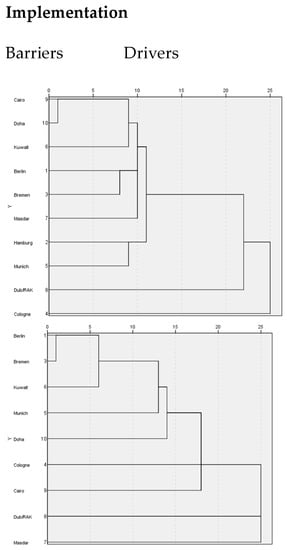
Figure 4.
Cluster analyses for city similarities.
A dendrogram displays the entire cluster analysis process. The individual examination units are shown in the rows. The lines between the examination units represent their joining into clusters. The heterogeneity values are shown in the columns; these are the transformed distances normalized to a scale of 0 to 25. A low value means low heterogeneity within the groups. There is no universal cut value up to which clusters should be selected. Overall, normalized values below 10 suggest a closer similarity between smart city projects; values below 5 suggest a very pronounced similarity. In the case of large heterogeneity jumps, the agglomeration should be discontinued [121]. Agglomeration schedules used to produce the dendograms are found in the Supplementary Materials, Section A.7.
The dendograms show that similarities appear more on a city-to-city basis than—what might have been expected—following a German/MENA pattern of dichotomy. The motivations to engage in smart city development are diverse. Only in the case of the clusters Munich/Bremen/Kuwait and Masdar/Cairo do scale values below 5 appear, suggesting a high degree of similarity. Likewise, the assessment of important technologies to support smart city development is judged differently between cities. Here, the dendogram only suggests a German core cluster (Bremen/Berlin/Munich) as a viable option (scale values again below 5). These results suggest a large space for mutual learning.
Assessments of relevant stakeholders and governance show a clear dichotomy between MENA and German cities, pointing to different decision-making processes. Regarding the implementation of projects, the triggers for successful implementation seem to work on an almost individual basis. In contrast, the assessments of barriers show a striking similarity across almost all cities.
4. Discussion
We analyzed the development and deployment strategies behind five German and seven MENA smart city projects, seeking to identify how decision-makers evaluate projects, go about selecting technology deployments, and balance factors that work both for and against smart city development. Our research aims to identify mutual growth and learning opportunities.
4.1. Perception of Motivation and Relevant Stakeholders
Our first research aim (research question Q1) was to investigate the motivations to engage in a smart city project and assess which stakeholders are central for its implementation. Our statistical readout shows converging interest in modernizing infrastructure and economics, underlining societal pressure for improved living conditions as a strong motive for engaging in smart city projects. Both stakeholder groups also demonstrate a strong interest in achieving energy savings, suggesting that this field offers considerable common ground on which to start an exchange on implementation approaches. The key motivating factors emerging from our stakeholder analysis mirror those recently identified in the literature [31]. In addition, our findings confirm the interrelation between governance approaches, socioeconomic factors, and technology choices, as identified by [122]. Still, their priorities differ between the German and MENA regions. Note that German cities rate creating a “living lab for new technologies” (mdn. = 15.333) much higher than MENA cities do (mdn. = 6.9, p = 0.002, r = 0.682). Comparing median ranking of mobility concerns also shows a significant (p = 0.050) and almost strong (r = 0.436) difference between the two (German mdn. = 13.958, MENA median = 8.55). This seems to suggest that these options seem less suited for starting joint projects.
How do these perceptions of motivation work through national or local strategies? Our findings confirm earlier studies suggesting that MENA smart city projects are mostly national projects aimed at solving and satisfying national problems and needs, the most pressing of which is lessening the region’s economic dependence on volatile energy prices [55,70]. In contrast, German projects are foremost local, almost always initiated on a small scale. Many started as research projects using European funding, explaining the importance that German stakeholders attach to universities and research institutions for setting up their smart city projects seen in Section 3.2. To quote one interviewee: “We would not have envisaged engaging in smart city activities without this funding. Learning from our European partners and external consultants was likewise important.” (Interview 3, German city).
Let us now turn to the analysis of actors. Unsurprisingly, and in line with the literature [69,123], both German and MENA groups overall view local government as instrumental in developing energy technology solutions. This relation is strong in German cities, with significant relations between local government and the use of renewable energies (τ = 0.671 *, p = 0.034), energy efficiency (τ = 0.520; p = ns/.081), and most strongly, environmental drivers (τ = 1000 ***; p = 0.000). In MENA cities, only the correlation with use of renewable energies is significant (τ = 0.632 *, p = 0.036), while there is none in the efficiency and environmental fields.
This difference in the perceived role of local and national actors is mirrored when looking closer at the partners implementing smart cities. In Germany, they are mostly familiar actors such as public services, local energy companies, or dedicated public–private partnerships [75,85,124,125,126]. In contrast, the MENA projects largely rely on outsourcing or bringing in global knowledge and expertise [96,98,109].
Lastly, mutual exchange has to take account of the different importance attributed to national governments in the German and MENA projects. Whereas national government is a central actor in the MENA approaches, its role is almost absent in the German cases (see Section 3.2). This implies that mutual learning needs to bridge an “institutional gap” of allowing exchange between national governments on the one side and local governments on the other side. There might be a clear role for intermediaries, but this issue clearly asks for further research.
4.2. Assessment of Technology Choices in the Energy and Mobility Fields
Furthering our analysis, we were interested in decision-makers’ evaluation of technology options, investing in the contested idea [54] that these are “plug-and-play-components” (research question Q2). Our results show a clear difference in how respondents from the two regions assess technology to support renewable energies, again confirming the socio-economic context [122]; the difference is both statistically significant and shows a strong effect size (German mdn. = 14.08, MENA mdn = 8.4; p = 0.043; r = 0.5). Interestingly, our correlation analysis suggests a strong affinity between energy solutions for German cities. Renewable energies show significant relations to energy efficiency (τ = 0.697 *, p = 0.019), mobility solutions (τ = 0.604 *, p = 0.039), environmental security (τ = 0.671 *, p = 0.034), and societal drivers (τ = 0.647 *, p = 0.025). Similar relations do not show up among MENA cities. While correlation figures are hardly explanatory, this nexus of motives does parallel the key objectives and fields of the German national energy transition (Energiewende).
Commonality between regions is found in the valuations given to energy efficiency solutions, meaning efficiency in private and public buildings and efficient appliances; here, both MENA (mdn. = 11.4) and German (mdn. = 11.6) city views tend to converge. That views from two markedly different climate perspectives should converge demonstrates that building insulation can protect occupants in both hot and cold climates. It follows that energy efficiency is one field of technology where ample opportunities for mutual exchange exist.
In valuing mobility choices, the two city groups show a strong difference (mdn. German = 13.83, mdn. MENA = 7.22; p = 0.015; r = 0.542). The German assessments likewise show a significant correlation between mobility and seeking better living conditions (τ = 0.761 **, p = 0.006), which is not mirrored in MENA city data. Cluster analysis (Figure 4) also supports this clear dichotomy in smart city objectives.
4.3. Implementation: Drivers and Barriers
Research question Q3 addressed the implementation of smart city projects, investigating factors that work for or against the approaches taken. Based on findings from the literature, we constructed a set of 32 drivers and barriers—factors that either boost or impede smart city realization in German and MENA cities. In aggregate, the two regions show similar assessments; however, significant differences appear when looking at disaggregated items. Differences are more pronounced among drivers than among barriers, where only the “risk investment” barrier differs significantly between the two regions (mdn. German = 7.68, mdn. MENA = 17.94; p = 0.016; r = 0.539).
Data from German cities indicates a significant relationship between qualification barriers and smart meters/smart grid technologies (τ = 0.618, p = 0.023). Likewise, correlation analysis suggests a significant inverse relationship between qualification barriers and economic drivers (τ = −0.719, p = 0.011). This implies strong barriers against the uptake of key smart technologies, to the point these may even be seen as hindering economic development. These correlations do not emerge from the MENA data. An explanation might be found by comparing the implementing partners of the regions: in Germany, that means local partners with potentially limited ICT experience, while in MENA cities, it means globally contracted partners with international expertise.
MENA cities respondents did, however, perceive a clear correlation between other types of barriers. Significant correlations between management barriers (e.g., coordination between actors, lack of time to supervise project) and qualification barriers (τ = 0.800, p = 0.005) as well as economic barriers (τ = 0.594, p = 0.037) can be observed. In data from German cities, this relation is not significant. Here, an inverse argument might apply: with the proximity and stable relations of (local) actors, fewer management efforts are needed to safeguard project implementation. In a broader perspective, these findings on drivers and barriers highlight findings from other studies, suggesting that smart city projects increasingly shift their focus from simply deploying technology solutions (“smart city 1.0”) to a more coordinated governance framework (“smart city 2.0”) [11].
4.4. Limitations of This Study
As a first limitation, the geographical scope and the jurisdictions chosen need to be addressed. A straightforward approach would have been a comparison between regions (that is, Europe in contrast to MENA). Besides arguments of accessibility of policymakers, the key choice of German projects is motivated by the fact that these projects have all more or less been initiated as European projects and as such can serve as a blueprint for a “European” approach. Still, enlarging the realm of projects analyzed would certainly merit further investigations.
As with all stated preference studies, self-report and selection biases are potential weaknesses of our study instrument. The questionnaire, however, was constructed to mitigate these biases. First, it used neutral language from historical decisions and experiences rather than focusing on options as such. Second, topics clearly susceptible to bias, especially in the assessment of drivers and barriers, were verified, and reliability was validated by applying open-ended questions in different sections (i.e., the rest-retest approach). Third, the questions were carefully ordered to avoid bias. For example, questions about investments or technical complexity as barriers were asked only after surveying the criteria for acceptance.
A further limitation is the small number of interviews. This needs to be considered in perspective: the population of local decision-makers for smart city projects is small. We also took steps to avoid hierarchical bias in the interviews, which discarded some of the interviews taken. Recognize that we sought insight into the thought processes at work when designing smart cities. The literature of evaluations by outside agencies is abundant; insights into the minds of key decision-makers are not. Those can only be inferred from interviews with the decision-makers. That said, reliability could be enhanced by enlarging sample sizes and by extending the study to other smart city projects.
Lastly, design and governance choices could be evaluated against framework conditions such as investments, GDP, climate conditions, or geographical settings. However, data on framework conditions does not exist in a standard format, so standardization efforts would be needed. The works of UN Habitat [127] on smart city framework conditions might be a start, but until such a framework is available, expert assessments can serve as a good proxy to track the inner workings of German and MENA projects.
5. Conclusions: Potential for Mutual Learning
Our contribution sought to investigate the potential for mutual learning in smart city projects by comparing German ones (smaller, local projects) to projects implemented in the MENA region (bigger, national designs). Adding to existing research, we contrast the outside view on these projects with an inside perspective, surveying decision-makers in German and MENA smart city projects. Our findings show strong potential for mutual exchange between both approaches along the following lines:
- I.
- Conserving resources and adapting to climate change are central motives for smart-city development and can serve as leitmotifs for mutual exchange.
- II.
- Despite an apparent dichotomy between national MENA projects focusing on new construction and local German projects focusing on renovation, local actors in both regions exercise strong influence over technology choices.
- III.
- When articulating energy strategies, decision-makers see supporting renewables and energy efficiency as a combined win-win solution. Cooperation can and should start here. In contrast, mobility solutions are assessed quite differently. This shows strong potential for mutual exchange, but probably at a later stage in the process.
- IV.
- Contrary to some voices in literature, our screening shows that technologies within smart city projects are not plug-and-play components. Rather, each project relies on context-specific solutions that consider national, regional and local factors.
- V.
- A set of similar barriers apply across cities. Here again, cooperation on measures to overcome these barriers seems a promising field of mutual learning.
At a more general level, our findings carve out two trends that deserve follow-up research. First, it confirms the economic logic of being a first mover in implementing smart cities. This can be seen in cluster analysis, where the cities of Berlin, Bremen, and Munich adhere closely to the original Masdar smart city model. This highlights the economic value of successful smart city projects and their potential to deliver workable models of green growth. Second, governance choices play a key role in implementing smart cites, but they differ strongly among regions. It will be worthwhile to further investigate structures or procedures that allow a smooth exchange on projects and implementation between different countries’ respective government levels.
Supplementary Materials
The following are available online at https://www.mdpi.com/2071-1050/13/4/2143/s1, Research data S1: Annexes A.1 to A.4.
Author Contributions
Conceptualization, methodology, validation, formal analysis, investigation: Marc Ringel. The author have read and approved the final manuscript.
Funding
The present contribution was developed within the framework of the Arab German Young Academy of Sciences and Humanities, and draws on financial support from the Berlin Brandenburg Academy of Sciences and the German Federal Ministry of Education and Research (BMBF). The authors are very grateful for this support. We acknowledge support by the German Research Foundation and the Open Access Publishing Fund of Technical University of Darmstadt.
Institutional Review Board Statement
Not applicable.
Informed Consent Statement
Informed consent was obtained from all subjects involved in the study.
Data Availability Statement
The authors declare no conflict of interest.
Acknowledgments
Rabab Saleh provided valuable input for the analysis of the city profiles and the statistical analysis. Charles Duquette supported this paper by providing linguistic editing. The author is very thankful for their support.
Conflicts of Interest
The authors declare no conflict of interest.
References
- United Nations DESA. World Urbanization Prospects 2018; UN: New York, NY, USA, 2018. [Google Scholar]
- BBSR. Wachsende und Schrumpfende Städte in Deutschland. Available online: https://www.bbsr.bund.de/BBSR/DE/Raumbeobachtung/InteraktiveAnwendungen/WachsendSchrumpfend/wachsend_schrumpfend_node.html (accessed on 15 July 2019).
- Griffiths, S. A review and assessment of energy policy in the Middle East and North Africa region. Energy Policy 2017, 102, 249–269. [Google Scholar] [CrossRef]
- Balta-Ozkan, N.; Boteler, B.; Amerighi, O. European smart home market development: Public views on technical and economic aspects across the United Kingdom, Germany and Italy. Energy Res. Soc. Sci. 2014, 3, 65–77. [Google Scholar] [CrossRef]
- Troy, A. The Very Hungry City: Urban Energy Efficiency and the Economic Fate of Cities; Yale Press: London, UK, 2012. [Google Scholar]
- Halleux, V. Briefing: Energy Union: The Regional and Local Dimension PE 568.356. 2015. Available online: https://www.europarl.europa.eu/RegData/etudes/BRIE/2015/568356/EPRS_BRI(2015)568356_EN.pdf (accessed on 25 February 2016).
- Eurostat. Greenhouse Gas Emission Statistics-Emission Inventories; Eurostat: Luxembourg, 2019. [Google Scholar]
- Bertelsmann Stiftung. Bertelsmann Stiftung’s Transformation Index (BTI). 2020. Available online: http://www.bti-project.org (accessed on 10 December 2020).
- Florczyk, A.; Corbane, C.; Schiavina, M.; Pesaresi, M.; Maffenini, L.; Melchiorri, M.; Politis, P.; Sabo, F. GHS Urban Centre Database 2015, Multitemporal and Multidimensional Attributes, R2019A. European Commission, Joint Research Centre (JRC) [Dataset]. Available online: https://data.jrc.ec.europa.eu/dataset/53473144-b88c-44bc-b4a3-4583ed1f547e (accessed on 20 August 2020).
- Charfeddine, L.; Al-Malk, A.; Al Korbi, K. Is it possible to improve environmental quality without reducing economic growth: Evidence from the Qatar economy. Renew. Sustain. Energy Rev. 2018, 82, 25–39. [Google Scholar] [CrossRef]
- Willis, K.S.; Aurigi, A. (Eds.) The Routledge Companion to Smart Cities; Routledge: Abingdon, Oxon, UK; New York, NY, USA, 2020; ISBN 9781138036673. [Google Scholar]
- Anthopoulos, L.G. Understanding Smart Cities: A Tool for Smart Government or an Industrial Trick? 1st ed.; Springer International Publishing: Cham, Switzerland, 2017; ISBN 3319570153. [Google Scholar]
- Abellá-García, A.; Ortiz-de-Urbina-Criado, M.; De-Pablos-Heredero, C. The Ecosystem of Services Around Smart Cities: An Exploratory Analysis. Procedia Comput. Sci. 2015, 64, 1075–1080. [Google Scholar] [CrossRef][Green Version]
- Lytras, M.; Visvizi, A. Information management as a dual-purpose process in the smart city: Collecting, managing and utilizing information. Int. J. Inf. Manag. 2021, 56, 102224. [Google Scholar] [CrossRef]
- Van Zoonen, L. Privacy concerns in smart cities. Gov. Inf. Q. 2016, 33, 472–480. [Google Scholar]
- Poletti, C.; Michieli, M. Smart cities, social media platforms and security: Online content regulation as a site of controversy and conflict. City Territ. Archit. 2018, 5, 1–14. [Google Scholar] [CrossRef]
- Snyder, L. Masdar City: The Source of Inspiration or Uneconomical Spending? Masdar Institute: Abu Dhabi, United Arab Emirates, 2009. [Google Scholar]
- Anonymous. Abu Dhabi’s Masdar Project: Dazzling? Or Just a Mirage? Electr. J. 2009, 22, 4–5. [Google Scholar] [CrossRef]
- Cugurullo, F. Exposing smart cities and eco-cities: Frankenstein urbanism and the sustainability challenges of the experimental city. Environ. Plan. A 2018, 50, 73–92. [Google Scholar] [CrossRef]
- Martin, C.J.; Evans, J.; Karvonen, A. Smart and sustainable? Five tensions in the visions and practices of the smart-sustainable city in Europe and North America. Technol. Forecast. Soc. Chang. 2018, 133, 269–278. [Google Scholar] [CrossRef]
- Silva, B.N.; Khan, M.; Han, K. Towards sustainable smart cities: A review of trends, architectures, components, and open challenges in smart cities. Sustain. Cities Soc. 2018, 38, 697–713. [Google Scholar] [CrossRef]
- Viitanen, J.; Kingston, R. Smart cities and green growth: Outsourcing democratic and environmental resilience to the global technology sector. Environ. Plan. A 2014, 46, 803–819. [Google Scholar] [CrossRef]
- Wachsmuth, D.; Angelo, H. Green and gray: New ideologies of nature in urban sustainability policy. Ann. Am. Assoc. Geogr. 2018, 108, 1038–1056. [Google Scholar] [CrossRef]
- Monfaredzadeh, T.; Krueger, R. Investigating Social Factors of Sustainability in a Smart City. Procedia Eng. 2015, 118, 1112–1118. [Google Scholar] [CrossRef]
- Jedliński, M. The Position of Green Logistics in Sustainable Development of a Smart Green City. Procedia Soc. Behav. Sci. 2014, 151, 102–111. [Google Scholar] [CrossRef]
- Sicilia, Á.; Madrazo, L.; Massetti, M.; Plazas, F.L.; Ortet, E. An energy information system for retrofitting smart urban areas. Energy Procedia 2017, 136, 85–90. [Google Scholar] [CrossRef]
- Pincetl, S. Cities in the age of the Anthropocene: Climate change agents and the potential for mitigation. Anthropocene 2017, 20, 74–82. [Google Scholar] [CrossRef]
- Letnik, T.; Marksel, M.; Luppino, G.; Bardi, A.; Božičnik, S. Review of policies and measures for sustainable and energy efficient urban transport. Energy 2018, 163, 245–257. [Google Scholar] [CrossRef]
- Mora, L.; Deakin, M. Smart city development as an ICT-driven approach to urban sustainability. In Untangling Smart Cities; Elsevier: Amsterdam, The Netherlands, 2019; pp. 19–55. ISBN 9780128154779. [Google Scholar]
- Kramers, A.; Höjer, M.; Lövehagen, N.; Wangel, J. Smart sustainable cities–Exploring ICT solutions for reduced energy use in cities. Environ. Model. Softw. 2014, 56, 52–62. [Google Scholar] [CrossRef]
- Yigitcanlar, T.; Kamruzzaman, M.; Foth, M.; Sabatini-Marques, J.; da Costa, E.; Ioppolo, G. Can cities become smart without being sustainable? A systematic review of the literature. Sustain. Cities Soc. 2019, 45, 348–365. [Google Scholar] [CrossRef]
- Bouzguenda, I.; Alalouch, C.; Fava, N. Towards smart sustainable cities: A review of the role digital citizen participation could play in advancing social sustainability. Sustain. Cities Soc. 2019, 50, 101627. [Google Scholar] [CrossRef]
- Nilssen, M. To the smart city and beyond? Developing a typology of smart urban innovation. Technol. Soc. Chang. 2019, 142, 98–104. [Google Scholar] [CrossRef]
- Addanki, S.C.; Venkataraman, H. Greening the economy: A review of urban sustainability measures for developing new cities. Sustain. Cities Soc. 2017, 32, 1–8. [Google Scholar] [CrossRef]
- Stübinger, J.; Schneider, L. Understanding Smart City—A Data-Driven Literature Review. Sustainability 2020, 12, 8460. [Google Scholar] [CrossRef]
- Dameri, R.P. Searching for Smart City definition: A comprehensive proposal. IJCT 2013, 11, 2544–2551. [Google Scholar] [CrossRef]
- Fernandez-Anez, V. (Ed.) Stakeholders Approach to Smart Cities: A Survey on Smart City Definitions; International conference on smart cities; Springer: Berlin/Heidelberg, Germany, 2016. [Google Scholar]
- Meijer, A.; Bolívar, M.P.R. Governing the smart city: A review of the literature on smart urban governance. Int. Rev. Adm. Sci. 2016, 82, 392–408. [Google Scholar] [CrossRef]
- Anthopoulos, L.G. Understanding the smart city domain: A literature review. In Transforming City Governments for Successful Smart Cities; Rodríguez-Bolívar, M.P., Ed.; Springer International Publishing: Cham, Switzerland, 2015; pp. 9–21. ISBN 978-3-319-03166-8. [Google Scholar]
- Cocchia, A. Smart and Digital City: A Systematic Literature Review. In Smart City: How to Create Public and Economic Value with High Technology in Urban Space; Dameri, R.P., Rosenthal-Sabroux, C., Eds.; Springer International Publishing: Cham, Switzerland, 2014; pp. 13–43. ISBN 978-3-319-06160-3. [Google Scholar]
- LugoSantiago, J.A. Techno City. In Leadership and Strategic Foresight in Smart Cities; LugoSantiago, J.A., Ed.; Springer International Publishing: Cham, Switzerland, 2020; pp. 63–68. ISBN 978-3-030-49019-5. [Google Scholar]
- Praharaj, S.; Han, H. Cutting through the clutter of smart city definitions: A reading into the smart city perceptions in India. City Cult. Soc. 2019, 18, 100289. [Google Scholar] [CrossRef]
- European Commission. Smart Cities. Available online: https://ec.europa.eu/info/eu-regional-and-urban-development/topics/cities-and-urban-development/city-initiatives/smart-cities_en (accessed on 8 February 2021).
- Muente-Kunigami, A.; Mulas, V. Smart Cities. Available online: https://www.worldbank.org/en/topic/digitaldevelopment/brief/smart-cities (accessed on 15 July 2019).
- Berg, J.C. Sharing Cities: A Case for Truly Smart and Sustainable Cities. New Political Sci. 2017, 39, 417–419. [Google Scholar] [CrossRef]
- Al-Thani, S.; Skelhorn, C.; Amato, A.; Koc, M.; Al-Ghamdi, S. Smart Technology Impact on Neighborhood Form for a Sustainable Doha. Sustainability 2018, 10, 4764. [Google Scholar] [CrossRef]
- Patrão, C.; Moura, P.; Almeida, A.T.d. Review of Smart City Assessment Tools. Smart Cities 2020, 3, 55. [Google Scholar] [CrossRef]
- Caird, S.P.; Hallett, S.H. Towards evaluation design for smart city development. J. Urban Design 2019, 24, 188–209. [Google Scholar] [CrossRef]
- Anthopoulos, L. Smart utopia VS smart reality: Learning by experience from 10 smart city cases. Cities 2017, 63, 128–148. [Google Scholar] [CrossRef]
- Pop, M.-D.; Proştean, O. A Comparison Between Smart City Approaches in Road Traffic Management. Proc. Soc. Behav. Sci. 2018, 238, 29–36. [Google Scholar] [CrossRef]
- Dameri, R.P.; Benevolo, C.; Veglianti, E.; Li, Y. Understanding smart cities as a glocal strategy: A comparison between Italy and China. Technol. Forecast. Soc. Chang. 2019, 142, 26–41. [Google Scholar] [CrossRef]
- Deloite. Insights Smart Cities. Available online: https://www2.deloitte.com/ye/en/pages/strategy/articles/smart-cities-where-to-go.html (accessed on 15 July 2019).
- PMR-Persistence Market Research Pvt. Ltd. Global Smart Cities Market. Available online: https://www.prnewswire.com/news-releases/global-smart-cities-market-to-reach-us-3482-trillion-by-2026-apej-to-outpace-north-america-609626355.html (accessed on 15 July 2019).
- Allam, Z.; Newman, P. Redefining the Smart City: Culture, Metabolism and Governance. Smart Cities 2018, 1, 2. [Google Scholar] [CrossRef]
- Saxena, S.; Al-Tamini, T. Visioning “smart city” across the Gulf Cooperation Council (GCC) countries. Foresight 2018, 20, 237–251. [Google Scholar] [CrossRef]
- Ramady, M.A. The GCC Economies; Springer: New York, NY, USA, 2012; ISBN 978-1-4614-1610-4. [Google Scholar]
- Asif, M. Growth and sustainability trends in the buildings sector in the GCC region with particular reference to the KSA and UAE. Renew. Sustain. Energy Rev. 2016, 55, 1267–1273. [Google Scholar] [CrossRef]
- Ringel, M.; Laidi, R.; Djenouri, D. Multiple Benefits through Smart Home Energy Management Solutions—A Simulation-Based Case Study of a Single-Family-House in Algeria and Germany. Energies 2019, 12, 1537. [Google Scholar] [CrossRef]
- Bisello, A.; Vettorato, D.; Stephens, R.; Elisei, P. Smart and Sustainable Planning for Cities and Regions; Springer International Publishing: Cham, Switzerland, 2017; ISBN 978-3-319-44898-5. [Google Scholar]
- Ringel, M.; Schlomann, B.; Krail, M.; Rohde, C. Towards a green economy in Germany?: The role of energy efficiency policies. Appl. Energy 2016, 179, 1293–1303. [Google Scholar] [CrossRef]
- Stratigea, A.; Papadopoulou, C.; Panagiotopoulou, M. Tools and technologies for the planning of smart cities. J. Urban Technol. 2015, 22, 43–62. [Google Scholar] [CrossRef]
- Walravens, N. Qualitative indicators for smart city business models: The case of mobile services and applications. Telecommun. Policy 2015, 39, 218–240. [Google Scholar] [CrossRef]
- Vidiasova, L.; Kachurina, P.; Cronemberger, F. Smart Cities Prospects from the Results of the World Practice Expert Benchmarking. Procedia Comput. Sci. 2017, 119, 269–277. [Google Scholar] [CrossRef]
- TU Wien; University of Ljubliana; TU Delft. Smart Cities-Ranking of European Medium-Sized Cities; TU Delft: Delft, The Netherlands, 2007. [Google Scholar]
- Phondani, P.C.; Bhatt, A.; Elsarrag, E.; Alhorr, Y.M.; El-Keblawy, A. Criteria and indicator approach of global sustainability assessment system for sustainable landscaping using native plants in Qatar. Ecol. Indic. 2016, 69, 381–389. [Google Scholar] [CrossRef]
- Escolar, S.; Villanueva, F.J.; Santofimia, M.J.; Villa, D.; Toro, X.d.; López, J.C. A Multiple-Attribute Decision Making-based approach for smart city rankings design. Technol. Soc. Chang. 2018. [Google Scholar] [CrossRef]
- Fraunhofer Gesellschaft. Morgenstadt-City of the Future. Innovation Areas. Available online: https://www.morgenstadt.de/en.html (accessed on 15 July 2019).
- Akande, A.; Cabral, P.; Gomes, P.; Casteleyn, S. The Lisbon ranking for smart sustainable cities in Europe. Sustain. Cities Soc. 2019, 44, 475–487. [Google Scholar] [CrossRef]
- Stanković, J.; Džunić, M.; Džunić, Ž.; Marinković, S. A multi-criteria evaluation of the European cities’ smart performance: Economic, social and environmental aspects. Zb. Rad. Ekon. Fak. Rij. 2017, 35, 519–550. [Google Scholar] [CrossRef]
- Matsuo, Y. Historical Trends and Long-Term Outlook for Energy Supply and Demand in the United Arab Emirates and the Effects of Energy Conservation Technologies. Available online: https://eneken.ieej.or.jp/data/6115.pdf (accessed on 16 February 2021).
- Löbsinger-Kägi, E.; Weiss Sampietro, T.; Eschenauer, U.; Carabias-Hütter, V.; Braunreiter, L.; Müller, A.W. Treiber und Barrieren auf dem Weg zu einer Smart City. Erkenntnisse aus Theorie und Praxis. In Energy Governance Working Paper; ZHAW School of Mangement and Law, Ed.; ZHAW: Zurich, Switzerland, 2016; pp. 1–31. [Google Scholar]
- Alawadhi, S.; Scholl, H.J. (Eds.) Smart Governance: A Cross-Case Analysis of Smart City Initiatives. Available online: https://ieeexplore.ieee.org/document/7427553 (accessed on 16 February 2021).
- Taylor, R. Media Interview Techniques. A Complete Guide to Media Training; Kogan Page: London, UK; Philadelphia, PA, USA, 2016; ISBN 9780749474737. [Google Scholar]
- Field, A. Discovering Statistics Using IBM SPSS Statistics, 5th ed.; Sage: Los Angeles, CA, USA, 2018. [Google Scholar]
- Senatsverwaltung für Stadtentwicklung und Umwelt. Smart City-Strategie Berlin. Available online: https://www.berlin-partner.de/fileadmin/user_upload/01_chefredaktion/02_pdf/02_navi/21/Strategie_Smart_City_Berlin.pdf (accessed on 19 July 2019).
- Blanchet, T. Struggle over energy transition in Berlin: How do grassroots initiatives affect local energy policy-making? Energy Policy 2015, 78, 246–254. [Google Scholar] [CrossRef]
- Li, H.; Meier, F.; Lee, X.; Chakraborty, T.; Liu, J.; Schaap, M.; Sodoudi, S. Interaction between urban heat island and urban pollution island during summer in Berlin. Sci. Total Environ. 2018, 636, 818–828. [Google Scholar] [CrossRef] [PubMed]
- Moss, T.; Francesch-Huidobro, M. Realigning the electric city. Legacies of energy autarky in Berlin and Hong Kong. Energy Res. Soc. Sci. 2016, 11, 225–236. [Google Scholar] [CrossRef]
- Ehrhardt, F. (Ed.) Sustainable Mobility for Berlin-Green.Smart.Digital; TU Berlin: Berlin, Germany, 2016. [Google Scholar]
- Vogelpohl, A.; Klemp, F. The creeping influence of consultants on cities: McKinsey’s involvement in Berlin’s urban economic and social policies. Geoforum 2018, 91, 39–46. [Google Scholar] [CrossRef]
- Senator für Umwelt, Bau und Verkehr. Masterplan Green City Bremen. Available online: https://www.bauumwelt.bremen.de/sixcms/media.php/13/20180813%20Masterplan%20Green%20City%20Bremen%20V1.1%20-%20Leseversion.39677.pdf (accessed on 19 July 2019).
- Kusch, W.; Stadler, I.; Bhandari, R. (Eds.) Heat Pumps in Low Voltage Distribution Grids by Energy Storage. Available online: https://ieeexplore.ieee.org/document/7384386 (accessed on 10 December 2020).
- Reiswich, E.; Köster, F.; Nitschke, J. Touchdown in the Hamburg port-Development of a digital sounding-table as component of the smartPORT concept in the Hamburg port. ZFV Z. Geodasie Geoinf. Landmanagement 2016, 141, 317–321. [Google Scholar] [CrossRef]
- Welzel, R.-W.; Eichhorn, T. Urban development in the digital city of Hamburg-Modern, innovative, future-proof. ZFV Z. Geodasie Geoinf. Landmanagement 2016, 141, 322–329. [Google Scholar] [CrossRef]
- Huang-Lachmann, J.-T.; Lovett, J.C. How cities prepare for climate change: Comparing Hamburg and Rotterdam. Cities 2016, 54, 36–44. [Google Scholar] [CrossRef]
- Stadt München. München Als Smart City. Available online: https://www.muenchen.de/rathaus/Stadtverwaltung/Referat-fuer-Stadtplanung-und-Bauordnung/Stadtentwicklung/Perspektive-Muenchen/Smart-City.html (accessed on 22 November 2020).
- Scholl, H.J.; Alawadhi, S. (Eds.) Pooling and Leveraging Scarce Resources: The Smart eCity Gov Alliance. Available online: https://ieeexplore.ieee.org/document/7070097 (accessed on 21 January 2021).
- Kesselring, S. Planning in Motion. In The New Politics of Mobility in Munich; Springer: Wiesbaden, Germany, 2016. [Google Scholar]
- Freudendal-Pedersen, M.; Kesselring, S.; Servou, E. What is smart for the future city? Mobilities and automation. Sustainability 2019, 11, 221. [Google Scholar] [CrossRef]
- Tucci, F.; Santucci, D.; Endres, E.; Hausladen, G. Smart urban districts: Dynamic energy systems for synergic interactions between building and city. TECHNE 2018, 1, 92–102. [Google Scholar] [CrossRef]
- Angelidou, M. The Role of Smart City Characteristics in the Plans of Fifteen Cities. J. Urban Technol. 2017, 24, 3–28. [Google Scholar] [CrossRef]
- Huston, S.; Rahimzad, R.; Parsa, A. ‘Smart’ sustainable urban regeneration: Institutions, quality and financial innovation. Cities 2015, 48, 66–75. [Google Scholar] [CrossRef]
- Tok, E.; Al Mohammed, F.; Al Merrekhi, M. Crafting Smart Cities in the Gulf Region: A Comparison of Masdar and Lusail. Eur. Sci. J. 2014, 130–140. [Google Scholar]
- Shelton, T.; Zook, M.; Wiig, A. The ‘actually existing smart city’. Camb. J. Reg. Econ. Soc. 2015, 8, 13–25. [Google Scholar] [CrossRef]
- Lau, A. Masdar City: A model of urban environmental sustainability. Soc. Sci. 2012, 4, 77–82. [Google Scholar]
- Masdar Company. Advancing Sustainability; Masdar 2013 Sustainability Report; Masdar Institute: Abu Dhabi, United Arab Emirates, 2013. [Google Scholar]
- Masdar Institute. Masdar Sustainability Report; Masdar Company: Abu Dhabi, United Arab Emirates, 2014. [Google Scholar]
- Masdar Company. A Decade of Delivering; Sustainability Report 2016; Masdar Company: Abu Dhabi, United Arab Emirates, 2016. [Google Scholar]
- Lee, S.E.; Braithwaite, P.; Leach, J.M.; Rogers, C.D.F. A comparison of energy systems in Birmingham, UK, with Masdar City, an embryonic city in Abu Dhabi Emirate. Renew. Sustain. Energy Rev. 2016, 65, 1299–1309. [Google Scholar] [CrossRef]
- Reiche, D. Renewable Energy Policies in the Gulf countries: A case study of the carbon-neutral “Masdar City” in Abu Dhabi. Energy Policy 2010, 38, 378–382. [Google Scholar] [CrossRef]
- Kamel, M.A.E. Encouraging walkability in GCC cities: Smart urban solutions. Smart Sustain. Built Environ. 2013, 2, 288–310. [Google Scholar] [CrossRef]
- Ibrahim, I. Livable Eco-Architecture Masdar City, Arabian Sustainable City. Procedia Soc. Behav. Sci. 2016, 216, 46–55. [Google Scholar] [CrossRef]
- Madakam, S.; Ramaswamy, R. Sustainable smart city: Masdar (UAE) (A city: Ecologically balanced). Indian J. Sci. Technol. 2016, 9. [Google Scholar] [CrossRef]
- Sodiq, A.; Baloch, A.A.B.; Khan, S.A.; Sezer, N.; Mahmoud, S.; Jama, M.; Abdelaal, A. Towards modern sustainable cities: Review of sustainability principles and trends. J. Clean. Prod. 2019, 227, 972–1001. [Google Scholar] [CrossRef]
- Bint Butti Bin Bishr, A.; Geray, O. Smart Dubai—Towards becoming thehappiest city on Earth. Available online: https://www.smartdubai.ae/docs/default-source/publications/a-better-world-vol-5_sdo.pdf?sfvrsn=ed5f5543_0 (accessed on 17 February 2021).
- futureXchanges. Dubai Plan 2021. Available online: https://thehappycity.com/wp-content/uploads/2017/09/170521_DP2021_FutureXchanges-2017_Full-Report_EN.pdf (accessed on 17 February 2021).
- IQPC Middle East. Dubai Set to be Smartest City: Dubai Plan 2021. Available online: file:///C:/Users/MARC~1.RIN/AppData/Local/Temp/dubai-set-to-be-smartest-city-dubai-plan-2021.pdf (accessed on 17 February 2021).
- Zakzak, L.; Salem, F. Building a Happy City—The Case of Smart Dubai’s Happiness Agenda. In Future Governments; Stephens, M., El-Sholkamy, M., Moonesar, I.A., Awamleh, R., Eds.; Emerald Publishing Limited: Bingley, UK, 2019; pp. 271–301. ISBN 978-1-78756-360-5. [Google Scholar]
- The Economist. Government Releases New Kuwait 2035 Strategic Plan. Available online: http://country.eiu.com/article.aspx?articleid=1675084151 (accessed on 17 July 2019).
- Al-Mutairi, A.; Smallbone, A.; Al-Salem, S.M.; Roskilly, A.P. The first carbon atlas of the state of Kuwait. Energy 2017, 133, 317–326. [Google Scholar] [CrossRef]
- Alotaibi, S. Energy consumption in Kuwait: Prospects and future approaches. Energy Policy 2011, 39, 637–643. [Google Scholar] [CrossRef]
- Gelan, A. Economic and environmental impacts of electricity subsidy reform in Kuwait: A general equilibrium analysis. Energy Policy 2018, 112, 381–398. [Google Scholar] [CrossRef]
- Gelan, A.U. Kuwait’s energy subsidy reduction: Examining economic and CO2 emission effects with or without compensation. Energy Econ. 2018, 71, 186–200. [Google Scholar] [CrossRef]
- Jaffar, B.; Oreszczyn, T.; Raslan, R.; Summerfield, A. Understanding energy demand in Kuwaiti villas: Findings from a quantitative household survey. Energy Build. 2018, 165, 379–389. [Google Scholar] [CrossRef]
- Salahuddin, M.; Alam, K.; Ozturk, I.; Sohag, K. The effects of electricity consumption, economic growth, financial development and foreign direct investment on CO2 emissions in Kuwait. Renew. Sustain. Energy Rev. 2018, 81, 2002–2010. [Google Scholar] [CrossRef]
- Krarti, M.; Ali, F.; Alaidroos, A.; Houchati, M. Macro-economic benefit analysis of large scale building energy efficiency programs in Qatar. Int. J. Sustain. Built Envrion. 2017, 6, 597–609. [Google Scholar] [CrossRef]
- Rodriguez-Trejo, S.; Ahmad, A.M.; Hafeez, M.A.; Dawood, H.; Vukovic, V.; Kassem, M.; Naji, K.K.; Dawood, N. Hierarchy based information requirements for sustainable operations of buildings in Qatar. Sustain. Cities Soc. 2017, 32, 435–448. [Google Scholar] [CrossRef]
- Ayoub, N.; Musharavati, F.; Pokharel, S.; Gabbar, H.A. Energy consumption and conservation practices in Qatar—A case study of a hotel building. Energy Build. 2014, 84, 55–69. [Google Scholar] [CrossRef]
- Al-Marri, W.; Al-Habaibeh, A.; Watkins, M. An investigation into domestic energy consumption behaviour and public awareness of renewable energy in Qatar. Sustain. Cities Soc. 2018, 41, 639–646. [Google Scholar] [CrossRef]
- Abdmouleh, Z.; Gastli, A.; Ben-Brahim, L. Survey about public perception regarding smart grid, energy efficiency & renewable energies applications in Qatar. Renew. Sustain. Energy Rev. 2018, 82, 168–175. [Google Scholar] [CrossRef]
- Garson, G.D. Cluster Analysis; Statistical Associates Publishers: Asheboro, NC, USA, 2012. [Google Scholar]
- Azzari, M.; Garau, C.; Nesi, P.; Paolucci, M.; Zamperlin, P. Smart City Governance Strategies to Better Move Towards a Smart Urbanism. In Computational Science and Its Applications–ICCSA 2018; Gervasi, O., Murgante, B., Misra, S., Stankova, E., Torre, C.M., Rocha, A.M.A.C., Taniar, D., Apduhan, B.O., Tarantino, E., Ryu, Y., Eds.; Springer International Publishing: Cham, Switzerland, 2018; pp. 639–653. ISBN 978-3-319-95167-6. [Google Scholar]
- Desdemoustier, J.; Crutzen, N.; Giffinger, R. Municipalities’ understanding of the Smart City concept: An exploratory analysis in Belgium. Technol. Soc. Chang. 2018. [Google Scholar] [CrossRef]
- Tegel Projekt GmbH. Tegel Projekt the Urban Tech Republic. Facts and Figures. Available online: https://www.tegelprojekt.de/en/press/detail/facts-figures-berlin-txl-the-urban-tech-republic.html (accessed on 17 July 2019).
- Stadt Köln. Smart City Cologne. Available online: https://www.smartcity-cologne.de/index.php/partner.html (accessed on 15 July 2019).
- Katzer, D. Intergeo 2016 update: Smart city Hamburg. Geo Connex. 2016, 15, 32. [Google Scholar]
- UN Habitat. World-City Prosperity Index, and the Components of Its 5 Dimensions. Available online: https://data.world/unhabitat-guo/a96a76be-c5ad-4704-a3ab-695218caa85a (accessed on 18 October 2019).
Publisher’s Note: MDPI stays neutral with regard to jurisdictional claims in published maps and institutional affiliations. |
© 2021 by the author. Licensee MDPI, Basel, Switzerland. This article is an open access article distributed under the terms and conditions of the Creative Commons Attribution (CC BY) license (http://creativecommons.org/licenses/by/4.0/).