Article

Monthly, Seasonal and Yearly Assessments of Global Solar Radiation, Clearness Index and Diffuse Fractions in Alice, South Africa

Fort Hare Institute of Technology, University of Fort Hare, Alice 5700, South Africa
*
Author to whom correspondence should be addressed.
Sustainability 2021, 13(4), 2135; https://doi.org/10.3390/su13042135
Submission received: 22 January 2021 / Revised: 2 February 2021 / Accepted: 3 February 2021 / Published: 17 February 2021

Abstract

:
The constant scheduled load shedding in South Africa has commonly been executed in an attempt to maintain the long aging coal power plants in the country. With the rise in the reduction of fossil fuels, efforts to eradicate environmental hazards of carbon through solar photovoltaic (PV) resources to their complete prospect are in progress. South Africa, and in particular the town Alice, acquires sunshine annually, making it appropriate to harvest solar energy. This work aims to characterize solar radiation, clearness index (Kt), and diffuse fraction (Kd) in Alice, South Africa. Hourly global and diffuse solar irradiance were estimated into monthly, seasonal, and yearly variations of Kt and Kd for the years 2017–2020. The range of values for describing the daily classification of sky condition was centered on earlier studies. The cumulative frequency and frequency distribution of daily Kt was analyzed statistically in an individual month. The analyses show that the average percentage frequency of Kt within the period is 11.72% of the cloudy days, 57% of partially cloudy days, and 31.28% of clear sky days. The findings of this research show that Alice remains a key contender for solar energy conversion location, owing to its reasonably high frequency (Kt > 0.40) of clear and partially cloudy skies. Hence, it is essential to establish energy-efficiency for energy consumption and also for daily performances.

1. Introduction

A detailed description of solar radiation on the earth’s surface is essential to explore the potentials of solar resources, given that a majority of places across the universe have an abundance of sunshine [1]. Solar radiation has the possibility to be a source of a substantial quantity of electricity that is both economically and environmentally attractive. Furthermore, it helps in the examination of climatic change and global warming [2] as well as the calculation of clearness index (Kt) and diffuse fraction (Kd). Scattering and absorption by particles of aerosol and gasses can bring about a sharp decline of the solar radiation that attains the earth’s surface. In addition, the dissemination of solar radiation in the atmosphere can also be interrupted by cloud and water. The quantity of solar radiation reaching the earth’s surface is ascertained by the hour of the day, the season of the year, and solar angles, amongst which are the sun’s altitude angle, azimuth angle, zenith angle, and declination angle [3,4]. Unfortunately, there are only a few methods developed to characterize sky conditions which can monitor the solar radiation measurements on the earth’s surface, despite the increasing awareness of the significance of cloud on the climate system [5]. Solar radiation data are critical to research examining atmospheric phenomena, as the quantity of solar radiation reaching the surface of the earth remains the motivating force for most weather practice. For instance, information arising from solar radiation needs to develop parameterization of clouds required in general circulation models (GCMs) [6]. In the same vein, data, as regards geographical circulation in addition to variabilities of solar radiant energy on the surface of the earth, are needed to declare Kt of the sky for weather and climatic studies as well as agricultural activities.
The Kt, however, describes the quantity of the global solar radiation to the corresponding extra-terrestrial radiation. It is thus a reliable instrument for description of sky conditions for a specific area [7]. Additionally, Kt provides the percentage reduction by the sky of the inflowing global radiation and so specifies equally the level of accessibility of solar radiation and variations in atmospheric conditions of a specified region. Hence, Kt is not only beneficial in measuring the cloudiness of day but also as a pointer to the fractions of diffuse/direct radiation. The higher the value of the Kt during the day/month, the less cloudy the day/month, and so the more significant the fraction of direct radiation. Numerous studies have applied Kt and Kd to constitute sky conditions in different regions [8,9,10]. Specifically, Liu ad Jordan, in 1960, established the sky conditions at other places involving Kt, diffuse coefficient, and diffuse ratio and inferred that the lengthy circulation of daily global radiation agrees to a specific value of monthly average Kt [9]. In South Africa, the diffuse radiation yields approximately 30% of the yearly short-wave energy obtained. In many places in the country, 523,000 and 581,111 Wh/m2 are obtained indirectly annually. This quantity is compared to 546,244 and 499, 756 Wh/m2 which Brussels and Berlin respectively obtain annually with the ratio between diffuse and total radiation as 0.55 [11]. A similar research on Kt has been executed by Tamara Rosemary [12] for Pietermaritzburg, KwaZulu-Natal. Moreover, a few research works have been conducted on the evaluation of diffuse radiation on horizontal surfaces employing parametric and decomposition models [13]. A similar study to determine the diffuse radiation on a horizontal surface by means of diffuse radiation models was conducted in southeast Australia [14].
Regardless of the importance of Kt, solar radiation, particularly the diffuse component, is rarely researched compared to other parameters, for example, rainfall and temperature [15]. There is a noticeable deficiency in solar radiation information in several countries, for instance, the USA, Canada, and Australia [16]. It is in those regions of the world gifted with a plentiful amount of annual solar energy, such as South Africa, that its constancy and precise measurements are smallest. The deficiencies in these countries might perhaps be a result of expensive instruments, lack of trained personnel, and government interests. Because of these difficulties, many researchers have put more interest into empirical models which are developed in other geographical sites with different atmospheric conditions. This resulted in challenges in estimating and understanding the features (monthly, seasonal, and yearly) of solar radiation that are available for harnessing in electrical applications for some areas. Notwithstanding these challenges, a few kinds of research have been undertaken in Alice, South Africa, notably [17,18,19,20].
Most of the previous studies in Alice were carried out without extensive investigation of the Kt and Kd of the region. Hence, the current input examines, regarding the prevalent atmospheric conditions over the location, the monthly, seasonal, and yearly changes of daily Kt and Kd calculated, which centered on the measured hourly changes of diffuse and global solar radiation at SolarWatt park, University of Fort Hare, South Africa. The description of sky conditions observed in the location via the Kt is examined in detailed.

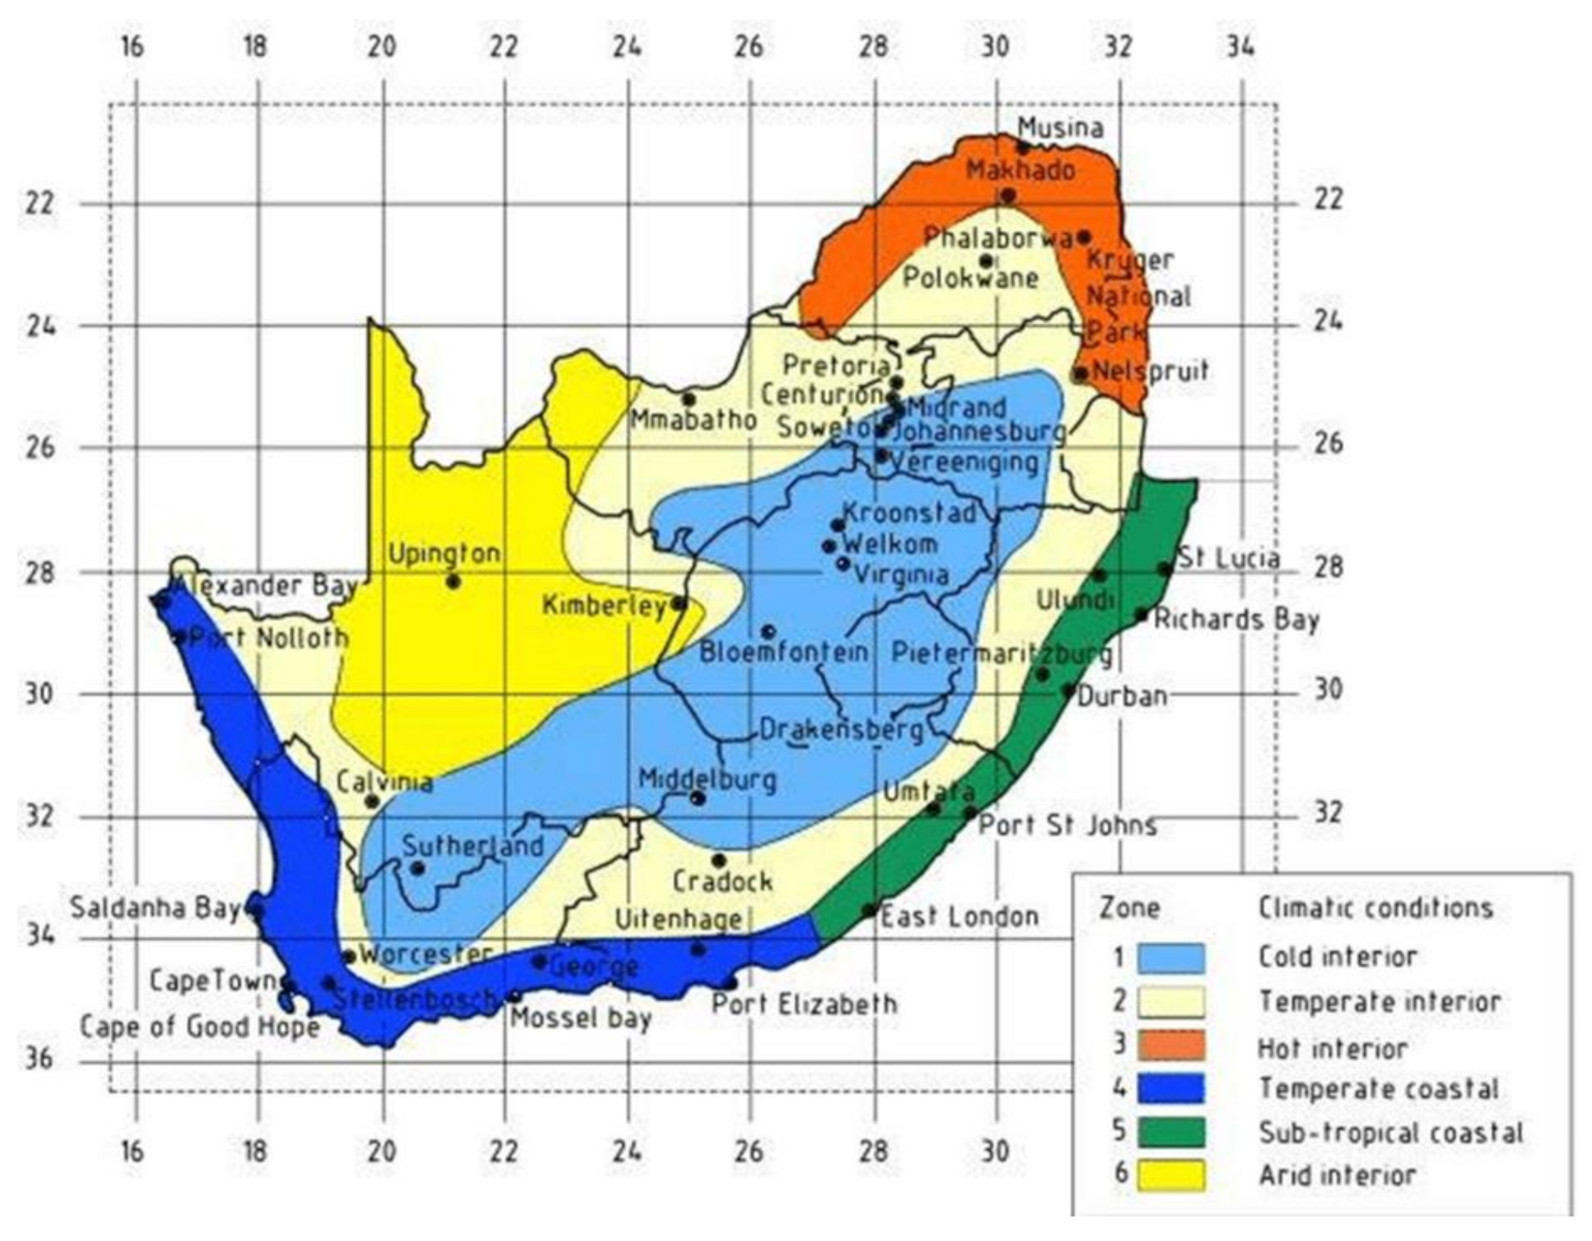
1.1. The Study Location and Meteorological Features

Alice lies at 32.8°S and 26.8°E, an altitude of 540 m, and west of East London, Eastern cape, South Africa. The town is surrounded by hills, lies in a hollow, and is brown for much of the year but frequently green in summer when the rains are plentiful [21]. Similar to various South African cities, Alice stretches out over a big region with the usual grid-iron shape of streets, and each house possesses a big garden. In contrast to the plain hills surrounding the town, the streets are copiously lined with trees, and after a period of drought the town looks like an oasis which spreads out over the hills after rain. The great Lovedale college is situated north of Alice, whereas the University of Fort Hare lies east of the town. These topographical variations and location, as presented in Figure 1, are the basis of the climatic changes and settings observed by the town within the region.
On the other hand, Alice, in line with other parts of the country, experiences summer and winter as the two significant seasons, while spring and autumn are very short. They all affect the daily weather structures. These seasons include the following months: November–March represents summer season, autumn is April and May, June–August are the winter months, and, finally, spring is September and October. The average temperature for the year is about 16.88 °C while the lowest monthly average daily temperature, being 15 °C, was recorded in June [23]. Moreover, referring to the Köppen-Geiger climate classification, the value of 711.2 mm was found as the yearly average amount of precipitation in Alice, while February is the month with the most precipitation with an average of 88.9 mm. The report further states that June has an average minimum precipitation value of 22.9 mm. The rainfall here is significantly less than on the mountains, which can decrease to an average of about 508 mm per year with highest in summer. Autumn and winter are mostly characterized by fog with rare thunderstorms. Severe gales with high winds are likely experienced in winter.

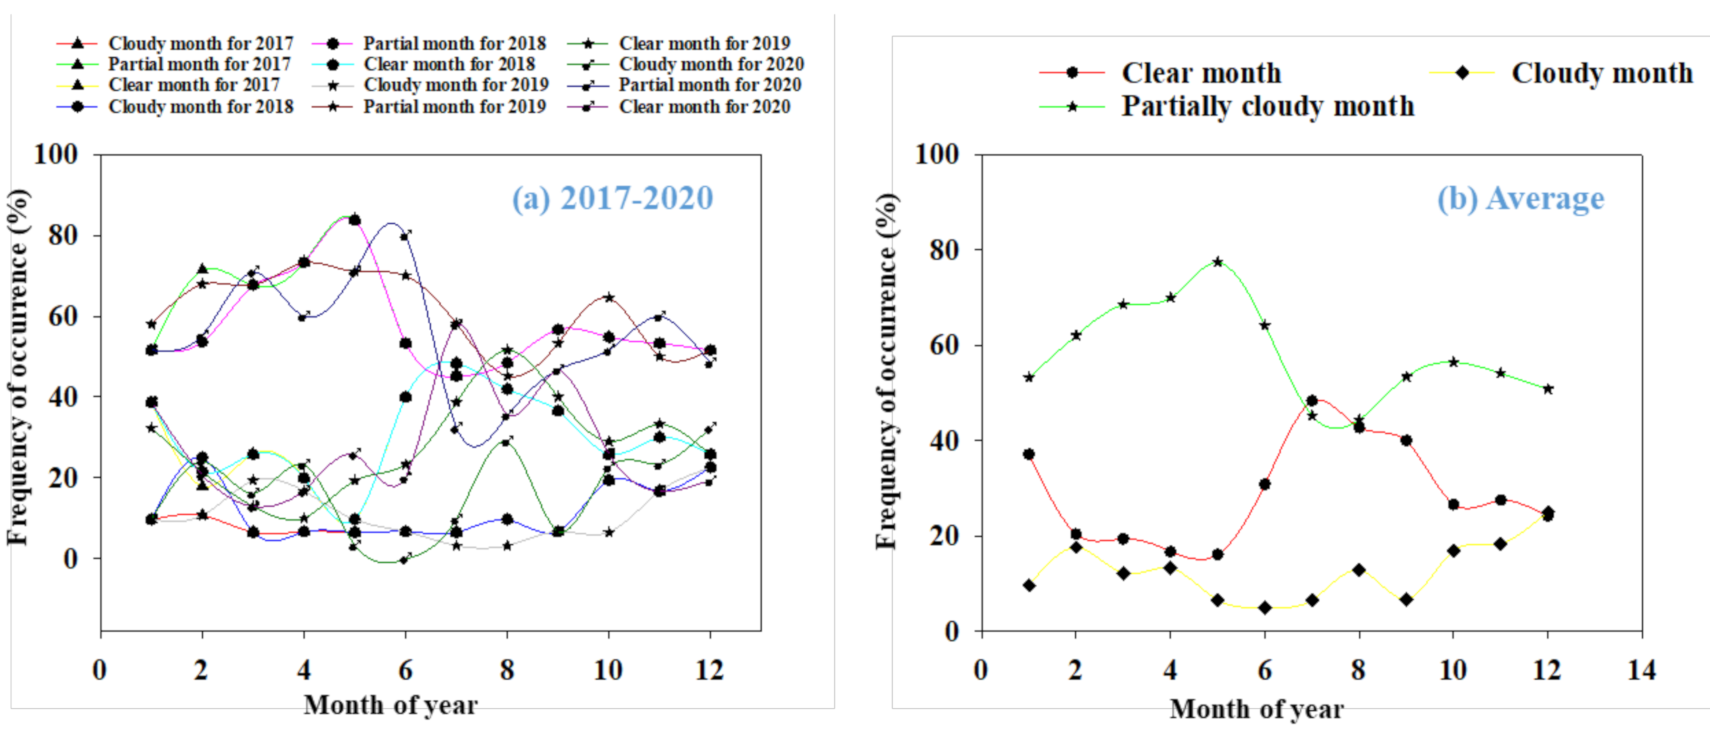
1.2. Descriptions of Sky Conditions

According to the pioneer research conducted by [16], the sky conditions (clear, partially-cloudy, and cloudy skies) were used to statistically analyze Kt of a particular region. Clear-sky weather is observed on days when the clouds are absent. Partially-cloudy skies are those days when solar radiation varies rapidly owing to the existence of brief cloud. The briefness incites continuous changes in solar radiation, generating uneasy conditions to forecast when the clouds will not obstruct the sunlight [24]. Under cloudy-sky weather conditions, solar radiation generates low values all through the day owing to the existence of clouds which can be circulated over various atmospheric strata. Moreover, in reference to the weather glossary from timeanddate.com [25], the ‘Clear’ sky describes a sky condition below 1/10 of cloud being protected. The ‘Partially Cloudy’ condition describes the sky condition when between 7/10 and 3/10 of the sky is protected and is applied more often at night. The ‘Clouds’ sky condition is described as a cloud cover that protects between three eights and one half of the sky. However, stability of air is the main factor that regulates cloud form in the atmosphere. The unstable air is likely to rise on its own whereas the stable air tend to persist at a similar levels in the atmosphere. Temporarily, unstable air maintains its level up to a point when some forces offer an initial stimulus, and then continues to increase on its own. The descriptions of Kt with respect to sky conditions are presented in Table 1.
Hence, the data from daily Kt could be used to describe cumulative frequency (CF) and is defined here, as shown in Equation (1).
C F = Number   of   days   with   Kt   Kt fixed   value N u m b e r   o f   d a y s   i n   t h e   m o n t h   x   100 %
Moreover, with the help of global solar radiation data measured and Kt calculated, Equation (5) could be used to study the Kt of frequency and cumulative distribution curve which have been applied in many research works for a long period.

2. Materials and Methods

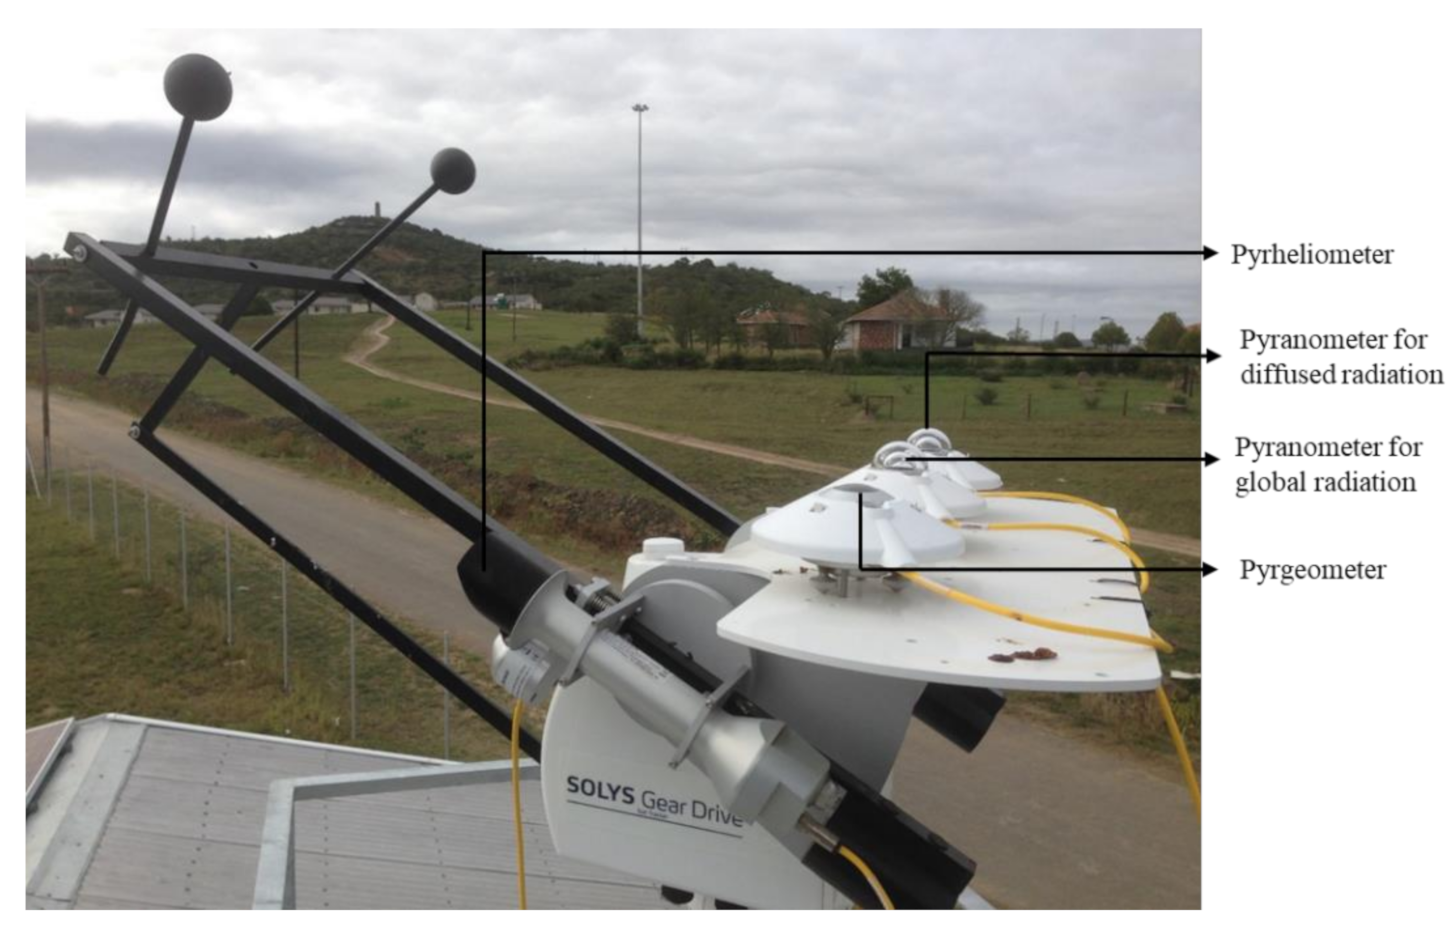
2.1. Data and Instrumentations

The quantities of both diffuse and global solar radiation data in kWh/m2/day were averaged on hourly bases and were measured starting from January to December (2017–2020) each year. The setup of the solar radiation measurement was strategically stationed on the rooftop of a commercial building at SolarWatt park inside campus, University of Fort Hare, South Africa, as shown in Figure 2. The station was set up to retrieve meteorological data continually. The only exceptions occured for a little time when some of the devices used were interrupted for recalibrations. The simultaneous measurements of the direct normal irradiance (DNI), diffuse horizontal irradiance (DHI), and global horizontal irradiance (GHI) of sky conditions were performed by SOLYS Gear Drive (SGD) sun tracker [5]. The SGD sun tracker measurement comprises two sets of CMP10 pyranometers: a CHP 1 pyrheliometer and CGR4 pyrgeometer. The instrument was developed to counterbalance daily seasonal variations of the earth and, hence, always focus on the payload in the direction of the sun. The technique is quite achievable as a result of the sun sensor that was fixed in the tracking system. The sun sensor, on detecting the highest region of solar intensity in the atmosphere, focuses the payloads to such region and then captures radiation at the instant.
In addition to the sun sensors, the sun tracker makes use of both the local time and coordinate acquired by the integrated GPS antenna to detect the diurnal rotation of the sun. Similarly, the pyrheliometer, which always focuses on the direction of the sun, measures DNI that is mounted on the payload. On the other hand, the pyrgeometer, as well as two other pyranometers placed on the first and last rack of the sun tracker, rotate about their axes. As a result, the pyrgeometer measures downward longwave radiation; that is, the re-emitted (infrared) radiation of the atmosphere. At the same time, the diffuse solar irradiance measurement was done by a pyranometer that situated at the last end of the rack. The pyrgeometer was shielded by a shading assembly to protect it from direct short-wave solar radiation that heats the pyrgeometer window. Similarly, the pyranometer situated at the middle measures both the DNI and DHI on a horizontal surface.

2.2. Estimation of Extra-Terrestrial Radiations, Clearness Index and Diffuse Fraction on a Horizontal Surface

2.2.1. Extra-terrestrial Radiations (Ho)

The extra-terrestrial radiation (Ho) for any given day at a specific location describes the radiation measurements on a horizontal surface at the location in the absence of any atmospheric influence. As such, it depends on latitude (φ) and day number (n) of year only [13], and therefore can be calculated at any location for any particular day from sunrise to sunset. It is measured in M Jm−2 day−1 and given in Equation (2).
H o = 24 × 3600 I s c π 1 + 0.033 cos 360 n 365 × cos φ cos δ sin ω + π ω 180 sin φ sin δ
where Isc = 1367 W/m2 (solar constant)
φ = latitude of site
δ = declination angle which is determined by Equation (3)
n = day number
ω = hour angle and is given by Equation (4)
δ = 23.45 sin 360 365 248 + n
ω = cos 1 tan φ tan δ
The three main sky conditions that influence the radiations are clear skies, variable/partially cloudy skies, and cloudy/overcast skies. In solar energy resources, cloud cover is the primary source of instability, emanating from second to minute and hours to days.

2.2.2. Correlation of Clearness Index and Diffuse Fraction

The correlation between diffuse and global irradiance is space and time dependent [26]. The Kt, as described in Equation (5), depends on global irradiance and therefore describes the weather conditions in which its influence changes from place to place [12]. Thus, the Kt could be regarded as an attenuation feature of the atmosphere. Hence, it is an unsystematic factor that fluctuates with the season, geographical location, time of the year, and climatic condition [8].
K t = G H o
where G = global horizontal solar radiation.
Moreover, Kt is a dimensionless number between zero and one. The amount of Kt includes the content of transparency in the parameters of clear and cloudy skies. Its value could be detached on a daily or hourly basis. The Kd, however, describes the measure of the diffuse solar radiation incident on a horizontal plane to the global solar radiation incident on a similar plane. It selects the part of the reflected solar radiation that is diffusely reflected.

3. Results and Discussion

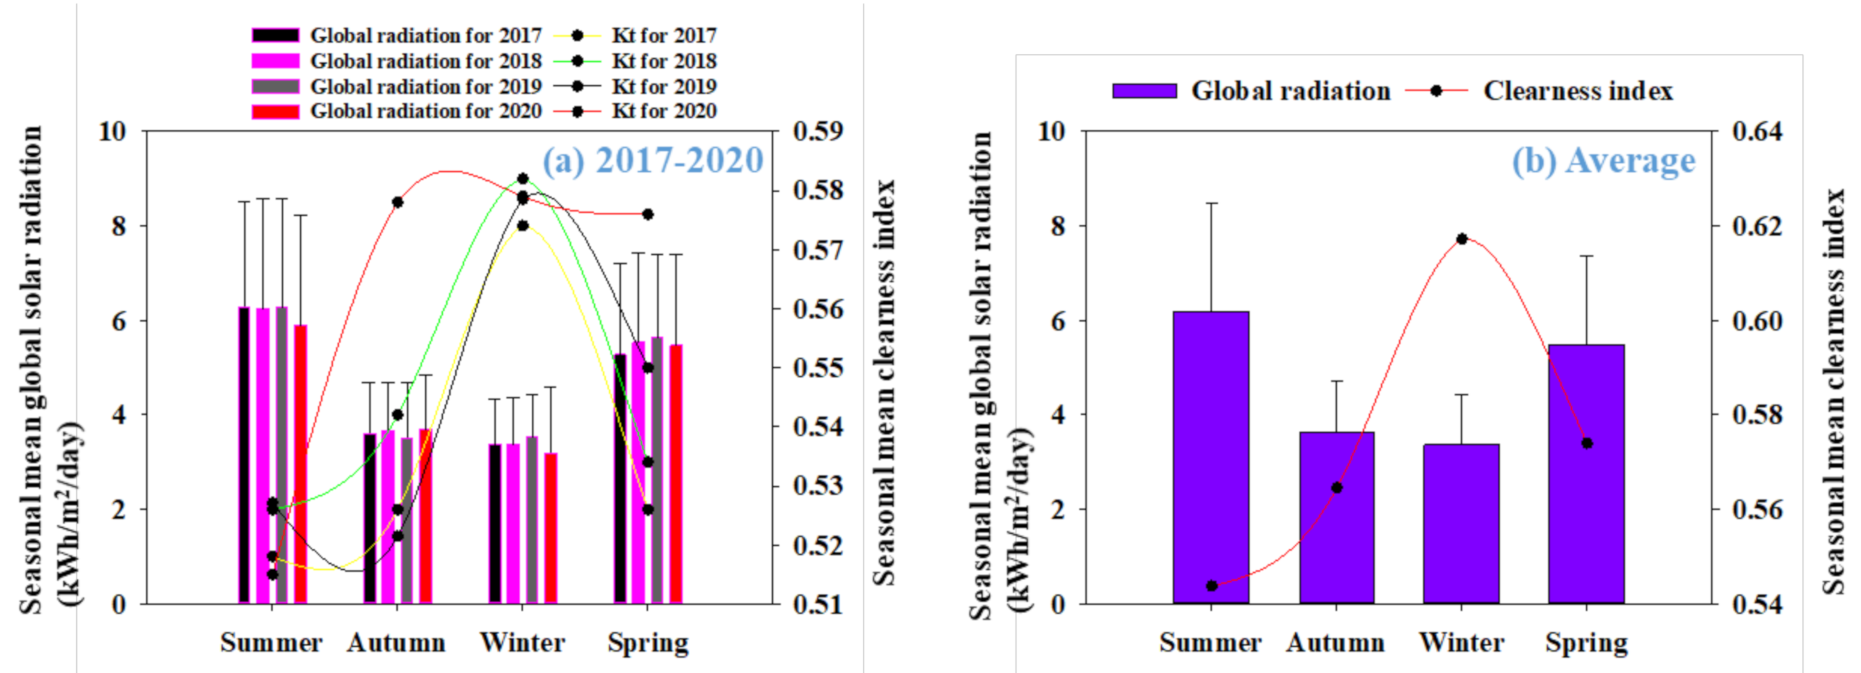
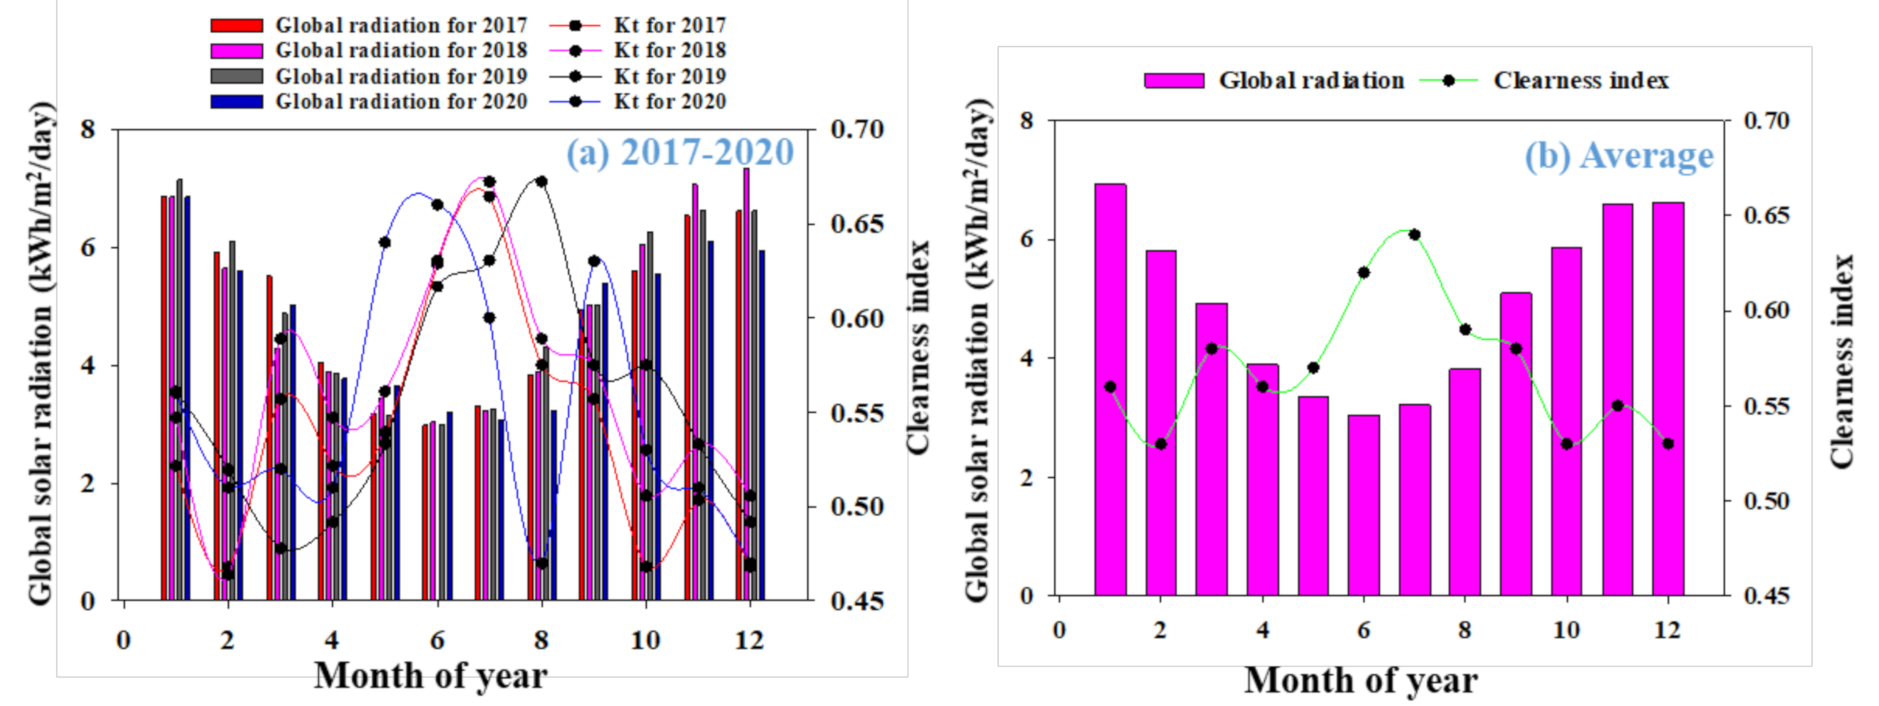
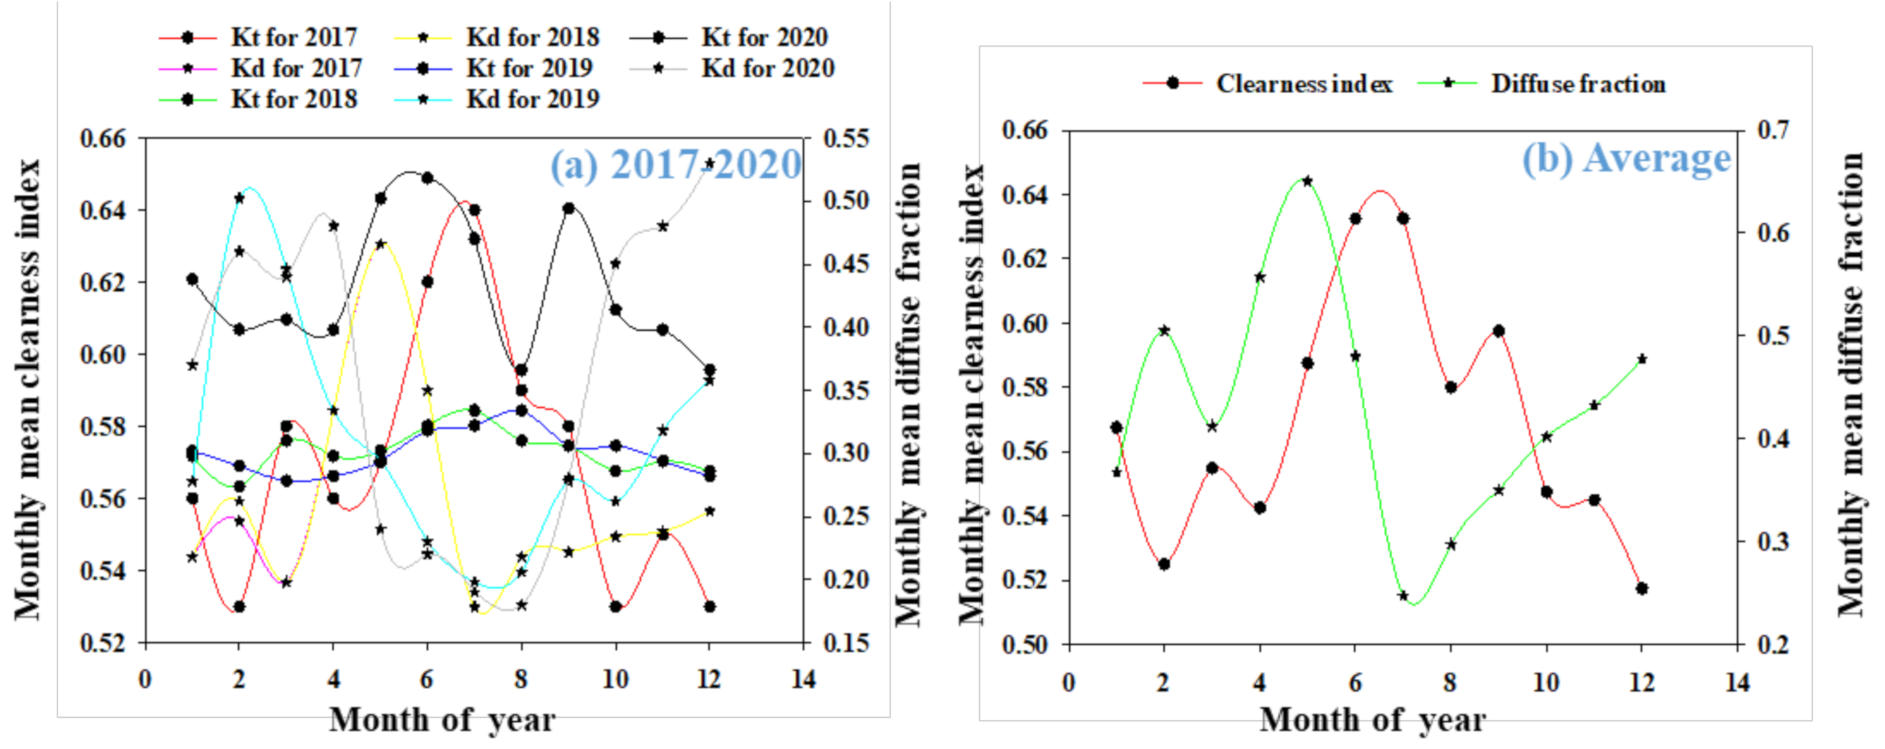
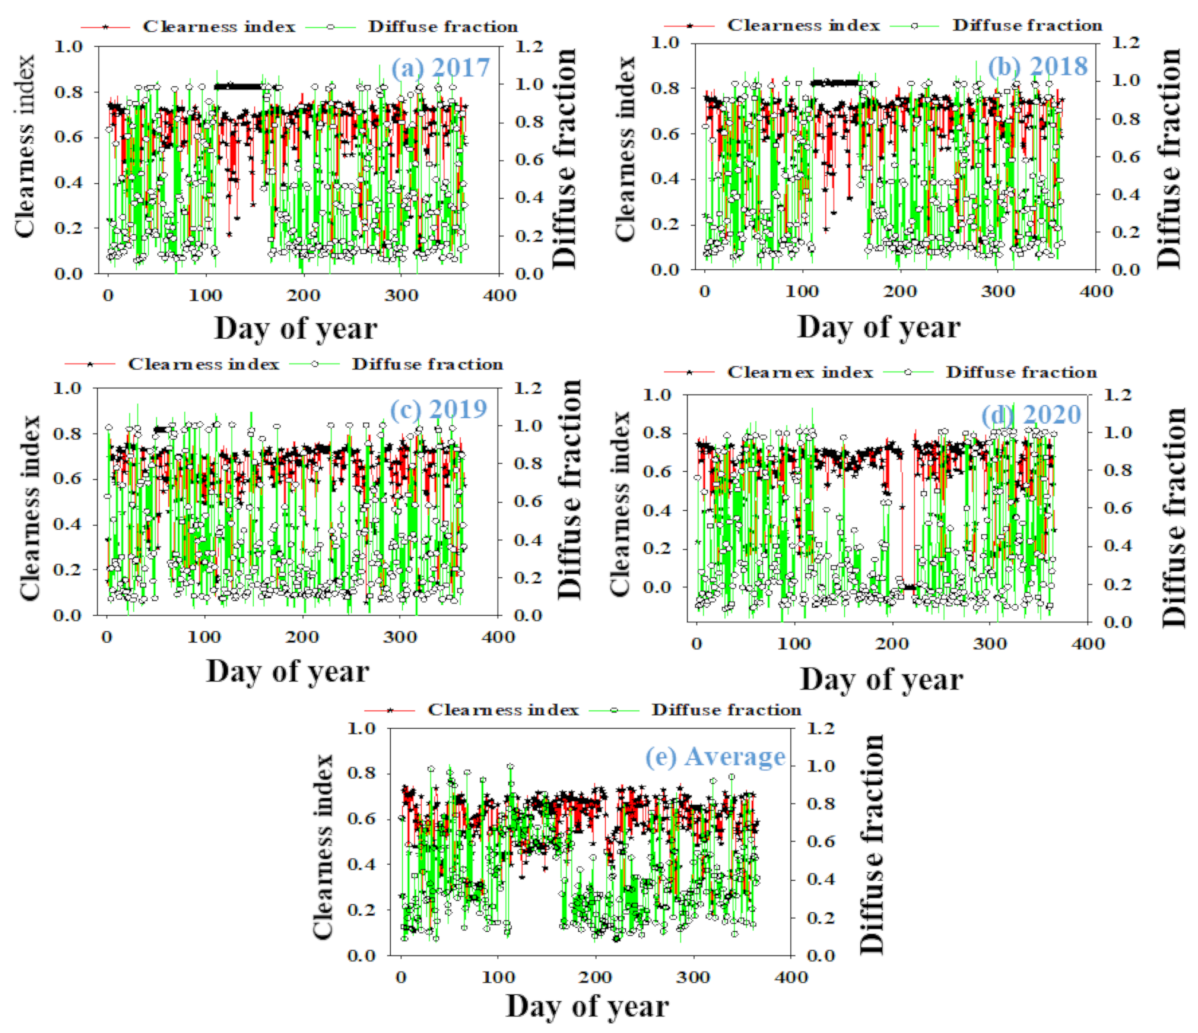
3.1. The Monthly, Seasonal, and Annual Variations of Clearness Index and Diffuse Fraction

The seasonal and annual variation of Kt were explored in all periods of the years 2017–2020. In summer, the location of the earth’s surface in relation to the sun is directly above the head; hence, photons move directly through a thinner layer of the atmosphere to the earth surface. Unlike in winter, when the location of the earth is tilted away from the sun, photons have to move through a much thicker layer of atmosphere to the earth surface. Figure 3 describes the seasonal variation of mean Kt and mean global radiation for the study years 2017–2020.
As expected, the highest value of mean global solar radiation was found in summer throughout the study periods. In Figure 3a, the values of 6.29, 6.25, 6.28, and 5.91 kWh/m2/day were respectively found in 2017, 2018, 2019, and 2020 whereas the respective lowest values of 3.38, 3.38, 3.53, and 3.20 kWh/m2/day were found in winter seasons. The average values for the four years’ mean global solar radiation in summer and winter seasons as shown in Figure 3b are 6.18 and 3.37 kWh/m2/day respectively. On the other hand, peak mean value of 0.62, 0.63, 0.64, and 0.58 Kt were recorded in winter for the years 2017, 2018, 2019, and 2020 respectively, whereas the respective lowest mean value of 0.55, 0.56, 0.54, and 0.52 were found in the summer period. Similarly, the highest and lowest average values for the Kt were 0.62 and 0.54 in summer and winter respectively. In this development, Alice has a maximum solar energy available during summer when the sun is expected to provide the highest amount of energy to the earth’s surface against the lowest Kt values. This is in connection with the fluctuations in the distance of the sun from the earth’s surface.
In another development, the monthly mean Kt, including the mean global solar radiation measured for the same periods from 2017–2020, is shown in Figure 4. It is evident that the mean Kt values are in reverse of the curve of the mean global solar radiation measured. The increasing and decreasing trend of global solar radiation and Kt, which describes a strong correlation, were observed. It was noticed that global solar radiation fluctuates inversely with the Kt and rises very rapidly as the heavily overcast sky becomes clearer. For the winter season, the skies tend to be more precise with peak Kt values found in June, July, and August.
The monthly mean Kt, shown in Figure 4b, ranges from the lowest value of 0.51 in December to 0.63 in July for the whole years. This represents the fraction of the solar radiation that is transmitted through the atmosphere to strike the surface of the earth. In Figure 4a, the highest values of 0.64 and 0.66 are observed in July (2017 and 2018) and 0.66 in both August and June for 2019 and 2020 respectively. The average summer radiation is mitigated by cloud and monthly mean Kt values are attenuated to 0.54, 0.51, 0.56, 0.52, and 0.55 in November, December, January, February, and March, respectively. Similar seasonality was reported by [12] in Pietermaritzburg, South Africa. The plots of the monthly classification of Kt values for Alice are presented in Figure 5. It is observed that throughout the months (January through December), the monthly average of cloudy days was minimal as compared to partially cloudy and clear days.
However, with the help of the weather classification recommended in Table 1, Alice falls within the three sky conditions with partially cloudy and clear days being dominant. These conditions were observed throughout the study years, including the winter seasons, which makes these studies very essential. However, the partially cloudy and clear days summed up to 80.0% throughout the years, leaving merely 20% as cloudy days. The values equally show that Alice has the reasonable potential of solar radiation in line with the northern cape with the best solar radiation in the country [27].
Figure 6 shows a remarkable characteristic existing between monthly mean Kt and Kd. It is clearly observed that both parameters have a virtually unvarying bell-shape with maximum values arising in May and July respectively. From visual inspections of Figure 6a,b, it is found that months with minimum Kt values have the maximum Kd values and vice versa. This pattern is the same over the four-year study periods.
The years’ monthly mean Kd and Kt in Figure 6b have both their peak values of about 0.65 in May and 0.63 in July, respectively. Similarly, the lowest Kd and Kt values are 0.24 in July and 0.51 in December, respectively. In the same way, the same pattern of movement is noticed in Figure 7 where both daily values follow the yearly shape with the data points of Kd being an inversion of the data points of the Kt as clearly seen in Figure 6. The annual average values of Kt and Kd for the four-year period were found to be 0.57 and 0.43, respectively.
One specific feature in Figure 7 is that the Kd values were as low as 0.06 in 2017, 2018, and 2020 but 0.2 in 2019, all on 29th January and as high as 0.999 in 2017 as well as 2018, and 1.00 for 2019 and 2020, all on 22nd April each year. These are in contrast to the least values obtained for Kt which were 0.25, 0.26, 0.11, and 0.14 in 2017, 2018, 2019, and 2020 on 16th November, and the highest values of 0.74, 0.75, 0.74, and 0.73 on 4th January respectively. In other words, these wide ranges of values received further illustrate the fact that the variation of Kt and Kd are heavily influenced not only by atmospheric conditions like dust and turbidity but also by the movement of the sun in the sky. In the same way, variations of Kt values ranging from 0.20 to 0.75 were found in many regions in South Africa, but more peak values are found in Pretoria [24]. Minimum values of Kd range from roughly 0.07 in Port Elizabeth to 0.22 in Durban [24]. The Kt values that are more than 0.80 suggest an uncertainty condition [28]. The results recorded in this study show that Alice obtains adequate global solar radiation. The radiation is useful in the solar-powered technologies including solar modules and solar heating, as well as cooling technologies, not only for residential purposes but also for commercial and industrial hubs.
The annual diffuse irradiation data are insufficient for several solar energy usages, for instance concentrating collectors, solar furnaces [29]. Nevertheless, monthly diffuse irradiation data are required for these applications. The Kt, being the percentage reduction of the incident global radiation by the sky, brings about the information on the rate at which the atmosphere is transparent. It exhibits amount of existing solar radiation as well as the deviations in the condition of the atmosphere of a particular area. One distinct feature of Kt is its very low values in the hours near to morning and evening and high at noon [24]. The prevailing monthly mean Kt variation observed in Figure 8 ranges from 0.3–0.6, representing partially cloudy weather. The Kd, in contrast, have very high values within these periods, that is, near morning and evening (ranging between 0.77 and 0.99). The clear implication here is that the solar radiation attained at the surface consists mainly of the diffuse component.
South Africa, being in the southern hemisphere, attains daily Kt peak over the winter months of June to August, as shown in Figure 8. These winter months are characterized by skies with lower Kd values. The high humidity level as well as the pattern of summer rainfall in the country, however, brings out more discrepancies of daily Kt between October and March [23]. Other meteorological parameters such as ambient temperature, relative humidity, and wind speed are equally in accordance with the finding [30]. It can be attributed to the fact that the rains in this summer season are used to clear off dust constituents and as such make the sky very clear for subsequent days. Furthermore, Figure 8 shows drops in values of Kt for December and January, irrespective of whether these periods have high amounts of global solar radiation acquired. This might be because of conventional rain that is mostly observed. The fact that the earth is closer to the sun in late December (the perihelion) than any other time is a significant factor for high solar radiation in summer. This observation is also attributed to the prevalence of low relative humidity, low cloud cover, low reflection, scattering, and absorption by clouds together with low absorption of diffuse solar radiation during the November–March months.

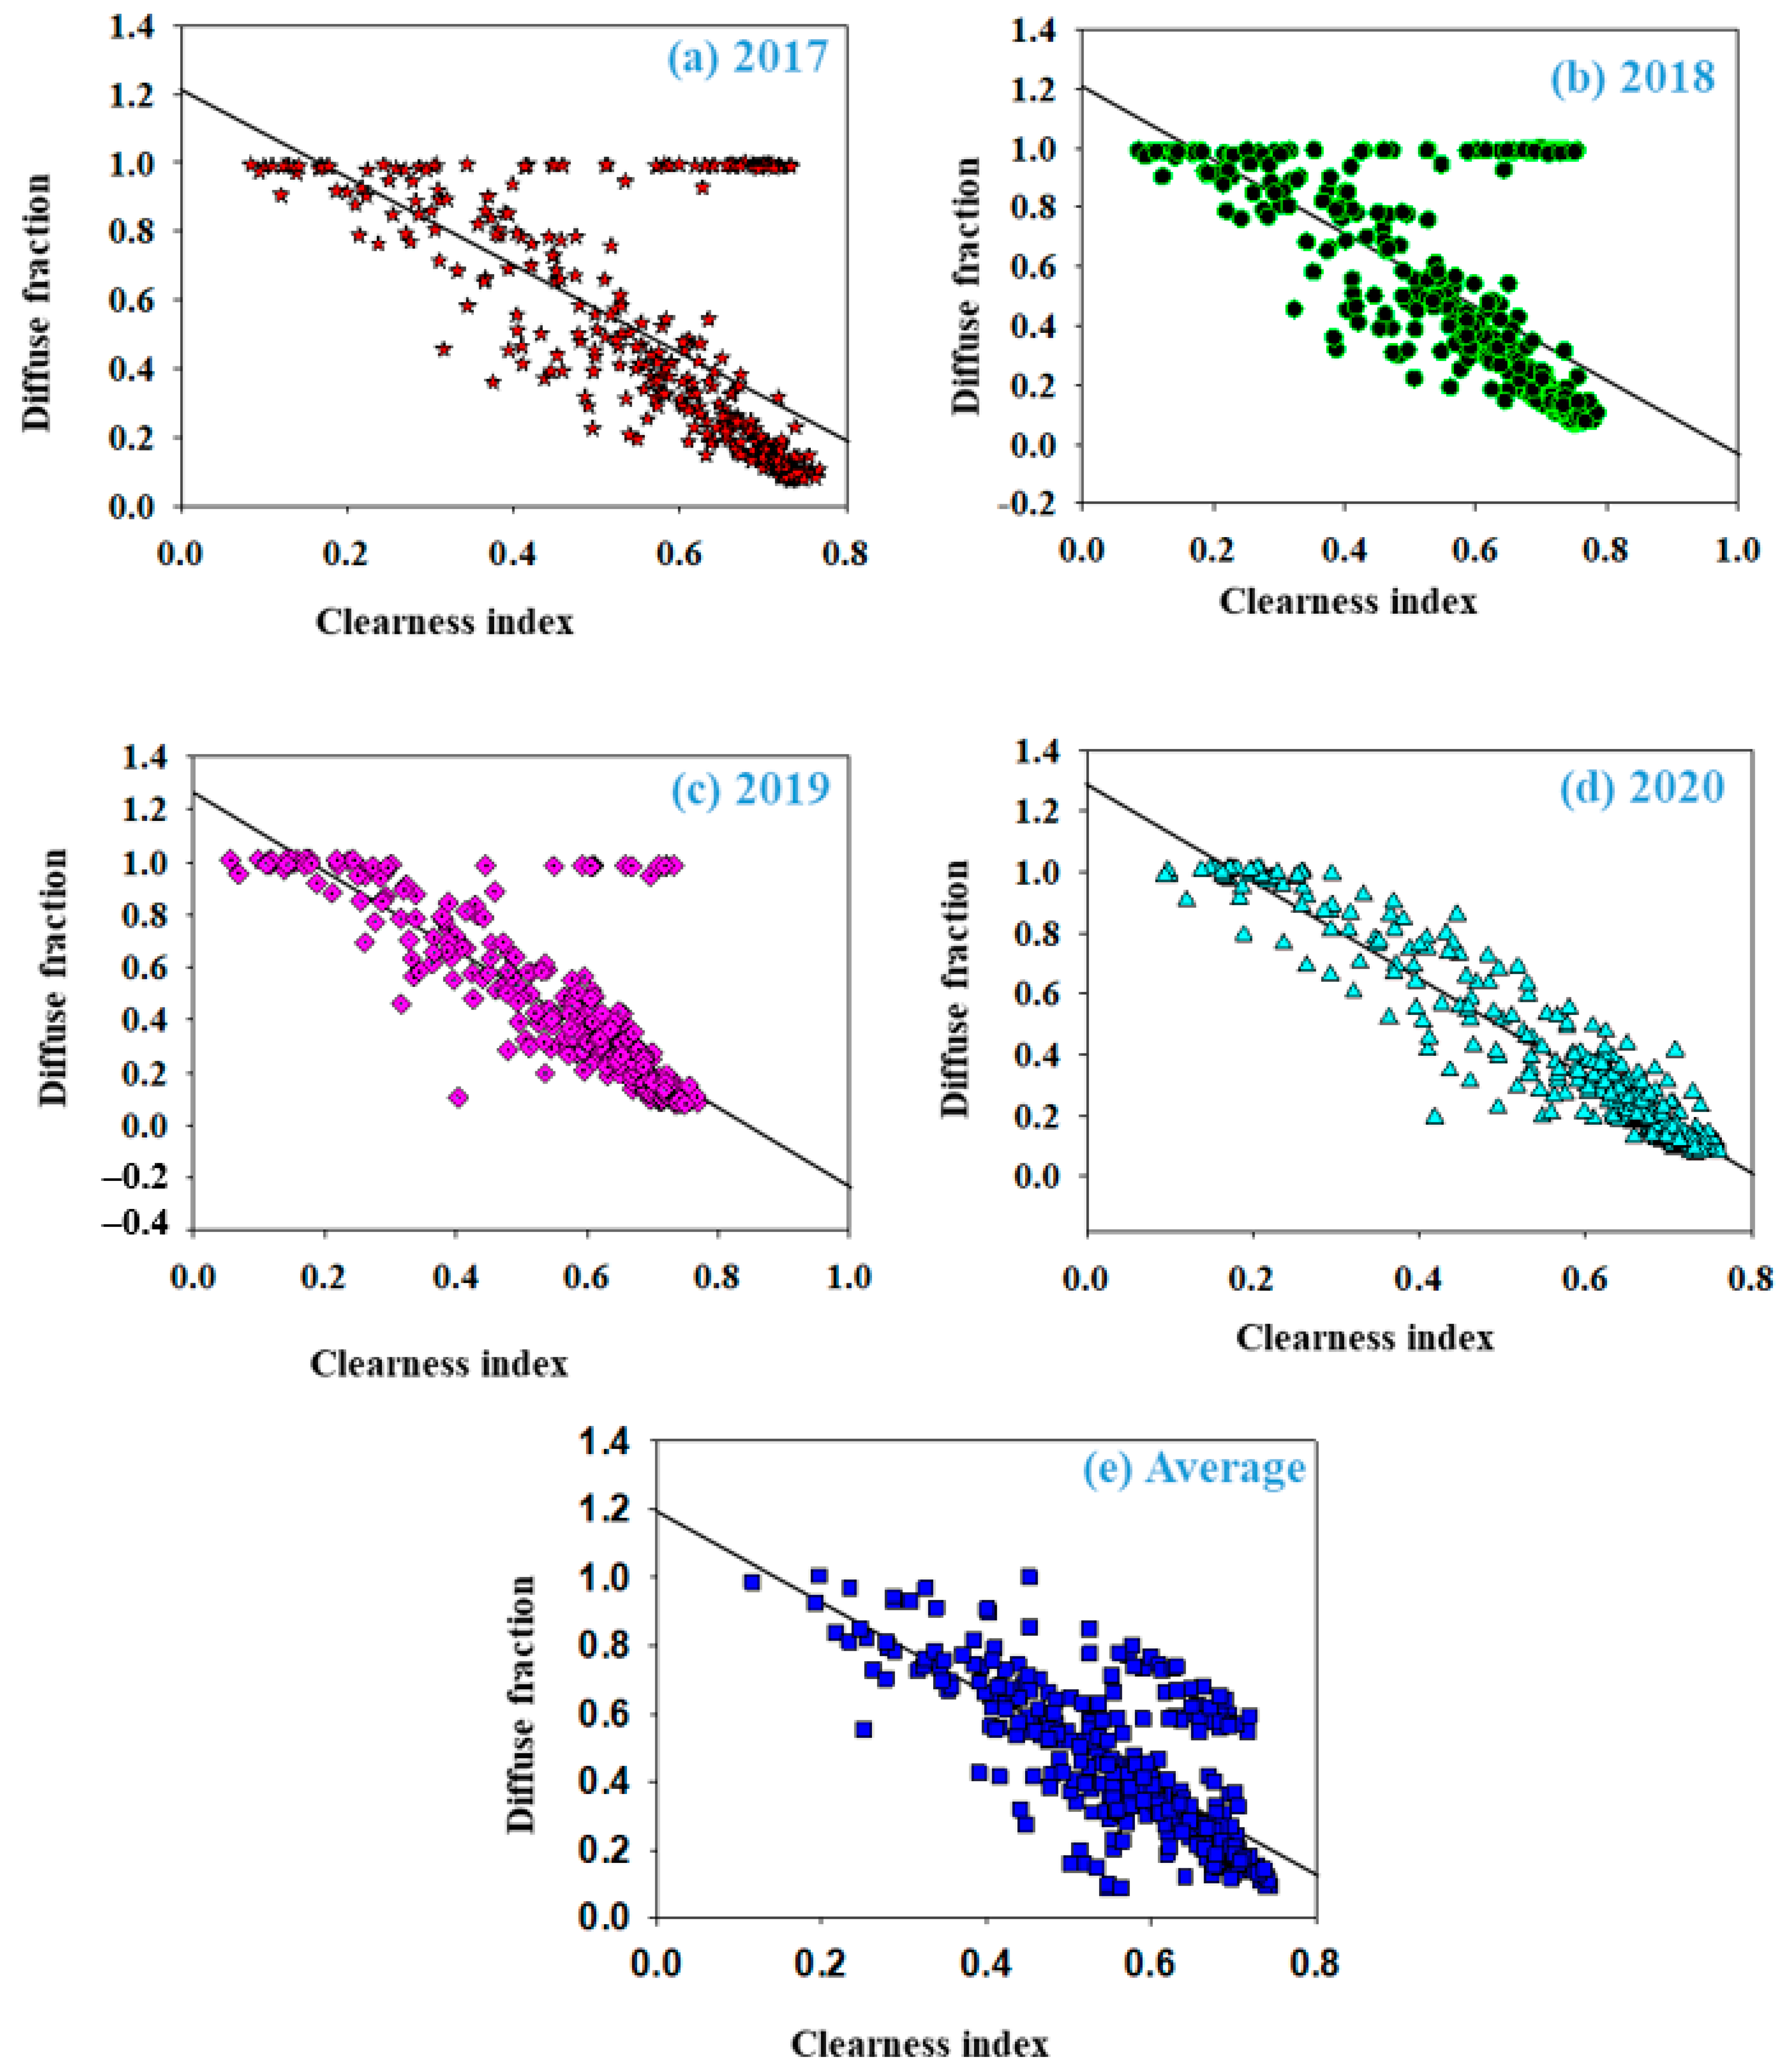
3.2. Regression Correlation between Kd and Kt

Figure 9 displays a scatter plot of Kd against Kt for the area studied. Their strong correlations were found to fluctuate steadily over the years with a unique pattern of V-shapes as shown in Figure 9a–c. The small portion of Kd remains virtually constant throughout while at about 0.4 Kt, in each figure, the majority of Kd starts scattering and decreasing almost linearly with increasing Kt values as seen in Figure 9a–c. At about 0.6 Kt, the convergence of data begins, hence, indicating partially cloudy to clear sky conditions. The direct component governs the overall solar radiation received at this point. However, a complete inverse relation is noticed in Figure 9d with negatively linear correlations between the two variables throughout the plots. A similar result was found in different regions in South Africa [24].
The determination coefficient (R2) of each plot was also found. These R2 values are 0.706, 0.718, 0.828, 0.920, and 0.723 in Figure 9a–e, respectively. It is clear that Figure 9d has the highest R2 value. It can be noticed that most of the points fall along the diagonal line, hence indicating an excellent correlation. This is in connection with the value of solar radiation found in Figure 7d.

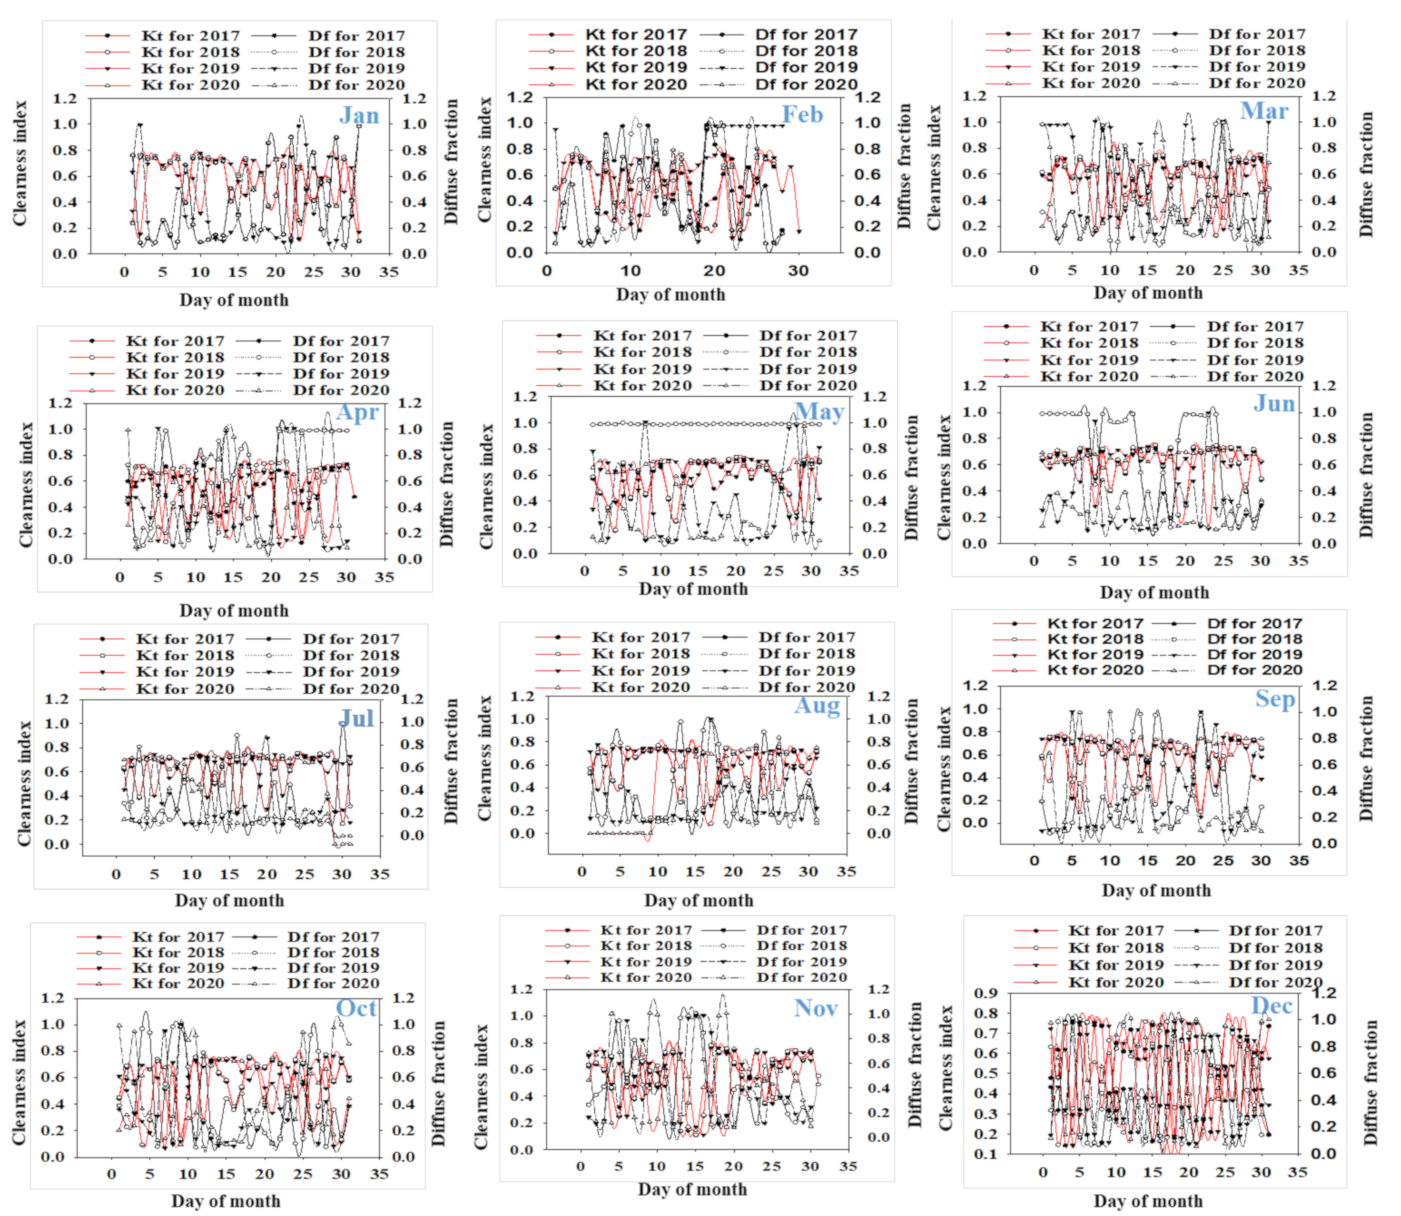
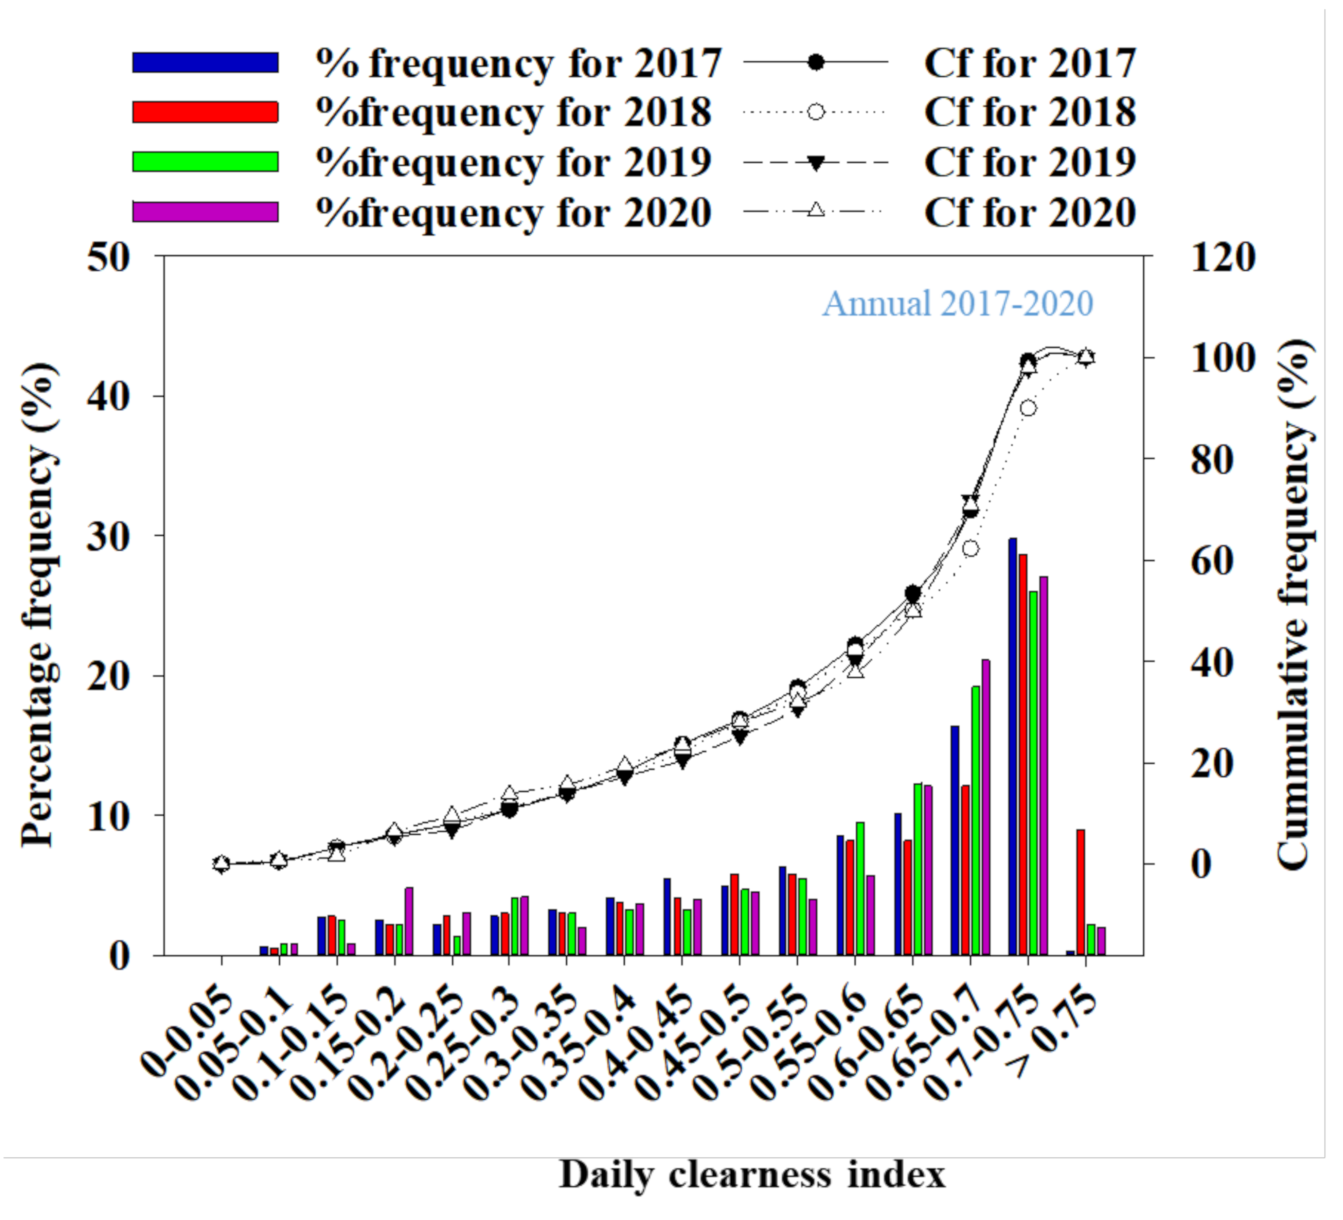
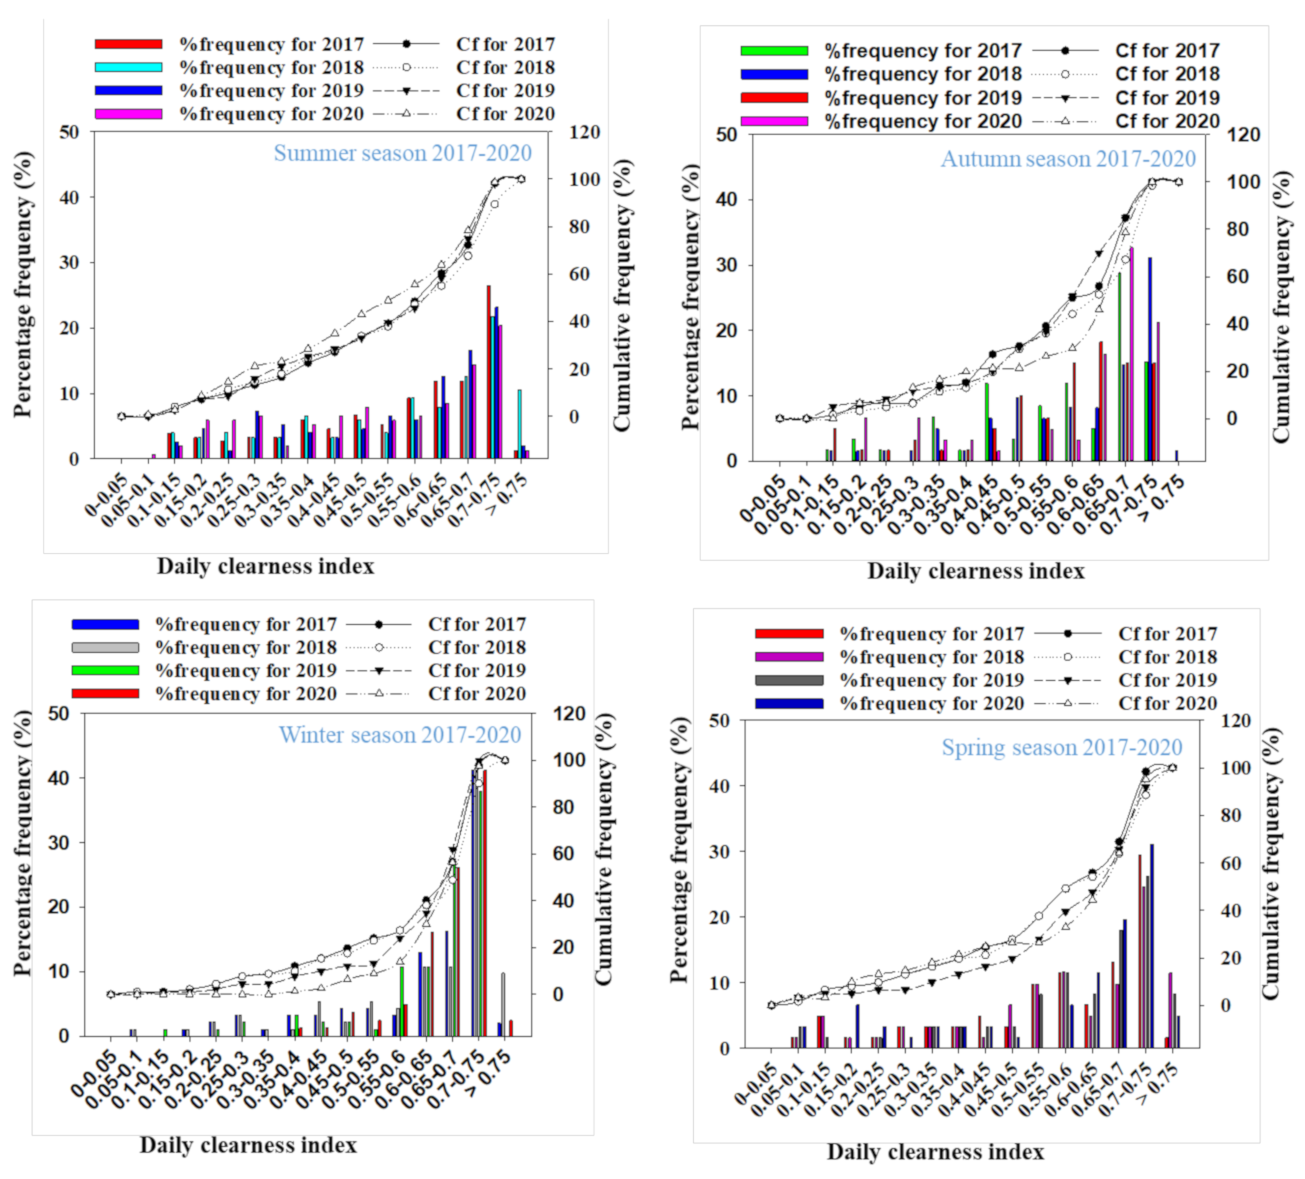
3.3. Frequency and Commutative Frequency Distribution of Daily Kt Values

Regarding the previous work of Liu and Jordan, a universal class of distribution function relying solely on monthly mean of the daily Kt could be applied to investigate sufficiently the statistical characteristics of solar radiation. The information regarding the frequency of occurrence of Kt concerning different sky conditions is desirable in most of the solar energy uses. This kind of data might be obtainable in the form of percentage frequency distribution of daily Kt as presented by the study [16]. The daily percentage frequency and cumulative frequency distributions, with 0.05 range of Kt, were plotted on a yearly and seasonal basis, as shown in Figure 10 and Figure 11, respectively.
The daily distribution of annual Kt, shown in Figure 10, presents an obvious maximum value within the interval of 0.7–0.75, which represents part of clear sky days throughout the years 2017–2020. The annual average percentage frequency in this range is 27.65% and approximately 100 days’ average within the years. Similarly, the overall clear sky days with range 0.7–0.9 is 31.28% meaning that out of 1461 days within the studied years, the local sky over Alice is clear about 31.28% which is 455 days.
The partially cloudy days also range from 0.3 to 0.7 intervals which has a total number of 826 out of 1461 days representing 57% days in the years, showing that there are more data points within this range. The cloudy days, on the other hand, occupy 169 days, with just 11.72% of the time during the years. The seasonal variations go alongside changing atmospheric conditions; hence, Figure 11 shows the seasonal plot of frequency and cumulative frequency of Kt from 2017–2020. It is noticed that each of the yearly groups has unique pattern of frequency distribution with the bars arranged from 0.05 to 0.9.
The percentage frequency of Kt in all seasons is maximum from 0.7–0.75, representing the clear sky days. Autumn and winter also present the highest contributions in all the years. In 2017 and 2018 the percentage frequency for winter season were 43.4% and 51.1% of clear days, respectively, while the corresponding partially clear days in autumn were 78% and 60.8%. In the same vein, the percentage values for the winter period in 2019 and 2020 were 38% and 43.7% of clear days, respectively, while their corresponding partially clear days were 73.3% and 65.5% in autumn. This means that within the measured periods, the Kt for winter period contributes the highest number of sky days followed by autumn and least is summer and spring periods. The least Kt in summer months was found because it is disposed with more constituents in the atmosphere, thereby dispersing direct normal irradiance. The dispersed irradiance however finds its course to the surface of the earth, which then brings about diffusion. One major distinctive feature of seasonal variation of Kt analysis is that on average it ranges from 0.3 to 0.75, implying that the atmosphere at Alice is mostly dominated by partially cloudy and clear days throughout the year. This means that the installations of solar energy in Alice will promote not only agricultural practices where a solar heat collector is used to dry crops and warm homes, but also in industrial uses where solar power is used for telecommunication networks as well as lightning purposes.

4. Conclusions

Monthly, seasonal, and yearly diffuse fraction and clearness index calculated from the respective diffuse and global irradiance during the years 2017–2020 have been utilized to study the sky conditions in Alice, South Africa. It is evident from the study that the weather conditions can affect the Kt values. The study made it clear that 100% of days were categorized out of 1461 days of the four-year studied period. The conclusion could be drawn from the classification that three sky conditions characterize the region of Alice, viz. cloudy, partially cloudy, and clear-sky conditions with partially cloudy days being dominant, with a total number of 826 out of 1461 days, representing 57% of the years. The clear sky occupies 31.28% which is 455 days while the cloudy days occupy a mere 169 days with only 11.72% of the time throughout the years. Indeed, partially cloudy to clear days are observed all throughout the years, as well as the winter season, making global horizontal irradiance easy to obtain. Moreover, it was noticed that in just three months (June, July, and August), the winter period, the individual monthly average percentage of clear days surpasses 50%. These months are characterized by decreased levels of atmospheric water vapor, producing rises in monthly sky clearness index. On the other hand, a meager 11.3% represents the percentage of cloudy days throughout the years. The average monthly Kt value, however, surpasses 0.57 during each year. The results obtained in this paper maintain the present determinations targeted at reducing Alice’s local electricity intake from the state grid and substituting it with dependable alternatives. The results demonstrate that Alice could be a promising region for the utilization of solar energy systems. Hence, for future work, an organized technique for the assessment of meteorological parameters with various categories of PV systems, possibly through optimization method, will be beneficial.

Author Contributions

All authors contributed significantly to this study. Conceptualization, E.L.M. and O.O.A.; setup of electrical data acquisition system, E.L.M. and O.O.A.; setup of meteorological data acquisition system, E.L.M. and O.K.O.; periodic data collection and management, O.O.A. and O.K.O.; data analysis and graphs production, O.O.A. and O.K.O.; compilation of manuscript, O.O.A. and O.K.O.; technical review and editing of manuscript, E.L.M. and O.K.O. All authors have read and agreed to the published version of the manuscript.

Funding

This work was based on the research supported in part by the National Research Foundation of South Africa (Grant number 116763). We also acknowledge the Department of Science and Technology and Govan Mbeki Research and Development Centre for supporting this research.

Institutional Review Board Statement

Not applicable.

Informed Consent Statement

Not applicable.

Data Availability Statement

New data were created or analyzed in this study. Data will be shared upon request and consideration of the authors.

Acknowledgments

Special thanks for the members of staff and the students of Fort Hare Institute of technology for their technical support of this research.

Conflicts of Interest

The authors declare no conflict of interest.

References

  1. Chen, Z.; Ivan Su, S.I. Dual competing photovoltaic supply chains: A social welfare maximization perspective. Int. J. Environ. Res. Public Health 2017, 14, 1416. [Google Scholar] [CrossRef] [PubMed] [Green Version]
  2. Zhang, X.; Zhao, X.J.; Li, Y. Analysis of sky conditions using 40 year records of solar radiation data in China. Theor. Appl. Climatol. 2007, 89, 83–94. [Google Scholar]
  3. Ghazi, S.; Ip, K. The effect of weather conditions on the efficiency of PV panels in the southeast of UK Renew. Energy 2014, 69, 50–59. [Google Scholar]
  4. Fedorov, V.M. Earth insolation variation and its incorporation into physical and mathematical climate models. Uspekhi Fiz. Nauk 2019, 189, 33–46. [Google Scholar] [CrossRef]
  5. Meyer, E.L.; Overen, O.K. Blue skies and red sunsets: Reliability of performance parameters of various p-n junction photovoltaic module technologies. Cogent Eng. 2019, 6, 1–20. [Google Scholar] [CrossRef]
  6. Stokes, G.M.; Schwartz, S.E. The Atmospheric Radiation Measurement (ARM) Program: Programmatic background and design of the cloud and radiation test bed. Bull. Am. Meteorol. Soc. 1994, 75, 1201–1221. [Google Scholar] [CrossRef]
  7. Okogbue, E.C.; Adedokun, J.A. The estimation of solar radiation at Ondo, Nigeria. J. Phys. 2002, 14, 97–99. [Google Scholar]
  8. Ayodele, T.R.; Ogunjuyigbe, A.S.O. Prediction of monthly average global solar radiation based on statistical distribution of clearness index. Energy 2015, 90, 1733–1742. [Google Scholar] [CrossRef]
  9. Liu, B.Y.H.; Jordan, R.C. The interrelationship and characteristic distribution of direct, diffuse and total solar radiation. Sol. Energy 1960, 4, 1–19. [Google Scholar] [CrossRef]
  10. Udo, S.O. Sky conditions at Ilorin as characterized by clearness index and relative sunshine. Sol. Energy 2000, 69, 45–53. [Google Scholar] [CrossRef]
  11. Berrizbeitia, S.E.; Gago, E.J.; Muneer, T. Empirical models for the estimation of solar sky-diffuse radiation. A review and experimental analysis. Energies 2020, 13, 701. [Google Scholar] [CrossRef] [Green Version]
  12. Govindasamy, T.R.; Chetty, N. Quantifying the global solar radiation received in Pietermaritzburg, KwaZulu-Natal to motivate the consumption of solar technologies. Open Phys. 2018, 16, 786–794. [Google Scholar] [CrossRef]
  13. Maleki, S.A.M.; Hizam, H.; Gomes, C. Estimation of hourly, daily and monthly global solar radiation on inclined surfaces: Models re-visited. Energies 2017, 10, 1. [Google Scholar]
  14. Boland, J.; Huang, J.; Ridley, B. Decomposing global solar radiation into its direct and diffuse components. Renew. Sustain. Energy Rev. 2013, 28, 749–756. [Google Scholar] [CrossRef]
  15. Liu, D.L.; Scott, B.J. Estimation of solar radiation in Australia from rainfall and temperature observations. Agric. For. Meteorol. 2001, 106, 41–59. [Google Scholar] [CrossRef]
  16. Okogbue, E.C.; Adedokun, J.A.; Holmgren, B. Hourly and daily clearness index and diffuse fraction at a tropical station, Ile-Ife, Nigeria. Int. J. Climatol. A J. R. Meteorol. Soc. 2009, 29, 1035–1047. [Google Scholar] [CrossRef]
  17. Buma, C.; Meyer, E.; Taziwa, R.T. Energy Management in the Balance of System Components in a Stand-Alone Building Integrated Photovoltaic System in Alice, South Africa. January 2018. Available online: https://www.researchgate.net/profile/Carine_Buma2/publication/322599798_ENERGY_MANAGEMENT_IN_THE_BALANCE_OF_SYSTEM_COMPONENTS_IN_A_STAND-ALONE_BUILDING_INTEGRATED_PHOTOVOLTAIC_SYSTEM_IN_ALICE_SOUTH_AFRICA/links/5a61eb11a6fdccb61c504bfa/ENERGY-MANAGEMENT-IN-THE-BALANCE-OF-SYSTEM-COMPONENTS-IN-A-STAND-ALONE-BUILDING-INTEGRATED-PHOTOVOLTAIC-SYSTEM-IN-ALICE-SOUTH-AFRICA.pdf (accessed on 8 February 2021).
  18. Meyer, E.L.; Buma, C.L.; Taziwa, R.T. Performance parameters of an off-grid building integrated photovoltaic system in South Africa. Proceedings of 33rd European Photovoltaic Solar Energy Conference and Exhibition, Amsterdam, The Netherland, 23–29 September 2017; pp. 2450–2455. [Google Scholar]
  19. Overen, O.K.; Meyer, E.L.; Makaka, G.; Ziuku, S.; Mamphweli, S. Zonal air exchange rate of a passive solar house and resultant sensible air heat transfer. Indoor Built. Environ. 2018, 28, 1–13. [Google Scholar] [CrossRef]
  20. Ziuku, S.; Meyer, E.L. Implementing building integrated photovoltaics in the residential sector in South Africa. J. Energy South. Afr. 2008, 24, 1–10. [Google Scholar]
  21. Hoare, D.B.; Bredenkamp, G.J. Grassland communities of the Amatola/Winterberg mountain region of the Eastern Cape, South Africa. S. Afr. J. Bot. 1999, 65, 75–82. [Google Scholar] [CrossRef] [Green Version]
  22. SABS. SANS 204:2011—South African National Standard: Energy Efficiency in Buildings; SABS Standards Division: Pretoria, South Africa, 2011; Volume 1. [Google Scholar]
  23. Tadross, M.; Johnston, P. Climate Systems Regional Report: Southern Africa; ICLEI—Local Governments for Sustainability—Africa Climate Systems Regional Report: Southern Africa; ICLEI—Local Governments for Sustainability—Africa: Pretoria, South Africa, 2012.
  24. Alonso-Montesinos, J.; Batlles, F.J. Solar radiation forecasting in the short and medium-term under all sky conditions. Energy 2015, 83, 387–393. [Google Scholar] [CrossRef]
  25. Lai, C.S.; Li, X.; Lai, L.L.; McCulloch, M.D. Daily clearness index profiles and weather conditions studies for photovoltaic systems. Energy Procedia 2017, 142, 77–82. [Google Scholar] [CrossRef]
  26. Tongwane, M.I.; Savage, M.J.; Tsubo, M. Relationship between global and diffuse irradiance and their variability in South Africa. Theor. Appl. Climatol. 2015, 137, 1027–1040. [Google Scholar] [CrossRef]
  27. Fluri, T.P. The potential of concentrating solar power in South Africa. Energy Policy 2009, 37, 5075–5080. [Google Scholar] [CrossRef]
  28. Loutzenhiser, P.G.; Manz, H.; Felsmann, C.; Strachan, P.A.; Frank, T.; Maxwell, G.M. Empirical validation of models to compute solar irradiance on inclined surfaces for building energy simulation. Sol. Energy 2007, 81, 254–267. [Google Scholar] [CrossRef] [Green Version]
  29. Nwokolo, S.; Otse, C. Impact of Sunshine Duration and Clearness Index on Diffuse Solar Radiation Estimation in Mountainous Climate. Trends Renew. Energy 2019, 5, 307–332. [Google Scholar] [CrossRef]
  30. Meyer, E.L.; Apeh, O.O.; Overen, O.K. Electrical and meteorological data acquisition system of a commercial and domestic microgrid for monitoring pv parameters. Appl. Sci. 2020, 10, 9092. [Google Scholar] [CrossRef]
Figure 1. Location of Alice as indicated in the climatic map [22].
Sustainability 13 02135 g001
Figure 2. The sun tracker comprising pyrheliometer, pyranometers, and pyrgeometer, with the black balls shading the horizontal instruments.
Sustainability 13 02135 g002
Figure 3. The seasonal variation of mean global solar radiation and mean clearness index at Alice in (a) from 2017–2020. (b) Average value: 2017–2020.
Sustainability 13 02135 g003
Figure 4. Relationship between mean clearness index and mean global solar radiation at Alice in (a) from 2017–2020 (b) Average value: 2017–2020.
Sustainability 13 02135 g004
Figure 5. Monthly frequency occurrence of clearness index (Kt) corresponding to the classification in Alice (a) from 2017–2020 (b) Average value: 2017–2020.
Sustainability 13 02135 g005
Figure 6. Correlation between mean clearness index and mean diffuse fraction in (a) from 2017–2020 (b) Average value: 2017–2020.
Sustainability 13 02135 g006
Figure 7. Yearly correlation of daily diffuse fraction and clearness index for the years (a) 2017, (b) 2018, (c) 2019, and (d) 2020 (e). Average value: 2017–2020.
Sustainability 13 02135 g007
Figure 8. Daily variation of monthly clearness index and diffuse fraction for the years 2017–2020.
Sustainability 13 02135 g008
Figure 9. Variation of diffuse fraction against clearness index for the years (a) 2017, (b) 2018, (c) 2019, and (d) 2020. (e) Average value: 2017–2020.
Sustainability 13 02135 g009
Figure 10. The annual pattern of frequency and cumulative frequency of Kt in Alice for the years 2017–2020.
Sustainability 13 02135 g010
Figure 11. The seasonal pattern of frequency and cumulative frequency of clearness index in Alice for the years 2017–2020.
Sustainability 13 02135 g011
Table 1. Description of clearness index [12].
Description of SkyRange
Clear0.7 ≤ Kt ≤ 0.9
Partially cloudy0.3 ≤ Kt ≤ 0.7
Cloudy0.0 ≤ Kt ≤ 0.3
Publisher’s Note: MDPI stays neutral with regard to jurisdictional claims in published maps and institutional affiliations.

