Construction of the Primorsky No. 1 and No. 2 International Transport Corridors: Risk Evaluation and Mitigation Policies


 and
and 
Abstract
1. Introduction
2. Materials and Methods
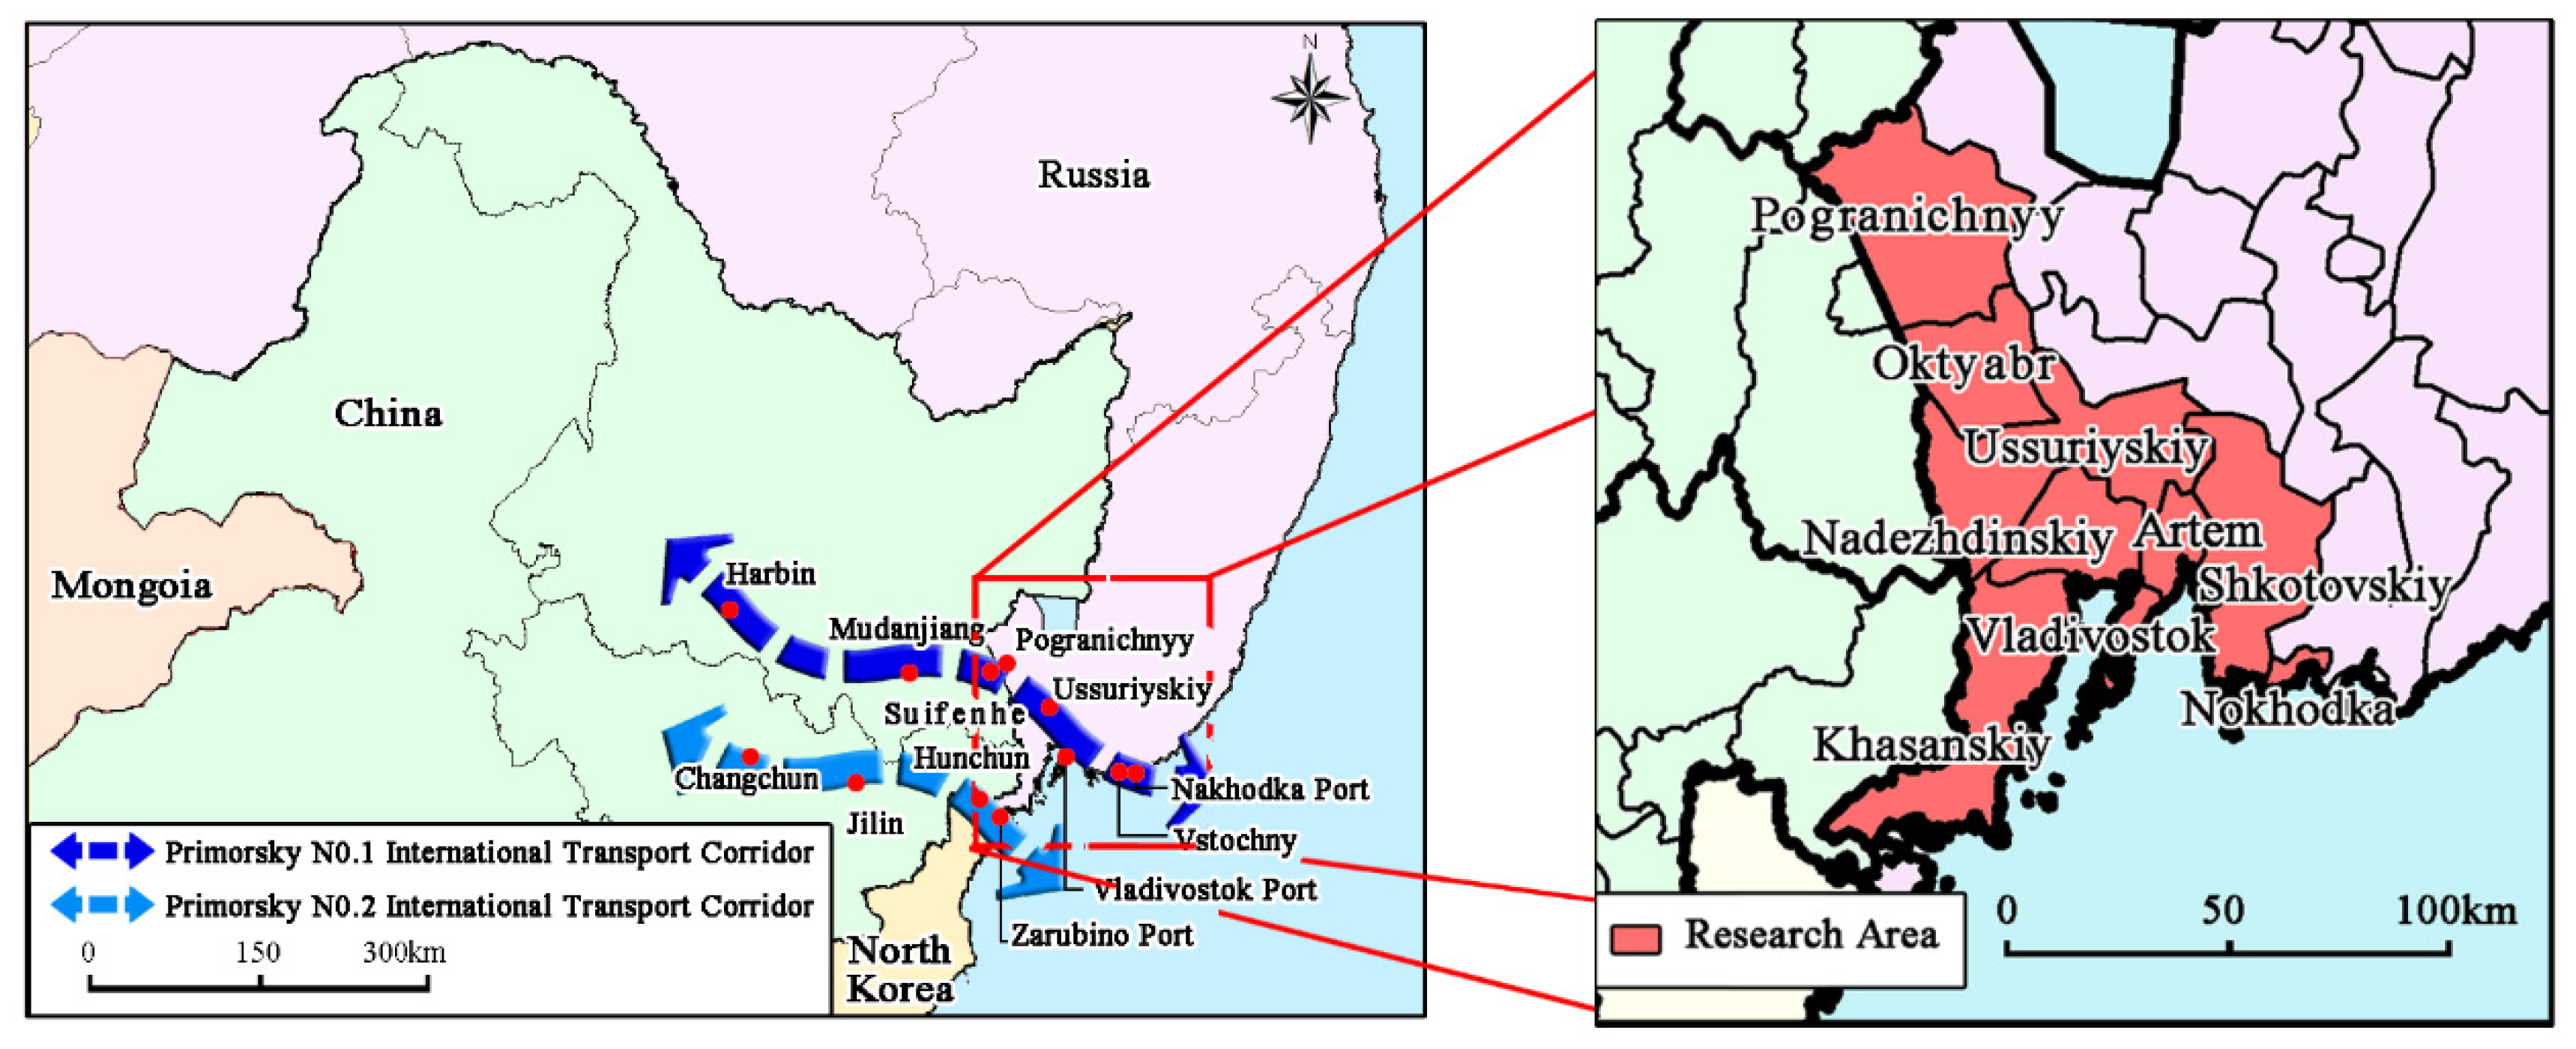
2.1. Research Area
2.2. Risk-Related Factors in Constructing Transport Corridors
- (1)
- Economic risk. The cost for the construction of the Primorsky No. 1 and No. 2 international transport corridors is massive. The average cost of the construction of a road and railway in Russia is 320,000 USD/km and 360,000 USD/km, respectively [35,36]. According to the “Development concept of Primorsky No.1 and Primorsky No.2 international transport corridor”, the total length of the roads that need to be constructed or upgraded is 537.65 km [37], while that for the railways is estimated to be 380 km, which will cost 309 million USD or more due to the extremely cold weather in the Far East. Therefore, the level of economic development of the regions along the transport corridor will directly affect the feasibility of the construction of the corridors. However, most of the regions in the research area (hereafter called research regions) are economically backward and sparsely populated. In 2017, the GDP per capita and the total population of Vladivostok, which is the most developed region in the research area, was 888 USD and 633,000, respectively. Thus, these regions may not have sufficient construction funds, which enhances the economic risk.
- (2)
- Transport infrastructure-related risk. The transport infrastructure of the research area is poor. Road densities in the research regions (expect for Vladivostok) are all lower than 2 km/km2 [38], and the road that needs to be constructed and upgraded is long (as mentioned in (1) Economic risk). Meanwhile, most railways in the research area are traditional railways with a slow speed and small capacity, which also demands large-scale construction, upgrading, and modernization, thus greatly increasing the construction costs and difficulty for the transport corridors.
- (3)
- Policy-related risk. Policy incentives are important for the construction of transport infrastructure [26,27,28]. Preferential policies often come along with supporting measures such as tax deductions and exemptions, which can bring in capital, projects, and other factors, and they can significantly promote regional economic development and the construction of transport infrastructure. Therefore, whether the central and local governments have issued specific regional developmental policies and special transport construction policies in Primorsky is crucial for the construction of the Primorsky No. 1 and No. 2 international transport corridors. The greater the policy support provided, the smaller the policy-related risk will be, and vice versa. Although Russia has strengthened its policy support for Primorsky, due to differences in the locational characteristics and levels of economic development in the research regions, the degree of policy support varies greatly. Regions with low policy support may not have enough policy incentives and capacity to construct the transport corridors. This increases policy-related risks.
- (4)
- Eco-environmental risk. The research area has a good ecological environment and rich biodiversity. The forest coverage of the eight research regions is greater than 60% [39]. The Leopard National Park, Far East Marine Reserve, Ussuriyskiy Natural Reserve, and a large number of rare animals and plants, such as the Far East leopard, Siberian tiger, Himalayan bear, ginseng, and rock cabbage, are distributed in the research area. However, the construction of the Primorsky No. 1 and No. 2 international transport corridors may disturb or damage the ecological environment in the construction zone, thus destroying the related ecosystems and endangering biodiversity [40,41,42]. Therefore, it is important to quantitatively examine the degrees of eco-environmental risk in the research regions and propose targeted mitigation policies to prevent and control that risk.
- (5)
- Disaster-related risk. The disaster-related conditions in the research area directly affect the feasibility and difficulty of transport-related construction. The research area is adjacent to the Sea of Japan (East Sea), where floods, tsunamis, landslides, and other natural and geological disasters occur frequently. Disaster-related factors are direct risk-related factors for the construction of the Primorsky No. 1 and No. 2 international transport corridors and must be avoided. Therefore, it is important to quantitatively examine the degrees of disaster-related risk in the research regions and formulate targeted prevention and control countermeasures.
2.3. Comprehensive Risk Evaluation System
- (1)
- Indices of economic risk. To evaluate the economic risk in the research regions, ten indices, including the income of municipal budgets, the average monthly income from work, investments in fixed capital, the proportion of agriculture, the proportion of industry, and the proportion of tertiary industry, were selected to reflect the economic development of the research regions. A better economic development level implies a stronger investment ability for constructing the transport corridors and thus a smaller economic risk. A total number of 14 indices, including natural resources such as healing mud, gold, brown coal, and Ge, and human resources such as total population, natural increases in population, and percentage of the working, were selected to reflect resource endowment. Richer resource endowment implies higher regional attractive power and thus smaller economic risk. Nine indices, including the percentage of unemployed persons registered in the state employment service, the number of doctors per 10,000 people, and the number of sports facilities per 10,000 people, were selected to reflect living standards. Better living standards also indicate higher regional attractive power and smaller economic risk. Therefore, the better the level of economic development, the richer the resource endowment and the better the living standard, and the lower the economic risk is to the construction of the Primorsky No. 1 and No. 2 international transport corridors.
- (2)
- Indices of transport infrastructure-related risk. Indices to reflect road network, including the length of all roads (for cars) and density of roads, and indices to reflect transported freight, including amount of transported goods, the annual increase of transported goods in 2017, and annual increase of cargo turnover in 2017, were selected to evaluate the transport infrastructure-related risk for the two transport corridors. Poor transport infrastructure results in higher costs for exploring and evaluating the local geology, geomorphology, and the natural environment for construction of the corridors, and it enhances the construction costs and difficulty of the corridors.
- (3)
- Indices of policy-related risk. We collected and analyzed 10 closely related regional development policies and plans, as well as special transport construction policies and plans issued by the Russian government at all levels, along with those co-issued by China and Russia. Then, we analyzed if a research region is included in a policy or plan because inclusion in a policy usually implies policy support and is important for constructing the corridors. The stronger the policy support, the lower the policy-related risk will be.
- (4)
- Indices of eco-environmental risk. Ten ecology indices, including the percentage of agriculture land, percentage of forest, percentage of grassland, the precipitation, and the number of natural reserves and nine environment pollution indices, such as the emissions of pollutants into the atmosphere in cities and districts, discharges of solids, and emissions of gases and liquids, were selected to evaluate the eco-environmental risk. A better eco-environmental condition implies a potentially greater risk of eco-environmental damage.
- (5)
- Indices of disaster-related risk. Six natural disasters that occur frequently in the research area were selected to evaluate the disaster-related risk in the research regions. The higher the grade of a disaster, the higher the disaster-related risk, and the greater the restrictions on the construction of the transport corridors will be.
2.4. Data Sources
- (1)
- Data on economic, transport infrastructure-related, eco-environmental, and disaster-related risk
- (2)
- Data on policy
2.5. Methods
3. Results
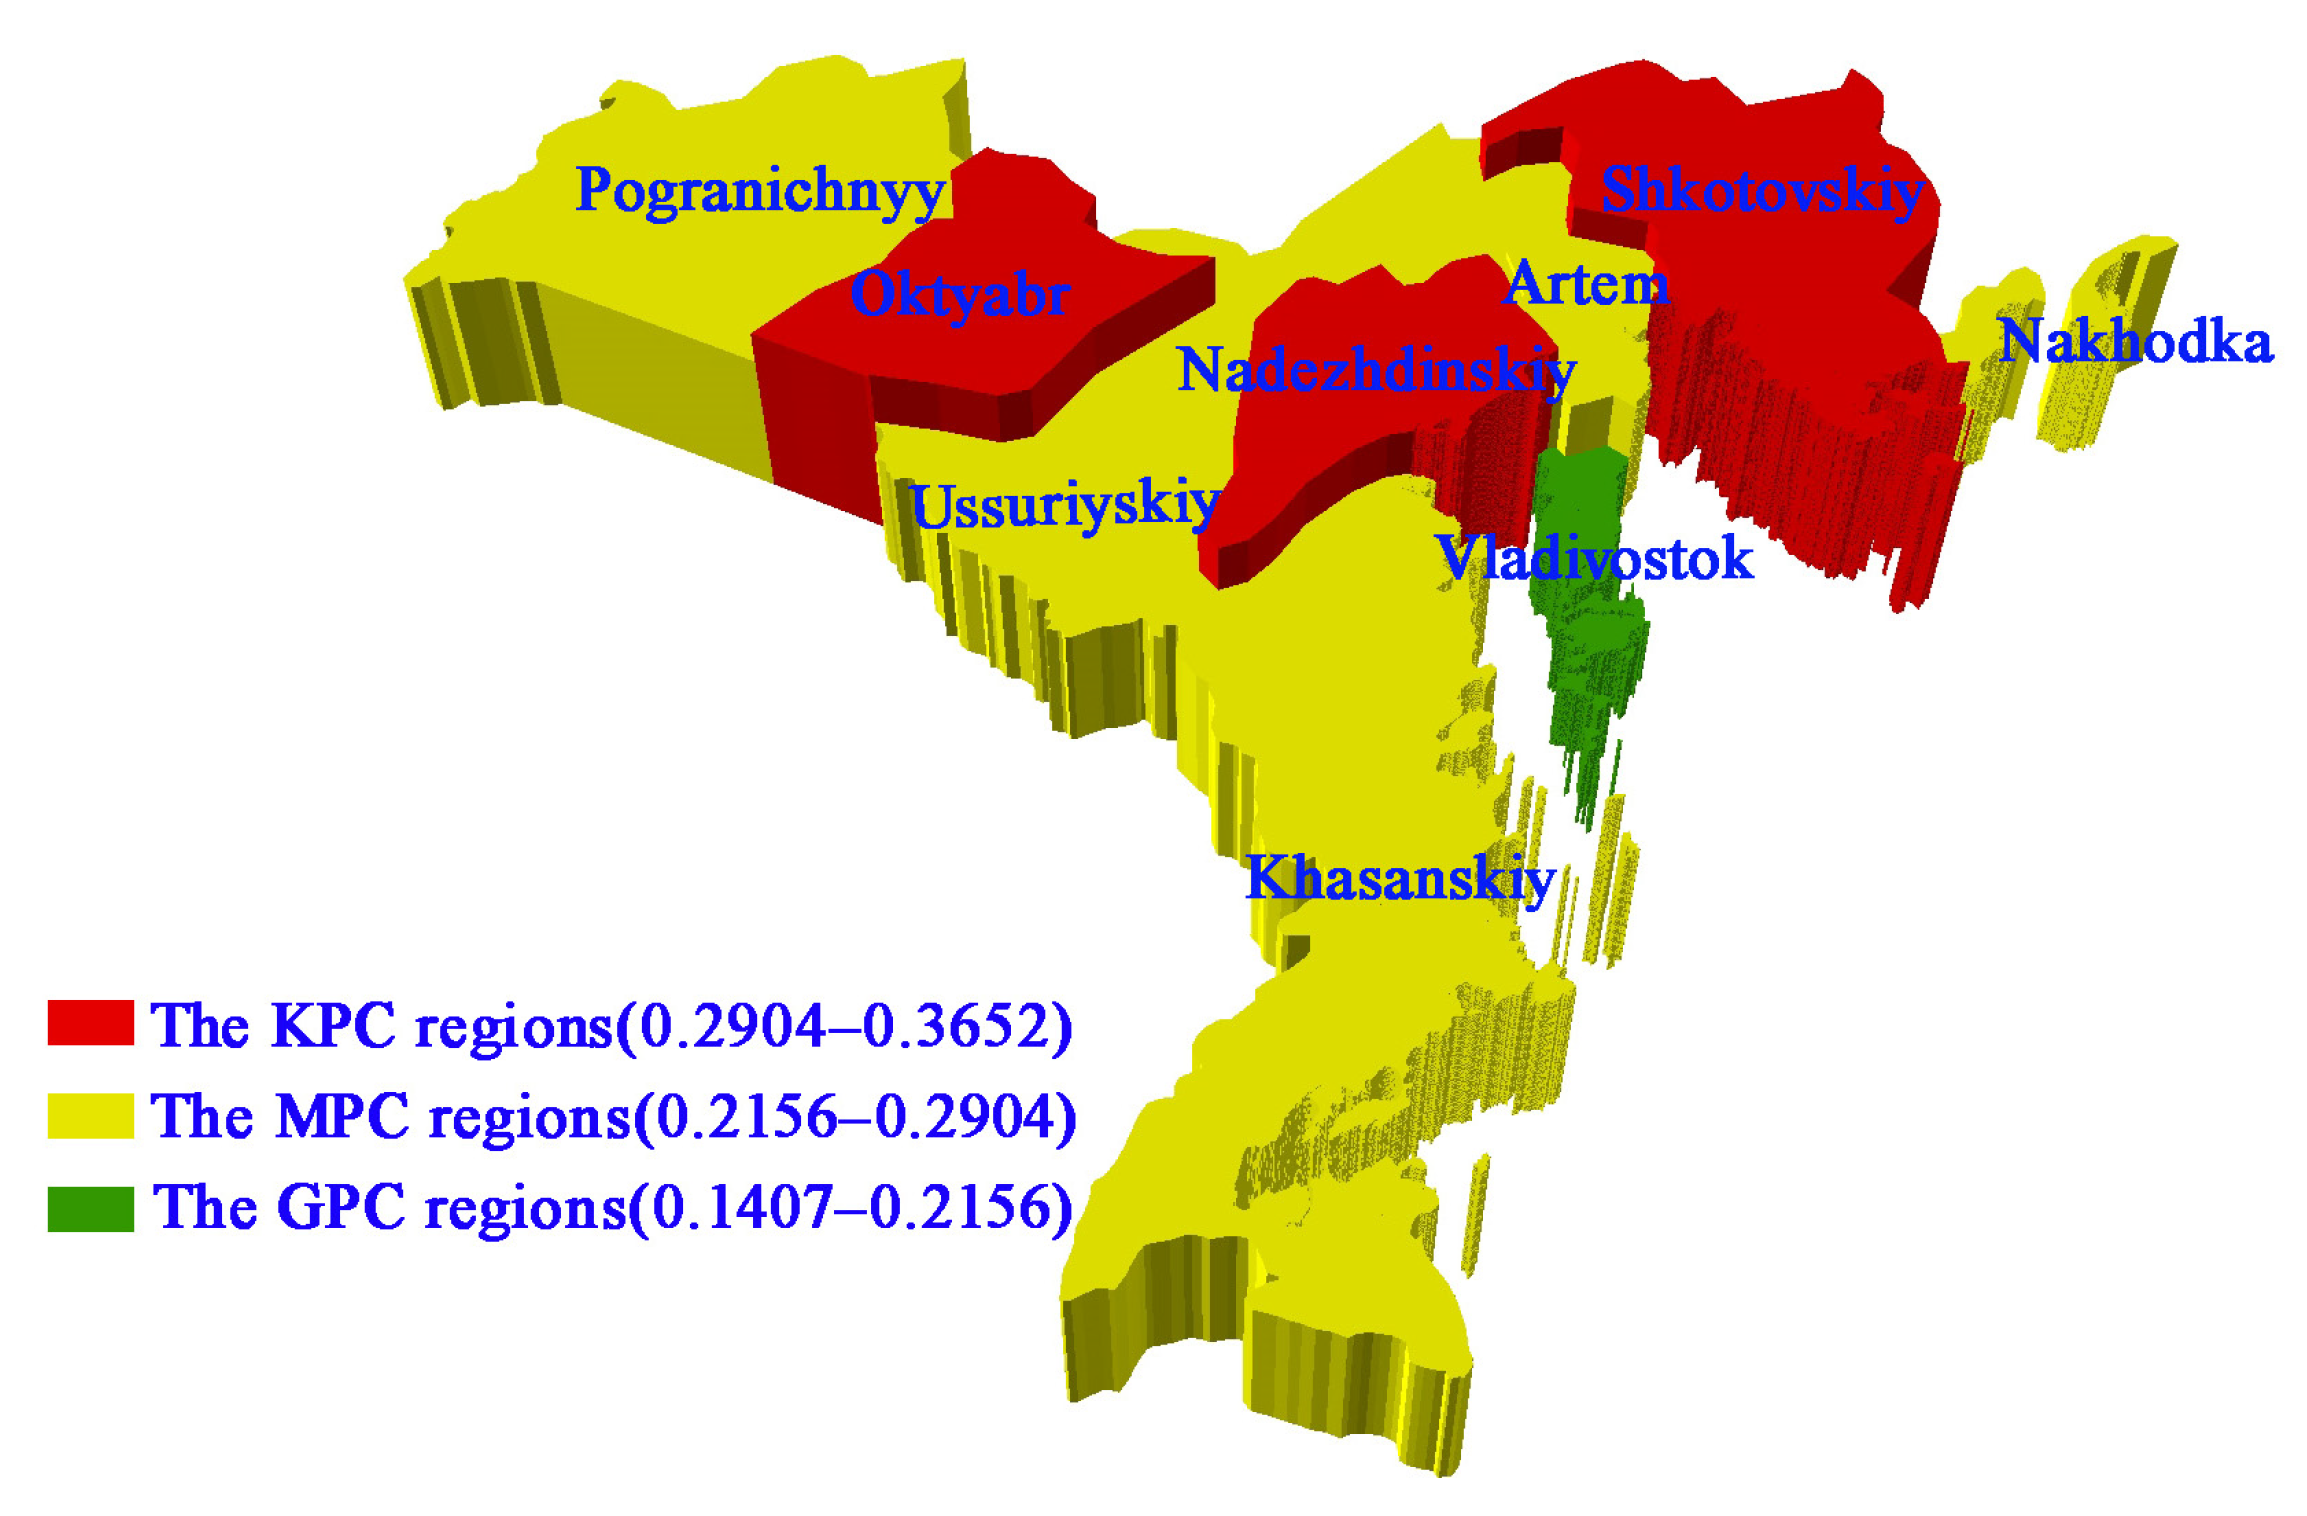
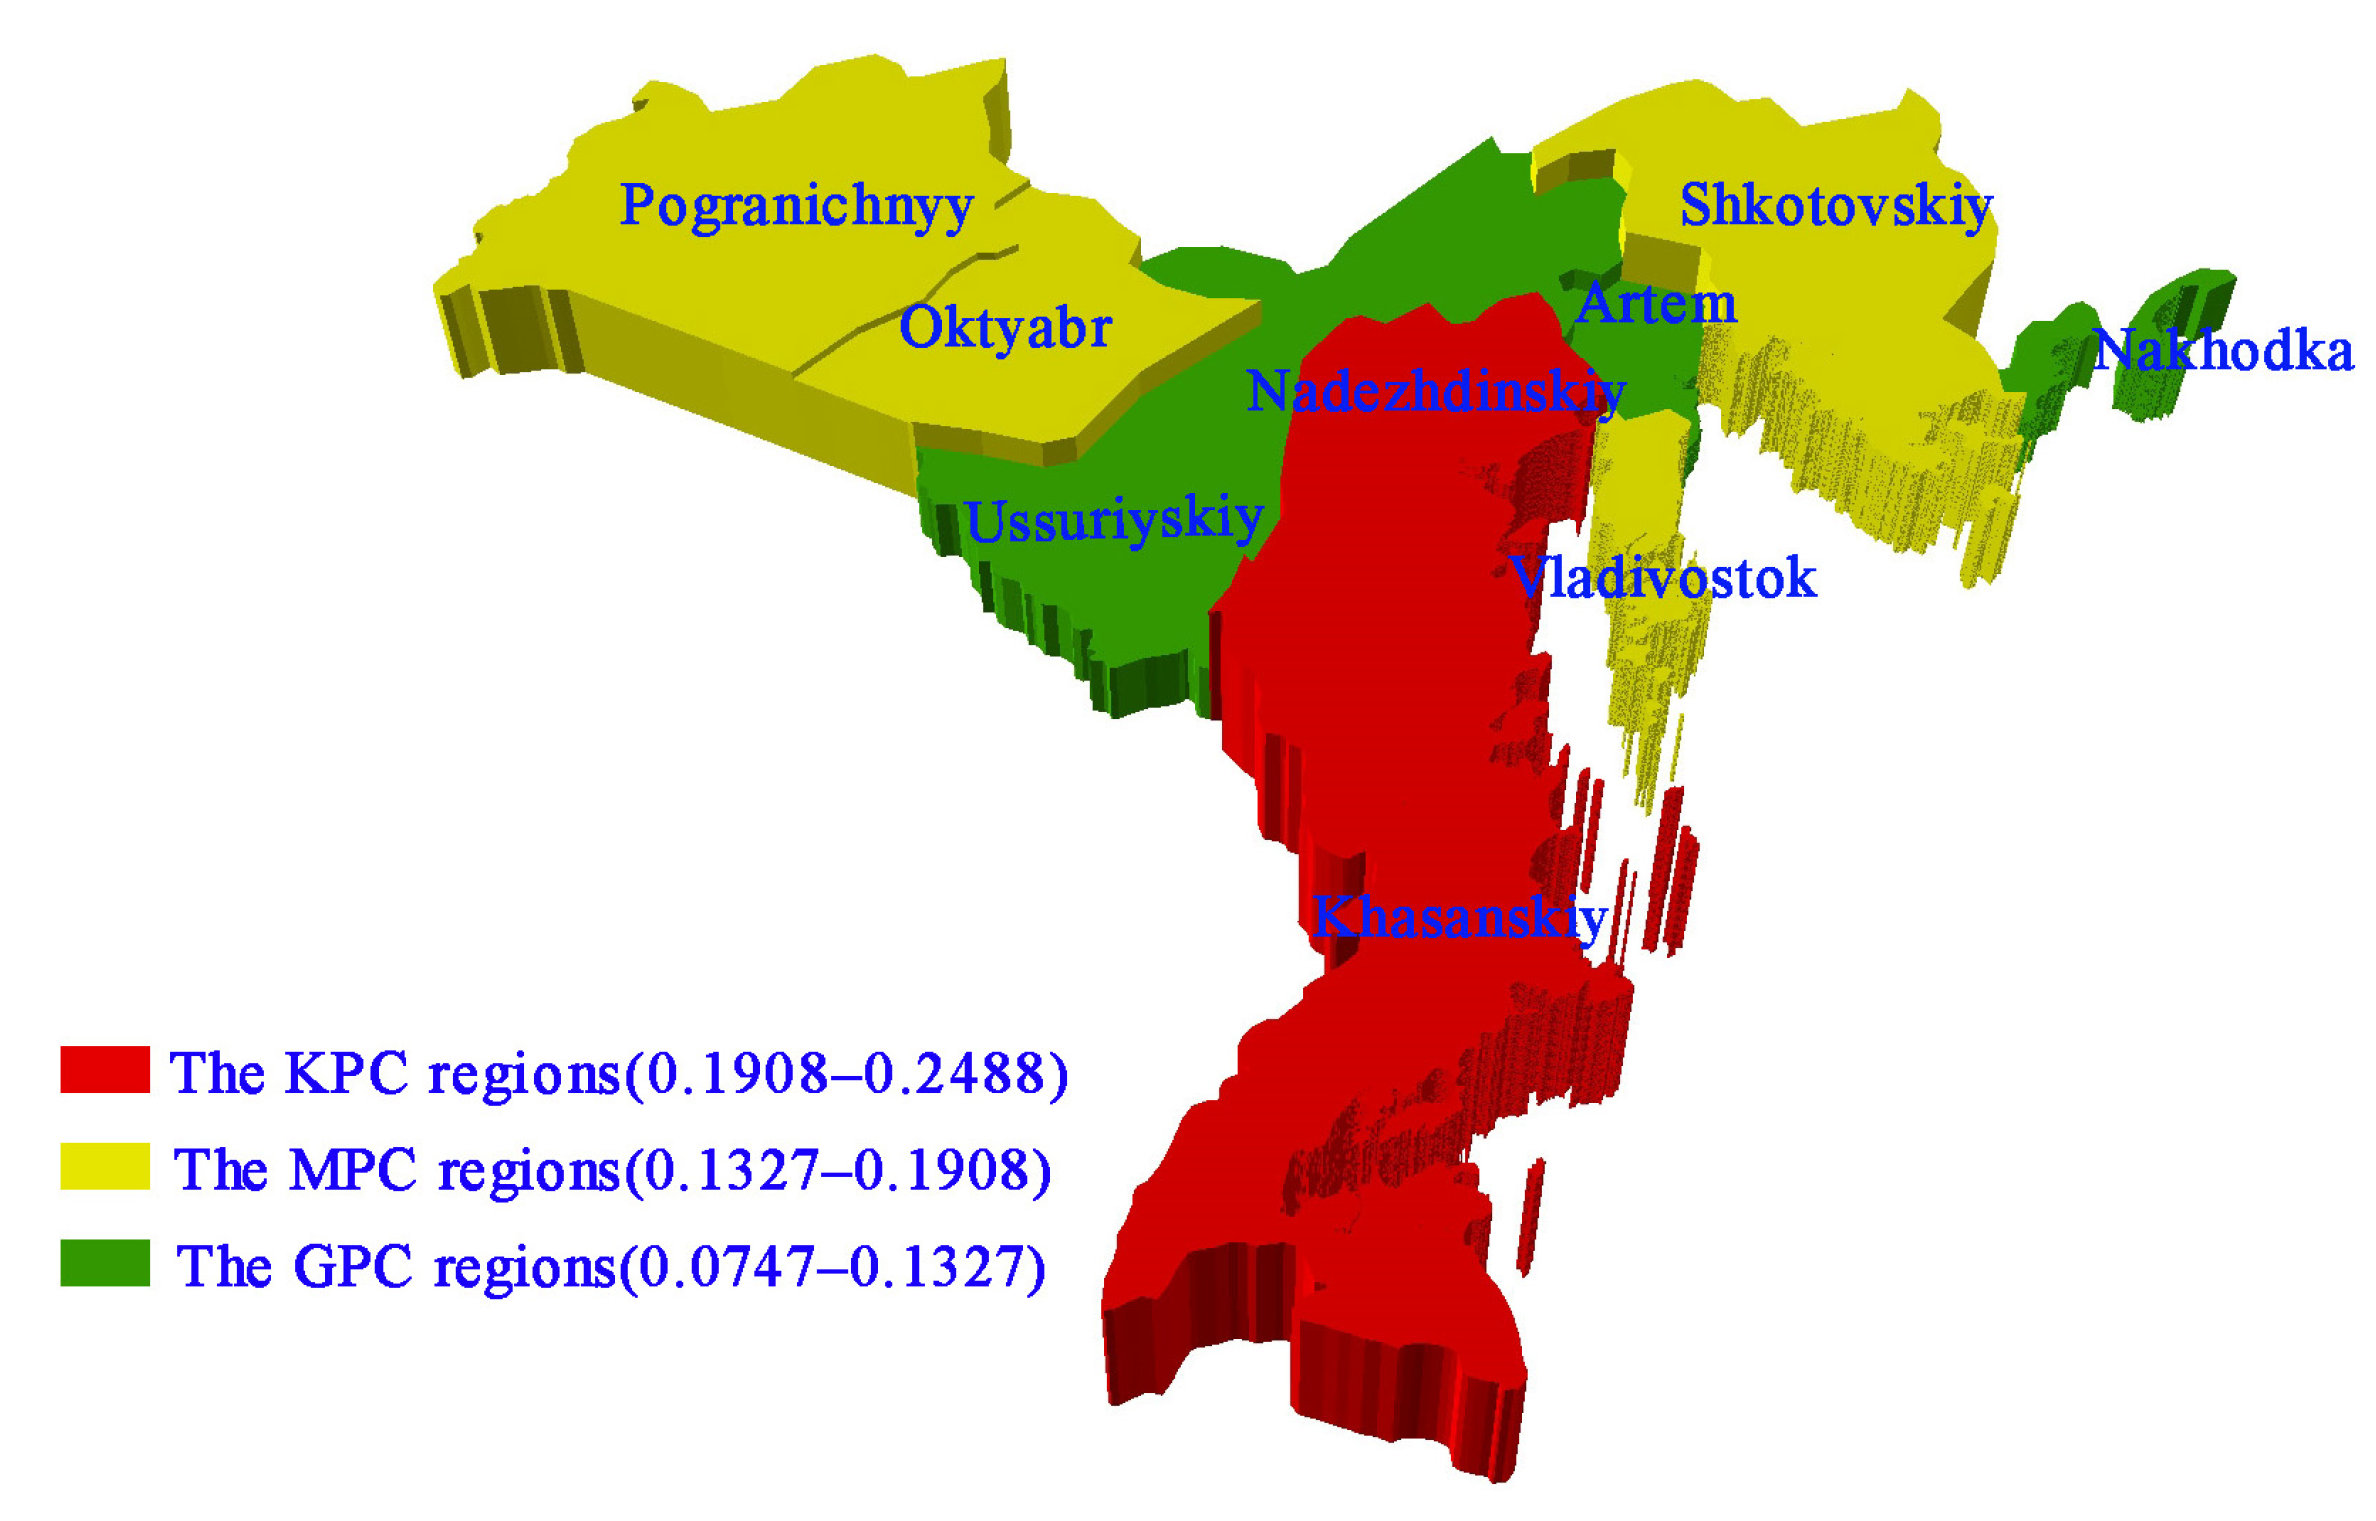
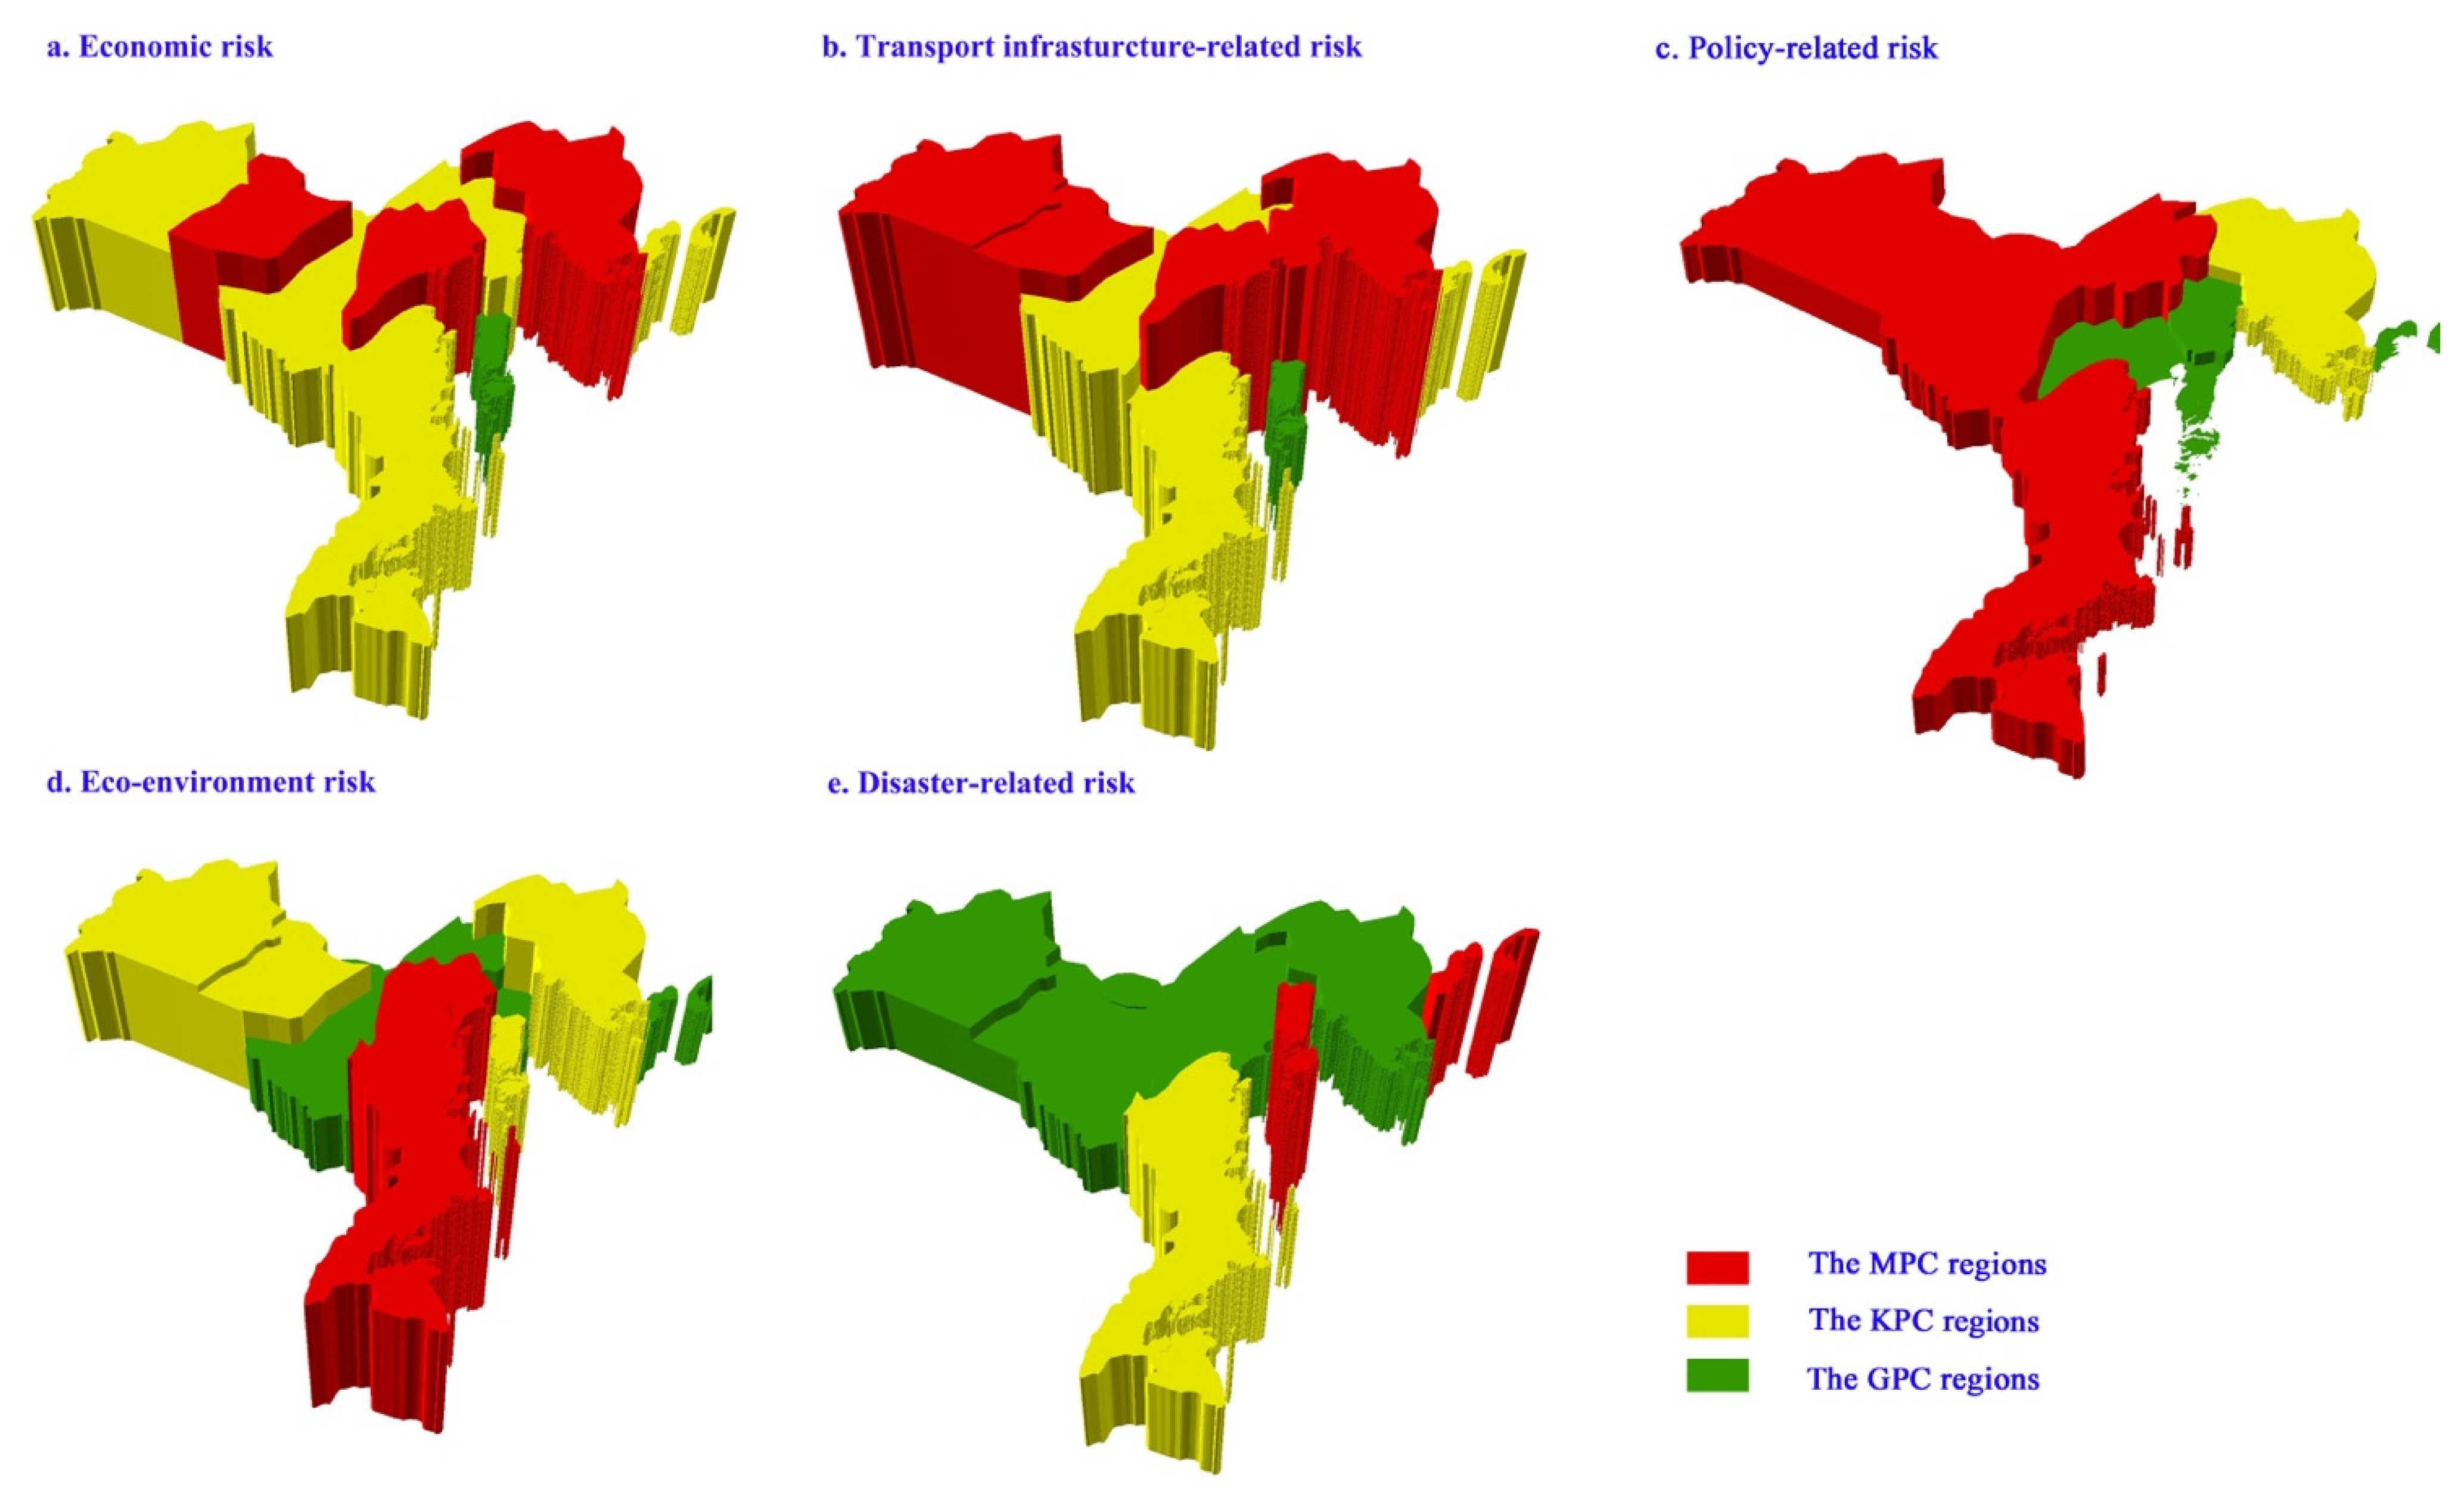
3.1. Economic Risk
- The economic development is poor, and construction funds and materials may be insufficient
- The sparsely distributed and aging population and the problems of outflow and poor mineral resources in some regions limit economic vitality, which makes it difficult to form an agglomeration economy and reduces the overall return on investment of the corridor.
- The living standards in some regions are poor, which affects the safety of the construction and operation of the transport corridors
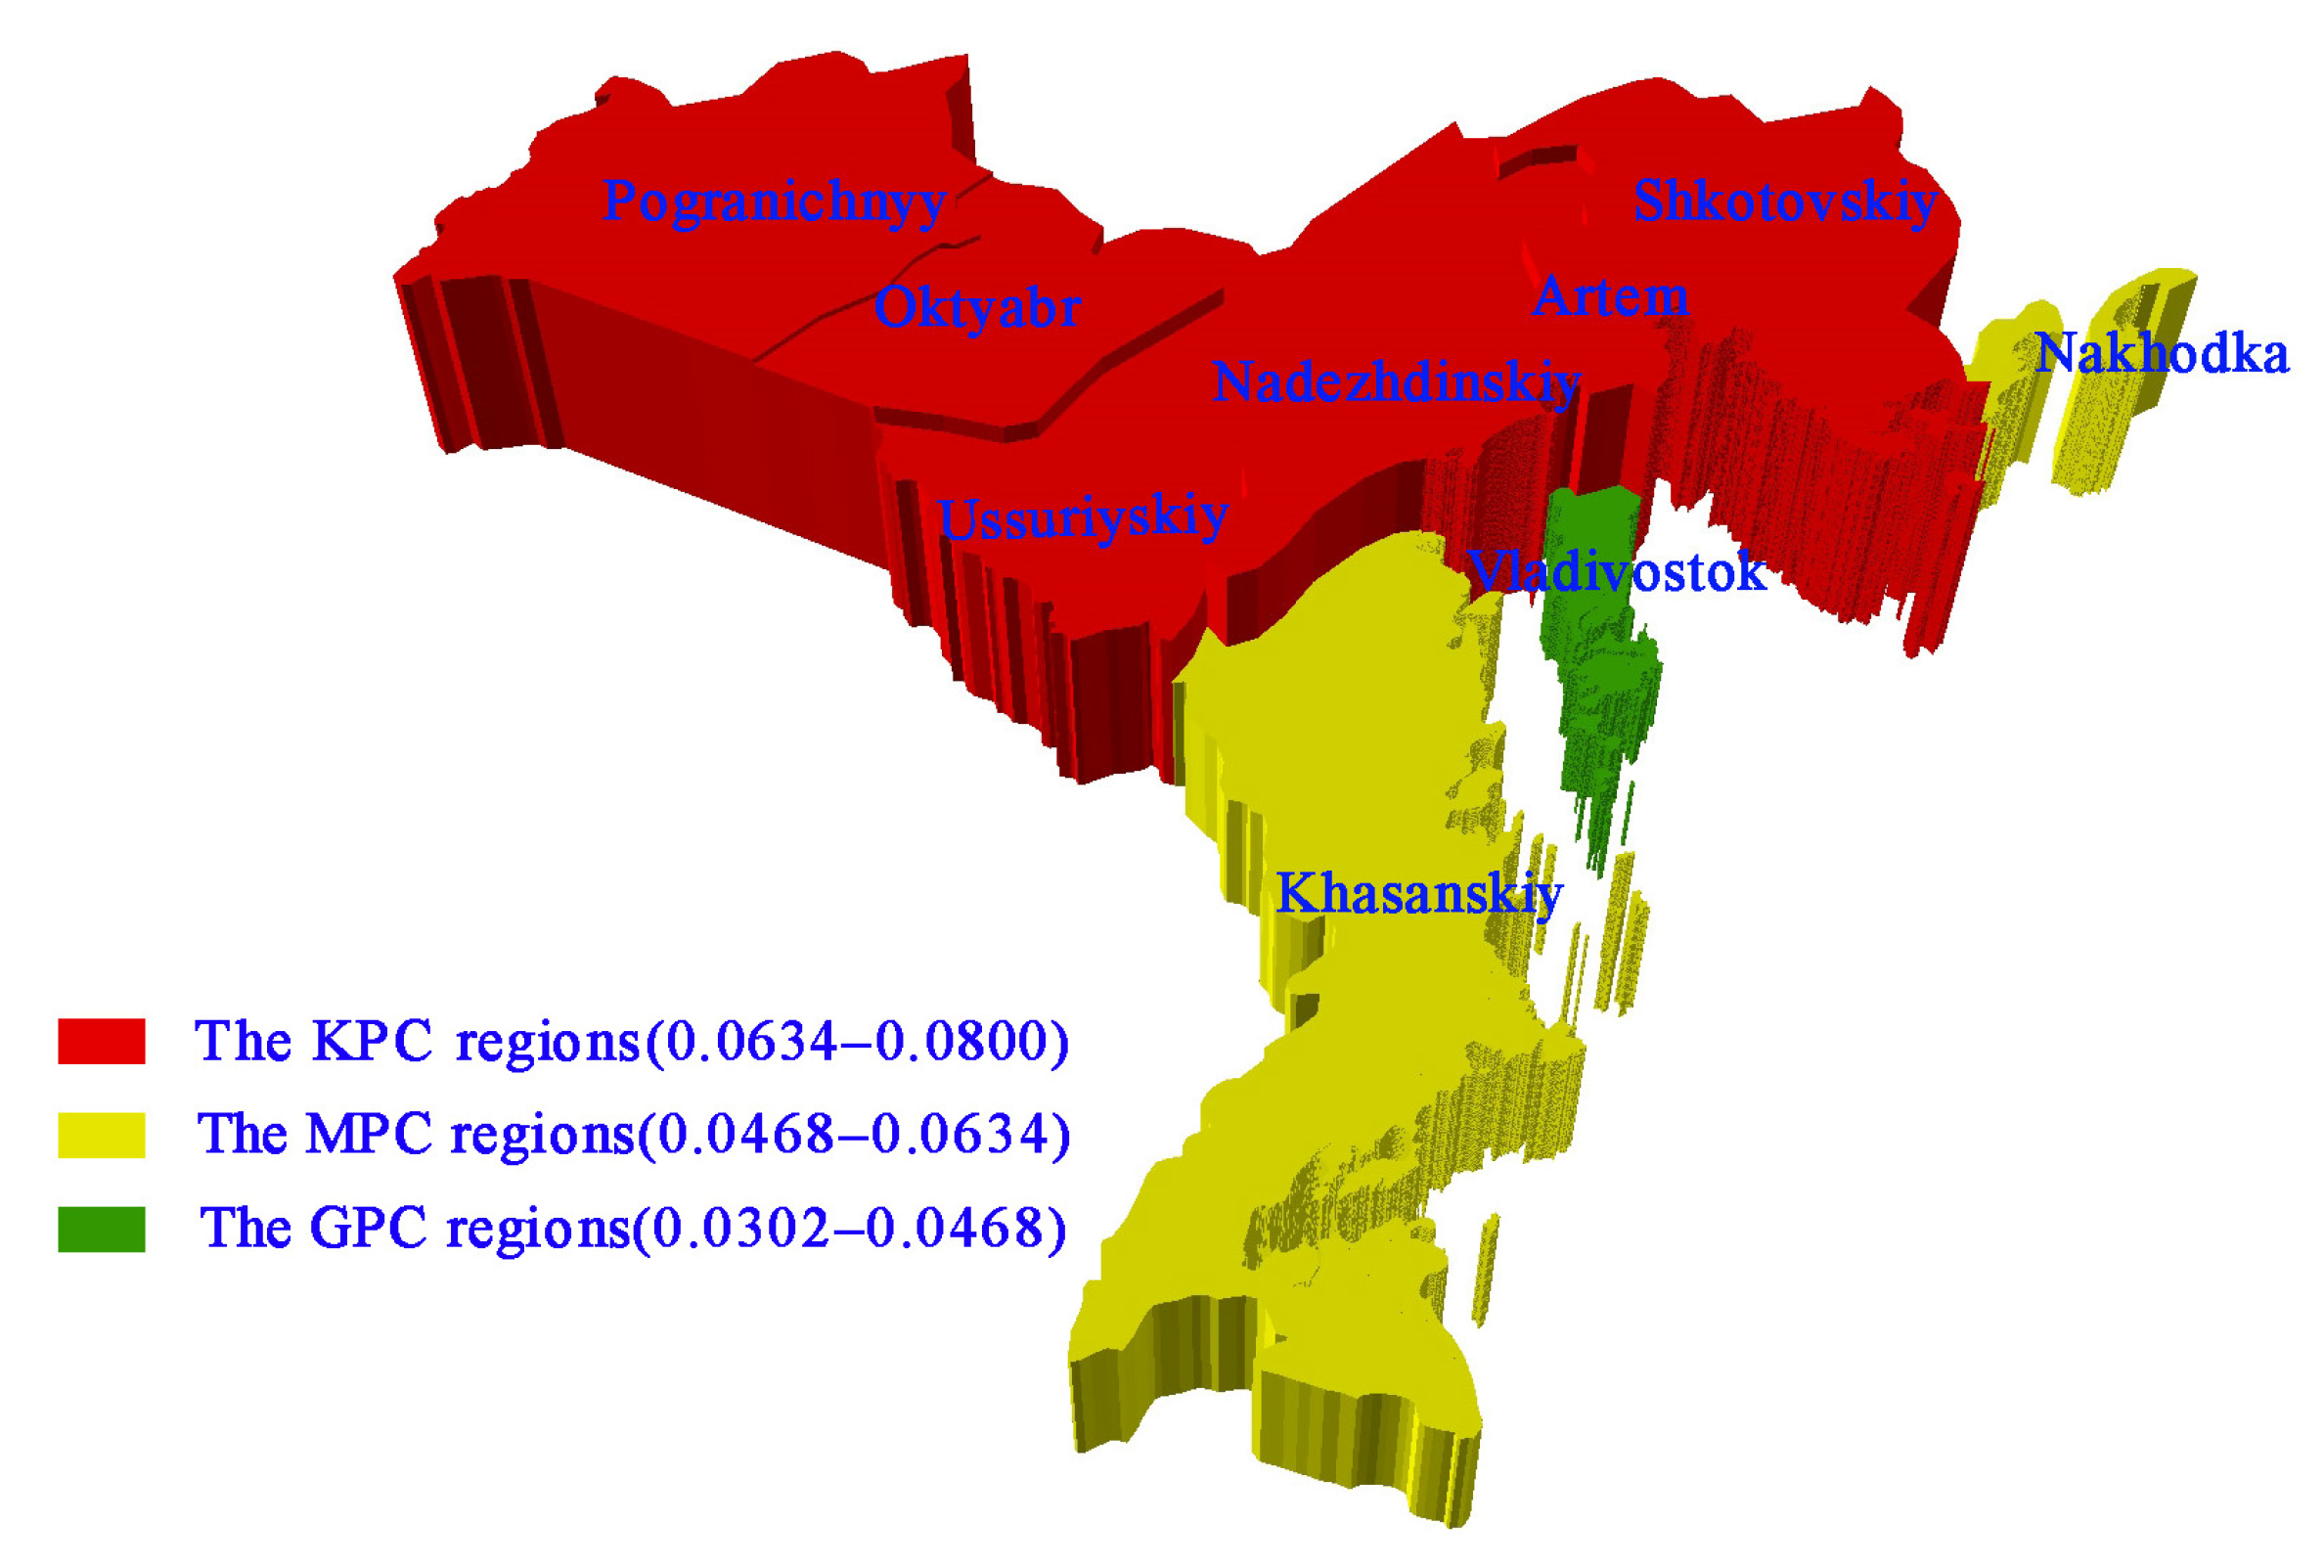
3.2. Transport Infrastructure-Related Risk
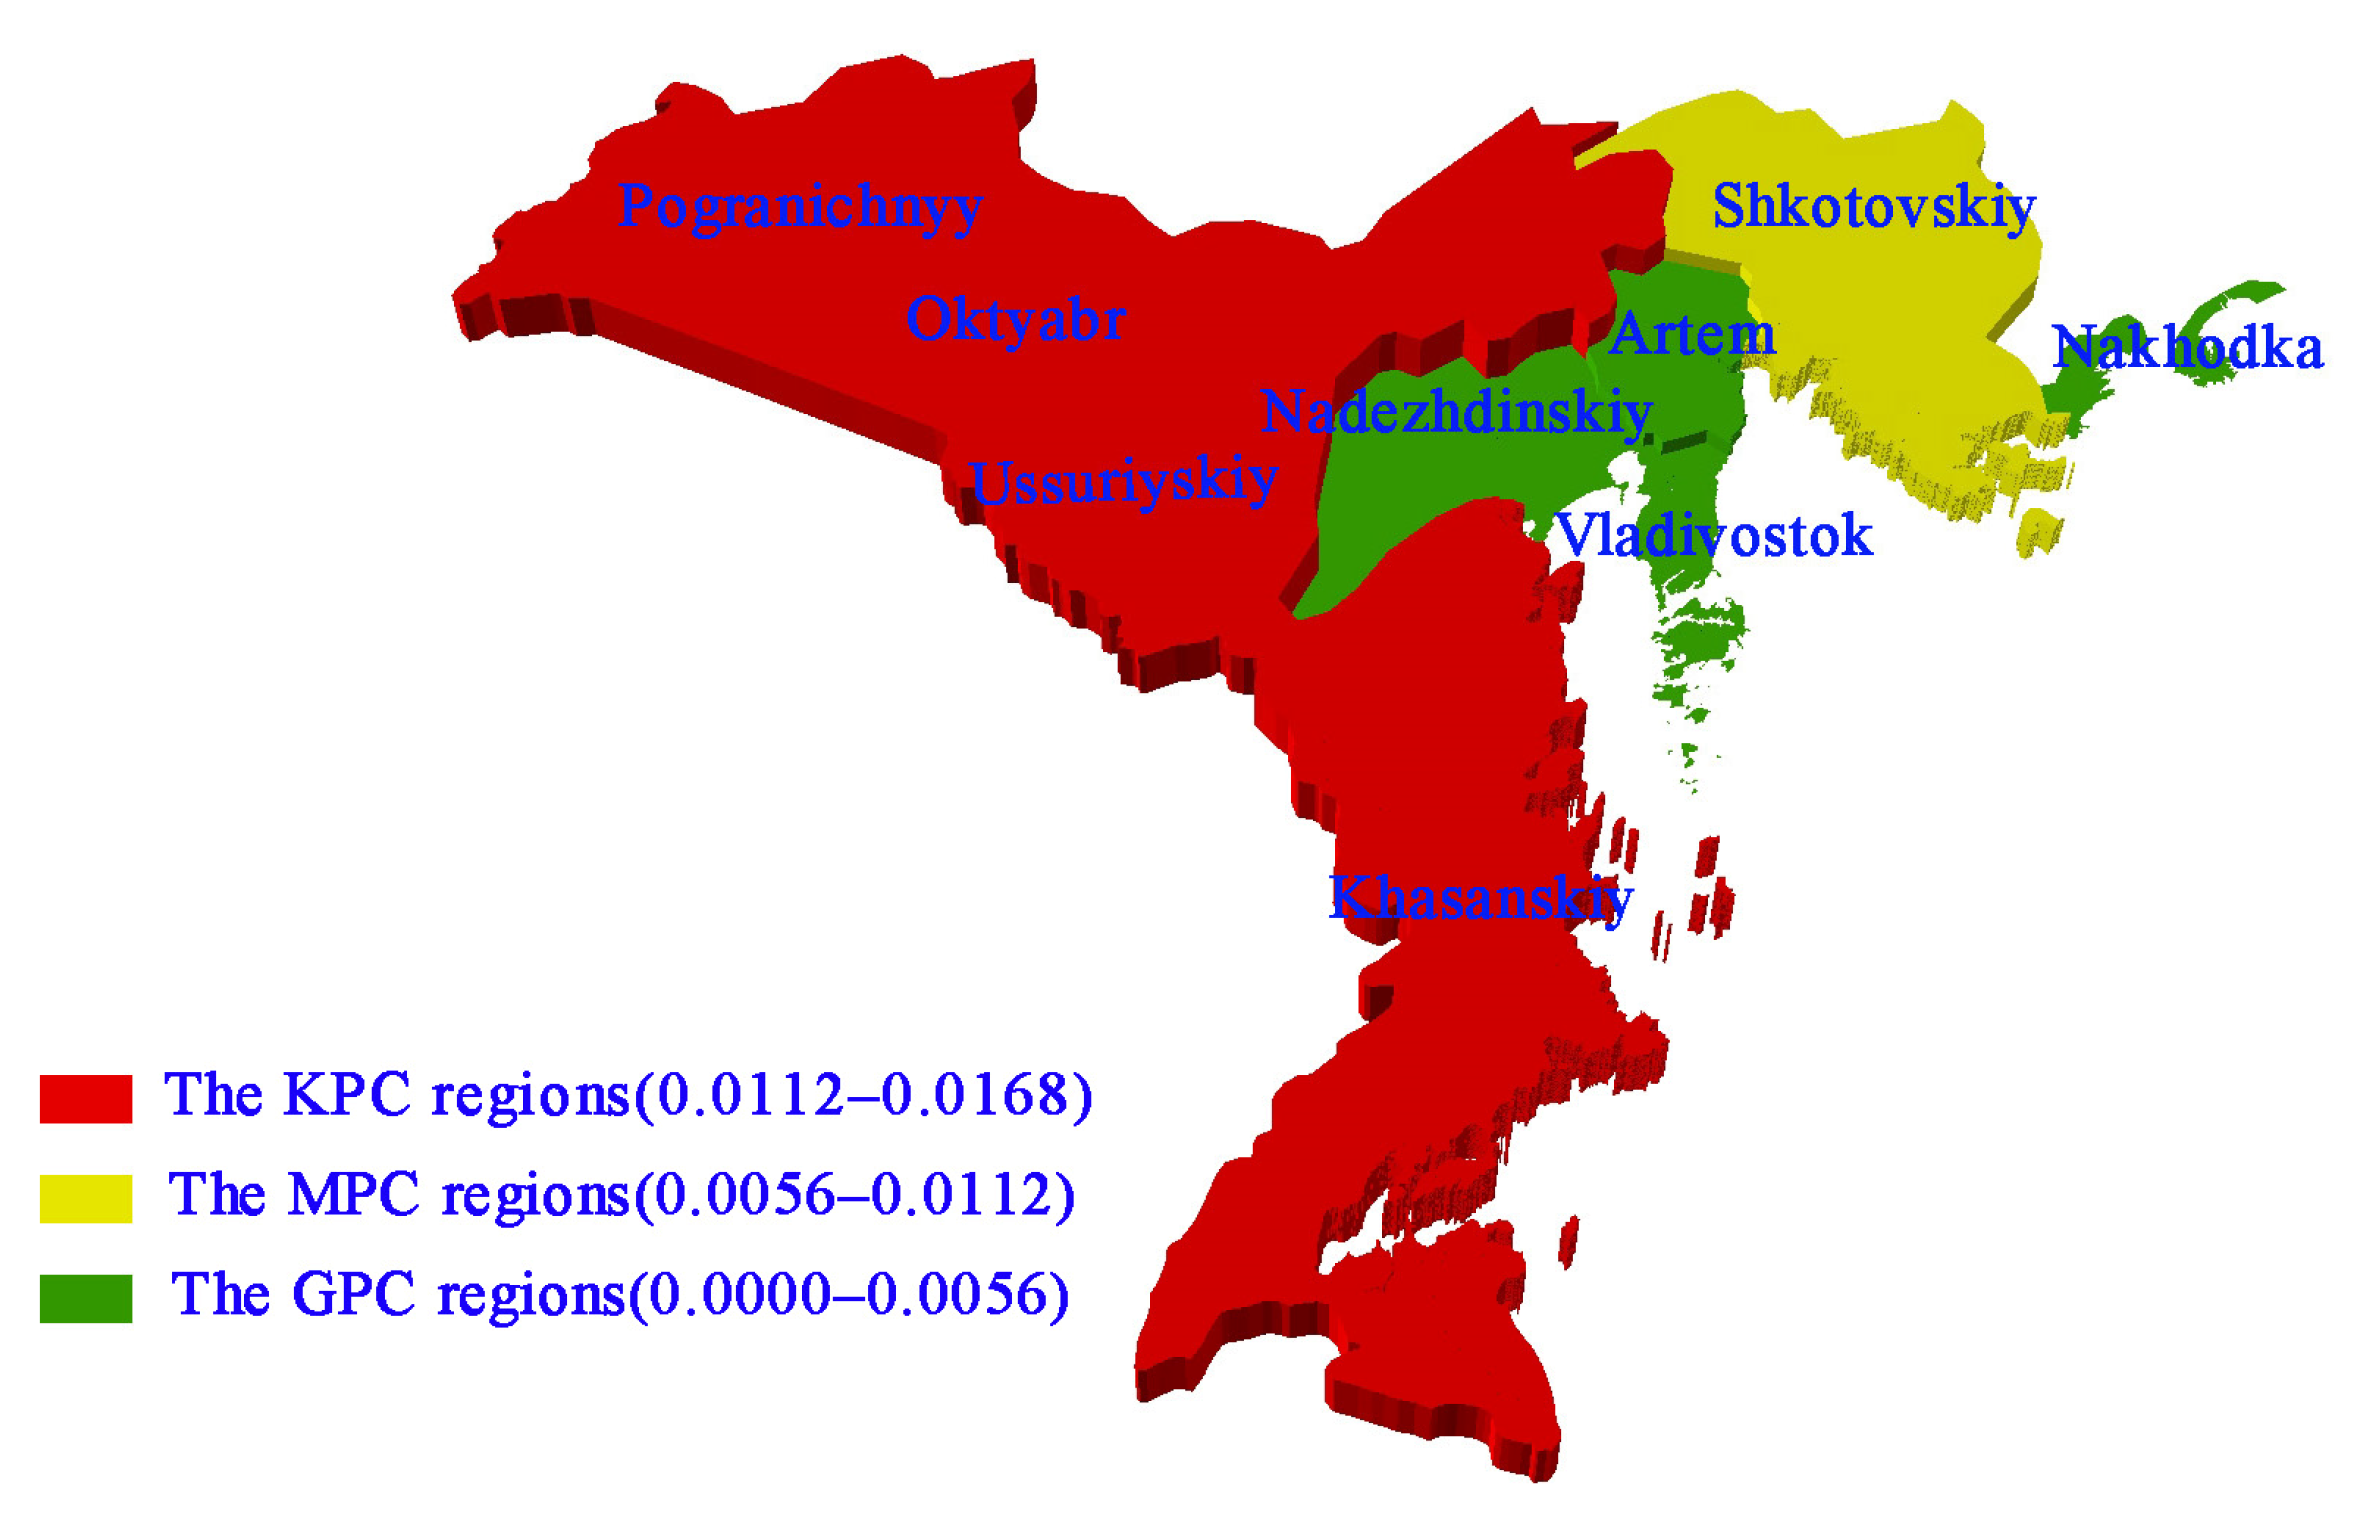
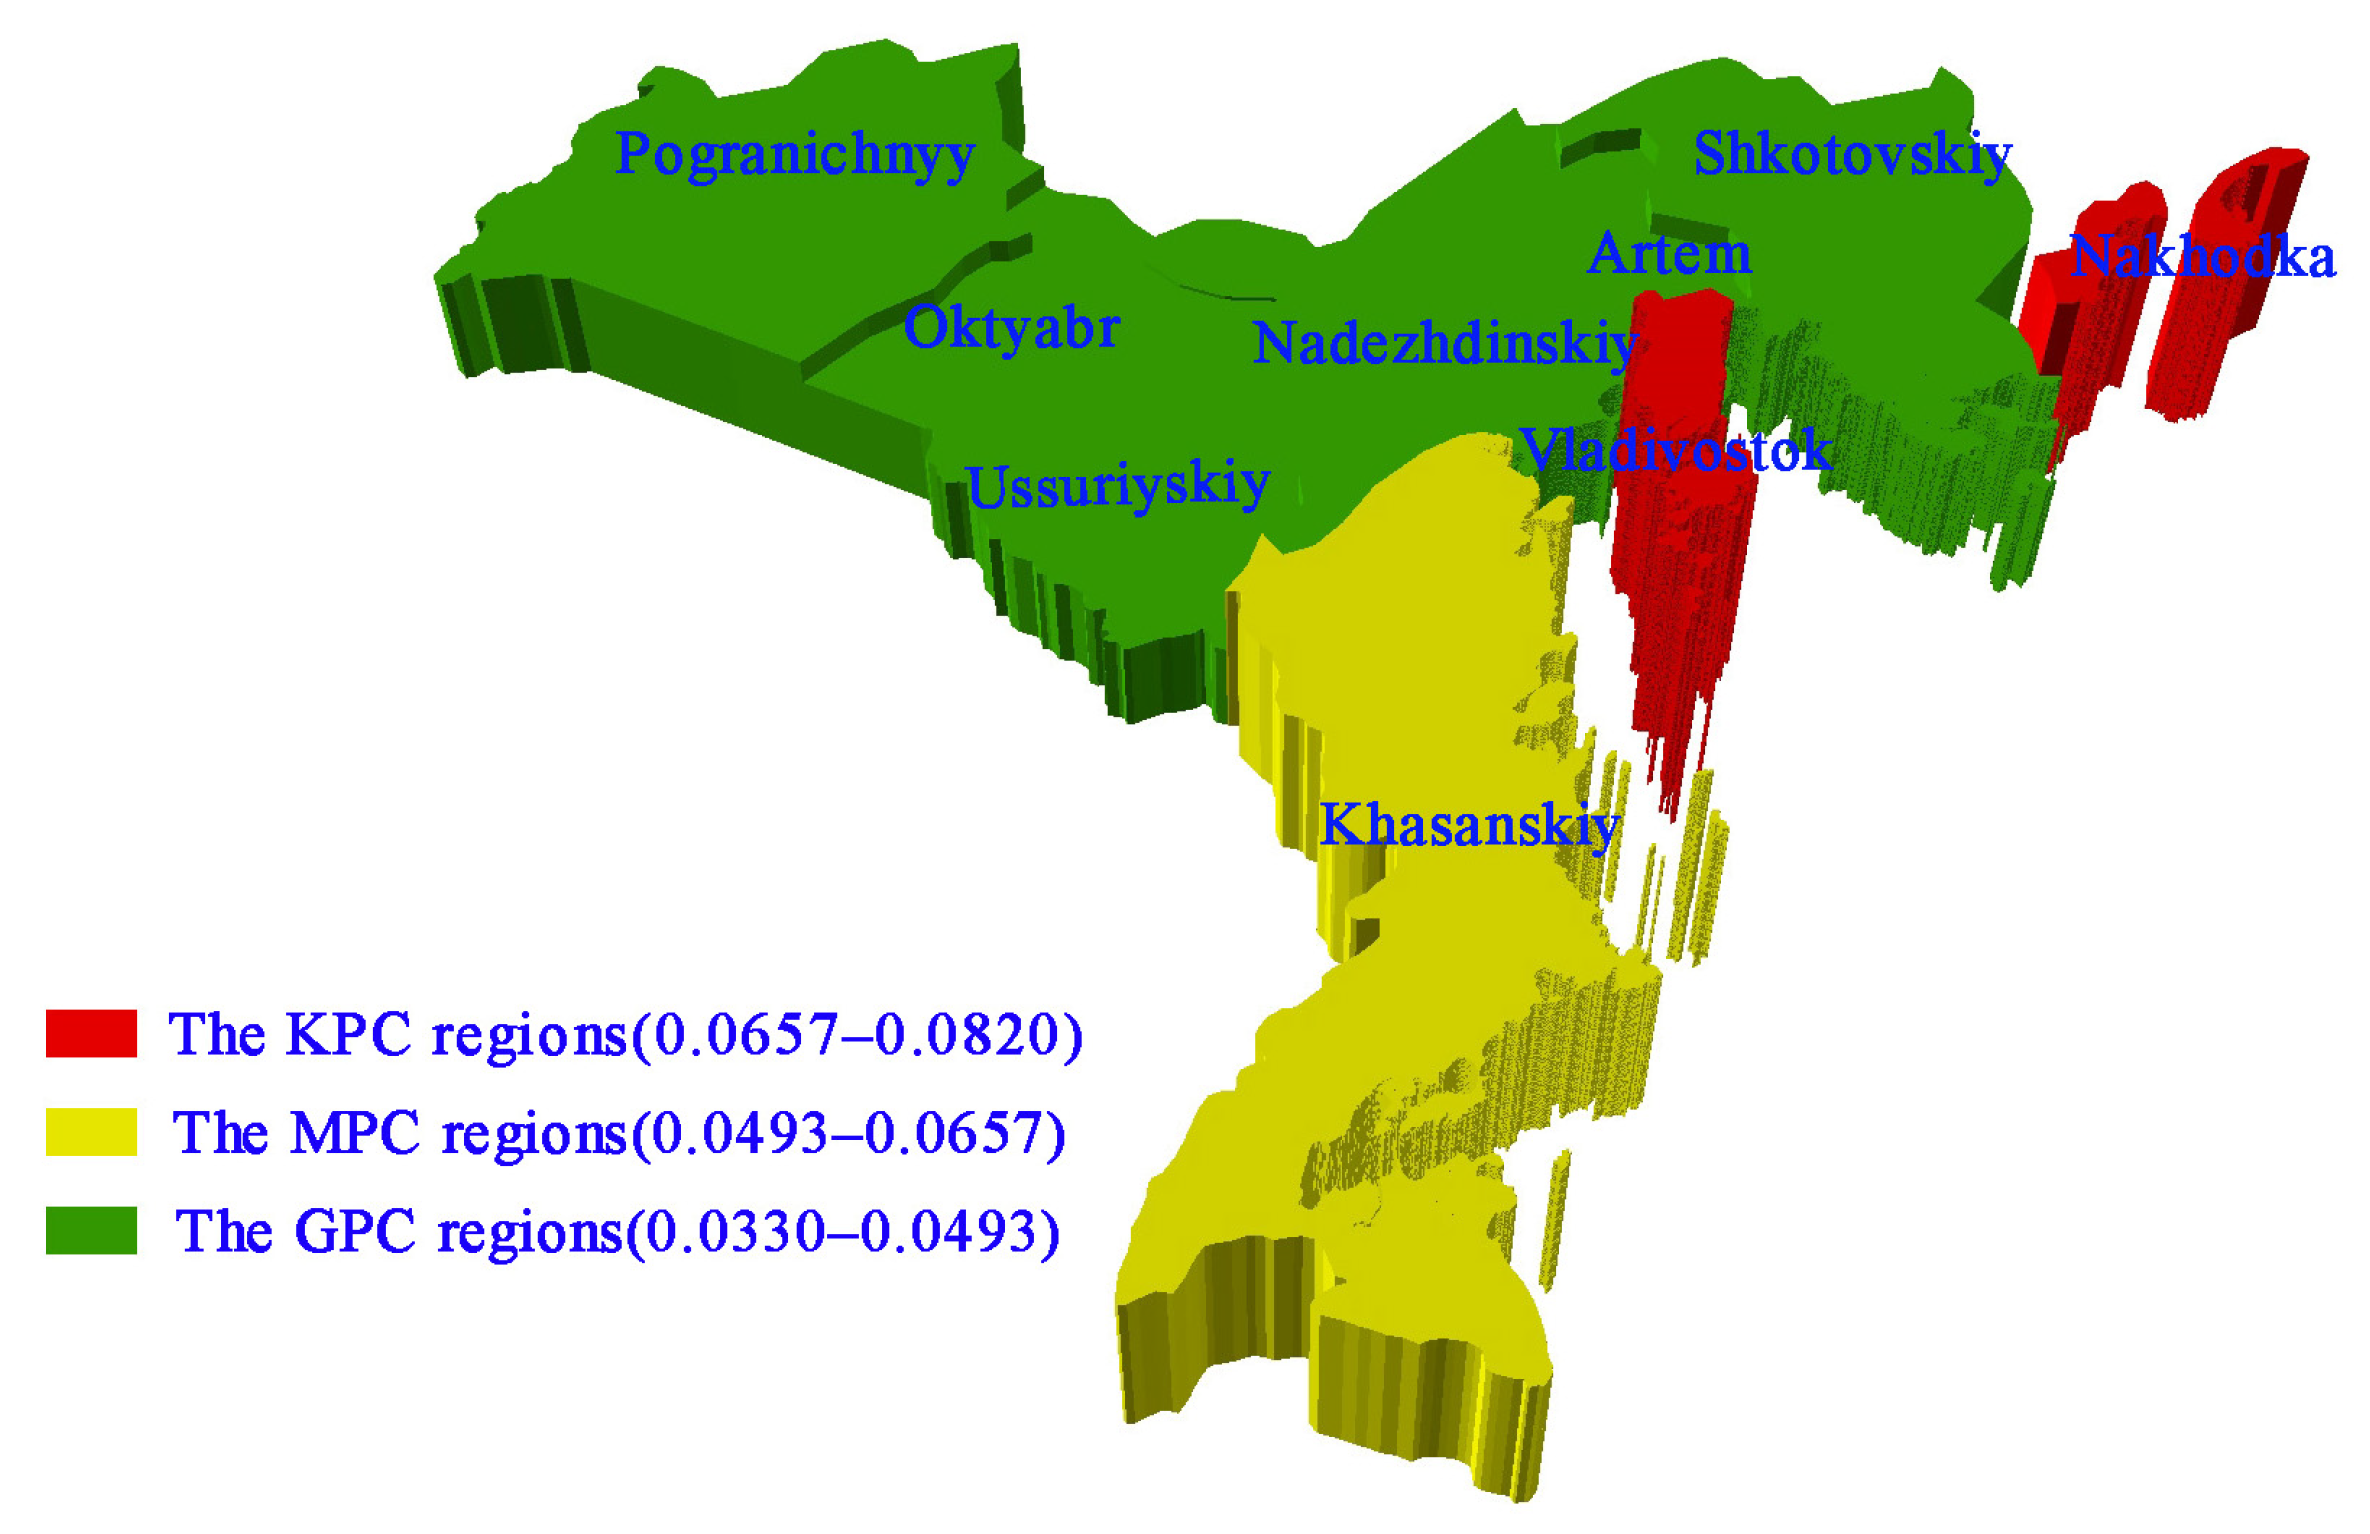
3.3. Policy-Related Risk
3.4. Eco-Environmental Risk
3.5. Disaster-Related Risk
3.6. Comprehensive Risk
4. Discussion
- (1)
- The KPC regions of economic risk include Nadezhdinskiy, Oktyabr, Shkotovskiy, and Pogranichnyy. Due to these regions’ backward economic and industrial development as well as sparsely and aging population, they may not have sufficient funds to construct the corridors. To mitigate the economic risk of these regions, China and Russia governments should innovate modes of cooperation through exchanging resources for funds and exchanging property for funds. Powerful Chinese construction companies, such as the China State Construction Engineering Corporation, and Longjian Road and Bridge Company Limited, can provide funds, technology, talent, equipment, and raw materials to construct, operate, and maintain the transport infrastructure. In exchange, these regions can transfer the ownership, administrative rights, and management rights of the railways and highways, as well as the development rights for local mineral and energy resources to Chinese enterprises. By exchanging resources and developing their comparative advantages, China and Russia can together construct the transport corridors and achieve a win–win outcome. Meanwhile, a special foundation for Primorsky No. 1 and No. 2 international transport corridors should be established, in addition to government allocations, capital investments from large Chinese and Russian road and bridge companies, as well as social donations should be sought, so as to broaden the channels of funding sources and mitigate economic risk.
- (2)
- The KPC regions of infrastructure-related risk include Nadezhdinskiy, Pogranichnyy, Artem, Oktyabr, Shkotovskiy, and Ussuriyskiy, due to their poor infrastructure. Constructing highways and roads in these regions demands large-scale construction, upgrading, and modernization of the railways and roads infrastructure, which will increase the construction difficulty of the transport corridors, and the extremely cold weather of these regions will further exacerbate the construction difficulties. To mitigate the infrastructure-related risk in these regions, the advanced construction technologies and equipment applied in alpine region, such as that achieved and used in the construction of the Qinghai–Tibet railway, should be introduced so as to overcome construction difficulties in these regions and promote the construction progress.
- (3)
- The KPC regions of policy-related risk are distributed in inland regions such as Ussuriyskiy, Oktyabr, Pogranichnyy, and Khasanskiy. Since the issued policies and plans mainly target costal port cities such as Vladivostok and Nokhodka, these inland regions derive limit benefits from them, and they may also not have sufficient policy incentives to carry out large-scale transport construction. To mitigate the policy-related risk in these regions, targeted polices for regional development, specific transport construction, and talent attracting for inland regions should be formulated so as to improve policy support for the construction of the corridors.
- (4)
- The KPC regions of eco-environmental risk include Khasanskiy and Nadezhdinskiy, due to their good ecological environment. The construction and operation of the transport corridors will interfere with the ecological environment and patterns of the ecosystem. To mitigate eco-environmental risk in these regions, firstly, design of the transport corridors should try to avoid zones with dense forests and natural reserves. For natural reserves such as the Leopard National Park and Far East Marine Reserve, buffer zones should be designated, and the transport corridors should be located outside those buffer zones to minimize disturbances to the ecological system. Third, for dotted forests, grassland, lakes, and wetlands that the transport corridor construction cannot avoid, advanced engineering techniques, such as viaducts, tunnels, bridges, ramp transitions, and noise barriers, can be applied to minimize ecological and environmental damage. Moreover, during the construction and operation of the transport corridors, green technology should be used for the efficient use and recycling of resources to reduce the emission of pollutants.
- (5)
- The KPC regions of disaster-related risk include Vladivostok and Nakhodka. These two regions are adjacent to the Sea of Japan (East sea) and are prone to disasters such as floods, tsunamis, and landslides, which increase the difficulty of constructing transport corridors. To mitigate the disaster-related risk in these regions and guarantee the safe construction and operation of the transport corridors, the Sino-Russian governments should establish early warning, prevention, and control systems for such disasters, and they should share the relevant information in real time and make emergency prevention and control plans.
5. Conclusions
Author Contributions
Funding
Institutional Review Board Statement
Informed Consent Statement
Data Availability Statement
Acknowledgments
Conflicts of Interest
Appendix A

| Indices | Artem | Vladivostok | Nakhodka | Ussuriyskiy | Nadezhdinskiy | Oktyabr | Pogranichnyy | Khasanskiy | Shkotovskiy |
|---|---|---|---|---|---|---|---|---|---|
| 1 | 0.014 | 0.000 | 0.012 | 0.012 | 0.016 | 0.016 | 0.016 | 0.016 | 0.016 |
| 2 | 0.007 | 0.000 | 0.004 | 0.009 | 0.014 | 0.012 | 0.017 | 0.010 | 0.007 |
| 3 | 0.016 | 0.000 | 0.012 | 0.015 | 0.016 | 0.016 | 0.016 | 0.016 | 0.014 |
| 4 | 0.016 | 0.014 | 0.000 | 0.016 | 0.016 | 0.016 | 0.016 | 0.016 | 0.016 |
| 5 | 0.016 | 0.000 | 0.015 | 0.016 | 0.016 | 0.016 | 0.016 | 0.016 | 0.016 |
| 6 | 0.016 | 0.000 | 0.014 | 0.016 | 0.016 | 0.016 | 0.016 | 0.016 | 0.016 |
| 7 | 0.001 | 0.000 | 0.014 | 0.013 | 0.016 | 0.017 | 0.017 | 0.016 | 0.016 |
| 8 | 0.000 | 0.001 | 0.014 | 0.012 | 0.017 | 0.009 | 0.002 | 0.002 | 0.002 |
| 9 | 0.006 | 0.014 | 0.016 | 0.011 | 0.014 | 0.016 | 0.016 | 0.015 | 0.000 |
| 10 | 0.010 | 0.002 | 0.003 | 0.007 | 0.005 | 0.001 | 0.000 | 0.002 | 0.017 |
| 11 | 0.000 | 0.001 | 0.001 | 0.01 | 0.001 | 0.002 | 0.002 | 0.003 | 0.001 |
| 12 | 0.000 | 0.002 | 0.002 | 0.001 | 0.001 | 0.004 | 0.002 | 0.002 | 0.002 |
| 13 | 0.000 | 0.001 | 0.003 | 0.004 | 0.001 | 0.005 | 0.002 | 0.001 | 0.002 |
| 14 | 0.000 | 0.001 | 0.001 | 0.001 | 0.002 | 0.002 | 0.001 | 0.001 | 0.001 |
| 15 | 0.000 | 0.003 | 0.001 | 0.001 | 0.003 | 0.003 | 0.001 | 0.001 | 0.002 |
| 16 | 0.014 | 0.000 | 0.013 | 0.012 | 0.016 | 0.016 | 0.016 | 0.016 | 0.016 |
| 17 | 0.009 | 0.017 | 0.014 | 0.000 | 0.008 | 0.008 | 0.003 | 0.007 | 0.007 |
| 18 | 0.011 | 0.008 | 0.014 | 0.003 | 0.016 | 0.013 | 0.000 | 0.008 | 0.017 |
| 19 | 0.008 | 0.017 | 0.009 | 0.006 | 0.005 | 0.000 | 0.001 | 0.006 | 0.005 |
| 20 | 0.007 | 0.000 | 0.009 | 0.001 | 0.012 | 0.012 | 0.001 | 0.006 | 0.017 |
| 21 | 0.016 | 0.012 | 0.015 | 0.011 | 0.015 | 0.016 | 0.000 | 0.014 | 0.013 |
| 22 | 0.008 | 0.000 | 0.004 | 0.008 | 0.011 | 0.017 | 0.015 | 0.012 | 0.008 |
| 23 | 0.004 | 0.004 | 0.015 | 0.000 | 0.000 | 0.004 | 0.009 | 0.017 | 0.004 |
| 24 | 0.001 | 0.001 | 0.000 | 0.002 | 0.017 | 0.013 | 0.009 | 0.005 | 0.009 |
| 25 | 0.011 | 0.000 | 0.006 | 0.007 | 0.017 | 0.013 | 0.015 | 0.008 | 0.009 |
| 26 | 0.001 | 0.000 | 0.005 | 0.004 | 0.007 | 0.017 | 0.011 | 0.004 | 0.005 |
| 27 | 0.006 | 0.001 | 0.003 | 0.007 | 0.010 | 0.017 | 0.000 | 0.012 | 0.001 |
| 28 | 0.009 | 0.000 | 0.011 | 0.001 | 0.014 | 0.012 | 0.005 | 0.004 | 0.017 |
| 29 | 0.001 | 0.000 | 0.002 | 0.000 | 0.005 | 0.003 | 0.001 | 0.000 | 0.017 |
| 30 | 0.012 | 0.000 | 0.011 | 0.011 | 0.013 | 0.014 | 0.013 | 0.012 | 0.016 |
| 31 | 0.009 | 0.015 | 0.013 | 0.007 | 0.013 | 0.000 | 0.017 | 0.008 | 0.005 |
| 32 | 0.015 | 0.015 | 0.012 | 0.010 | 0.016 | 0.016 | 0.016 | 0.000 | 0.010 |
| 33 | 0.013 | 0.012 | 0.003 | 0.013 | 0.017 | 0.002 | 0.012 | 0.000 | 0.014 |
| 34 | 0.016 | 0.000 | 0.016 | 0.016 | 0.016 | 0.016 | 0.016 | 0.016 | 0.016 |
| 35 | 0.015 | 0.000 | 0.015 | 0.016 | 0.016 | 0.016 | 0.016 | 0.016 | 0.016 |
| 36 | 0.015 | 0.000 | 0.007 | 0.010 | 0.015 | 0.012 | 0.014 | 0.016 | 0.016 |
| 37 | 0.014 | 0.015 | 0.005 | 0.013 | 0.016 | 0.014 | 0.015 | 0.000 | 0.010 |
| 38 | 0.016 | 0.015 | 0.016 | 0.013 | 0.016 | 0.016 | 0.015 | 0.000 | 0.015 |
| 39–48 | 0.006 | 0.000 | 0.000 | 0.017 | 0.000 | 0.017 | 0.017 | 0.017 | 0.011 |
| 49 | 0.007 | 0.000 | 0.003 | 0.009 | 0.004 | 0.017 | 0.004 | 0.001 | 0.000 |
| 50 | 0.010 | 0.009 | 0.010 | 0.010 | 0.012 | 0.000 | 0.011 | 0.012 | 0.016 |
| 51 | 0.002 | 0.000 | 0.000 | 0.001 | 0.007 | 0.017 | 0.013 | 0.008 | 0.000 |
| 52 | 0.004 | 0.003 | 0.017 | 0.000 | 0.002 | 0.002 | 0.000 | 0.007 | 0.001 |
| 53 | 0.004 | 0.004 | 0.004 | 0.000 | 0.008 | 0.004 | 0.004 | 0.017 | 0.008 |
| 54 | 0.008 | 0.013 | 0.013 | 0.000 | 0.008 | 0.000 | 0.000 | 0.017 | 0.004 |
| 55 | 0.000 | 0.017 | 0.000 | 0.017 | 0.017 | 0.000 | 0.000 | 0.017 | 0.017 |
| 56 | 0.000 | 0.017 | 0.000 | 0.017 | 0.000 | 0.000 | 0.000 | 0.017 | 0.000 |
| 57 | 0.000 | 0.000 | 0.004 | 0.000 | 0.004 | 0.000 | 0.017 | 0.017 | 0.009 |
| 58 | 0.000 | 0.000 | 0.000 | 0.017 | 0.013 | 0.004 | 0.008 | 0.017 | 0.000 |
| 59 | 0.000 | 0.009 | 0.007 | 0.006 | 0.016 | 0.015 | 0.017 | 0.015 | 0.016 |
| 60 | 0.007 | 0.007 | 0.002 | 0.000 | 0.015 | 0.014 | 0.017 | 0.014 | 0.015 |
| 61 | 0.000 | 0.013 | 0.014 | 0.012 | 0.016 | 0.016 | 0.016 | 0.016 | 0.016 |
| 62 | 0.001 | 0.006 | 0.000 | 0.000 | 0.016 | 0.014 | 0.017 | 0.014 | 0.016 |
| 63 | 0.000 | 0.008 | 0.010 | 0.009 | 0.016 | 0.016 | 0.016 | 0.015 | 0.016 |
| 64 | 0.013 | 0.012 | 0.011 | 0.000 | 0.015 | 0.016 | 0.016 | 0.014 | 0.015 |
| 65 | 0.000 | 0.006 | 0.012 | 0.010 | 0.016 | 0.016 | 0.016 | 0.015 | 0.015 |
| 66 | 0.012 | 0.014 | 0.000 | 0.008 | 0.015 | 0.013 | 0.015 | 0.015 | 0.016 |
| 67 | 0.006 | 0.017 | 0.010 | 0.002 | 0.003 | 0.009 | 0.001 | 0.000 | 0.001 |
| 68 | 0.000 | 0.015 | 0.017 | 0.000 | 0.000 | 0.000 | 0.017 | 0.015 | 0.015 |
| 69 | 0.012 | 0.012 | 0.016 | 0.012 | 0.012 | 0.000 | 0.008 | 0.012 | 0.012 |
| 70 | 0.000 | 0.015 | 0.018 | 0.000 | 0.000 | 0.000 | 0.000 | 0.000 | 0.000 |
| 71 | 0.000 | 0.018 | 0.001 | 0.000 | 0.000 | 0.000 | 0.000 | 0.000 | 0.000 |
| 72 | 0.006 | 0.006 | 0.006 | 0.006 | 0.017 | 0.017 | 0.017 | 0.017 | 0.000 |
| 73 | 0.016 | 0.016 | 0.016 | 0.016 | 0.016 | 0.016 | 0.000 | 0.016 | 0.016 |
References
- National Development and Reform Commission (NDRC). China and Russia Signed Memorandum of Understanding on Cooperation. Available online: http://www.chinadevelopment.com.cn/fgw/2017/07/1157561.shtml (accessed on 11 February 2020).
- Ministry of Commerce of the People’s Republic of China (MOC). Russian Government Approves the Development Construction of “Primorsky No. 1” and “Primorsky No. 1” International Transport Corridor. Available online: http://www.mofcom.gov.cn/article/i/jyjl/e/201701/20170102494758.shtml (accessed on 11 February 2020).
- Liang, Z.M.; Chen, C. Study on Northeast Asia international cooperation and construction of the second Northeast Asia—Europe Land Bridge. Northeast Asia Forum 2012, 21, 59–64. [Google Scholar]
- Li, Z.F.; Liu, S.S. Docking of “Polar Silk Road” in Northeast China. Econ. Rev. J. 2018, 5, 61–67. [Google Scholar]
- Dou, B. On the Polar Silk Road and jointly building of blue economic passage for Arctic route between China and Russia. Northeast Asia Econ. Res. 2018, 2, 5–14. [Google Scholar]
- Sazonov, S.L. Russia and China in Eurasian transport corridor. Asia Afr. Today 2014, 8, 12–18. [Google Scholar]
- Romanova, G. Russian Far East-Northeast China: Trade links, transit, transport communications (1920–1930s). Far East Probl. 2010, 5, 72–85. [Google Scholar]
- Aristova, L.B.; Semenova, N.K. New transport policy priorities in the format RF-CA-China. Bull. Novosib. State Univ.Ser. Hist. Philol. 2016, 15, 167–176. [Google Scholar]
- Wu, L.; Zhang, L.G.; Lai, Y.; Chen, J. Risk assessment of highspeed railway tunnel construction based on fuzzy systhenic evaluation. Adv. Mater. Res. 2012, 594–597, 1251–1256. [Google Scholar]
- Dong, S.C.; Yang, Y.; Li, F.J.; Cheng, H.; Li, J.N.; Bilgaev, A.; Li, Z.H.; Li, Y. An evaluation of the economic, social, and ecological risks of China-Mongolia-Russia high-speed railway construction and policy suggestions. J. Geogr. Sci. 2018, 28, 900–918. [Google Scholar] [CrossRef]
- Dong, S.C.; Yang, Y.; Li, F.J.; Cheng, H.; Li, J.N.; Bilgaev, A.; Li, Z.H.; Li, Y. Influencing mechanism and policy suggestions of China-Mongolia-Russia high-speed railway construction. Acta Geogr. Sin. 2019, 74, 297–311. [Google Scholar]
- Baklanov, P.Y. Geosystems of Far East of Russia on Boundary of XX-XXI Century; Dalnauka: Vladivostok, Russia, 2008. [Google Scholar]
- Baklanov, P.Y. Pacific Russia: Pages of Past, Present, and Future; Dalnauka: Vladivostok, Russia, 2012. [Google Scholar]
- Sazonov, S.L. The role of transport in development of China. Asia Afr. Today 2015, 1, 20–24. [Google Scholar]
- Sub, B.H. China’s one Belt and one Road Initiative and China-Russia Cooperation: Focusing on transportation logistics cooperation in the China’s Northeast and the Russia’s Far East. Small and Medium Stud. 2019, 42, 293–324. [Google Scholar]
- Ding, S.B.; Wang, R.C. Study on trans -boundary corridors and their contributions to regional environment in Tumen River Area. J. Northeast Norm. Univ. 2002, 3, 113–120. [Google Scholar]
- Guo, L.C.; Zhou, Y.; Ma, B. Transportation network and spatial economic linkages of urban agglomeration between Northeast China and the Russian Far East. Northeast Asia Forum 2017, 26, 72–83, 128. [Google Scholar]
- Liu, Q.C.; Qi, X. On the regional development strategic connectivity and cooperation between Northeast China and the Far East of Russia under the framework of Belt and Road Initiative. Northeast Asia Forum 2018, 2, 34–52. [Google Scholar]
- Li, X. Russian’s “One Belt and One Road”: Unified Eurasian Conception. Sib. Stud. 2018, 45, 5–12, 93. [Google Scholar]
- MOC. Sino Russian Cooperation and Development Plan in the Far East of Russia (2018–2024). Available online: http://www.mofcom.gov.cn/article/guihua/201811/20181102807004.shtml (accessed on 11 February 2020).
- Chu, N.C.; Zhang, P.Y.; Li, H. High-speed rail impact on regional accessibility and its spatial effects: A case study of the Blagoveshchensk-Vladivostok railway. Prog. Geogr. 2019, 38, 988–997. [Google Scholar]
- Jin, F.J.; Chen, Z. Evolution of transportation in China since reform and opening up: Patterns and principles. J. Geogr. Sci. 2019, 29, 1731–1757. [Google Scholar] [CrossRef]
- Niu, F.; Wang, F.; Chen, M. Modelling urban spatial impacts of land-use/ transport policies. J. Geogr. Sci. 2019, 29, 197–212. [Google Scholar] [CrossRef]
- Cui, X.; Fang, C.; Wang, Z.; Bao, C. Spatial relationship of high-speed transportation construction and land-use efficiency and its mechanism: Case study of Shandong Peninsula urban agglomeration. J. Geogr. Sci. 2019, 29, 549–562. [Google Scholar] [CrossRef]
- Dong, S.C.; Cheng, H.; Guo, P.; Li, F.J.; Li, Y.; Li, Z.H.; Zhang, X.X. Transportation Industry Patterns and Strategy of the Belt and Road. Bull. Chin. Acad. Sci. 2016, 31, 663–670. [Google Scholar]
- Yang, C.W.; Li, Z.H.; Guo, X.Y.; Yu, W.Y.; Jin, J.; Zhu, L. Application of BP neural network model in risk evaluation of railway construction. Complexity 2019. [Google Scholar] [CrossRef]
- Jin, J.; Li, Z.H.; Zhu, L.; Tong, X.H.; Yang, C.W. Application of BP neural network in risk evaluation of railway construction. J. Railw. Eng. Soc. 2019, 3, 103–109. [Google Scholar]
- Liu, G.P.; Chen, L.W.; Zhao, W.Z. Evaluation index system of highway construction project investment risk. Constr. Econ. 2015, 36, 43–46. [Google Scholar]
- Benítez-López, A.; Alkemade, R.; Verweij, P.A. The Impacts of Roads and other Infrastructure on mammal and bird population: A meta-analysis. Biol. Conserv. 2010, 143, 1307–1316. [Google Scholar] [CrossRef]
- Beyer, H.L.; Ung, R.; Murray, D.L.; Fortin, M.J. Functional Response, Seasonal Variation and Thresholds in Behavioral Response of Moose to Road Density. J. Appl. Ecol. 2013, 50, 286–294. [Google Scholar] [CrossRef]
- Kociolek, A.V.; Clevenger, A.P.; St. Clair, C.C.; Proppe, D.S. Effect of Road Network on Bird Population. Conserv. Biol. 2011, 25, 241–249. [Google Scholar]
- Wang, Y.Y. The Environmental Issues and Cooperation of Green Development in Building China-Mongolia-Russia Economic Corridor. J. Northeast Asia Stud. 2019, 3, 69–80. [Google Scholar]
- Dong, S.C. International Scientific Investigation Supports Green Silk Road Construction. Available online: http://www.rmhb.com.cn/zt/ydyl/201909/t20190903_800177510.html (accessed on 12 November 2020).
- Zhang, Y. Dong Suocheng: Scientist of the Green Construction of the “B&R”. Bulletin of Chinese Academy of Sciences, 2018–12-08. Available online: https://mp.weixin.qq.com/s/WyXAOk9on-8U97ysiyWNyw (accessed on 12 November 2020).
- Information Agency Invest Infra of Russia (IAII). The Ministry of Transport of Russia Considered the Cost of Construction and Reconstruction of a Kilometer of Public Roads. Available online: https://investinfra.ru/novosti/mintrans-rossii-poschital-stoimost-stroitelstva-i-rekonstrukcii-kilometra-avtomobilnyh-dorog-obschego-polzovaniya.html (accessed on 21 March 2020).
- Railway Special Project (RSP). Design, Construction and Repair Railway Company. The Cost of Construction of 1 km of the Railway in 2019. Available online: https://xn--d1abbab2adzbibjdkw2d.xn--p1ai/stoimost-stroitelstva-1km-zd-puti (accessed on 21 March 2020).
- Development Concept of Primorsky No. 1 and Primorsky No. 2 International Transport Corridor. Available online: http://static.government.ru/media/files/jqfm5NlYLGTTVhUn3AKqOAg9mJcb2Yxx.pdf (accessed on 15 February 2020).
- Primorsky Statistical Yearbook 2018. Available online: https://primstat.gks.ru/ (accessed on 31 January 2020).
- European Space Agency: Landcover Climate Change Initiative. Available online: http://maps.elie.ucl.ac.be/CCI/viewer/download.php (accessed on 2 March 2020).
- Xiao, J.H.; Yao, Z.Y.; Qu, J.J. Influence of Golmud-Lhasa section of Qinghai-Tibet railway on blown sand transport. Chin. Geogr. Sci. 2015, 25, 39–50. [Google Scholar] [CrossRef]
- Zhang, R.S.; Pu, L.J.; Zhu, M. Impacts of transportation arteries on land use patterns in urban rural fringe: A comparative gradient analysis of Qixia district, Nanjing City, China. Chin. Geogr. Sci. 2013, 23, 378–388. [Google Scholar] [CrossRef]
- Popp, J.N.; Boyle, S.P. Railway ecology: Underrepresented in science? Basic Appl. Ecol. 2017, 19, 84–93. [Google Scholar] [CrossRef]
- Li, F.J.; Liu, Q.; Dong, S.C.; Cheng, H.; Li, Y.; Yang, Y.; Tsydypov, B.; Bilgaev, A.; Ayurzhanaev, A.; Bu, X.Y.; et al. Investment Environment Assessment and Strategic Policy for Subjects of Federation in Russia. Chin. Geogr. Sci. 2019, 29, 887–904. [Google Scholar] [CrossRef]
- Dong, S.C.; Zheng, J.; Li, Y.; Li, Z.H.; Li, F.J.; Jin, L.; Yang, Y.; Bilgaev, A. Quantitative Analysis of the Coupling Coordination Degree Between Urbanization and Eco-environment in Mongolia. Chin. Geogr. Sci. 2019, 29, 861–871. [Google Scholar] [CrossRef]
- Shi, B.F.; Yang, H.F.; Wang, J.; Zhao, J.X. City Green Economy Evaluation: Empirical Evidence from 15 Sub-Provincial Cities in China. Sustainability 2016, 8, 551. [Google Scholar] [CrossRef]
- Shi, Y.F.; Ge, X.H.; Yuan, X.L.; Wang, Q.S.; Kellett, J.; Li, F.Q.; Ba, K.M. An Integrated Indicator System and Evaluation Model for Regional Sustainable Development. Sustainability 2019, 11, 2183. [Google Scholar] [CrossRef]
- Lin, W.X.; Hong, C.Q.; Zhou, Y.K. Multi-Scale Evaluation of Suzhou City’s Sustainable Development Level Based on the Sustainable Development Goals Framework. Sustainability 2020, 12, 976. [Google Scholar] [CrossRef]
- Gorchakov, V.V.; Popov, Y.U. Atlas of Primorsky Krai; PrimorAGP: Vladivostok, Russia, 2008. [Google Scholar]
- Adzhiev, A.H.; Bartalev, S.A.; Bekkiev, M.Y. Ecological Atlas of Russia; Feoriya: Moscow, Russia, 2017. [Google Scholar]
- Song, S.B.; Cai, H.J.; Xu, L.F. Indicators system for region sustainable water resources utilization and its assessing methods. Adv. Water Sci. 2003, 14, 647–652. [Google Scholar]
- Chen, Y.T.; Chen, G.H.; Li, M.J. Classification and research advancement of comprehensive evaluation methods. J. Manag. Sci. China 2004, 7, 69–79. [Google Scholar]
- Peng, Z.L.; Zhang, Q.; Yang, S.L. Overview of comprehensive evaluation theory and methodology. Chin. J. Manag. Sci. 2015, 23, 245–256. [Google Scholar]
- Wang, F.X.; Mao, A.H.; Li, H.L.; Jia, M.L. Quality Measurement and Regional Difference of Urbanization in Shandong Province Based on the Entropy Method. Sci. Geogr. Sin. 2013, 33, 1323–1329. [Google Scholar]
- Ma, Y.M.; Wu, Y.M.; Wu, B.J. Comprehensive Evaluation of Sustainable Urban Development of Yangtze River Delta Based on Entropy Method and Quadrant Method. Econ. Geogr. 2015, 35, 47–53. [Google Scholar]
- Chen, Q.Q.; Zhang, J.B.; Zhang, L. Risk Assessment, Partition and Economic Loss Estimation of Rice Production in China. Sustainability 2015, 7, 563–583. [Google Scholar] [CrossRef]
- Xiao, Q.; Wan, S.S.; Lu, F.C.; Li, S. Risk Assessment for Engagement in Sharing Economy of Manufacturing Enterprises: A Matter–Element Extension Based Approach. Sustainability 2019, 11, 4774. [Google Scholar] [CrossRef]
- Cheng, W.; Yin, H. A study on Russian industrial mix evolution. Russ. East Eur. Cent. Asian Stud. 2009, 1, 37–43. [Google Scholar]
- The People’s Daily. Russia Has Issued the Free Distribution Act of Russian Far East Land. Available online: http://www.xinhuanet.com/politics/2016-05/04/c_128954095.htm (accessed on 21 March 2020).
- City Strategy. Strategies for Socio—Economic Development in the Russian Far East and Baikal Region before 2025. 28 December 2009. Available online: http://www.city-strategy.ru/UserFiles/Files/Strategy%20DVFO_2025.pdf (accessed on 21 March 2020).
- MOC. Socio—Economic Development Planning in the Far East and Baikal Region of Russia. 4 December 2013. Available online: http://www.mofcom.gov.cn/article/i/dxfw/jlyd/201312/20131200411864.shtml (accessed on 21 March 2020).
- Ministry for the Development of the Russian Far East. Conception on the Development of Border Areas in the Russian Far East Federal Region and the Baikal Region. Available online: https://minvr.ru/activity/kompleksnoe-razvitie-territoriy/razvitie-prigranichnykh-territoriy/# (accessed on 21 March 2020).
- Abramov, A.L.; Diaghilev, A.A.; Kuznetsova, G.D.; Melamed, I. Social and Economic Situation and Prospects for the Development of Primorsky Krai for the Period up to 2024 (Part I). Cust. Policy Russia Far East 2018, 2, 25–46. [Google Scholar] [CrossRef]
- Vladivostok Free Port Policy. Available online: http://world.people.com.cn/n/2015/0915/c157278-27586965.html (accessed on 21 March 2020).


| Indices | Authors (Years) |
|---|---|
| GDP, GDP per capita, growth rate of GDP, population density, growth rate of population, tourism resources, energy resources, mineral resources, educational resources; | Dong et al. (2018) [10] |
| Income, investment in fixed assets, foreign direct investment, industrial structure, total population, population density, natural population growth rate, unemployment rate, amount of beds per 10,000 persons in hospital, amount of doctors for 10,000 people, amount of scientific researchers, land resources, forest resources, coal resources; | Li et al. (2019) [43] |
| GDP per capita, population density, percentage of urban population, number of vehicles per 10,000 people, number of general education schools; | Dong et al. (2019) [44] |
| GDP, GDP per capita, annual growth rate of GDP, census register population, natural population growth rate, registered unemployment rate in cities and towns, forest coverage rate, coverage rate of green area in completed construction area, public green space per capita; | Shi et al. (2016) [45] |
| GDP per capita, total fixed assets investment per capita, industrial stucture, growth rate of GDP, population density, population growth rate, urbanization rate, disposable income of urban residents per capita, living area per capita in urban, registered urban unemployment rate, number of hospital beds per thousand persons, forest coverage rate; | Shi et al. (2019) [46] |
| Amount of foreign direct investment, annual GDP growth rate, population growth rate, the number of health technicians per 1000 permanent residents, the number of institutional beds for every 1000 elderly people, higher education enrollment rate, water consumption per 10,000 USD of GDP, standard coal consumption per 10,000 USD of GDP | Lin et al. (2020) [47] |
| Indices | Detailed Indices | Authors (Years) |
|---|---|---|
| Transport infrastructure-related indices | Railway network density; | Dong et al. (2018) [10] |
| Railway density, highway density, freight, freight turnover, passenger capacity, passenger turnover; | Li et al. (2019) [43] | |
| Number of urban public transport vehicles for every million persons; | Shi et al. (2019) [46] | |
| Policy-related indices | government and residential support | Dong et al. (2018) [10] |
| 16 related policies and plans were analyzed to reflect policy support in research regions | Li et al. (2019) [43] | |
| Eco-environmental indices | Forest coverage rate, number of natural reserves, biodiversity; | Dong et al. (2018) [10] |
| Nitrogen dioxide content in air, industrial soot emissions, emission reduction of main pollutants SO2, urban wastewater discharge; | Shi et al. (2016) [45] | |
| Annual precipitation, number of rivers, number of lakes, sown areas per capita, forest harvest volume per capita; | Dong et al. (2019) [44] | |
| Ammonia–nitrogen emissions per unit GDP, COD emissions per unit GDP, SO2 emissions per unit GDP, NOx emissions per unit GDP, soot emissions per unit GDP, industrial solid waste emissions per unit GDP, area of public park per capita, coverage rate of green area in built-up areas, proportion of natural reserve area to total land area; | Shi et al. (2019) [46] | |
| Water surface rate, proportion of hazardous waste treatment, proportion of non-fossil energy consumption to primary energy consumption, the proportion of days when PM2.5 reached the standard in towns, and the annual decline rate of greenhouse gas emissions; | Lin et al. (2020) [47] | |
| Disaster-related indices | Area of forest fire, number of geologic hazards. | Dong et al. (2018) [10] |
| First-Level Indices | Second-Level Indices | Third-Level Indices (Unit) |
|---|---|---|
| Economic risk | Economic development (−) | 1. Income of municipal budgets (million USD) (−) 2. Average monthly income from working (USD) (−) 3. Investment in fixed capital (million USD) (−) 4. Foreign investments in fixed assets (million USD) (−) 5. Joint investments in fixed assets (million USD) (−) 6. Total fixed assets (million USD) (−) 7. Industrial production (million USD) (−) 8. The proportion of agriculture (%) (−) 9. The proportion of industry (%) (−) 10. The proportion of tertiary industry (%) (−) |
| Resource endowment (−) | 11. Healing mud (−) 12. Gold (−) 13. Brown coal (−) 14. Ge (−) 15. Stone coal (−) 16. Total population (person) (−) 17. Natural increase of population (person) (−) 18. Percentage of the elderly (%) (+) 19. Percentage of the young (%) (−) 20. Percentage of the working (%) (−) 21. Percentage of total pensioners (%) (+) 22. Income of pensioners (ruble) (−) 23. Percentage of migrants of the total population (‰) (−) 24. Urbanization rate (%) (−) | |
| Living standard (−) | 25. Percentage of unemployed persons registered in the state employment service (%) (+) 26. Average number of employees (%) (−) 27. Number of crimes per 10,000 people (person) (+) 28. Number of beds per 10,000 people (person) (−) 29. Number of people per bed (person) (+) 30. Number of doctors per 10,000 people (person) (−) 31. Number of sports facilities per 10,000 people (number) (−) 32. Number of hotels per 10,000 people (number) (−) 33. Residential area per capita (m2) (−) | |
| Transport infrastructure-related risk | Road network (−) | 34. Length of all roads (for cars) (km) (−); 35. Density of roads (km/km2) (−) |
| Transported freight (−) | 36. Amount of transported goods (thousand tons) (−) 37. Annual increase of transported goods in 2017 (%) (−) 38. Annual increase of cargo turnover in 2017 (%) (−) | |
| Policy-related risk | Policies and plans (−) | 39. Sino-Russian Cooperative Development Plan in the Far East of Russia (2018–2024) (−) 40. Memorandum of Understanding on the Joint Development of the Primorsky No. 1 and No. 2 International Transport Corridors (−) 41. Free Distribution Act of Russian Far East Land (−) 42. Socio-Economic Development Strategy of Russian Far East 43. National Planning of the Russian Federation for Social and Economic Development in the Far East and Baikal Region (−) 44. Outline for the Development of Russia’s Far East Border Region from 2015 to 2025 (−) 45. Vladivostok Agglomeration Development Project (−) 46. Nakhodka Transport Hub (−) 47. Russia’s Advanced Socio-Economic Development Zone (−) 48. East Economic Forum (−) |
| Eco-environmental risk | Ecology (−) | 49. Percentage of agriculture land (%) (−) 50. Percentage of forest (%) (−) 51. Percentage of grassland (%) (−) 52. Percentage of wetland (%) (−) 53. Precipitation (mm) (−) 54. Flow of surface water (liter/second/km2) (−) 55. Number of natural reserves (−) 56. Number of national parks (−) 57. Number of species of rare animals (−) 58. Number of species of rare plants (−) |
| Emissions of pollutants (+) | 59. Emissions of pollutants into the atmosphere in cities and districts (thousand tons) (+) 60. Emissions of pollutions without clearing (thousand tons) (+) 61. Discharge of solid (thousand tons) (+) 62. Emissions of gaseous and liquid (thousand tons) (+) 63. Emissions of sulfur dioxide (thousand tons) (+) 64. Emissions of carbon oxide (thousand tons) (+) 65. Emissions of nitrogen oxide (thousand tons) (+) 66. Emissions of hydrocarbons (thousand tons) (+) 67. The increase and reduction in emissions (thousand tons) (+) | |
| Disaster-related risk | Grades of disasters (+) | 68. Earthquake grade (+) 69. Landslide grade (+) 70. Tsunami (wave height: m) (+) 71. Tsunami (wave length: m) (+) 72. Gully erosion grade (+) 73. Flood grade (+) |
| Research Regions | ER | TR | PR | EER | DR | CR |
|---|---|---|---|---|---|---|
| Artem | 0.255 | 0.076 | 0.006 | 0.075 | 0.034 | 0.445 |
| Vladivostok | 0.141 | 0.030 | 0.000 | 0.155 | 0.082 | 0.408 |
| Nakhodka | 0.273 | 0.059 | 0.000 | 0.117 | 0.074 | 0.524 |
| Ussuriyskiy | 0.242 | 0.067 | 0.017 | 0.119 | 0.034 | 0.479 |
| Nadezhdinskiy | 0.365 | 0.080 | 0.000 | 0.204 | 0.045 | 0.695 |
| Oktyabr | 0.346 | 0.075 | 0.017 | 0.174 | 0.033 | 0.645 |
| Pogranichnyy | 0.285 | 0.077 | 0.017 | 0.189 | 0.042 | 0.609 |
| Khasanskiy | 0.272 | 0.049 | 0.017 | 0.249 | 0.060 | 0.647 |
| Shkotovskiy | 0.320 | 0.075 | 0.011 | 0.182 | 0.043 | 0.631 |
| Flood Grade | Landslide Grade | Tsunami (Wave Height/Wave Length) | Earthquake Grade | Gully Erosion Grade | |
|---|---|---|---|---|---|
| Artem | Extremely dangerous | 7–8 | - | - | Very low |
| Vladivostok | Extremely dangerous | 7–8 | 2.5/200 | 6–7 | Very low |
| Nakhodka | Extremely dangerous | 8 | 3/100 | 7–8 | Very low |
| Ussuriyskiy | Extremely dangerous | 7–8 | - | - | Very low |
| Nadezhdinskiy | Extremely dangerous | 7–8 | - | - | Medium |
| Oktyabr | Extremely dangerous | 6 | - | - | Medium |
| Pogranichnyy | Very dangerous, | 7 | - | 7–8 | Medium |
| Khasanskiy | Extremely dangerous | 7–8 | - | 6–7 | Medium |
| Shkotovskiy | Extremely dangerous | 7–8 | - | 6–7 | - |
Publisher’s Note: MDPI stays neutral with regard to jurisdictional claims in published maps and institutional affiliations. |
© 2021 by the authors. Licensee MDPI, Basel, Switzerland. This article is an open access article distributed under the terms and conditions of the Creative Commons Attribution (CC BY) license (http://creativecommons.org/licenses/by/4.0/).
Share and Cite
Yang, Y.; Dong, S.; Boldanov, T.; Li, F.; Cheng, H.; Liu, Q.; Li, Y.; Li, Z. Construction of the Primorsky No. 1 and No. 2 International Transport Corridors: Risk Evaluation and Mitigation Policies. Sustainability 2021, 13, 2120. https://doi.org/10.3390/su13042120
Yang Y, Dong S, Boldanov T, Li F, Cheng H, Liu Q, Li Y, Li Z. Construction of the Primorsky No. 1 and No. 2 International Transport Corridors: Risk Evaluation and Mitigation Policies. Sustainability. 2021; 13(4):2120. https://doi.org/10.3390/su13042120
Chicago/Turabian StyleYang, Yang, Suocheng Dong, Tamir Boldanov, Fujia Li, Hao Cheng, Qian Liu, Yu Li, and Zehong Li. 2021. "Construction of the Primorsky No. 1 and No. 2 International Transport Corridors: Risk Evaluation and Mitigation Policies" Sustainability 13, no. 4: 2120. https://doi.org/10.3390/su13042120
APA StyleYang, Y., Dong, S., Boldanov, T., Li, F., Cheng, H., Liu, Q., Li, Y., & Li, Z. (2021). Construction of the Primorsky No. 1 and No. 2 International Transport Corridors: Risk Evaluation and Mitigation Policies. Sustainability, 13(4), 2120. https://doi.org/10.3390/su13042120