Article

Investigation of Dye Removal Capability of Blast Furnace Slag in Wastewater Treatment

Department of Earth and Environmental Sciences, Faculty of Science and Engineering, Macquarie University, Sydney, NSW 2109, Australia
*
Author to whom correspondence should be addressed.
Sustainability 2021, 13(4), 1970; https://doi.org/10.3390/su13041970
Submission received: 12 January 2021 / Revised: 4 February 2021 / Accepted: 5 February 2021 / Published: 11 February 2021
(This article belongs to the Section Sustainable Engineering and Science)

Abstract

:
Blast Furnace Slag (BFS) is a by-product of the iron ore processing industry with potential to be used in different industrial applications. In this research, BFS was used to examine its ability for dye removal from wastewater. The efficiency of two types of BFS samples for removal of cationic methylene blue (MB) and acidic methyl orange (MO) dyes was investigated and results found that the optimal conditions for treatment of wastewater were 80 g/L of adsorbent dose and 1 h of treatment time for both dyes. BFS was found to be more effective for removal of the acidic MO dye than the cationic MB dye. Under shorter residence times, the results showed reverse trends with BFS samples removing higher concentrations of MB than MO. The BFS chemistry had additional impacts on the efficiency of dye removal. Higher basicity of BFS had lower dye removal ability for adsorption of acidic dye when applied at smaller concentrations, while for cationic dye when applied at higher concentrations. The results showed that BFS has potential role for pre-treatment of industrial wastewater contaminated with dyes and may contribute to reduced use of more expensive adsorbents, such as activated carbons.

1. Introduction

Blast Furnace Slag (BFS) is a by-product of the blast furnace ironmaking process produced in significant amounts of around 175–225 Mt per year worldwide [1,2]. BFS consists of the inorganic nonferrous fractions of the raw materials used in ironmaking (iron ore, coal/coke and fluxes, including limestone), that remain after the extraction of the iron from the ore [3,4]. Calcium and silica oxides are the main chemical components in BFS along with other oxides, such as Al2O3 and MgO, and other metallic elements, such as Fe, Ti and Mn [1,5,6]. The chemical composition of BFS varies with the grade of iron ore and the fluxes used in smelting [4], while its structural phase is influenced by the slag cooling rate [7]. BFS currently is mainly considered in cement production and for civil engineering works [8,9]. BFS has been also considered for adsorption of contaminants from wastewater, such as phosphates [10] and metal ions [4] and it has been found that it can be successfully applied for industrial wastewater treatment. Industrial wastewater also contains dyes with varying properties, where BFS can have additional applications.
Dyes are chemical compounds attached to the surface of fabric to change their colour [11]. The dyeing mechanism involves adsorption of the dye onto the fibre surface and diffusion of the dye into the internal parts of the fibre [12]. Many industries, such as textile, paper, leather, food and cosmetic, use dyes to colour their products [13]. There are more than 100,000 commercial dyes on the market, mainly synthetic, produced at a rate of more than 700 kt/year [11]. For instance, the textile industry alone utilises about 10,000 tonnes of dyes per year, with about 100 tonnes discharged to the water streams [11]. Approximately 10–15% of the amount of dyes used by industries is estimated to be discharged to the water systems without any appropriate treatment [4]. Synthetic dyes have a complex molecular structure that, when discharged in the wastewater, makes them stable with slow biodegradation rates [12,13].
Some dyes are carcinogenic and mutagenic and can cause severe damage to health by allergy, dermatitis, skin irritation, cancer and mutations, as well as causing dysfunction of the kidney, reproductive system, liver, brain and central nervous system [12,14,15,16]. Coloured wastewater is also toxic for aquatic biota because it destroys the natural equilibrium of the ecosystem [16]. The visually detectible dyes reduce photosynthesis by preventing the penetration of light [12,16,17]. Furthermore, metals and chlorine may have a toxic effect on some forms of aquatic life [12,17]. Dyes used by industries are mostly stable to light, oxidation and aerobic digestion [18].
There are two general types of dyes, i.e., acid dyes containing anionic functional groups, and basic dyes which contain cationic functional groups [17]. Acid dyes contain carboxyl, hydroxyl and sulfuric groups [19]. Basic dyes have high tinctorial values, and concentrations as low as 1 mg/L can cause distinct coloration [17]. Basic dyes, such as methylene blue (MB), strongly attach themselves onto solids and are most commonly used for dyeing cotton, wool and silk and cause allergic dermatitis, irritation and mutation [20,21].
Activated carbon is one of the conventional adsorbents used for dye removal in wastewater. However, many studies advocate for the use of cheaper and more commercially available materials to replace activated carbons [18]. The surface area and porosity of the adsorbent are essential factors for the efficiency of dye removal. Previous studies used different alternative inorganic materials to remove dyes from wastewater, such as natural zeolite to remove methylene blue from an aqueous solution, or magnetic nanoparticles (γ-Fe2O3) to remove dyes from synthetic and textile wastewater [4,22]. The structure of γ-Fe2O3 is close to magnetite (Fe3O4) with the difference being the presence of iron vacancies. Wang et al. [4] used slag to remove the reactive brilliant red, which is a type of stable azo dye. The adsorption efficiency was found to decrease when the pH was increased from 2 to 12. On the other hand, the dye removal rate increased with an increase in contact time, temperature and initial dye concentration [23]. In another study, BFS was treated and synthesised into three materials comprising BFS micro powder, BFS acidified solid and BFS acid-alkali precipitate to investigate their efficiency for methyl orange (MO) dye removal [5]. Results indicated that the BFS acid-alkali precipitate has better removal ability and when the pH was in the range of 3–13, the removal efficiency of the solution with a dye concentration of 25 mg/L reached 99.97% in 25 min at room temperature.
Previous studies investigated the ability of BFS to remove dye from wastewater and found the optimum reaction conditions and pre-treatment required to enhance dye removal ability. However, the impact of the slag basicity (CaO/SiO2) on dye removal ability has not been studied in the past. This information is important because if the slag properties and basicity influence the adsorption capacity then the BFS formation and chemistry can be engineered at the ironmaking stage through modification of the fluxes used for the cleaning of the iron and adjusting the cooling phase of the blast furnace slag to influence most desired properties for its further reuse. Additionally, the effect of types of dye (acidic or basic dye) on removal reactions when BFS is used has not been investigated in the past. The aim of this work was to study the effects of the chemical content and basicity of BFS on the removal of dye in the wastewater and compare the performance of BFS for treating acidic and basic dyes.

2. Materials and Methods

2.1. Materials

The BFS samples used in this study originated from two ironmaking blast furnace (BF) plants in China. The samples were first ground to powder with a particle size of 0.05–0.1 mm by a standard ring mill batch pulveriser. The SEM imaging of the powder sample R is exhibited in Figure 1. The standard chemical analysis of the samples was conducted with X-ray fluorescence spectroscopy, as shown in Table 1 wherein the slag basicity defined by the CaO/SiO2 ratio was also calculated.
In this study, the methylene blue solution (MB) was used as a cationic dye (basic dye), and the methyl orange solution (MO) was used as an anionic dye (acid dye). The synthetic wastewater in this study was prepared by diluting the basic and acid dyes with distilled water with different concentrations of dyes (60, 100, 150, 200, 250 and 300 mg/L).

2.2. Methods

2.2.1. Batch Experiment

The capacity for dye removal by BFS was demonstrated in a batch experiment. The pH of the BFS samples was determined by dispersing the BFS at 1:5 (w/v) with deionised water followed by shaking for 24 h. Different variables were considered to determine the optimum conditions to remove the dye from wastewater, such as the adsorbent dose, contact time and adsorbate dose in optimisation test design adopted from Gao et al. [5]. All experiments were conducted at room temperature.

Adsorbent Dose

The adsorbent dose (BFS concentration) in the range of 20–100 g/L was applied to determine the optimum concentration of BFS for dye removal. The dye concentration was kept constant in all liquid samples at 60 mg/L to monitor the adsorbent dose for removing the highest amount of dye from wastewater. The samples were shaken for one hour at a speed of 30 rpm. The BFS was then separated from the liquid by 45 µm filter paper. The dye concentration after treatment with BFS was measured with UV-Vis spectrophotometry. One duplicate analysis was performed to validate the reproducibility of the results.

Contact Time

To calculate the contact time required to remove the dye, different contact times of 10, 30, 60 and 120 min were applied. The optimum adsorbent dose for dye removal was used from the previous step, and the adsorbent and adsorbate doses were kept constant to confirm the effect of contact time. Dye concentration in the wastewater was 60 mg/L, and the BFS concentration was 80 g/L. The liquid samples were shaken for different contact times at the speed of 30 rpm, then the BFS was separated from the liquid by 45 µm filter paper. The dye concentration after the BFS contact effect was measured by UV-Vis spectrophotometry. One duplicate analysis was performed to validate the reproducibility of the results.

Adsorbate Dose

In this step, the dye concentration in the wastewater was changed from 60 mg/L to 300 mg/L. The optimum adsorbent dose determined in the first step was used to measure the optimum concentration of dye removed by the BFS samples. Samples with different dye concentrations were placed in a shaker at the speed of 30 rpm, and then the BFS was separated from the liquid with a 45 µm filter paper. The dye concentration after the BFS contact effect was measured with UV-Vis spectrophotometry. One duplicate analysis was performed to validate the reproducibility of the results.

2.2.2. Kinetic and Isotherm Modelling

The adsorption results were subjected to kinetic modelling to determine the rate of reaction. The pseudo second order of reaction was applied in this study using Equation (1):
t q t = 1 k s q e 2 + 1 q e t
where qt and qe are the amounts of dye adsorbed at time t and at equilibrium, while ks is the pseudo second order kinetic constant. The plots of 1/qt versus contact time (t) were drawn, and qe and ks were determined based on the slope and intercept of the curves, respectively, as described by Bhatnagar et al. [24].
The isotherm modelling was performed to determine the adsorbent efficacy. The equilibrium adsorption experiments were conducted at different dye concentrations in the range of 60–300 mg/L in the synthetic wastewater. The most widely used Langmuir model was adopted in this study with the corresponding isotherm equation expressed as:
C e q e = 1 K q m + 1 q m C e
where q e (mg/g), q m (mg/g), K (L/mg) and C e (mg/L) represent the adsorption capacity at equilibrium, the maximum adsorption capacity, the Langmuir bonding term related to interaction energies, and the solution concentration of the sorbate at equilibrium, respectively.

2.2.3. Fourier Transform Infrared (FTIR) Spectroscopy

FTIR was used to investigate the changes of functional groups of BFS samples when the samples were mixed with dye with concentrations of 60, 100, 150, 200, 250 and 300 mg/L in the synthetic wastewater. The dried BFS samples were then subjected to FTIR analysis using a Nicolet 6700 FTIR spectrometer through 32 scans with a resolution of 4 cm−1.

2.2.4. Scanning Electron Microscopy (SEM)

A Phenom-World SEM was used to determine changes in morphology and microstructure of the BFS samples caused by the adsorption process.

2.2.5. Energy Dispersive Spectroscopy (EDS)

Energy Dispersive Spectroscopy (EDS) is widely used for analysing the chemical content of samples [25]. Phenom-World EDS analysis was used to study the samples’ composition before and after the slag mixing with different concentrations of synthetic wastewater containing 60, 100, 150, 200, 250 and 300 mg/L of two different dyes. In this experiment, samples were analysed under high vacuum pressure at an accelerating voltage of 15 kV. Two areas were analysed for their chemical contents and the average value was reported.

2.2.6. X-ray Diffraction (XRD)

A Panalytical XPERT-PRO XRD system was used on powdered BFS samples to determine the crystalline phases of the samples. The anode material was copper and the scans were performed for the diffraction angle (2θ) of 5–90°.

3. Results

3.1. Batch Experiments

Batch experiments were used to determine the optimum conditions for the removal of dye from wastewater. All liquid samples had pH levels above 11 and produced alkaline conditions theoretically required for dye removal [26]. The batch experiments were therefore designed to determine the adsorbent dose, adsorbate dose and contact time.

3.1.1. Adsorbent Dose

The most effective adsorbent dose to remove dye from the synthetic wastewater was determined by changing the adsorbent dose while maintaining the remaining conditions constant. Table 2 presents the dye concentrations of wastewater after experiments with conditions of an initial dye concentration of 60 mg/L for both dyes, contact time of 1 h, and different BFS concentrations of 20, 40, 60, 80 and 100 g/L. When applying slag A and varying its dose from 20 to 80 g/L, the MB removal rate increased from 30.8% to 46.5% due to the increased amount of adsorbent. The removal rate then levelled off with further increasing the adsorbent dose to 100 g/L. Similar results were obtained in case of slag R for MB removal. The removal rate of MB (basic dye) by slag R (48.3%) was slightly higher than slag A (46.5%), which was ascribed to the lower basicity of R than A.
The same changing trends were observed for treatment of wastewater contaminated with MO with a starting removal rate of 23.6% and 27.9% at 20 g/L when slags A and R were applied, respectively. The maximum removal rate of 57.3% was achieved at 80 g/L for slag A, which was higher than slag R (52.9%). Both values were higher at 46.5% and 48.3% than those for slag A, which indicated that the MO could be removed by both slag samples more easily than MB.

3.1.2. Contact Time

Table 3 shows the dye removal capability of BFS at different contact times while the dye concentration was kept at 60 mg/L for both dyes and the BFS concentration was kept at the optimal value of 80 g/L obtained from the previous step. For both dyes, the removal rate increased with time and reached the highest value at 1 h, then levelled off, indicating that 1 h was the optimum contact time required for dye removal. For each dye, the removal rate varied significantly between the two different BFS samples. Sample A removed MB with a maximum efficiency of 47.0%, in comparison with sample R with a removal efficiency of 48.2%. In the case of the MO dye, sample A had higher removal capacity at 57% compared to 52.6% for sample R for the same period. One hour contact time was considered as suitable for further tests as the reaction was appropriately completed in this time. In a previous study by Wang et al. [4], the contact time of up to 2 h was used to remove dyes of active red X-3B and CTMAB by BFS. Most of the dyes were absorbed in the first 40 min and the adsorption reached equilibrium at 1 h. In another study by Gao et al. [5] different BFS materials of BFS micropowder (BFSMP), BFS acidified solid (BFSAS) and BFS acid-alkali precipitate (BFSAP) were compared for their MO adsorption performance. The contact time of 25 min was determined as the equilibrium time for adsorption and the removal rate was 99.8%, 85% and 4% for BFSAP, BFSAS and BFSMP, respectively at conditions of the initial MO concentration of 25 mg/L, pH 11, temperature of 25 °C and adsorbents dose of 0.1 g in 50 mL liquid.

3.1.3. Adsorbate Dose

In this step, the BFS concentration was maintained constant at 80 g/L at the optimum contact time of 1 h, while the dye concentration was changed from 60 to 300 ppm. The results are presented in Figure 2, showing the dye removal rate versus dye concentrations. The highest removal rate for MB was obtained at the starting dye concentration of 60 mg/L for both BFS samples. The MB removal rate decreased with increasing the dye concentration, probably due to the saturation of the adsorbent surface. On the contrary, the removal rate of MO was about 50–60% for both slag samples at 60 mg/L dye concentration and increased with the increase in the dye concentration from 60 to 200 mg/L then stayed almost steady from 200 to 300 mg/L. The highest dye removal rate for both slag samples was close to 90%. The two slags exhibited higher efficiency for MO removal compared to MB in the investigated range of dye concentration, which is consistent with the results in Table 2. Not much difference in the dye removal performance between the two slags was observed. The pH values of the solutions after the adsorption process at BFS dose of 80 g/L and 1 h contact time were also recorded, as shown in Table 4. MB had a pH of near 9, while the pH of MO was near 3. When increasing the dye concentration, the pH increased for MB and decreased in the case of MO. After adsorption at dye concentration of 100 ppm, the pH value increased due to the dissolution of basic material (mostly Ca) from slag into the solution. At higher concentrations of MB, the Ca dissolution became weaker due to the basic nature of MB while MO showed the opposite trend.

3.1.4. Kinetic and Isotherm Modelling

Table 5 presents the results of the pseudo second order kinetic modelling. The results showed good fit of the model with R2 between 0.969 and 0.998. The estimated amounts of dye adsorbed at equilibrium were determined to be higher for MO at 0.422 (sample R) and 0.496 mg/g (sample A) than those of MB at 0.361 and 0.354 mg/g for slags R and A, respectively. The reaction constant ks, however, showed reverse trend which was higher for MB removal than MO for both BFS samples.
The MB adsorption curves for slags A and B at equilibrium, as well as the isotherm modelling by the Langmuir model, are presented in Figure 3. For slag A, the adsorption capacity at equilibrium was about 1.5 mg/g while for slag B it was 1.2 mg/g. The modelling results showed good fit of the Langmuir model for both slags A and B. For slag A, K and qm were 0.00172 and 6.33 mg dye per g slag, while for slag R the values were 0.00762 and 2.05 mg dye per g slag, respectively. The calculated maximum capacity of MB adsorption by slag A (6.33 mg/L) was larger than slag R (2.05 mg/L), indicating that slag A is a better adsorbent for MB removal than slag R.

3.2. Fourier Transform Infrared (FTIR) Spectroscopy

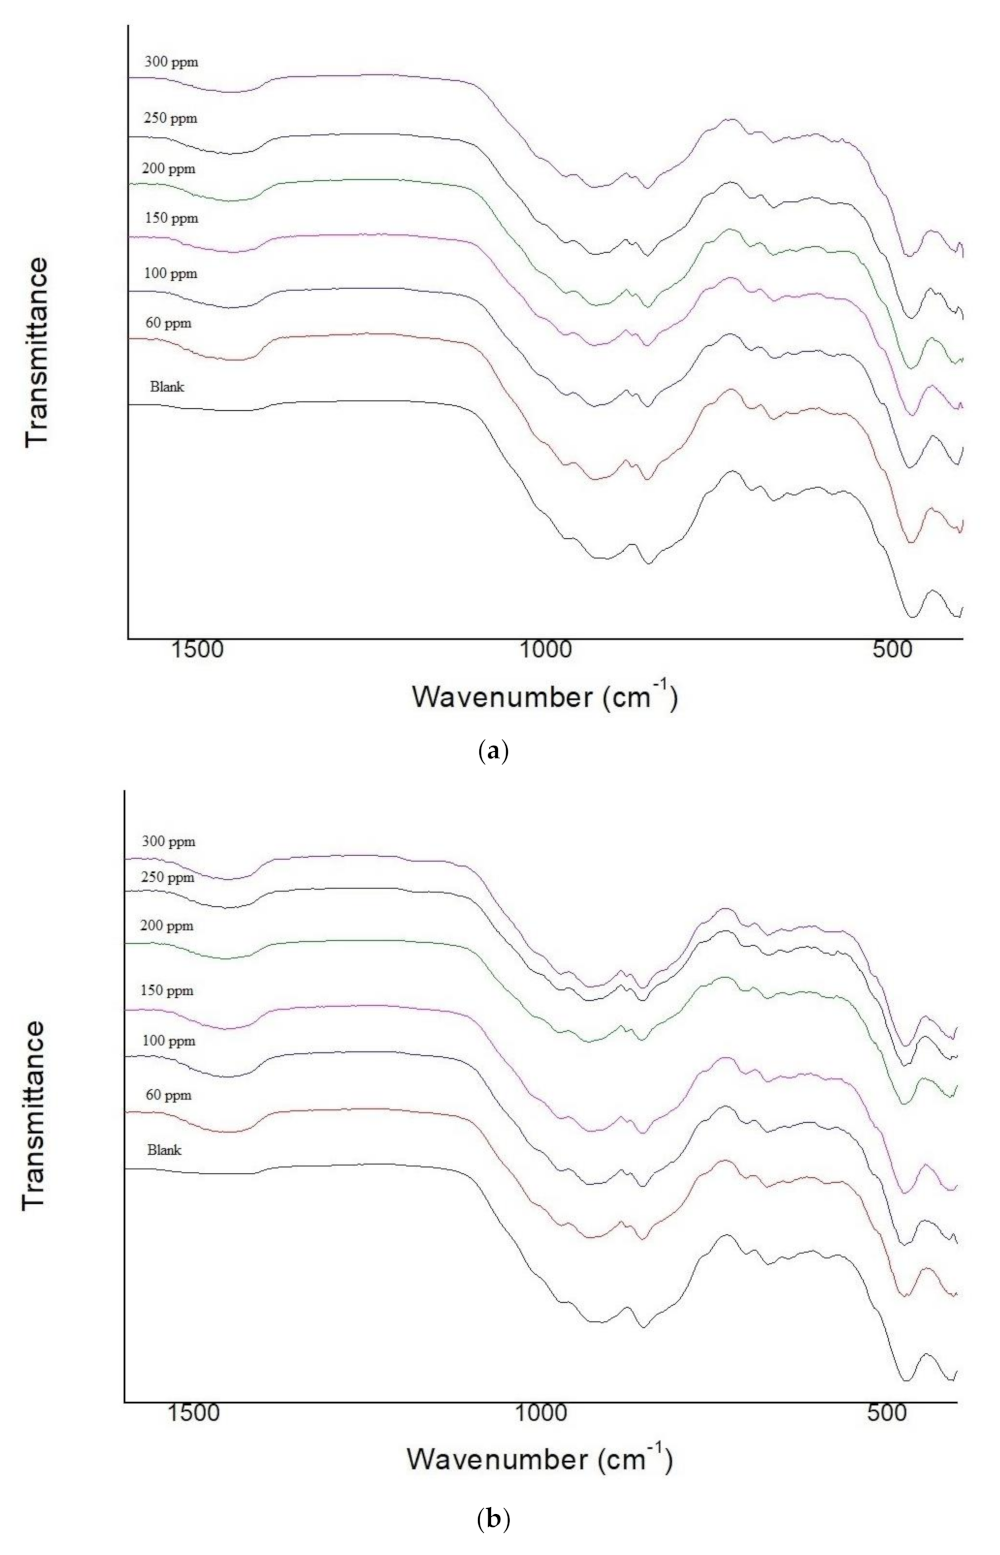
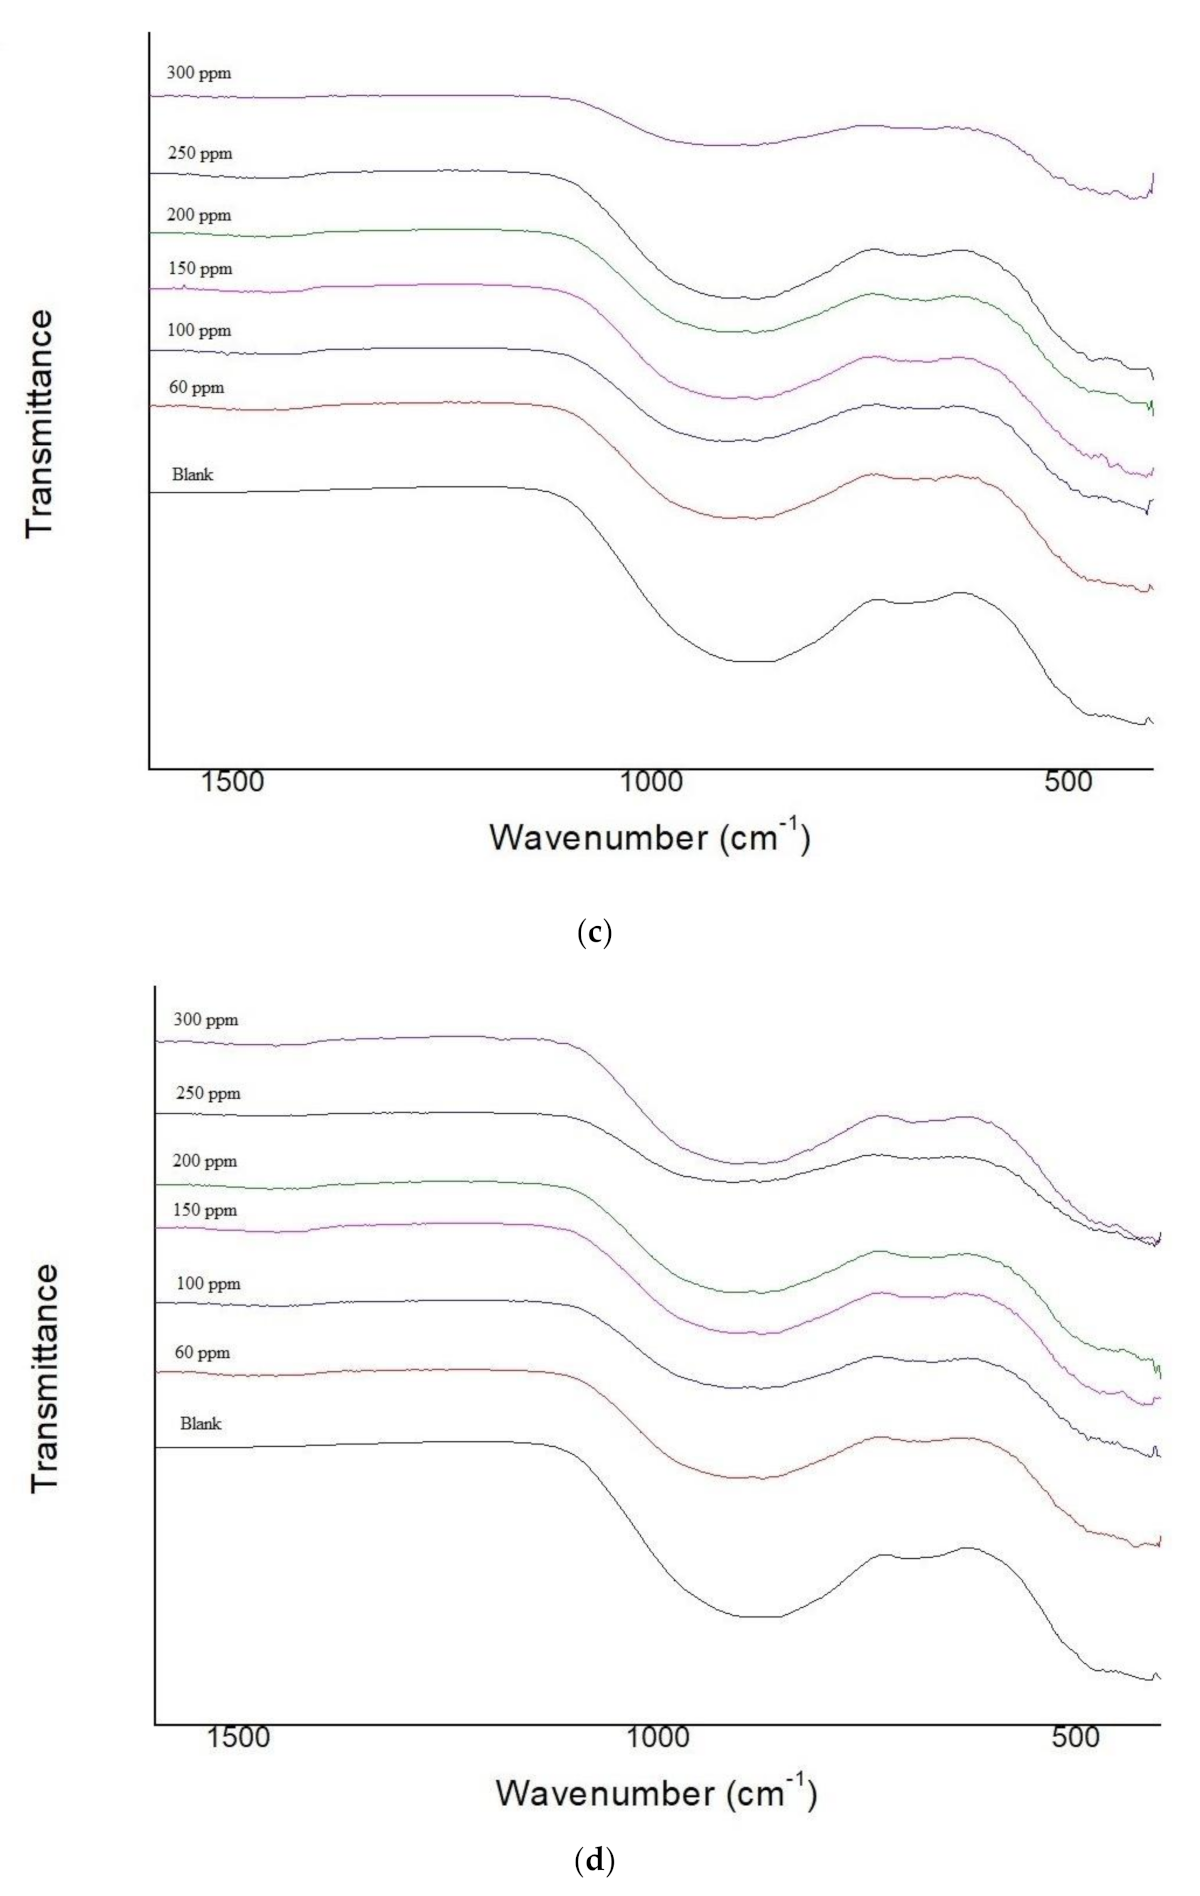
Figure 4 shows the FTIR spectra for the two BFS samples before and after adsorption at varying dye concentrations for wavenumbers in the range between 4000 and 400 cm−1. According to the spectra, sample A at 1500 cm−1 wavenumber showed changes after reacting with both dyes. In sample R, the wavenumber showed minor changes when compared to sample A. The band at 1611 cm−1 was associated with water bands and OH groups in the sample [27]. The peaks around 1450 cm−1 were related to the C-H bending of CH2 from the dyes. The peaks between 1560 and 1360 cm−1 were associated with the carbonate CO32− phase [28] and showed an increase in transmittance for the slag samples after wastewater treatment. The Si-O-Si (Al) vibration in sample R with the lower basicity (1.09) and the lower dye removal ability was reduced when compared to sample A (basicity of 1.12).

3.3. Scanning Electron Microscopy (SEM)

SEM analysis was undertaken to demonstrate the morphology changes between the slag samples before and after they were subjected to different types of dye. Figure 5 and Figure 6 show morphology changes of each sample under the conditions that demonstrated the best result for removing MB and MO. The SEM showed a compact morphology at the optimum adsorption conditions. In addition, the results demonstrated aggregated microparticles on the surface area of BFS (less than 1 µm) with a smaller mean particles size after the adsorption process. The generation of the microparticles are a result of the reaction between slag and dyes followed by the attachment of fine particles onto bigger ones.

3.4. Energy Dispersive Spectroscopy (EDS)

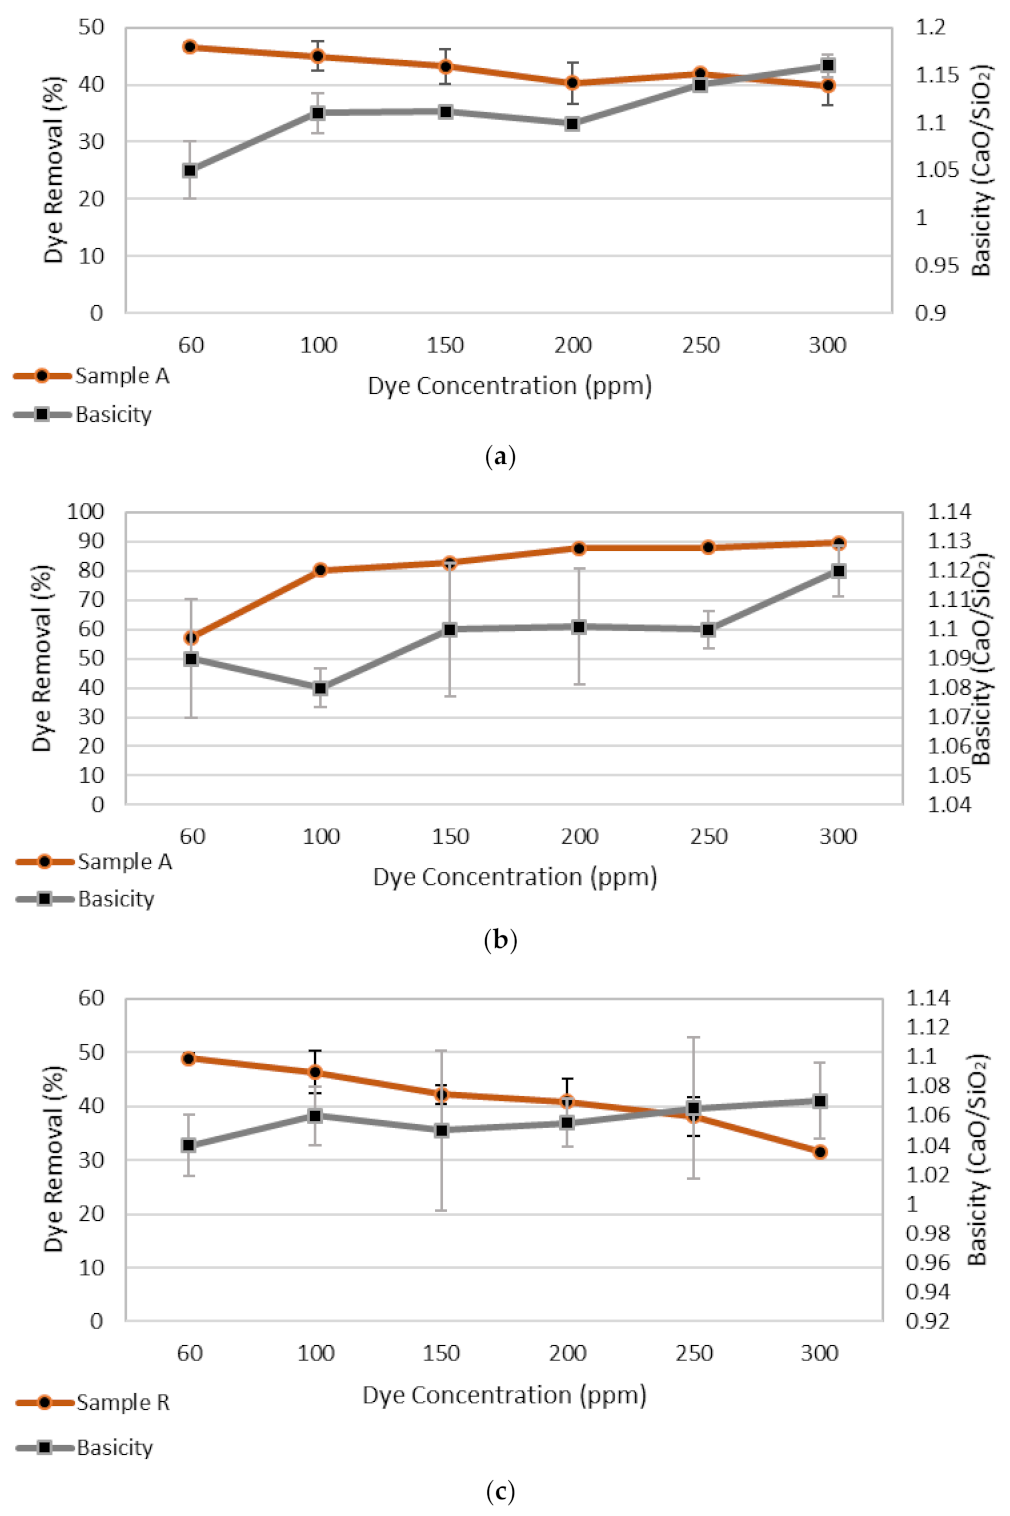
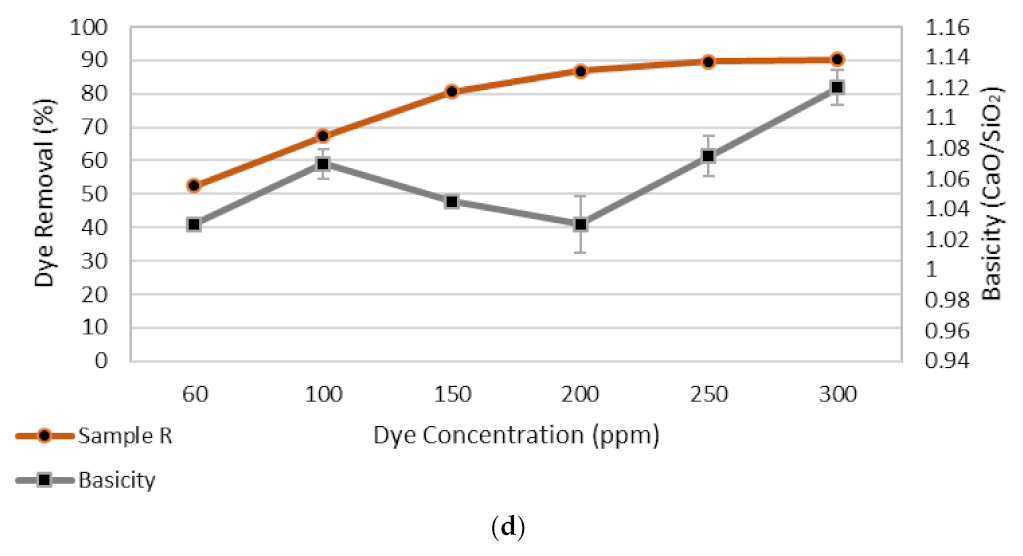
EDS analysis of the BFS samples after treatment with wastewater containing MB and MO at concentrations ranging between 60 mg/L and 300 mg/L showed significant changes in the chemical content and basicity. The ratio of CaO to SiO2, termed basicity, is critical to the slag characterisation as this ratio affects the form of crystallisation and viscosity of the molten slag [29]. According to the EDS data, the amount of SiO2 and CaO changed with an increase in the percentage of dye removal. The basicity (CaO/SiO2) of the samples is presented in Figure 7, which was determined according to the EDS data averaged from two map areas on each sample subjected to different types and concentrations of dye. As shown Figure 7, the basicity of the two slags after adsorption generally increased with the increase in the dye concentration. For the basic dye (MB) as shown Figure 7a,c, the basicity of the slag residue showed the opposite changing trend against the dye removal rate. This indicated that at higher MB concentrations (higher pH), the adsorption of the dye onto the slag surface was suppressed due to higher basicity of the slag residue in the solution. On the contrary, for the acidic dye (MO), as shown in Figure 7b,d, the higher basicity of the slag residue promoted the dye removal due to the acidic nature of MO, thus showing the same changing trend with the dye removal rate profile. In all cases, after the adsorption equilibrium was reached, the change in the slag basicity had a decreasing effect on the dye removal rate.

3.5. X-ray Diffraction

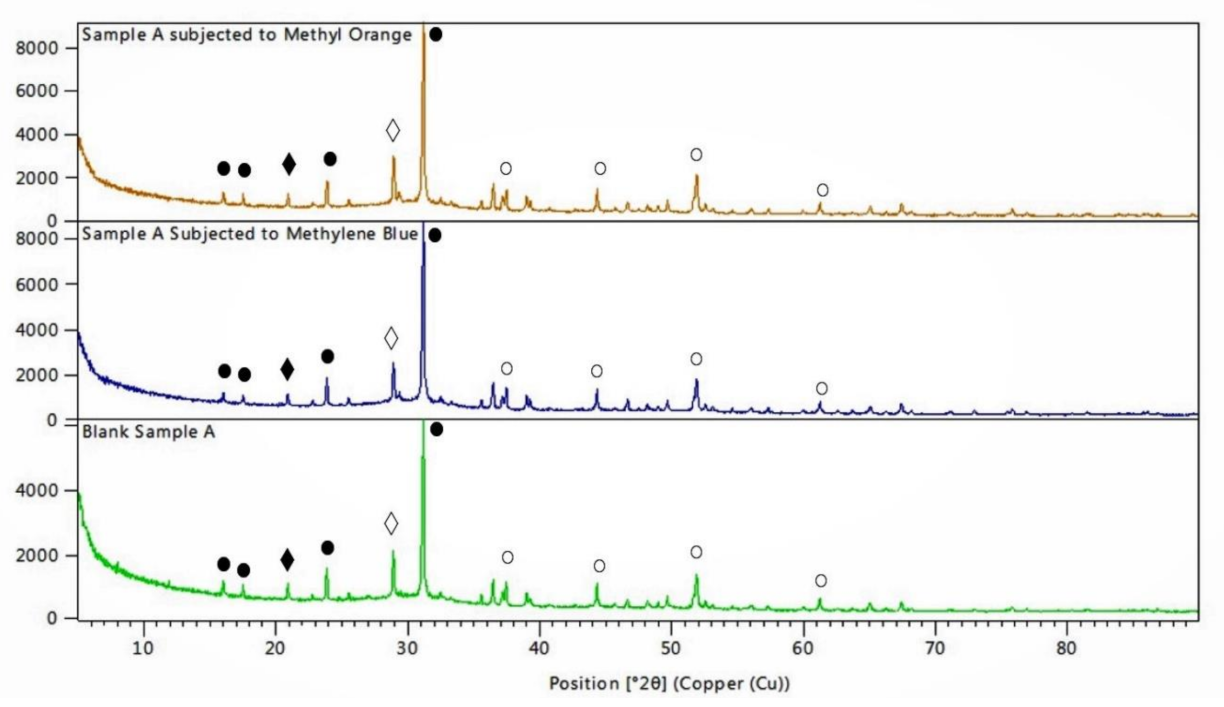
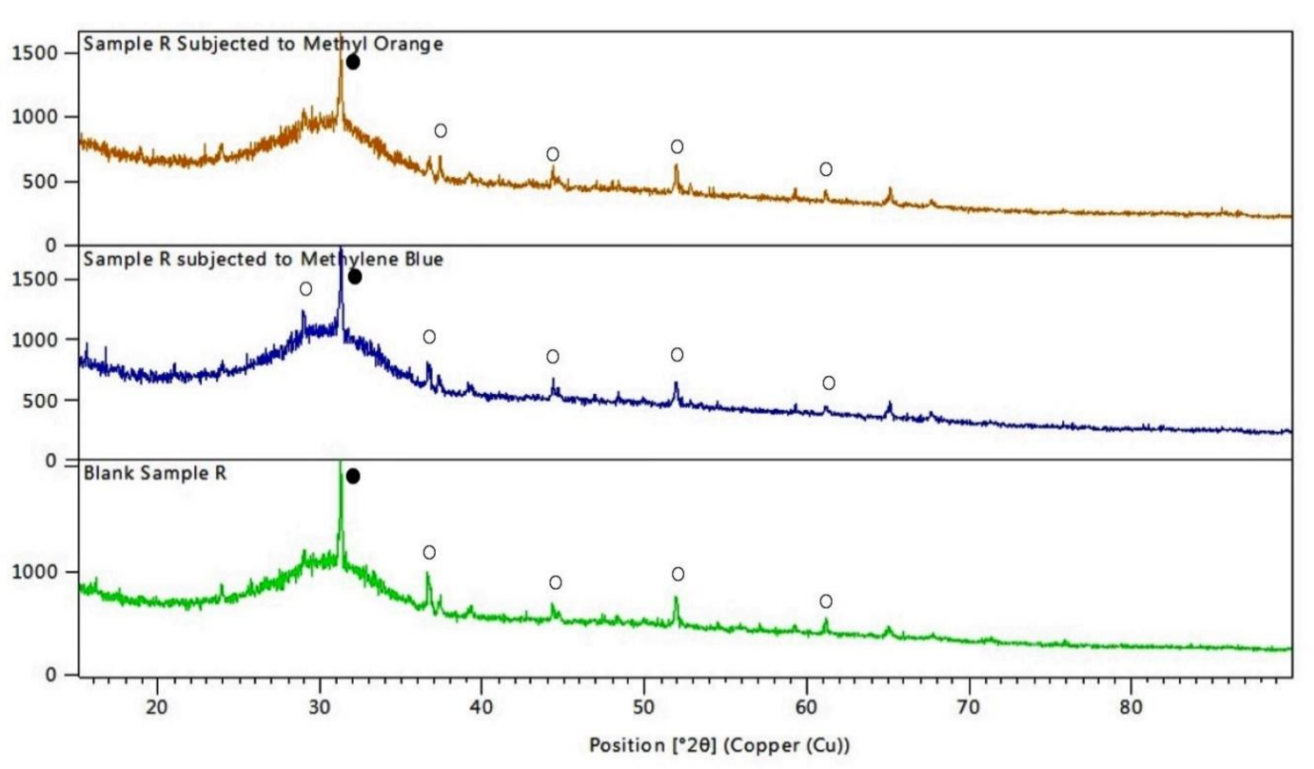
Figure 8 shows the XRD pattern of the two different BFS samples subjected to MB and MO. High Score Plus software was used to identify the contained mineral phases. All the samples showed common calcium, aluminum, magnesium and silicon oxide peaks as Akermanite. Different peaks at 2θ of 35, 43 and 47 demonstrated Akermanite (Ca2Mg[Si2O7]) as the main crystalline phase. Besides, the crystalline phases of cordierite/indialite (Mg2Al4Si5O18), clathrasil ([SiO2]x) and quartz (SiO2) were also identified. The low intensity of the peaks indicate that amorphous and poorly crystallised smaller contents of phases exist in the samples. The XRD diffraction of blank BFS and the samples subjected to the dye showed almost the same pattern. Most of the changes are related to the small peaks and the enhanced intensity for some of the peaks after adsorption of dye from the wastewater. The intensity of the samples subjected to MO treatment were higher than the two samples subjected to the treatment of MB, which coincides with the dye removal results which showed better removal of MO than the MB.

4. Discussion

The work investigated the capacity of blast furnace slag (BFS) for removal of the cationic dye methylene blue (MB) and the acidic dye methyl orange (MO) from wastewater. BFS is a waste product from the ironmaking industry which is currently used mostly in civil engineering applications. Integrating this by-product in higher value applications, such as in industrial wastewater treatment as a substitute for expensive adsorbents, can significantly improve the sustainability of the ironmaking and textile industries, which are associated with environmental challenges and pollution. The selected dyes in this study are the most commonly used by the textile and leather industries. Approximately 50% of all dyes used at present are azoic dyes [30], such as the MO used in this work. When released to wastewater azo dyes are toxic due to the amines and nitrogen-nitrogen double bonds in their effluent [12,13]. MB is also harmful to humans, and exposure to this substance may cause severe vomiting, cyanosis, shock, heart rate and tissue necrosis [16]. Even under low concentration in the water systems from different sources it can still affect the health of the ecosystems, along with impacts on human health and aesthetic concerns. For this reason, their removal from wastewater prior to discharge is required.
The presented work indicates that BFS can be successfully applied for pre-treatment of industrial wastewaters for dye removal. The optimal conditions for wastewater treatment with BFS are 80 g/L of adsorbent dose and 1 h of treatment time, regardless of the type of dye and BFS properties. However, the efficiency and rates of removal were found to differ significantly depending on the type of dye and, to a lesser extent, on the BFS properties represented as the basicity (CaO/SiO2).
Under the initial optimal removal conditions, BFS was more efficient for removing the acidic MO dye (53–57%) than cationic MB (46.5–48%). This was also evident from the kinetic modelling which showed that the amount of dye adsorbed at equilibrium was higher for the case of MO (0.422 and 0.496 mg/g) comparing to MB (0.35 and 0.36 mg/g). The rate of dye adsorption was impacted by the pH of the BFS samples, which was above 11. For instance, adsorption of MB as a cationic dye reduces with an increase in pH of the solution. pH of 7.3 and below has high electrostatic attraction among the positive charge of the BFS surface and the negative charge of the anionic dye molecules. Electrostatic interaction has an essential role in the adsorption process. However, adsorption under alkaline conditions could occur due to the excess of OH- ions, destabilising the anionic dye and competing with dye anions for adsorption [4]. In this study, the pH of the solution for MO was below 7, and the condition was acidic, thus increasing the efficiency of BFS for removing MO as an acidic dye compared to MB as a cationic dye. Due to the difference in pH among the two dyes examined, the BFS acts as a catalyst for MO removal.
Under shorter contact times, the results revealed reverse efficiency of BFS for removal of dyes comparing to the optimal 1 h contact time. At 10 min contact time BFS was more effective at removal of MB (35.6 and 45.4%) than MO (17.7 and 21%). The kinetic modelling also revealed higher removal rates for MB comparing to MO, as estimated through the kinetic constants. These results suggest that the BFS may be used for pre-treatment of industrial wastewater contaminated with cationic dye under continuous treatment conditions, while for treatment of acidic dyes longer residence times will improve the removal efficiency.
The results also found that BFS is more effective at treatment of lower concentrations of cationic dyes with removal efficiency decreasing with increased concentration of the dye, while for treatment of acidic dyes, BFS is more effective at higher contamination rates.
The BFS chemistry had additional impact on the efficiency of dye removal. While BFS sample A had higher CaO and SiO2 contents and higher acidity (CaO/SiO2 ratio), sample R had higher MgO and Al2O3 contents. Higher basicity of BFS is associated with lower dye removal ability for adsorption of acidic dye when applied at smaller concentrations, while for cationic dye when applied at higher concentrations. The higher BFS basicity sample A showed higher removal efficiency (57%) and amount of dye adsorbed at equilibrium (0.496 mg/g) for acidic MO dye, comparing to sample R at 52.6% and 0.422 mg/g, respectively. At high initial MO concentration of 300 mg/L, both BFS samples showed similar MO removal rate of around 90% and adsorption capacity (3.4 mg/g) at equilibrium. The highest adsorption capacities at equilibrium of the slags used in this study are comparable to the results of 2.7–3.4 mg/g reported by Bhatnagar et al. [15] and 0.5–3.2 mg/g by Genc et al. [31].

5. Conclusions

This study investigated the dye removal ability of BFS considering the chemical composition of the slag, its basicity and the type of dye. The optimum conditions, such as adsorbent (BFS) dose contact time and adsorbate (wastewater dye concentration) dose, were investigated and correlated to the BFS chemical content. The results demonstrated that the optimum conditions for removing dye occurred at an adsorbent (BFS) dose of 80 g/L with one hour contact time for both MB and MO dyes. On the other hand, the best adsorbate dose was different between MB as a basic dye and MO as an acid dye, being 60 and 300 mg/L, respectively. SEM analysis of the treated BFS samples showed that treatment resulted in a morphology that is more compact, with nanoparticles on the surface of the samples which demonstrated the physical mechanism of the surface interaction with dye adsorption. The EDS analysis revealed a correlation between basicity and dye removal ability of each BFS sample. The basicity of the sample changed slightly, however, when adsorption of the sample was high, the basicity was lower. Higher basicity BFS showed lower dye removal ability for adsorption of acidic dye when applied at smaller concentrations, and for cationic dye when applied at higher concentrations. This finding approves the chemical adsorption of the BFS reaction between the samples and shows how the chemical content can affect the adsorption mechanism. In addition, the study demonstrated that the BFS is more efficient for removing acidic dyes in wastewater, such as MO, which increased in efficiency with the amount of BFS used for adsorption. BFS was less efficient for removal of cationic dyes, such as MB with efficiency decreasing with increased dye concentration. Activation of BFS prior to adsorption may be required to improve BFS adsorption efficiency of cationic dyes in wastewater.

Author Contributions

Conceptualization, S.Y. and V.S.; Methodology, S.Y.; Validation, S.Y.; Formal Analysis, S.Y., V.S. and T.K.; Investigation, S.Y.; Resources, T.E.; Writing—Original Draft Preparation, S.Y.; Writing—Review & Editing, V.S., T.K. and T.E.; Supervision, V.S. and T.E.; Project Administration, V.S.; Funding Acquisition, V.S. and T.E. All authors have read and agreed to the published version of the manuscript.

Funding

This research was funded by Australian Research Council’s Linkage Projects funding scheme (project number LP140100182).

Institutional Review Board Statement

Not applicable.

Informed Consent Statement

Not applicable.

Data Availability Statement

Not applicable.

Conflicts of Interest

The authors declare no conflict of interest.

References

  1. Jain, A.; Gupta, V.; Bhatnagar, A. Utilisation of industrial waste products as adsorbents for the removal of dyes. J. Hazard. Mater. 2003, 101, 31–42. [Google Scholar] [CrossRef]
  2. Francis, A. Non-isothermal crystallisation kinetics of a blast furnace slag glass. J. Am. Ceram. Soc. 2005, 88, 1859–1863. [Google Scholar] [CrossRef]
  3. Taha, G.; Mosaed, T. Blast Furnace Slag of a Ferrosilicon Firm in Aswan Governorate, Upper Egypt, as an Adsorbent for the Removal of Merocyanine Dye from Its Aqueous Solution. Chem. Biodivers. 2010, 7, 878–886. [Google Scholar] [CrossRef]
  4. Wang, Z.; Huang, G.; An, C.; Li, W.; Chen, L.; Zhang, Z. Transport of Reactive X-3B Dye at the Interface between Cationic Surfactant-Modified Water Quenched Blast Furnace Slag and Aqueous Solution. Can. J. Chem. Eng. 2018, 96, 1240–1249. [Google Scholar] [CrossRef]
  5. Gao, H.; Song, Z.; Zhang, W.; Yand, X.; Wang, X.; Wang, D. Synthesis of highly effective absorbents with waste quenching blast furnace slag to remove Methyl Orange from aqueous solution. J. Environ. Sci. 2017, S3, 68–77. [Google Scholar] [CrossRef]
  6. Shi, J.; Kuwahara, Y.; An, T.; Yamashita, H. The fabrication of TiO2 supported on slag-made calcium silicate as low-cost photocatalyst with high adsorption ability for the degradation of dye pollutants in water. Catal. Today 2017, 281, 21–28. [Google Scholar] [CrossRef] [Green Version]
  7. Yasipourtehrani, S.; Strezov, V.; Bliznyukov, S.; Evans, T. Investigation of Thermal Properties of Blast Furnace Slag to Improve Process Energy Efficiency. J. Clean. Prod. 2017, 149, 137–145. [Google Scholar] [CrossRef]
  8. Rivera, A.R.; Sanjuán, M.Á.; Martin, D.A. Granulated Blast-Furnace Slag and Coal Fly Ash Ternary Portland Cements Optimization. Sustainability 2020, 12, 5783. [Google Scholar] [CrossRef]
  9. Rios, J.D.; Vahi, A.; Leiva, C.; Martinez-De La Concha, A.; Cifuentez, H. Analysis of the Utilization of Air-Cooled Blast Furnace Slag as Industrial Waste Aggregates in Self-Compacting Concrete. Sustainability 2019, 11, 1702. [Google Scholar] [CrossRef] [Green Version]
  10. Yasipourtehrani, S.; Strezov, V.; Evans, T.J. Investigation of Phosphate Removal Capability of Blast Furnace Slag in Wastewater Treatment. Sci. Rep. 2019, 9, 7498. [Google Scholar] [CrossRef]
  11. Ozturk, Z.; Gultekin, E. Preparation of ceramic wall tiling derived from blast furnace slag. Ceram. Int. 2015, 41, 12020–12026. [Google Scholar] [CrossRef]
  12. Yagub, M.; Sen, T.; Afroze, S.; Ang, H. Dye and its removal from aqueous solution by adsorption: A review. Adv. Colloid Sci. 2014, 209, 172–184. [Google Scholar] [CrossRef]
  13. Luo, X.; Liang, C.; Hu, Y. Comparison of Different Enhanced Coagulation Methods for Azo Dye Removal from astewater. Sustainability 2019, 11, 4760. [Google Scholar] [CrossRef] [Green Version]
  14. Shaban, M.; Abukhadra, M.; Hamd, A. Recycling of glass in synthesis of MCM 48 mesoporous silica as catalyst support for Ni2O3 photocatalyst for Congo red dye removal. Clean Technol. Environ. Policy 2017, 20, 13–28. [Google Scholar] [CrossRef]
  15. Bhatnagar, A.; Jain, A. A comparative adsorption study with different industrial wastes as adsorbents for the removal of cationic dyes from water. J. Colloid Interface Sci. 2005, 281, 49–55. [Google Scholar] [CrossRef] [PubMed]
  16. Dhmees, A.; Khaleel, N.; Mahmoud, S. Synthesis of silica nanoparticles from blast furnace slag as cost effective adsorbent for efficient azo-dye removal. Egypt. J. Pet. 2018, 27, 1113–1121. [Google Scholar] [CrossRef]
  17. Ramakrishna, K.; Viraraghavan, T. Use of Slag for Dye removal. J. Waste Manag. 1997, 17, 483–488. [Google Scholar] [CrossRef]
  18. Gupta, V.; Ali, I.; Mohan, D. Equilibrium uptake and sorption dynamics for the removal of a basic dye (basic red) using low-cost adsorbents. J. Colloid Interface Sci. 2003, 265, 257–264. [Google Scholar] [CrossRef]
  19. Yan, L.; Qin, L.; Yu, H.; Li, S.; Shan, R.; Dy, B. Adsorption of acid dyes from aqueous solution by CTMAB modified bentonite: Kinetic and isotherm modeling. J. Mol. Liq. 2015, 211, 1074–1081. [Google Scholar] [CrossRef]
  20. Mazouz, R.; Filali, N.; Hattab, Z.; Guerfi, K. Valorization of granulated slag of Arcelor-Mittal (Algeria) in cationic dye adsorption from aqueous solution: Column studies. J. Water Reuse Desalin. 2016, 6, 2004–2013. [Google Scholar] [CrossRef] [Green Version]
  21. Nassar, N.; Marei, N.; Vitale, G.; Arar, L. Adsorptive Removal of Dyes from Synthetic and Real Textile Wastewater Using Magnetic Iron Oxide Nanoparticles: Thermodynamic and Mechanistic Insights. Can. J. Chem. Eng. 2015, 93, 1965–1974. [Google Scholar] [CrossRef]
  22. Ferrero, F. Dye removal from aqueous solution using coal fly ash for continuous flow adsorption. Clean Technol. Environ. Policy 2015, 17, 1907–1915. [Google Scholar] [CrossRef]
  23. Shang, S.M. Process Control In Printing Of Textiles. In Process Control In Textile Manufacturing; Majumdar, A., Das, R., Alagirusamy, V., Kothari, K., Eds.; Woodhead Publishing Limited in Association with the Textile Institute: Oxford, MI, USA, 2013; pp. 339–362. [Google Scholar]
  24. Bhatnagar, A.; Minocha, A.K.; Jeun, B.-H.; Song, H.; Seo, Y.-C. Removal of Anionic Dyes from Water using Citrus limonum (Lemon) Peel: Equilibrium Studies and Kinetic Modeling. Sep. Sci. Technol. 2009, 44, 316–334. [Google Scholar] [CrossRef]
  25. Wagner, L. Failure Analysis of Integrated Circuits; Springer: New York, NY, USA, 1999; pp. 205–206. [Google Scholar]
  26. Johansson, L.; Gustafsson, J. Phosphate Removal Using Blast Furnace Slags and Opoka-Mechanism. Water Res. 2000, 34, 259–265. [Google Scholar] [CrossRef]
  27. Memon, S.; Loa, T.; Barbhuiya, S.; Xu, W. Development of form-stable composite phase change material byincorporation of dodecyl alcohol into ground granulated blast furnace. Energ. Build. 2013, 62, 360–367. [Google Scholar] [CrossRef]
  28. Fleet, M.; Liu, X.; King, P. Accommodation of the carbonate ion in apatite: An FTIR and X-ray structure study of crystals synthesised at 2–4 GPa. Am. Mineral. 2004, 89, 1422–1432. [Google Scholar] [CrossRef]
  29. Kuo, Y.; Wang, J.; Wang, C.; Tsai, C. Effect of water quenching and SiO2 addition during vitrification of fly ash Part 1: On the crystalline characteristics of slag. J. Hazard. Mater. 2008, 152, 994–1001. [Google Scholar] [CrossRef] [PubMed]
  30. Cano, A.; Gonzalez, R.; Paz, H.; Madrid, A.; Casillas, G.; Hernandez, M.; Perez, M. Catalytic activity of palladium nanocubes/multiwalled carbon nanotubes structures for methyl orange dye removal. Catal. Today 2017, 282, 168–173. [Google Scholar] [CrossRef]
  31. Genc, A.; Oguz, A. Sorption of acid dyes from aqueous solution by using non-ground ash and slag. Desalination 2010, 264, 78–83. [Google Scholar] [CrossRef]
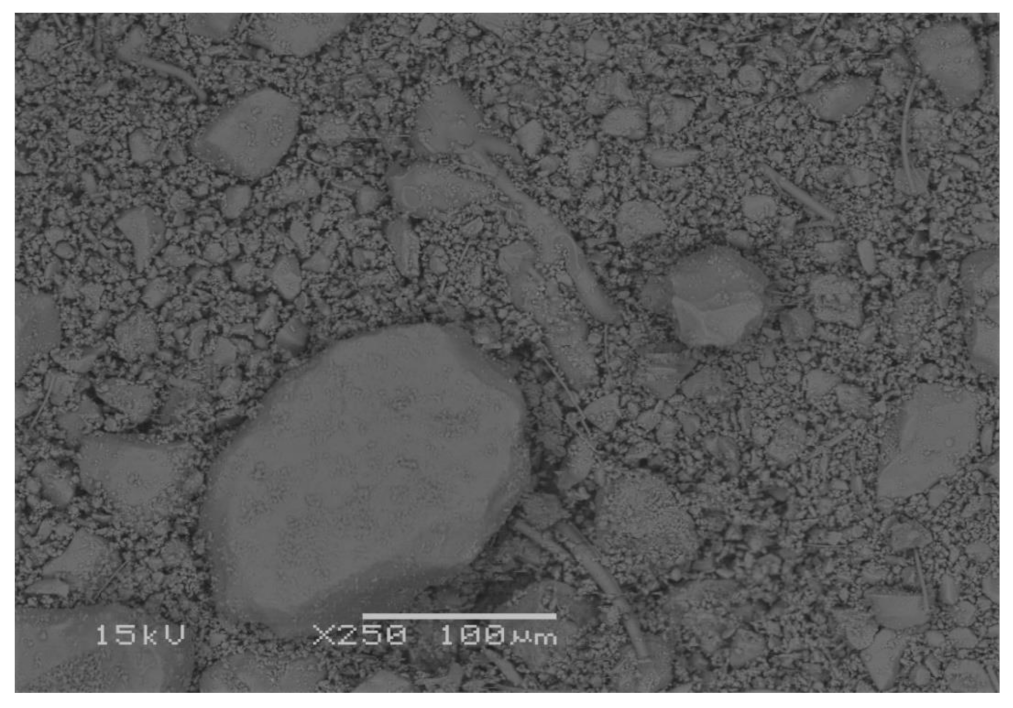
Figure 1. The size of sample R powder after grinding according to the SEM imaging.
Sustainability 13 01970 g001
Figure 2. The percentage of dye removal at conditions of BFS dose = 80 g/L and contact time = 1 h: (a) methylene blue (MB) and (b) methyl orange (MO).
Sustainability 13 01970 g002
Figure 3. Adsorption capacity of the slags at equilibrium.
Sustainability 13 01970 g003
Figure 4. FTIR spectroscopy of BFS samples with different concentrations of MB and MO in synthetic wastewater, (a) sample A subjected to MB; (b) sample A subjected to MO; (c) sample R subjected to MB; (d) sample R subjected to MO.
Sustainability 13 01970 g004aSustainability 13 01970 g004b
Figure 5. SEM analysis and morphology changes of sample A after removing the dye from synthetic wastewater (a) Blank sample A, (b) Sample A subjected to 60 mg/L MB, (c) Sample A subjected to 300 mg/L MO.
Sustainability 13 01970 g005
Figure 6. SEM analysis and morphology changes of sample R after removing the dye from synthetic wastewater (a) Blank sample R, (b) Sample R subjected to 60 mg/L MB, (c) Sample R subjected to 300 mg/L MO.
Sustainability 13 01970 g006
Figure 7. The relation between the basicity and dye removal ability of each sample, the basicity of blank sample A is 1.12 and blank sample R is 1.09; (a) sample A subjected to MB; (b) sample A subjected to MO; (c) sample R subjected to MB; (d) sample R subjected to MO.
Sustainability 13 01970 g007aSustainability 13 01970 g007b
Figure 8. XRD pattern for raw blast furnace slag (BFS) and BFS residues subjected to the MB and MO. (○) Akermanite, (●) Clathrasil, (◇) Quartz, (◆) Cordierite and Indialite.
Sustainability 13 01970 g008aSustainability 13 01970 g008b
Table 1. Chemical composition of the samples in percentage.
Slag (%)FeSiO2CaOMgOAl2O3MnOTiO2Basicity (CaO/SiO2 Ratio)
Sample A0.4335.9340.418.3813.540.260.51.12
Sample R0.3930.7833.8313.3419.010.840.971.09
Table 2. Adsorbent dose change effect on two different types of dye removal.
Adsorbent Dose
Removal rate of MB (%)20 g/L40 g/L60 g/L80 g/L100 g/L
Sample A30.831.740.246.539.2
Sample R29.832.839.348.341.9
Removal rate of MO (%)
Sample A23.643.449.757.356.0
Sample R27.940.746.652.951.4
Table 3. Contact time effect on the percentage of two different dye removal.
Methylene BlueSample A (%)Sample R (%)Methyl OrangeSample A (%)Sample R (%)
10 min35.645.410 min17.721.0
30 min32.244.430 min47.651.6
1 h47.048.21 h57.052.6
2 h44.442.72 h55.651.0
Table 4. pH of dye solutions before and after adsorption at adsorbent dose of 80 g/L and contact time of 1 h.
Methylene BlueMethyl Orange
Dye Concentration (mg/L)100150200250100150200250
pH Before Adsorption8.88.98.993.33.33.13.0
pH After Adsorption10.310.21010.15.45.35.55.9
Table 5. Pseudo second order kinetic reaction constants.
Methylene BlueMethyl Orange
Sample ASample RSample ASample R
qe (mg/g)0.3540.3610.4960.422
ks (g/mg min)0.4490.4800.1130.263
R20.9850.9980.9690.981
Publisher’s Note: MDPI stays neutral with regard to jurisdictional claims in published maps and institutional affiliations.