Article

Energy and Eco-Impact Evaluation of Fused Deposition Modeling and Injection Molding of Polylactic Acid

Mechanical & Industrial Engineering, University of Minnesota Duluth, MN 55812, USA
*
Author to whom correspondence should be addressed.
Sustainability 2021, 13(4), 1875; https://doi.org/10.3390/su13041875
Submission received: 10 January 2021 / Revised: 2 February 2021 / Accepted: 2 February 2021 / Published: 9 February 2021
(This article belongs to the Section Sustainable Engineering and Science)

Abstract

:
There is limited knowledge about energy and carbon emission performance comparison between additive fused deposition modeling (FDM) and consolidation plastic injection molding (PIM) forming techniques, despite their recent high industrial applications such as tools and fixtures. In this study, developed empirical models focus on the production phase of the polylactic acid (PLA) thermoplastic polyester life cycle while using FDM and PIM processes to produce American Society for Testing and Materials (ASTM) D638 Type IV dog bone samples to compare their energy consumption and eco-impact. It was established that energy consumption by the FDM layer creation phase dominated the filament extrusion and PLA pellet production phases, with, overwhelmingly, 99% of the total energy consumption in the three production phases combined. During FDM PLA production, about 95.5% of energy consumption was seen during actual FDM part building. This means that the FDM process parameters such as infill percentage, layer thickness, and printing speed can be optimized to significantly improve the energy consumption of the FDM process. Furthermore, plastic injection molding consumed about 38.2% less energy and produced less carbon emissions per one kilogram of PLA formed parts compared to the FDM process. The developed functional unit measurement models can be employed in setting sustainable manufacturing goals for PLA production.

1. Introduction

According to the United States Energy Information Administration (EIA), the manufacturing sector is a significant source of energy consumption, and driving accessories in the manufacturing sector alone consume around 1.35 × 10¹⁹ J each year, generating about a 521 MT CO2 equivalent amount of carbon emissions [1]. Since 2010, the United States has been recording the largest increase in energy consumption every year in both absolute and percentage terms. Hence, optimizing current processes, adopting new techniques, and developing new technologies are paramount to limiting the increase in energy consumption and reducing carbon emissions [2]. Fused deposition modeling (FDM), an additive manufacturing (AM) process, is one such technology with a potential to improve energy efficiency in the manufacturing industry. AM has the capability of printing functional parts using a wide range of materials such as metals, ceramic, and polymers. AM technologies are typically considered to be environmentally sustainable due to the significant reduction in tooling, material wastage, and chemicals. Moreover, inventory reduction due to AM’s ability to form parts on demand further supports the sustainable manufacturing goals. Due to their early usage in prototyping, extrusion-based AM techniques such as FDM and fused filament fabrication (FFF) gained popularity [3,4]. In general, particle concentration of 3D printing using acrylonitrile butadiene styrene (ABS) material was about 38 times higher than when polylactic acid (PLA) materials are used [5]. Total volatile organic compounds (TVOCs) were also emitted when ABS was used but were not observed for the PLA cartridges, and results suggest that more research and sophisticated control methods, including the use of less harmful materials, blocking emitted containments, and using filters or adsorbents, should be implemented [4,5,6,7]. FDM can be defined as the process of making a physical model from a digital model by the deposition of thin layers of a material through a printer head or nozzle.
In the production of plastic parts, plastic injection molding (PIM) is one of the most common processes used due to its ability to quickly manufacture large quantities at a high level of efficiency [8,9]. Parts made from PIM are found in a wide array of industries, including automotive, aerospace, medical, and consumer products [8,10]. According to a report by Business Communications Company (BCC) Research, the global market for PIM was USD 139 billion in 2018 and is expected to grow to USD 223 billion by 2023 [11]. The growing global utilization provides a motivation to understand the energy consumption and environmental impact of PIM compared to other plastic manufacturing processes such as FDM.
Multiple studies have reported on the environmental impact aspects of the FDM process. Weissman and Gupta stated that the energy consumption of FDM is highly dependent on the volume and geometry of the products [12]. Peng reported that printing speed and material flow rate have a small effect on the particulate emission rate, while print bed heating and maintaining the temperature consume the most energy [13]. They also found that the carbon footprint increases as the shape of the part becomes more complex. According to Kim et al., the acrylonitrile butadiene styrene (ABS) filament has a much higher particle emission than PLA [5]. It was also found that most of the energy in FDM is needed for warming up and maintaining the temperature of the plate and nozzle [14]. In addition, they reported that the energy consumption was found to be greatest for the first build, as this requires warming up the machine to the required temperature. Furthermore, Balogun et al. found that post-processing, requiring the use of ultrasonic waves and heat, accounts for a significant fraction of the total energy consumed [15] and carbon footprint [16]. Mognol et al. performed tests under various parameter levels’ combinations, part orientations, and positions in AM systems; they concluded that minimizing manufacturing time is critical to reduce energy consumption for all systems [17]. In comparing the surface roughness and energy consumption, Peng and Yan found that the layer thickness is the most influential factor that generated opposite effects, followed by infill ratio and printing speed [18]. They also found that higher printing speed can effectively reduce energy consumption and maintain good surface roughness [18]. Interestingly, the subtractive milling process consumes less energy than FDM AM. The electrical energy demand was modeled for three different AM processes using ABS and compared against the energy needed in a high-speed milling machine. Balogun et al. reported six times less energy to build the same part in the milling machine as compared to FDM, mainly due to the relatively high cycle time and low manufacturing rate in FDM [15].
Since PIM is an established process, a significant amount of research has looked at the energy utilization of the PIM process. The research ranges from the creation of models used during the design stage to prediction of energy consumption during manufacturing, to the effect of PIM parameters and machine types on energy consumption. Qureshi et al. described an empirical model used during the design stage that can predict the value of specific energy consumption (SEC) for a PIM process with an accuracy of over 90% [19]. Similarly, Ribeiro et al. presented a thermodynamic model based on part geometry and different process and machine conditions, which allows energy consumption to be estimated during the early design phase in order to better optimize the process [8]. Weissman et al. detailed a methodology for estimating energy consumption by examining the different aspects of the PIM process, including selection of a runner layout and machine type and estimation of production volume and energy usage of each PIM process component [20]. Madan et al. proposed a five-step guideline for estimating energy consumption of the PIM process, including pre- and post-operations such as drying and regrinding, respectively [10]. The results and conclusions from the given studies show the importance and advantages of using a design-for-sustainability approach to PIM early in the production process. Much research has been conducted to determine the most energy-sensitive parameters as well as how different PIM machine types compare in terms of energy consumption. Mianehrow and Abbasian examined the energy consumption of six hydraulic PIM machines in order to compare the effect of different process parameters and found that cycle time, throughput, and machine power factor had the greatest effect [21]. Thiriez and Gutowski examined the difference in SEC for electric, hydraulic, and electric–hydraulic (hybrid) PIM machines, as well as a “cradle to factory gate” life cycle inventory for the PIM process. Key results from their study concluded that electric machines were far more energy-efficient than hydraulic and hybrid machines. From the life cycle inventory analysis, they found that the creation of plastic material had the greatest energy usage and impact on the environment. He et al. used ANSYS Polyflow software to simulate the plasticizing stage of PIM in order to obtain optimal process parameters based on energy consumption [22]. Kanungo and Swan discussed process parameters affecting energy consumption, as well as the benefits and drawbacks of electric versus hydraulic PIM machines in terms of energy consumption and part geometry [23]. It is clear that process parameter values as well as machine type selection play an important role in maximizing the sustainability of a PIM process.
Most of the research on PIM energy consumption is lacking in its comparison to other manufacturing processes, specifically AM, as well as considering the creation of the material from raw components. One study that did compare the two processes and considered the creation of the injection material was that of Telenko and Seepersad, who compared energy consumption for PIM and selective laser sintering (SLS) of paintball gun handles made from nylon [24]. They found that SLS requires less energy than PIM for small production volumes, with an energy crossover occurring approximately between 150 and 300 handles [24]. They also concluded that the specific crossover production volume is sensitive to the geometry and size of the part being made, with smaller parts having a greater crossover production volume than larger ones [24]. Another study that compared PIM and AM was by Yoon et al., who compared energy consumption in bulk forming, subtractive, and additive processes, including FDM. They found that bulk forming processes have much larger productivity (mass of parts produced per unit of time) than AM processes, and the SEC of injection molding is much smaller than that of FDM [25]. Their study excluded the energy required for material creation and preparation, including the extrusion process required to make filament for FDM machines. An analysis of energy consumption from the creation of the plastic material up to it being used in the PIM and FDM processes is needed to provide a more comprehensive understanding of the energy utilization and environmental impact of the two processes.
The mission of the current work is to develop analytical models of energy consumption for FDM and PIM processes using a life cycle inventory analysis or “cradle to factory gate” life cycle inventory analysis approach. These models will then be used to evaluate total energy consumed during the manufacturing of ASTM D638 Type IV standard dog bone tensile test PLA coupons. Furthermore, the total environmental impacts associated with the two manufacturing techniques of PLA are compared. The models are developed following unit weight methods for quick estimation.

2. Materials and Methods
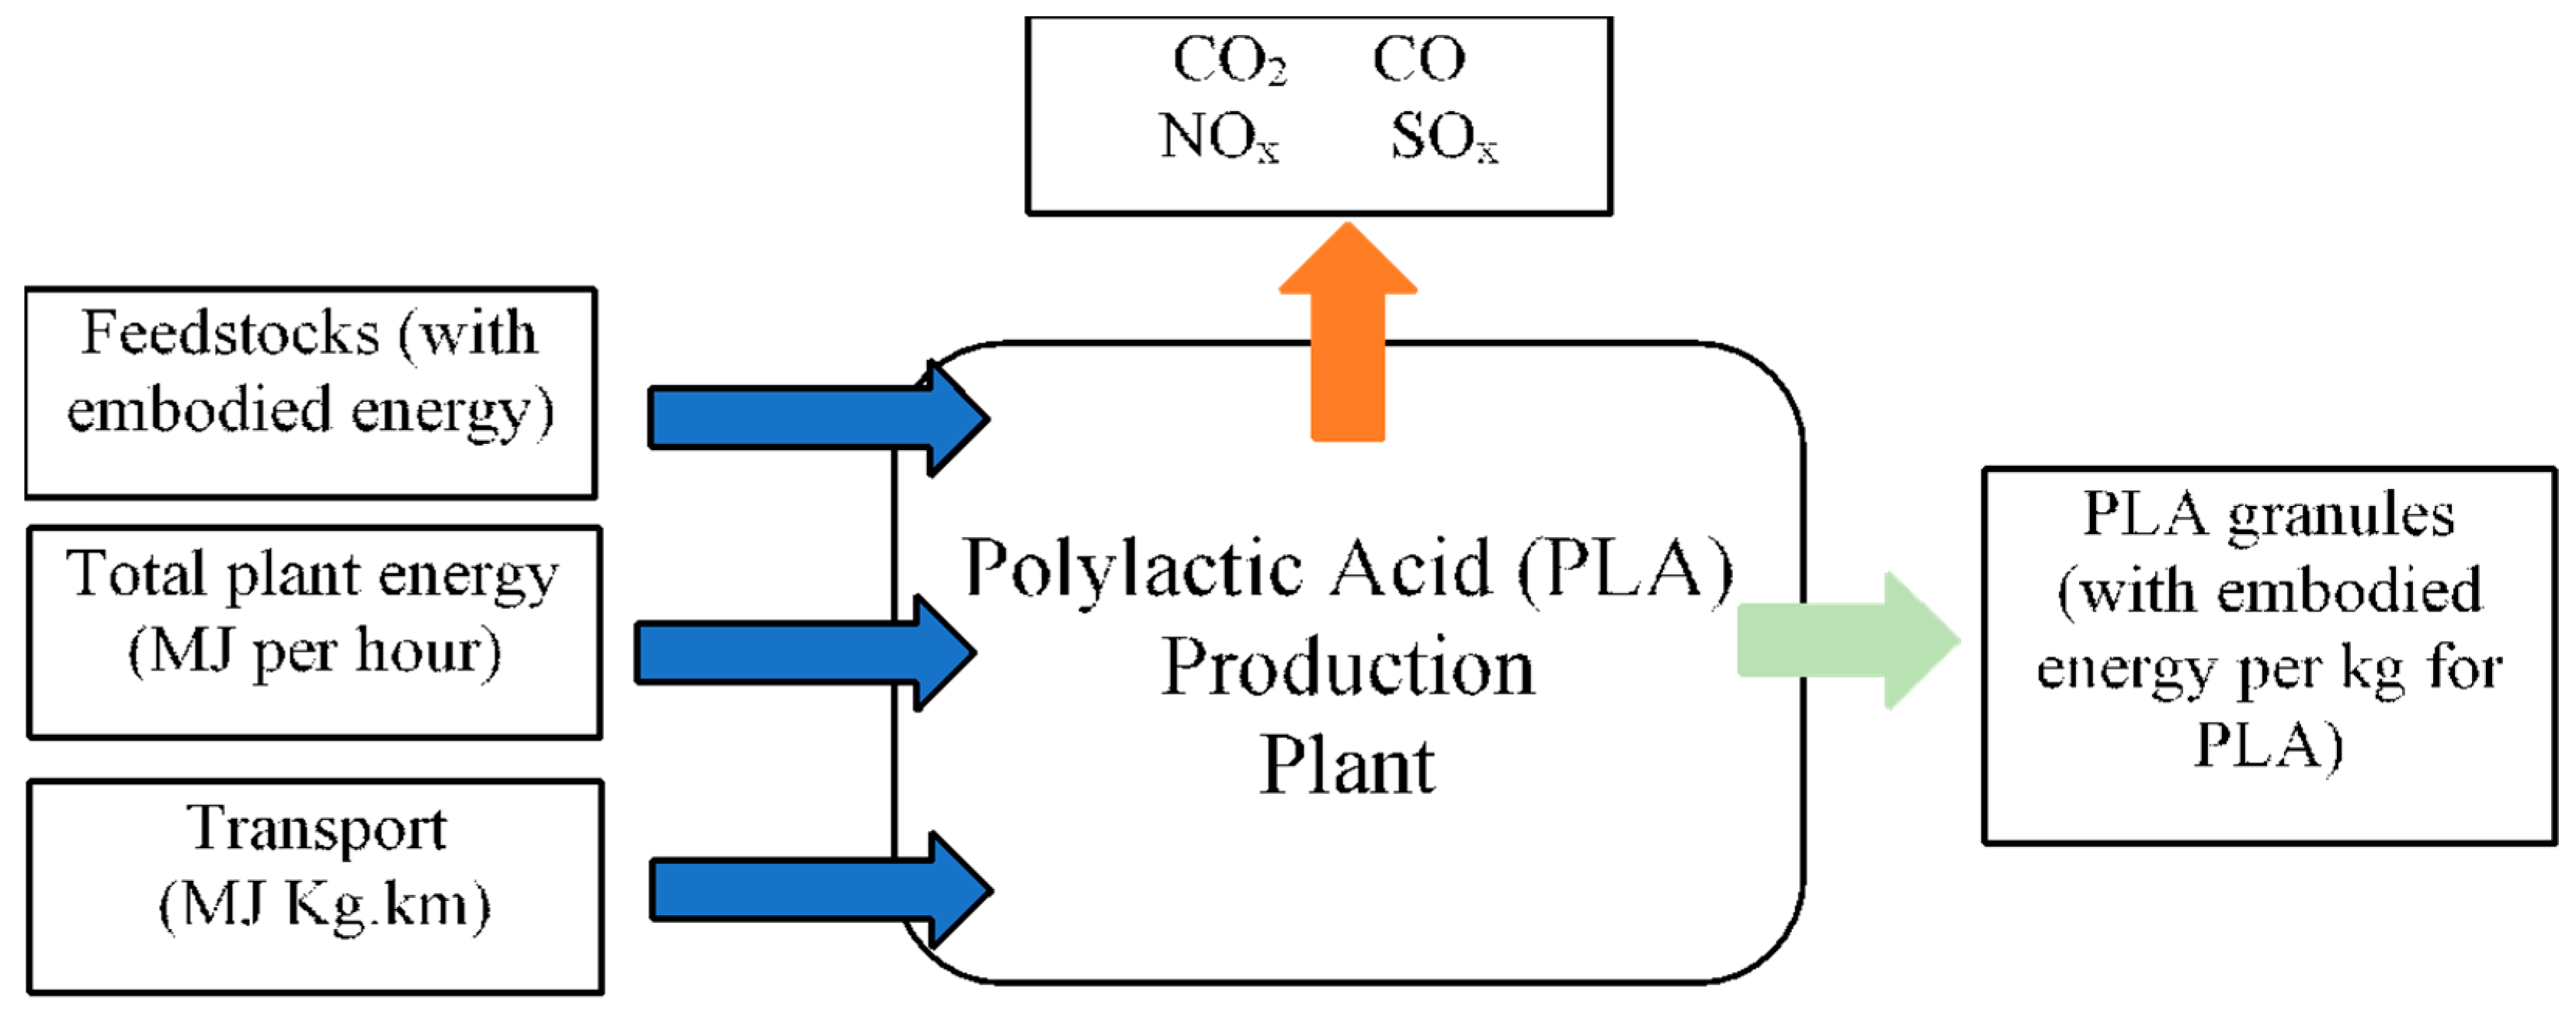
2.1. Material

Polylactic acid (PLA) is a thermoplastic material made from natural lactic acid from natural resources, contrary to other petroleum-based thermoplastics. Some of the natural raw materials used for PLA production include corn starch, tapioca roots, or sugarcane. The properties of PLA are comparable to other plastics, and as a result, there is considerable desire to introduce it into the plastic market as a competitive material. It is an environmentally friendly thermoplastic characterized by its compostability, biodegradability, and biocompatibility. It can be processed, like most thermoplastics, into fibers, thermoformed, or injection-molded. In AM technologies, PLA and its composites are widely fabricated as the commercial feedstock of FDM.

2.2. Material Life Cycle Assessment

PLA materials have a life cycle that starts from natural feedstock, manufactured into PLA products that are distributed and used in several conventional and AM processes. They become scrap at the end of their life, and a percentage of them can be resurrected and enter a second life as recycled content in a new product. Life cycle assessment (LCA) is a strategic tracing of a material’s phases and documentation of the resources consumed and the emissions excreted during each phase of life. Figure 1 shows the four typical stages of a PLA life cycle for the FDM and PIM processes, beginning from extraction and going to PLA production, product manufacturing using molding techniques, product use, and product recycling. In this study, the LCA approach is used to compare the resources consumed by the two production phases of PLA thermoplastics.

2.3. Models Goal and Scope

The goal of the current work is to develop an analytical model of energy consumption for FDM and PIM processes and to apply these models to evaluate total energy consumed during the manufacturing of ASTM D638 Type IV standard dog bone tensile test PLA coupons. Furthermore, the total environmental impacts associated with the two manufacturing techniques of PLA are compared. The energy and emissions associated with post-processing of the FDM- and PIM-formed samples were not assessed because they were very minimal in the samples.

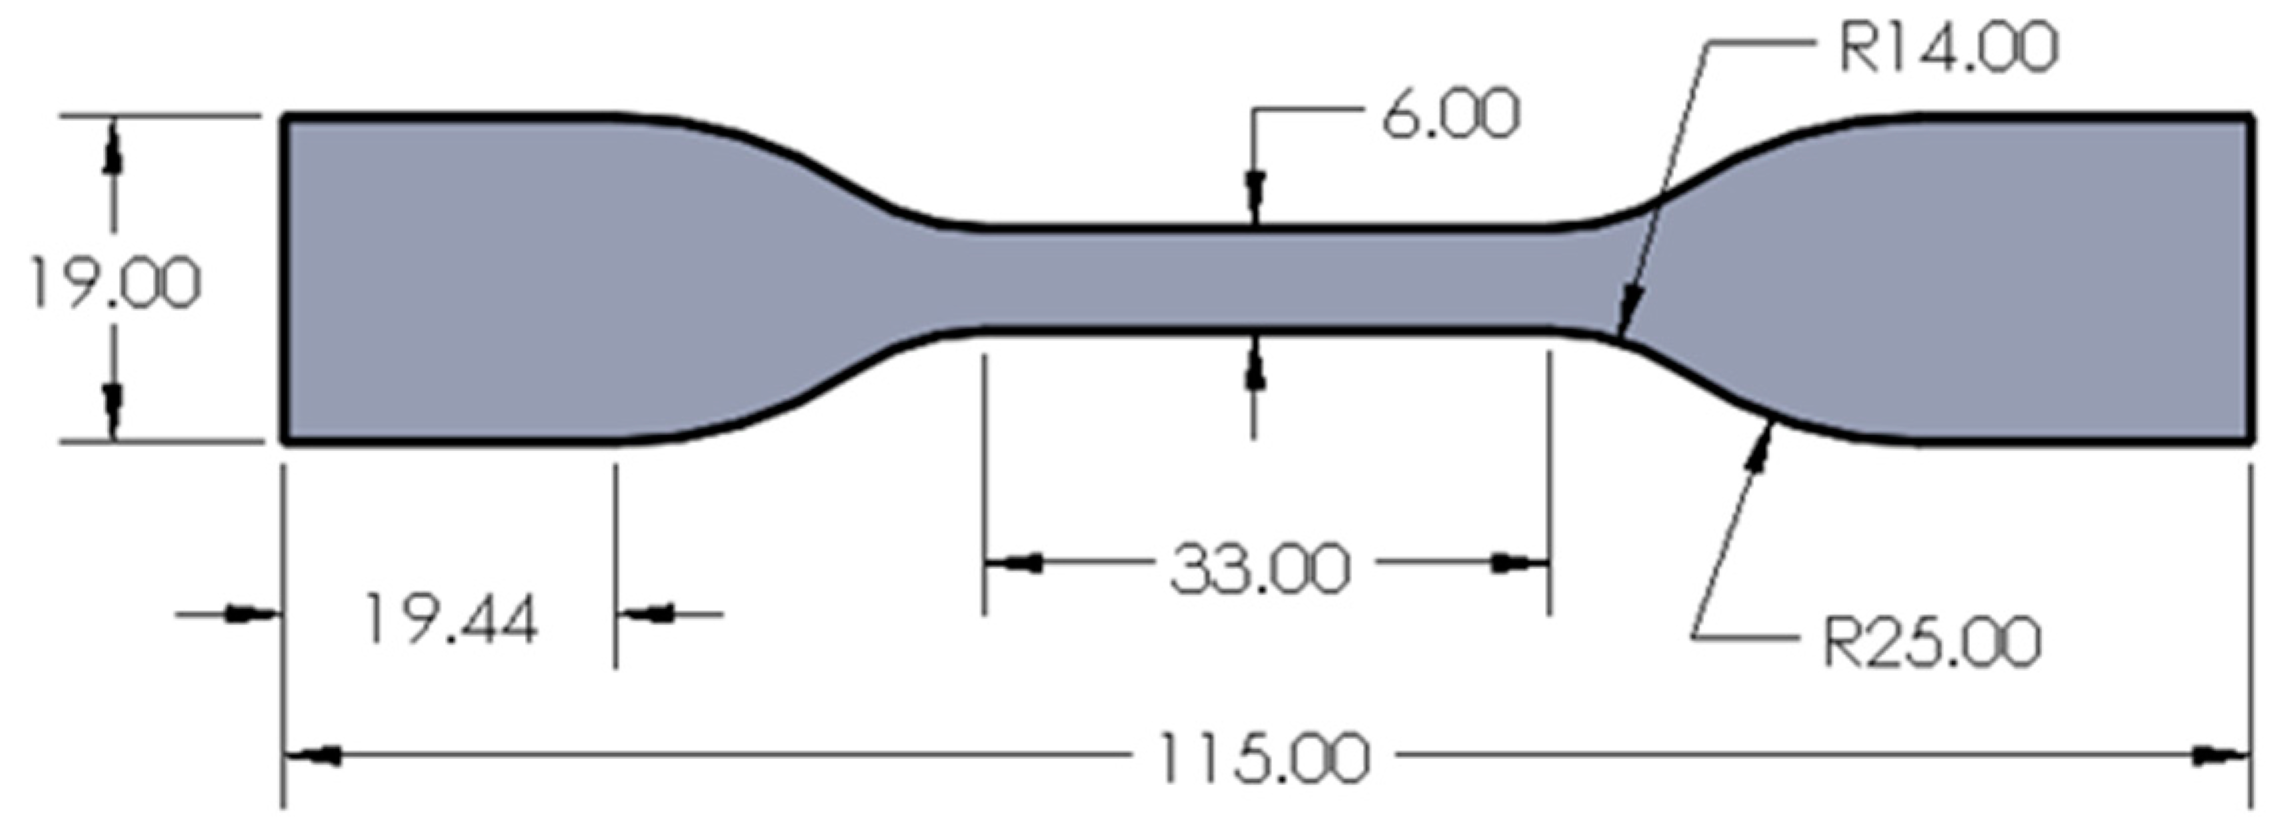
2.4. Functional Unit

The functional unit is used to provide a reference where the life cycle analysis inputs and outputs are standardized. The functional units established for the energy and carbon emission models are kWh and kg, respectively, per kilogram of PLA formed by the FDM and PIM processes. The use of a standardized functional unit enables the model to be scalable to larger numbers of parts and larger batch sizes.

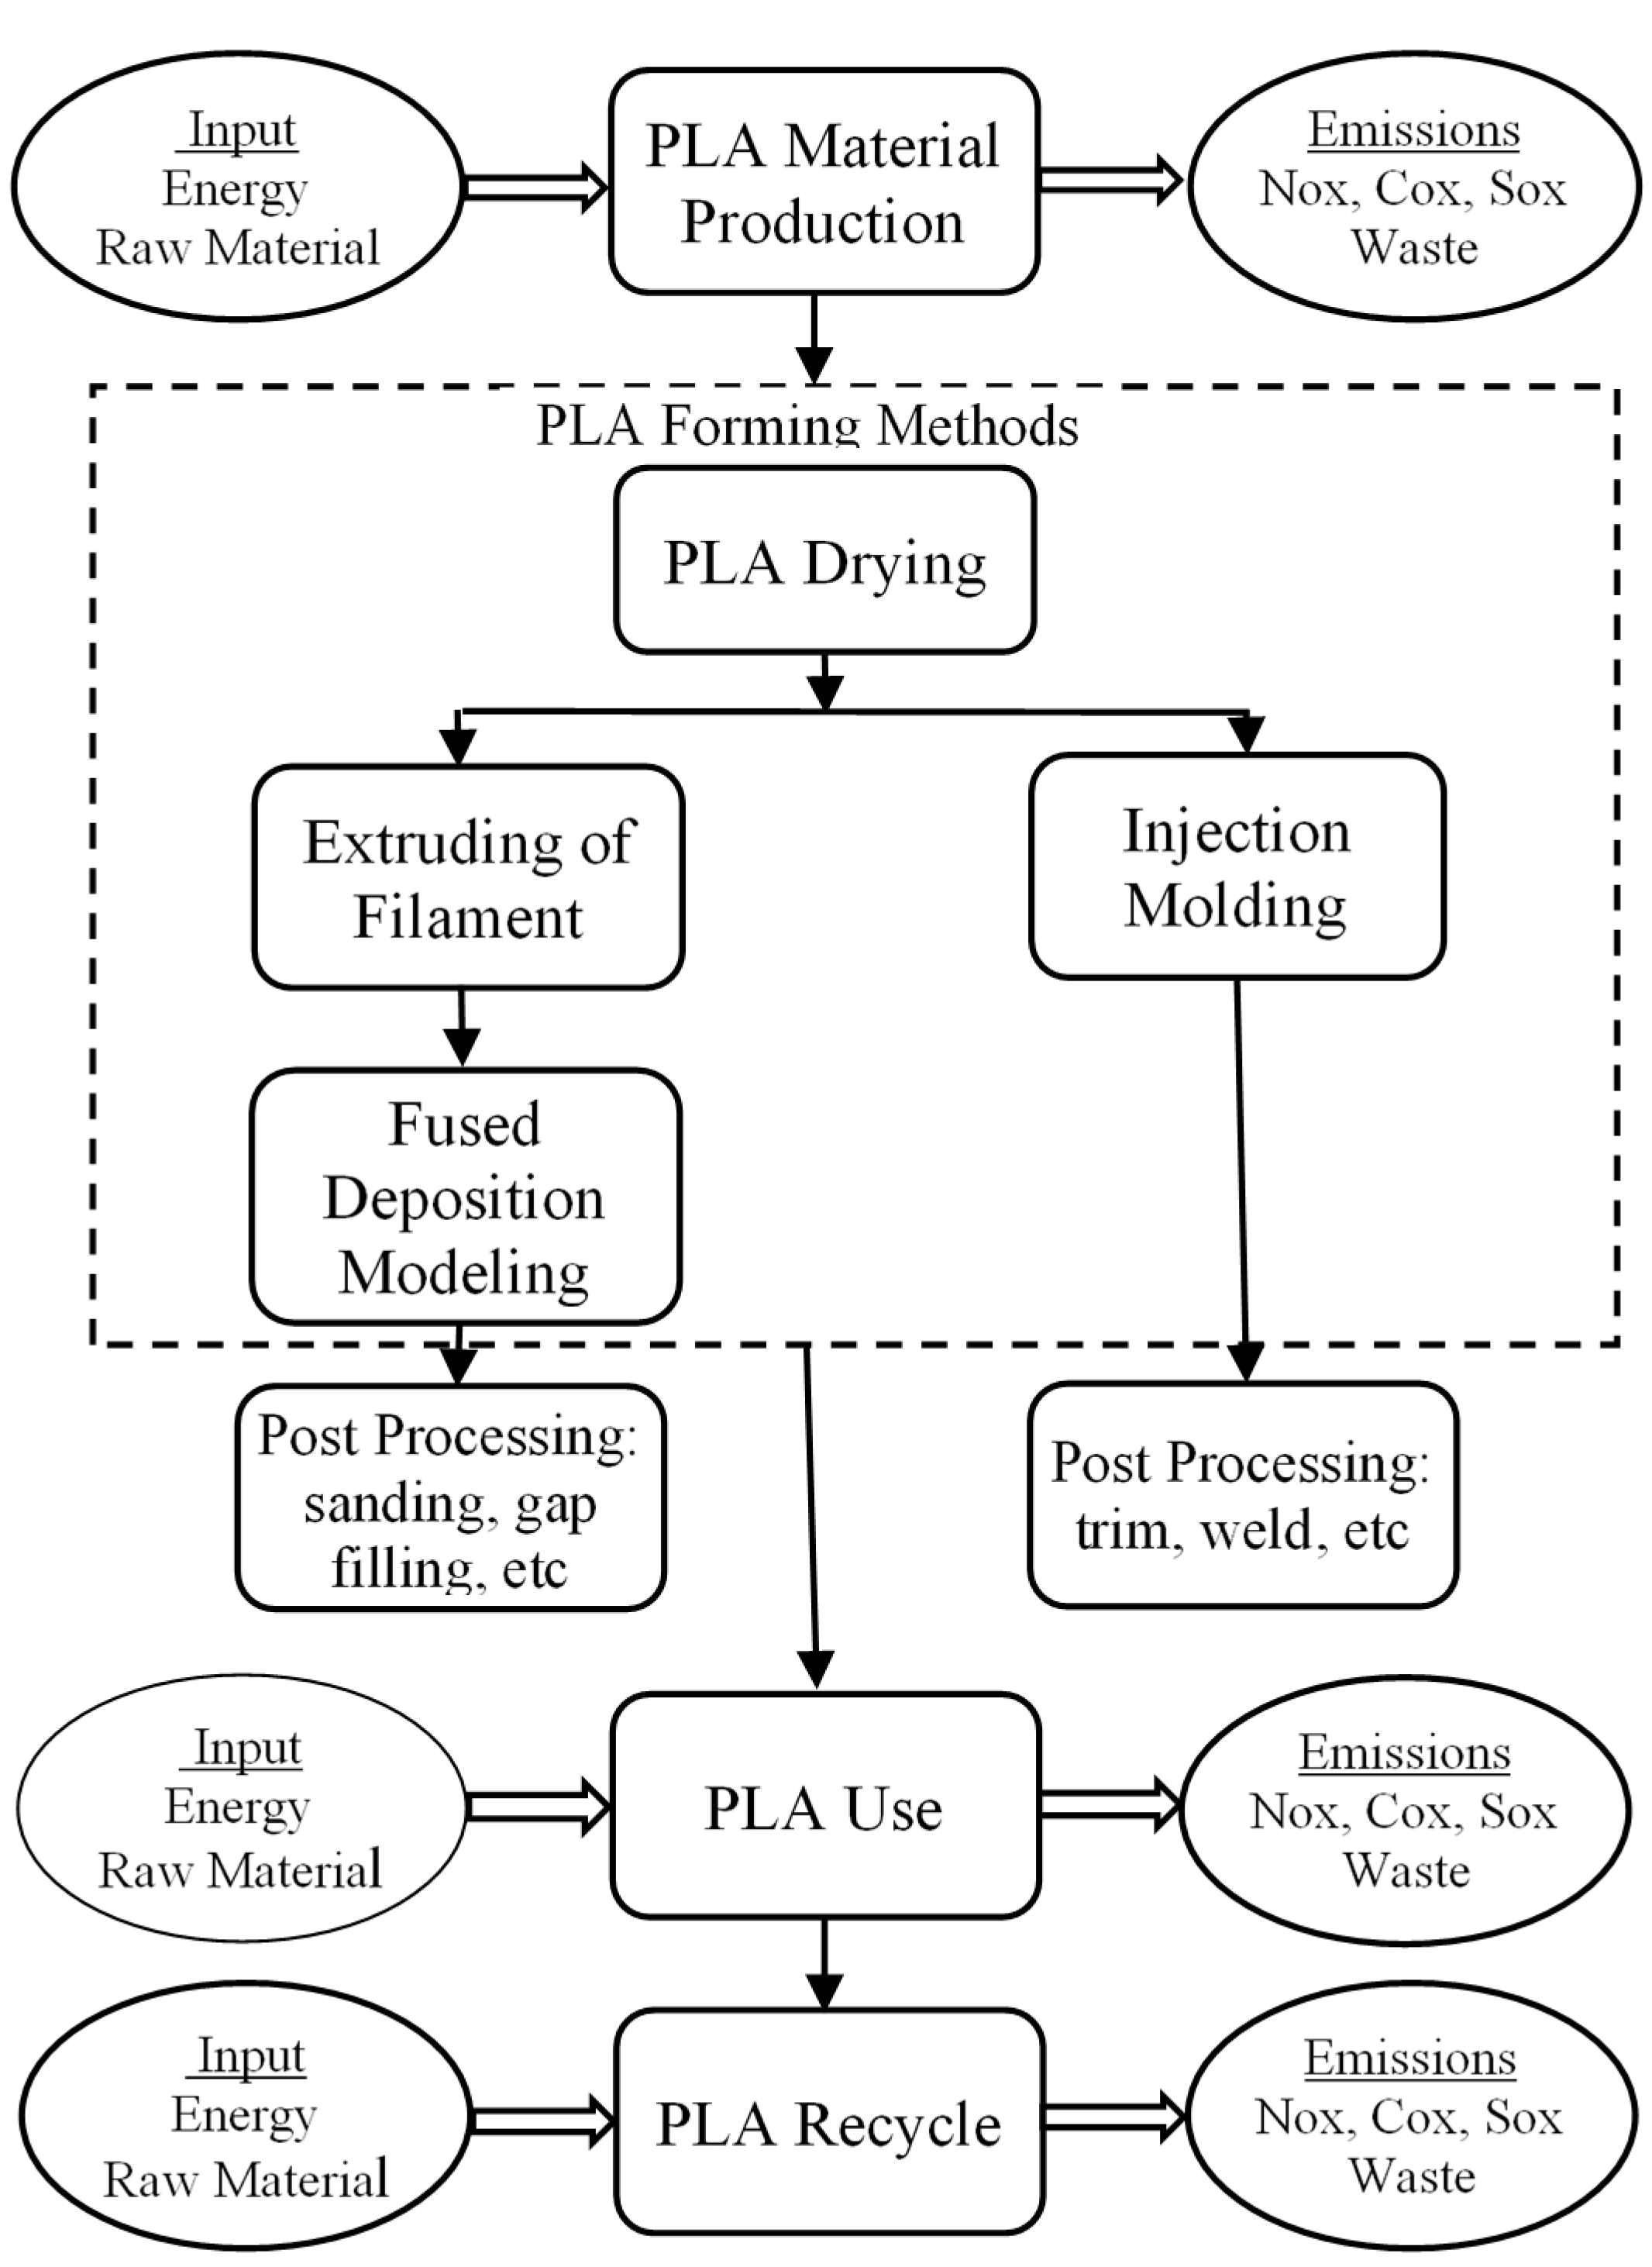
2.5. System Boundary

The system boundary is used to define which phases and processes from the life cycle assessment analysis will be included or excluded. The model will track the inputs and outputs from each of the unit processes associated with both FDM and PIM, from PLA resource extraction to transportation and to emission control measures. In this study, the system boundary includes the stages of the PLA life cycle, starting from material extraction from natural resources to PLA pellet production and PLA dog bone sample manufacturing, as illustrated in Figure 2. The energy consumption and eco-impact during the PLA usage and disposal are not considered.

2.6. Energy Model and Life Cycle Inventory (LCI)

The life cycle energy model focuses on the material production and forming phases of the PLA material. The material production energy is described by its embodied energy and is estimated with Equation (1). The embodied energy (EM) is the energy that is required to create 1 kg of usable PLA material from the required feedstocks (corn starch, sugarcane). PLA production will generally involve a natural feedstock such as corn that is planted, harvested, and transported to PLA production plants. At the production plant, the corn goes through wet milling in order to separate the starch, which is then mixed with acid or enzymes and heated to produce corn sugar (D-glucose). The glucose is fermented to produce L-lactic acid, which is the basic block of PLA. Embodied energy constitutes the energy required to go through these processes to produce 1 kg of PLA. Embodied energies are assessed by input/output analysis over a fixed period of time, during which the total energy input to the production plant is divided by the quantity of usable material shipped out of the plant as illustrated in Figure 2.
( E M ) P L A =   E n e r g i e s   e n t e r i n g   p l a n t   p e r   h o u r M a s s   o f   P L A   p e l l e t s   p r o d u c e d   p e r   h o u r
The total energy for primary PLA pellet production and dog bone forming is, therefore, given by Equation (2). The forming energy is influenced by the technique of forming the PLA into the final part, which, in this case, is a dog bone sample. The forming techniques considered in this study are the PIM and FDM manufacturing processes.
E T   =   E M   + E F i
where E T is the total energy consumed by the respective processes, E M is the energy consumed at the PLA material production phase (embodied energy), and E F i is the energy consumed during the manufacturing of the finished product, where i = A stands for additive manufacturing and i = M stands for injection molding. The E M   is generally established from several standard industrial practices and was extracted from the database of ANSYS Granta in this study. Table 1 shows the E M   and CO 2 emission of the PLA material used in this study. The evaluation of E F A   and E F M   is described in Section 2.6.1 and Section 3.2, respectively. In this study, the energy consumption and carbon emissions associated with the post-processing were not evaluated because support removal and trimming associated with the FDM and PIM processes, respectively, were very minimal. However, contrary to the PIM process, layer lines are generally present in FDM, making post-processing an important step if a smooth surface is required. Some post-processing methods can also add strength to FDM, helping to mitigate the anisotropic behavior of FDM parts compared to PIM. The FDM post-processing techniques identified are grouped into mechanical and chemical finishing techniques. Mechanical finishing includes support removal, sanding, cold welding, gap filling, polishing, priming and painting, vapor smoothing, dipping, epoxy coating, and metal plating. The FDM chemical finishing include manual painting, acetone dipping, electroplating/metallization, and vapor smoothing. Plastic injection molding has fewer post-processing techniques than FDM such as trimming, heat treatment, surface printing, electroplating, ultrasonic welding, etc. The FDM process has more post-processing demand in order to achieve better finish and mechanical properties and, therefore, will consume more energy with more corresponding carbon emissions.
The total carbon emission from energy consumption proposed by Jeswiet and Kara [2] will be used to access the environmental impact of the two manufacturing techniques as shown in Equation (3). The different techniques are connected directly to the amount of carbon emitted in producing electrical energy used by these processes. The new simple Carbon Emission Signature (CES) is therefore used by knowing CES for a power grid and the energy evaluated in Equation (2) to estimate the carbon emission.
C a r b o n   E m i s s i o n       =   C E S ×   E T
where E T   is the total energy requirement to form the desired PLA geometry ( M J ) and C E S is the carbon emission signature for energy ( k g   C O 2 / M J ). In the United States, an average 0.15 CESTM factor is used [2].

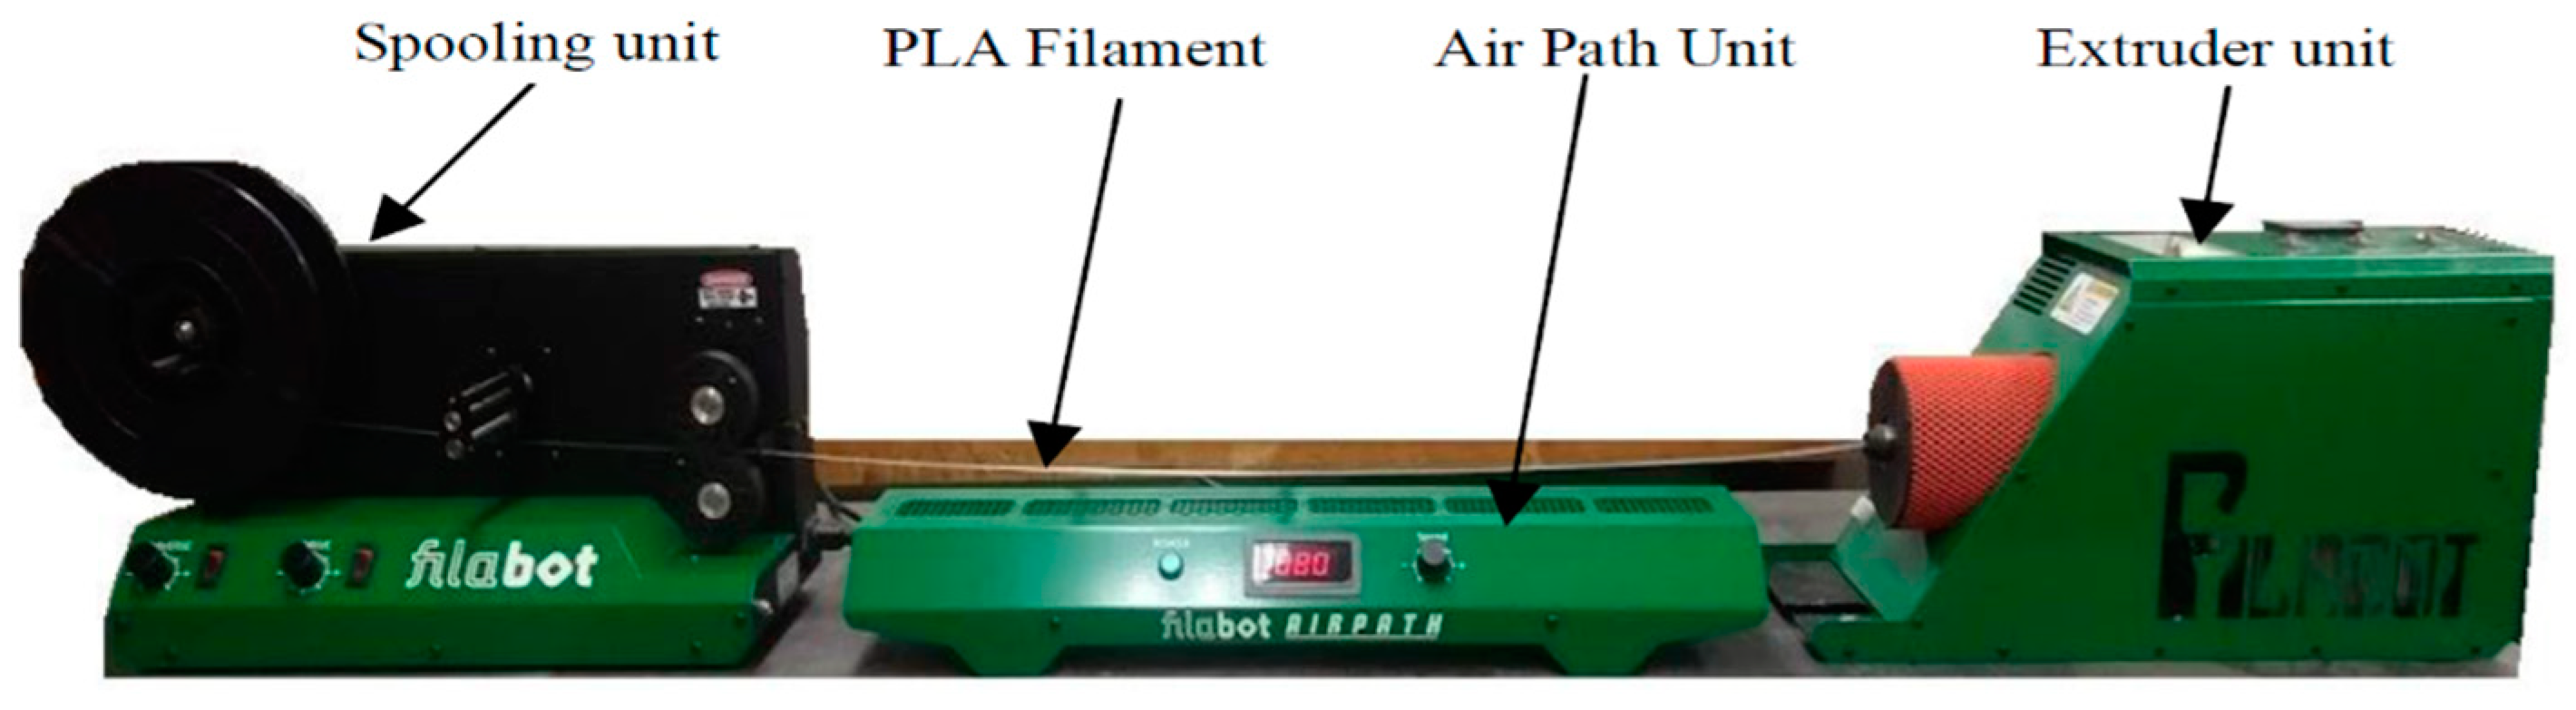
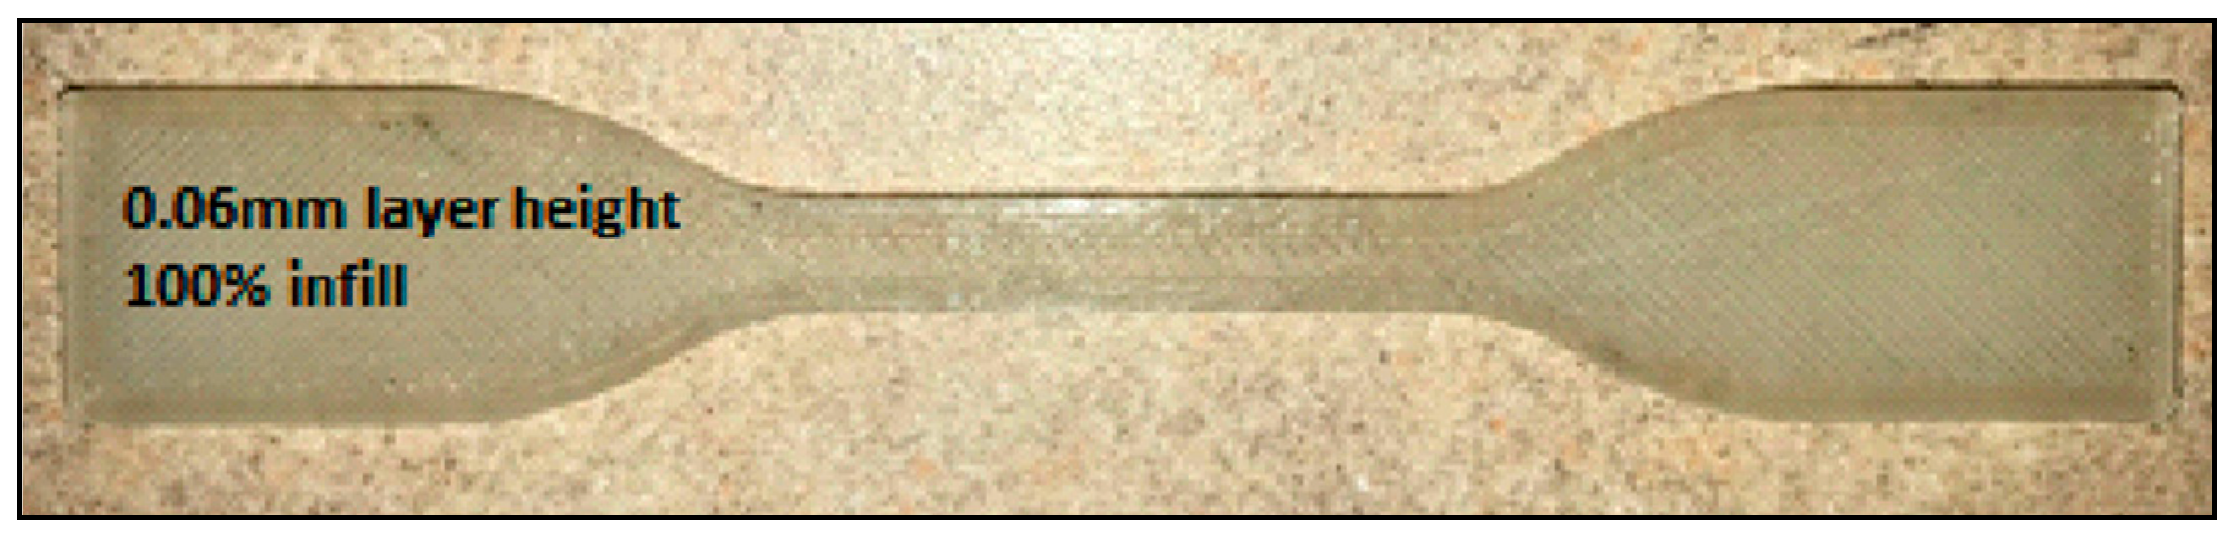
2.6.1. Fused Deposition Modeling Additive Manufacturing

The PLA product fabrication by FDM additive manufacturing involves extrusion of the PLA pellets into filament and making the part with an FDM machine, as illustrated in Figure 1. A Filabot system comprising extruder, air path, and spooling units was used to extrude a PLA filament with a diameter of 2.75 mm, as shown in Figure 3. The extruder temperature was set at 190 °C. This temperature was defined based on pre-experimental runs within the range of temperatures (175 to 195 °C) recommended by the manufacturer to extrude the PLA material. A good extruded filament is easy to handle (when exiting the nozzle) and free of bubbles and unmolten regions. The filament diameter was achieved by frequent measurement of the filament diameter using a caliper while altering the spooler rotational speed until a diameter of 2.75 ± 0.05 mm was maintained. An energy meter was used to measure the energy consumption by the three units during the PLA filament extrusion. Several dog bone-shaped samples were built with the PLA filaments using an in-house FDM Ultimaker S3 three-dimensional (3D) printer. The simple dog bone shape was based on the ASTM D638 Type IV standard, which is used for tensile testing of plastic materials, shown in Figure 4 and Figure 5. The energy committed to the production of dog bone samples is modeled with Equations (4)–(6).
E F A   =   E X A   +   E P A  
E X A   = E   X e x t r u d e   +   E X c o o l i n g   +   E X s p o o l i n g
E P A = E P r e F D M + j = 1 n E F D M j + E P o s t F D M
where   E F A is the total forming energy with FDM additive manufacturing, E X A is the energy committed to the extrusion of PLA filament, and E P A is the energy commitment to the FDM of PLA dog bone-shaped samples. The j = 1 n E F D M j term represents the sum of consumed energies for printing n number of dog bones in one session, where   j represents the j t h dog bone. The FDM total energy analysis comprises the sum of embodied energy of PLA, filament extrusion energy, and FDM forming energy. For FDM, the total energy for PLA production in Equation (2) can be expressed as Equation (7).
E T   = ( E M E ) E m b o d i e d   + ( E   X e x t r u d e   +   E X c o o l i n g   +   E X s p o o l i n g ) F i l a m e n t   + ( E P r e F D M + j = 1 n E F D M j + E P o s t F D M   ) F D M  
The total forming energy using FDM ( E F A ) to produce a 6.53-g dog bone shape was estimated at 0.333 kWh per sample using Equation (4) and experimental data. Using Equation (4) and measurements from the experiment, the total energy consumption per unit dog bone sample was 0.009 kWh. The Ultimaker 3D printer parameters considered for printing the dog bone samples are listed in Table 2. Detailed energy measurements during the different process steps of filament production and dog bone printing are discussed in Section 3.1.

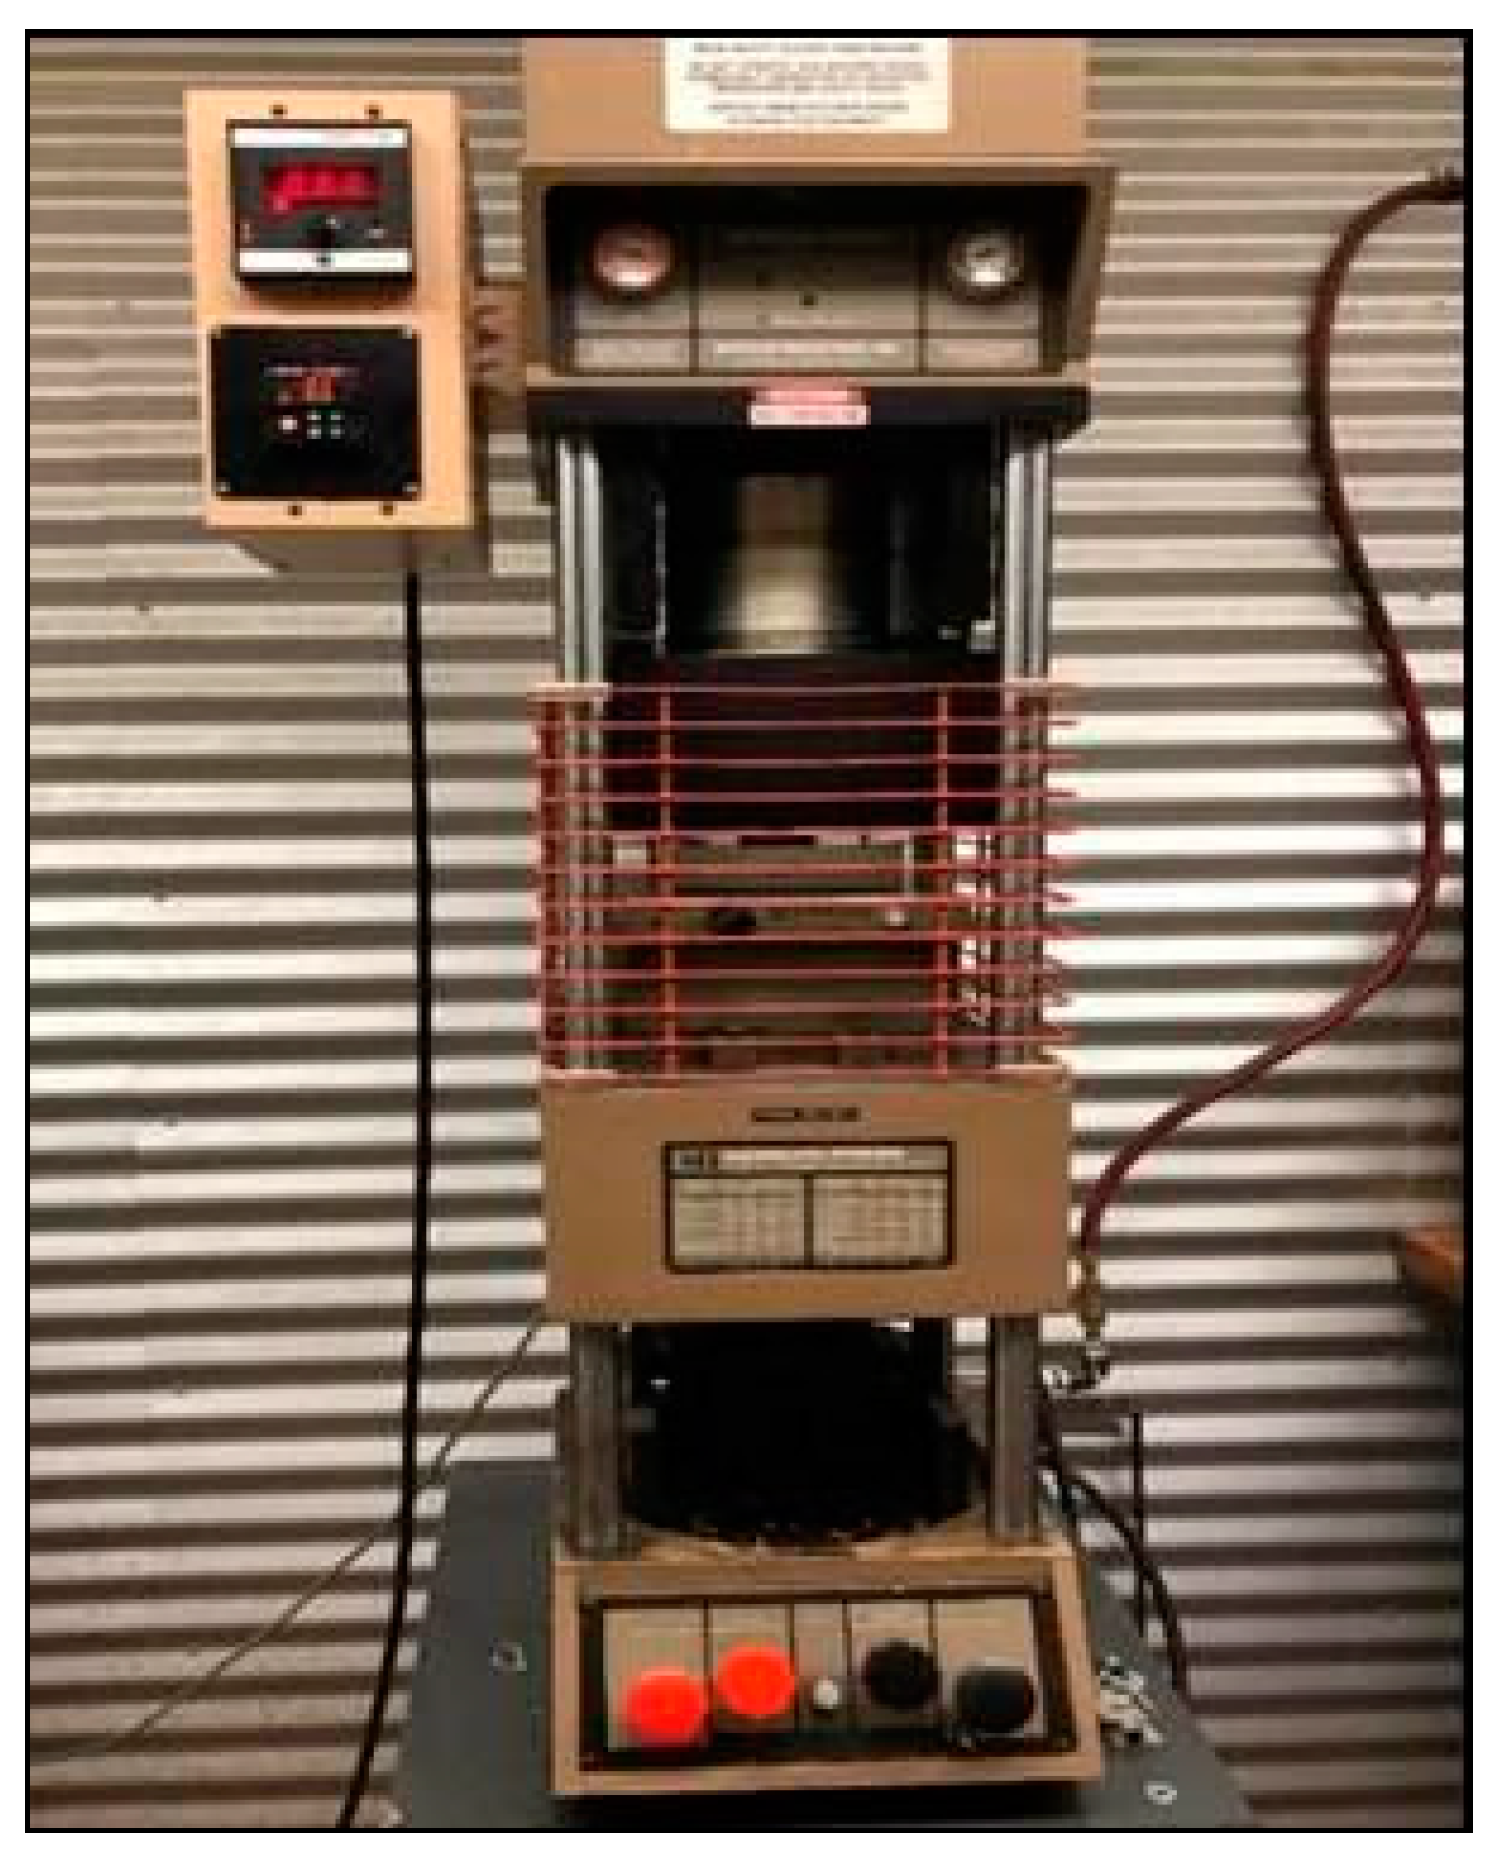
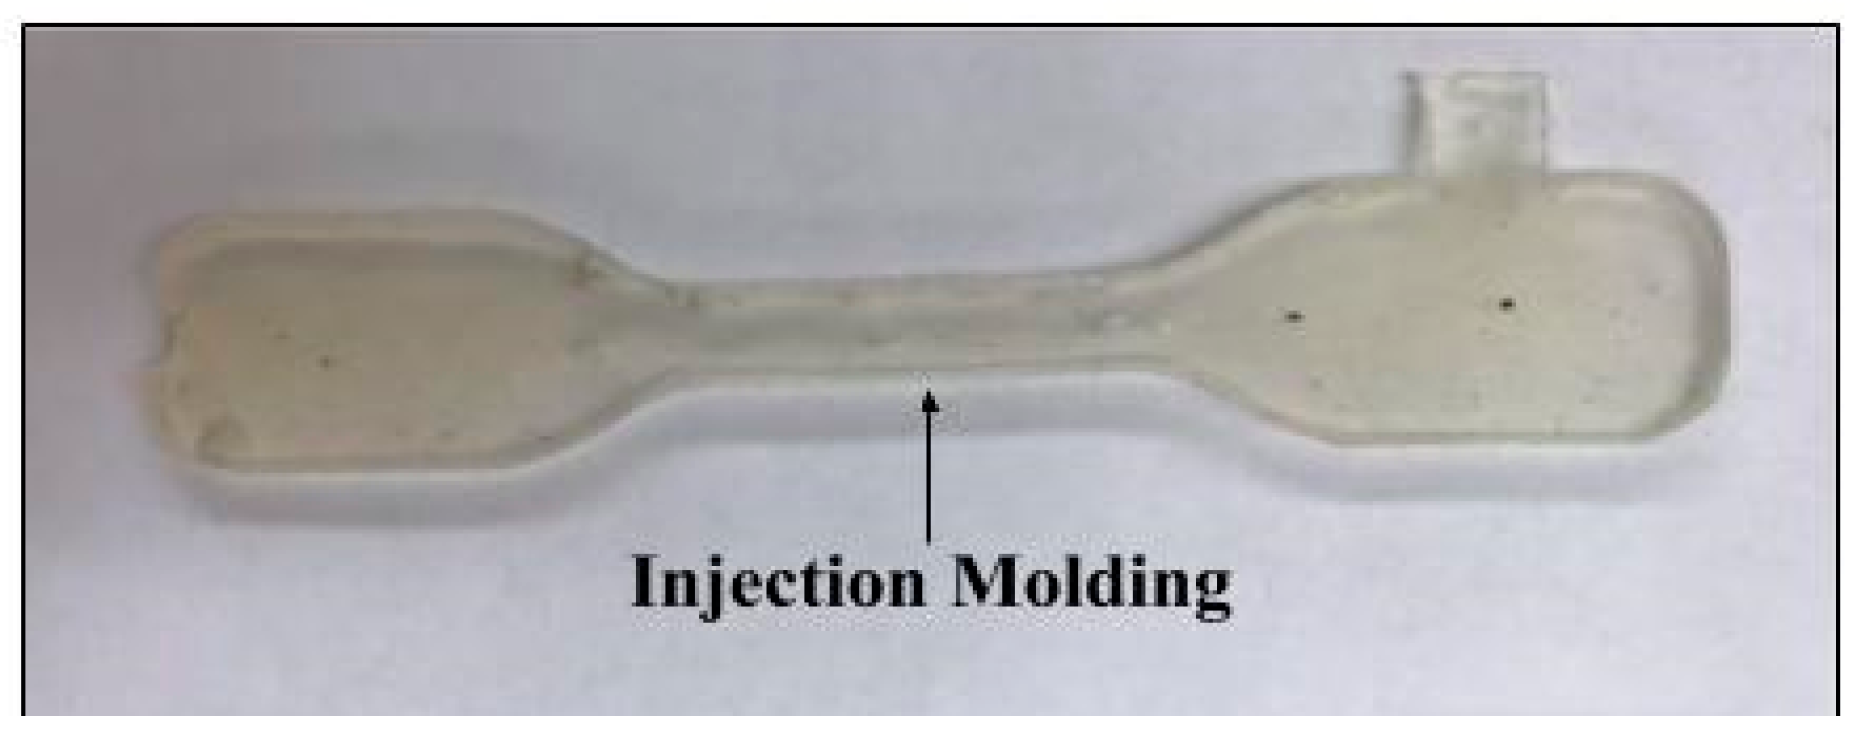
2.6.2. Injection Molding Manufacturing

The same PLA dog bone was manufactured using an electric Morgan Press G-125T injection molding machine, shown in Figure 6. The energy consumed during this process was directly measured with an electric meter and is represented as E F M . The PIM defects that incur energy such as flash and jetting were eliminated from the process by using the optimal parameter levels that were determined from pre-experimental runs. The PIM parameters considered for making the dog bone samples are listed in Table 3 and the injection-molded sample is shown in Figure 7. Detailed energy measurements recorded during different injection stages to make the dog bone samples are discussed in Section 3.2.

3. Results and Discussion

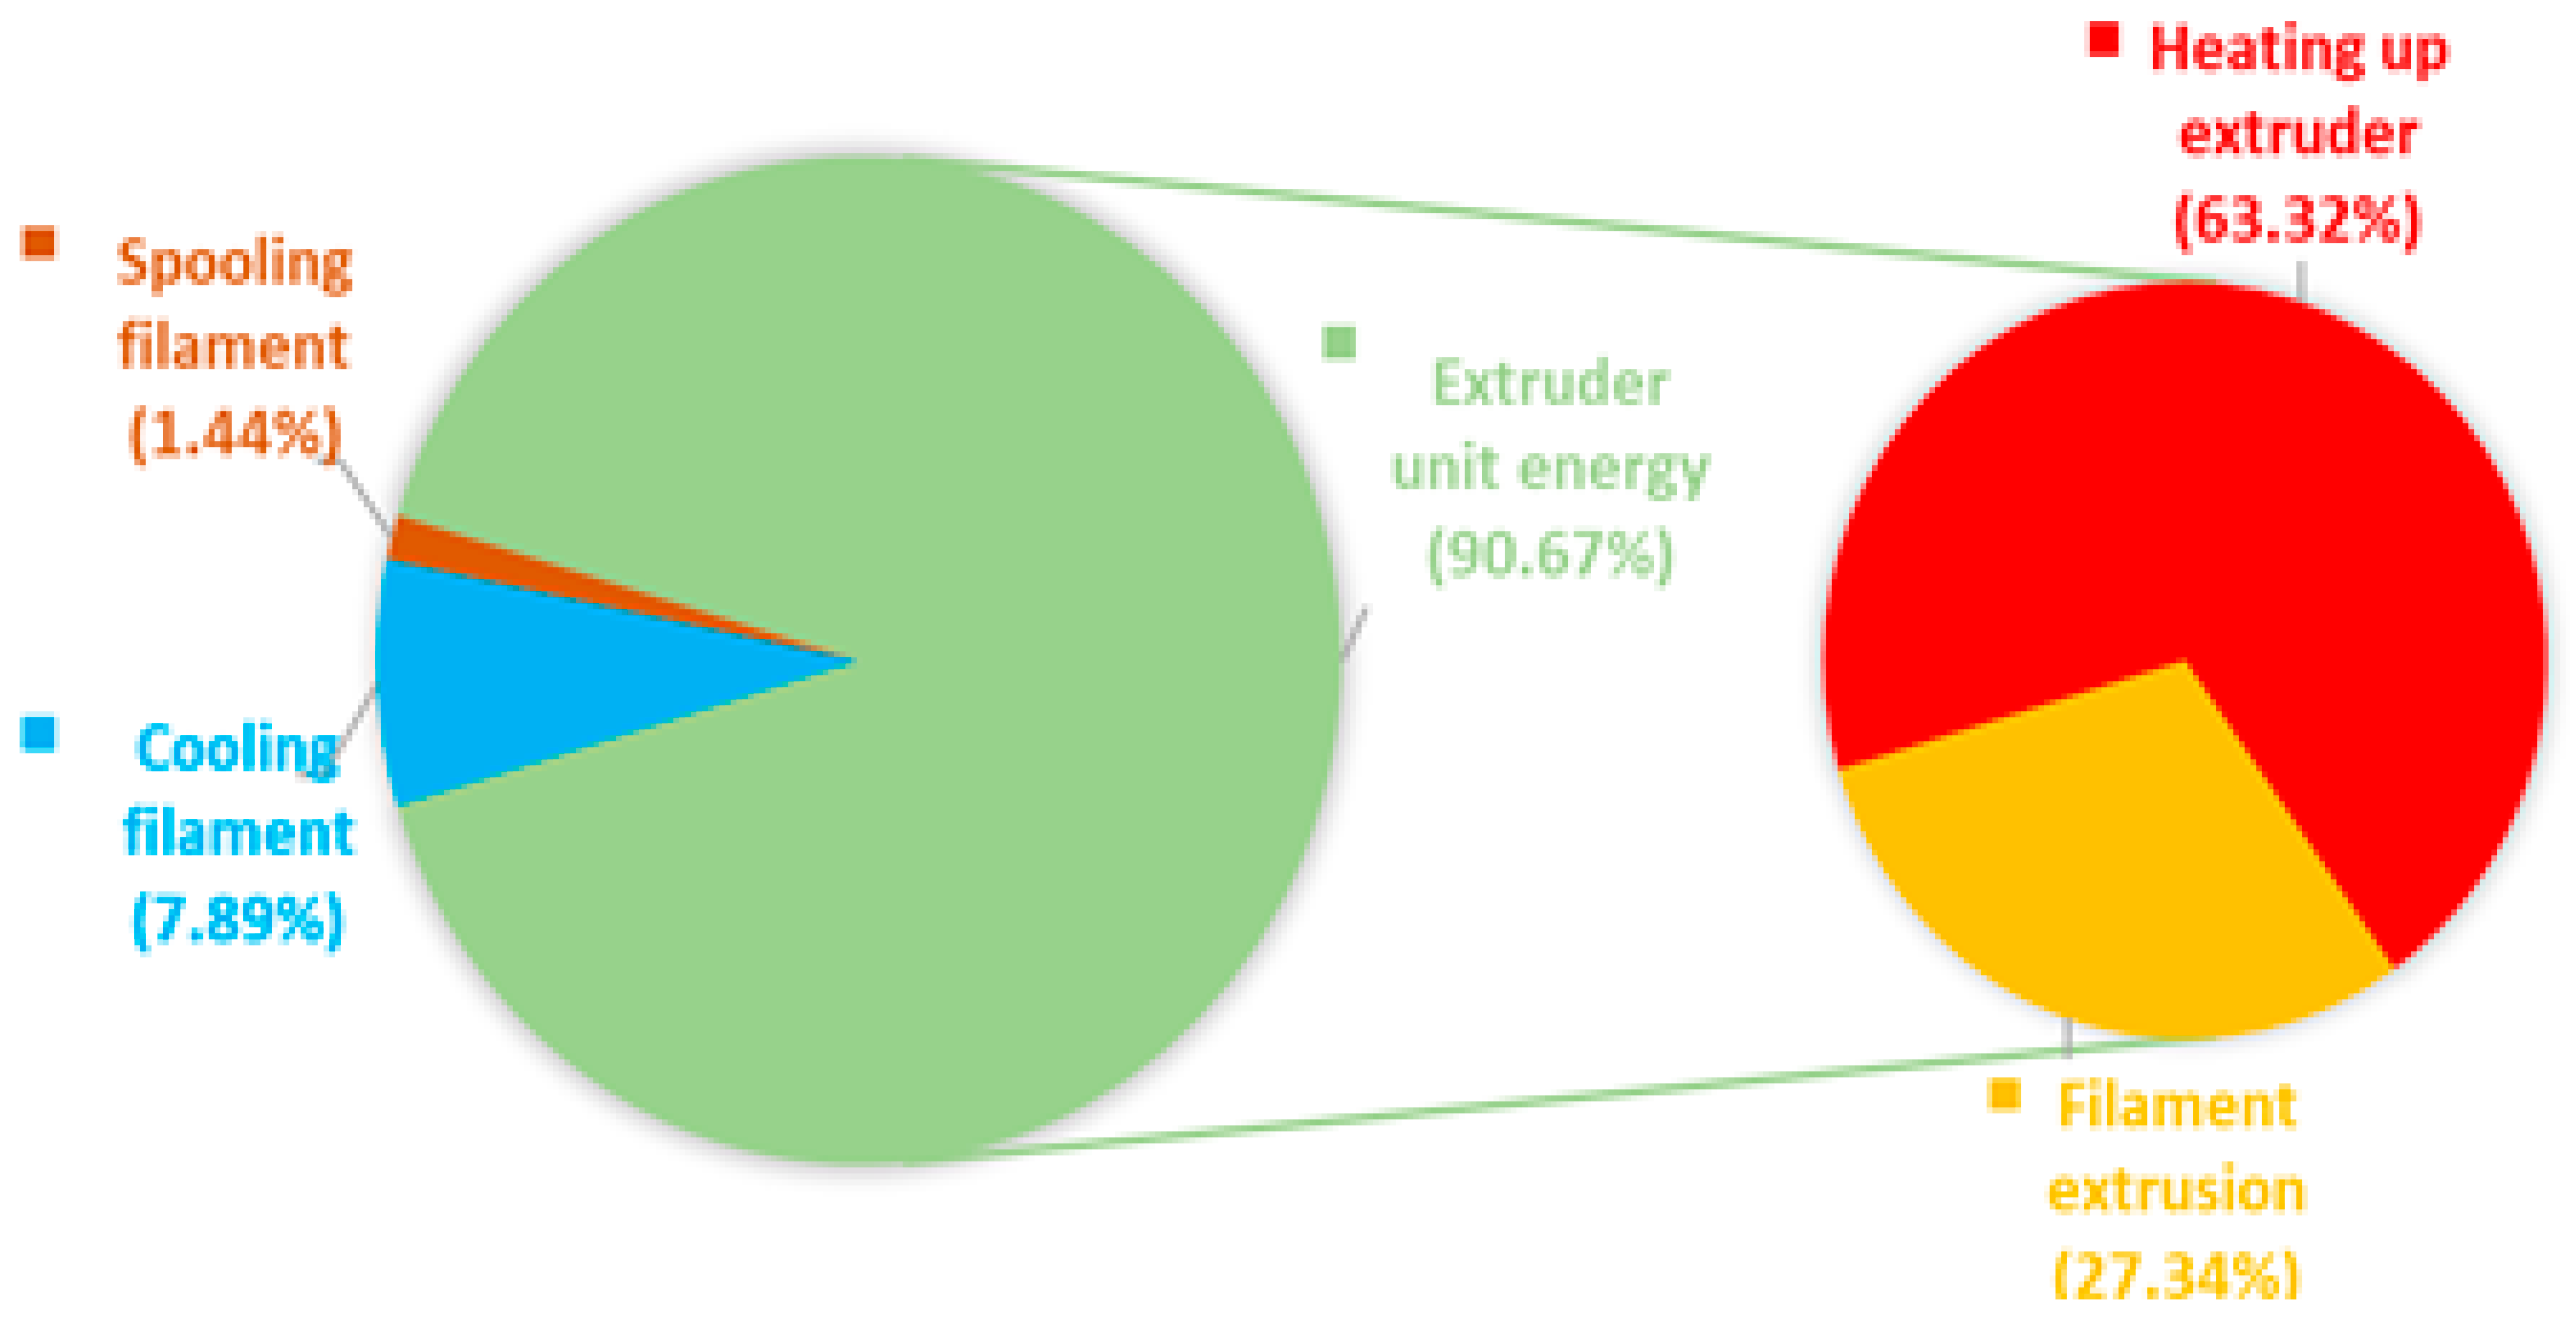
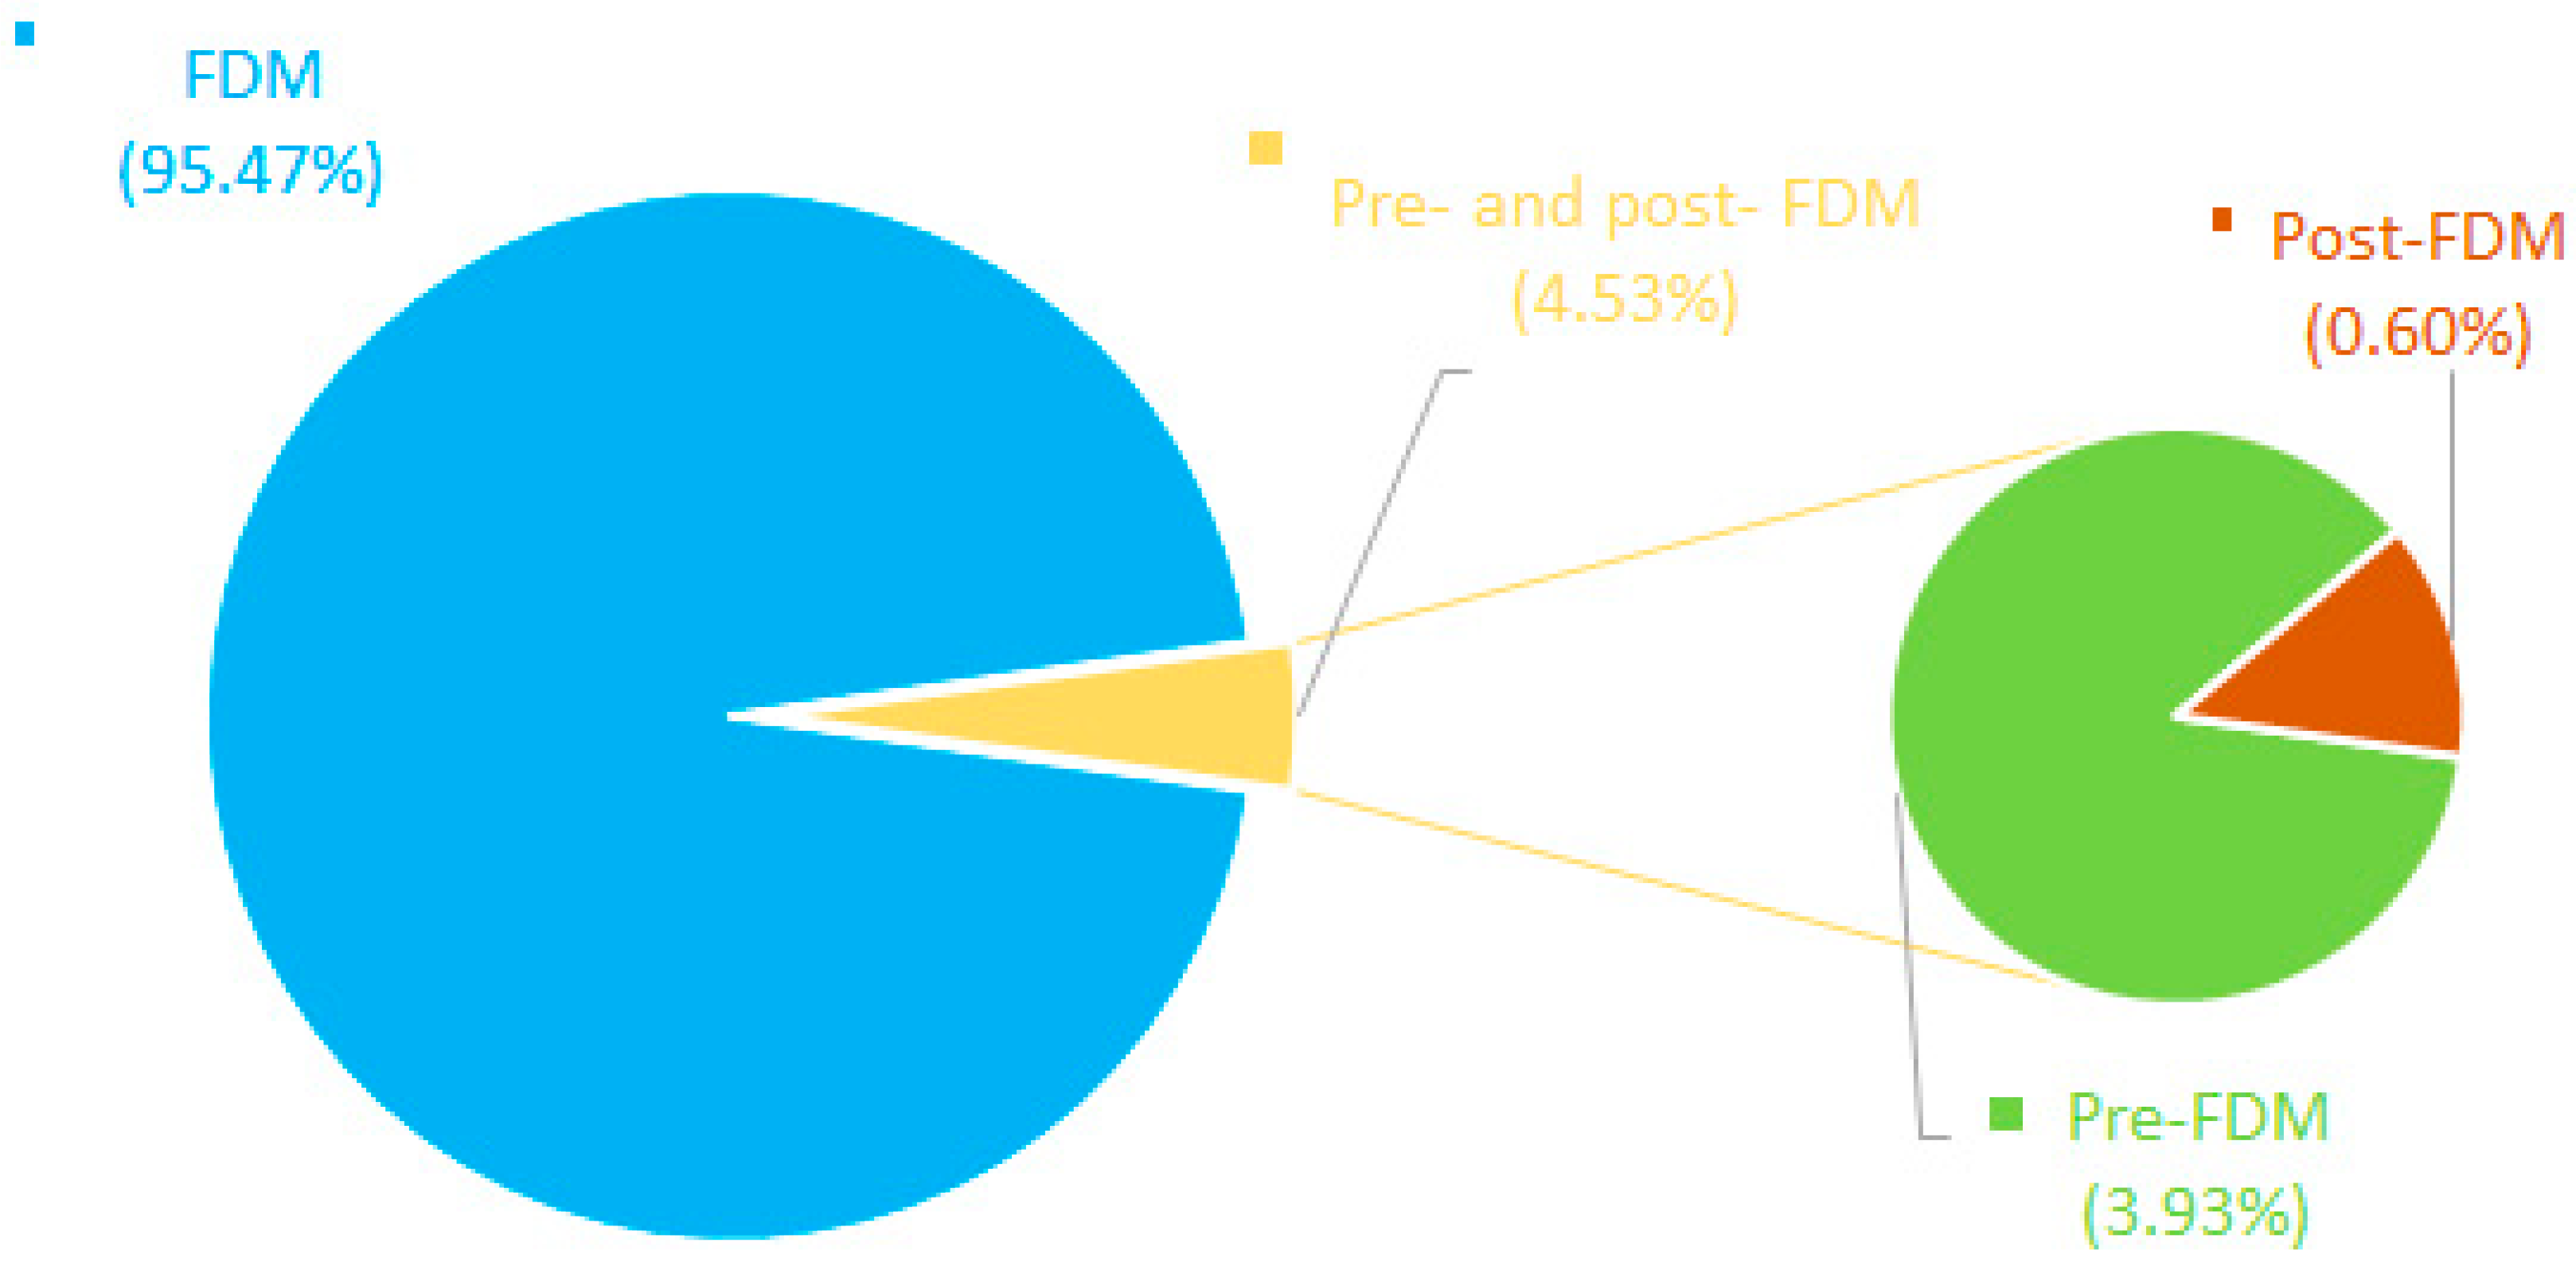
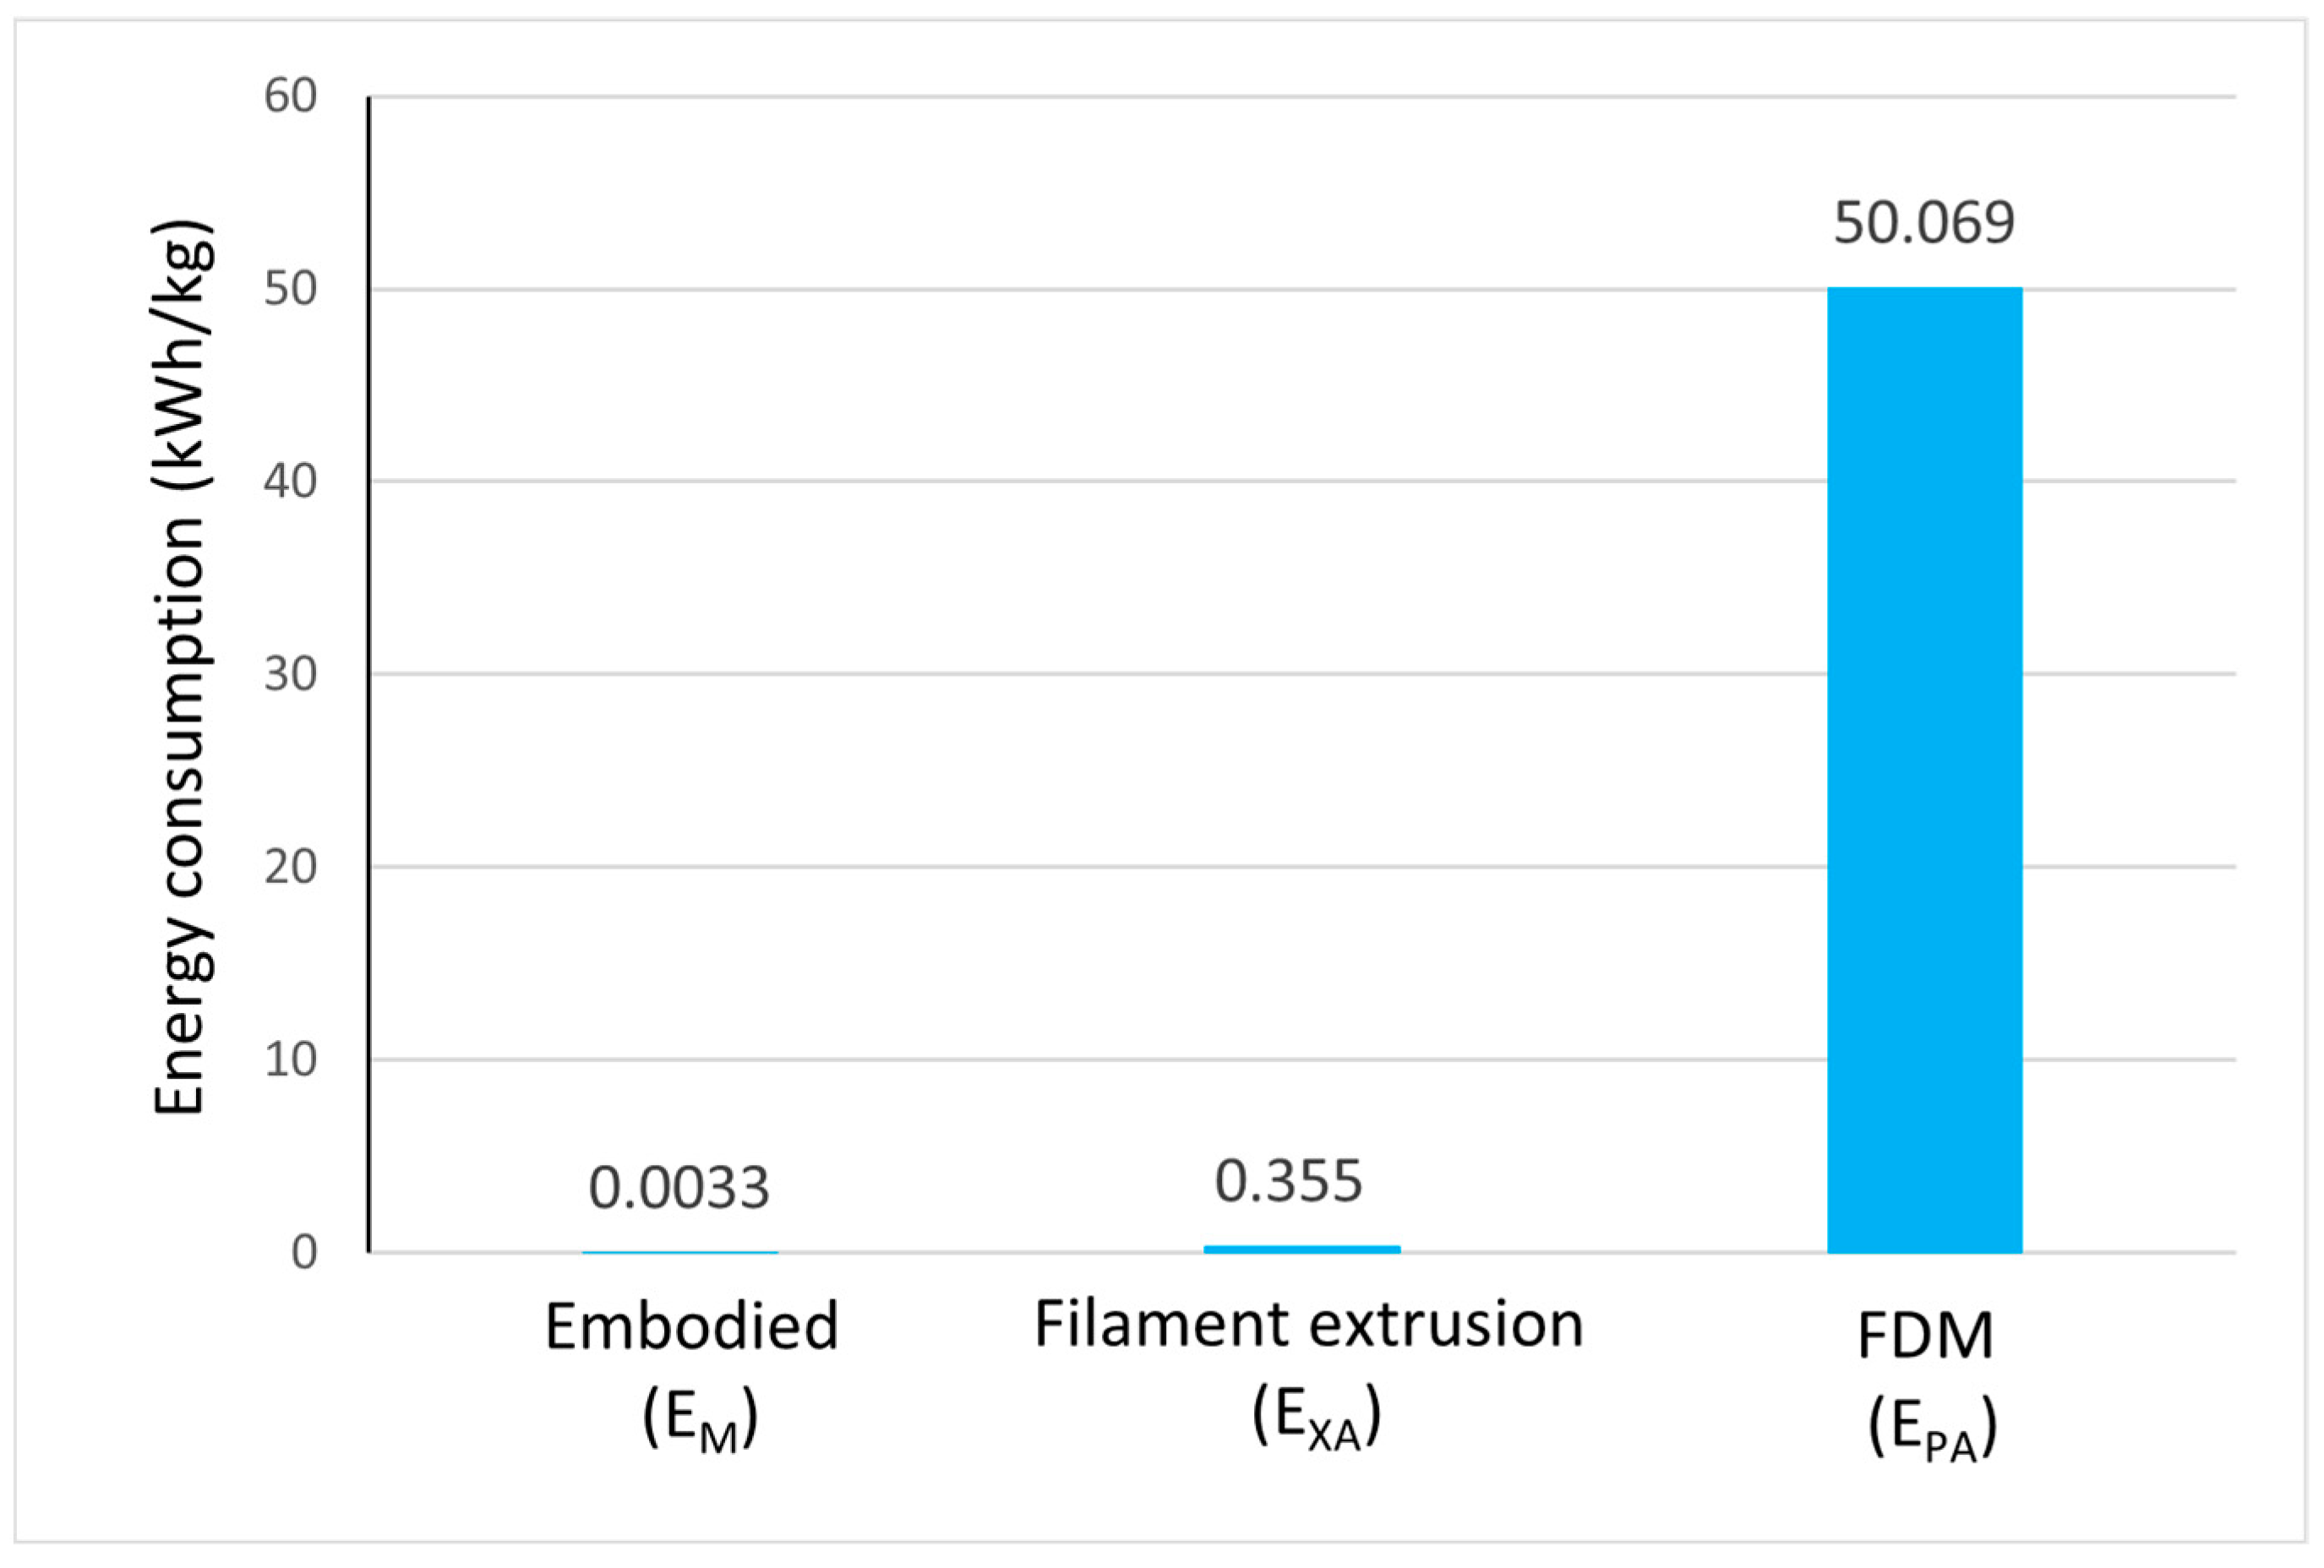
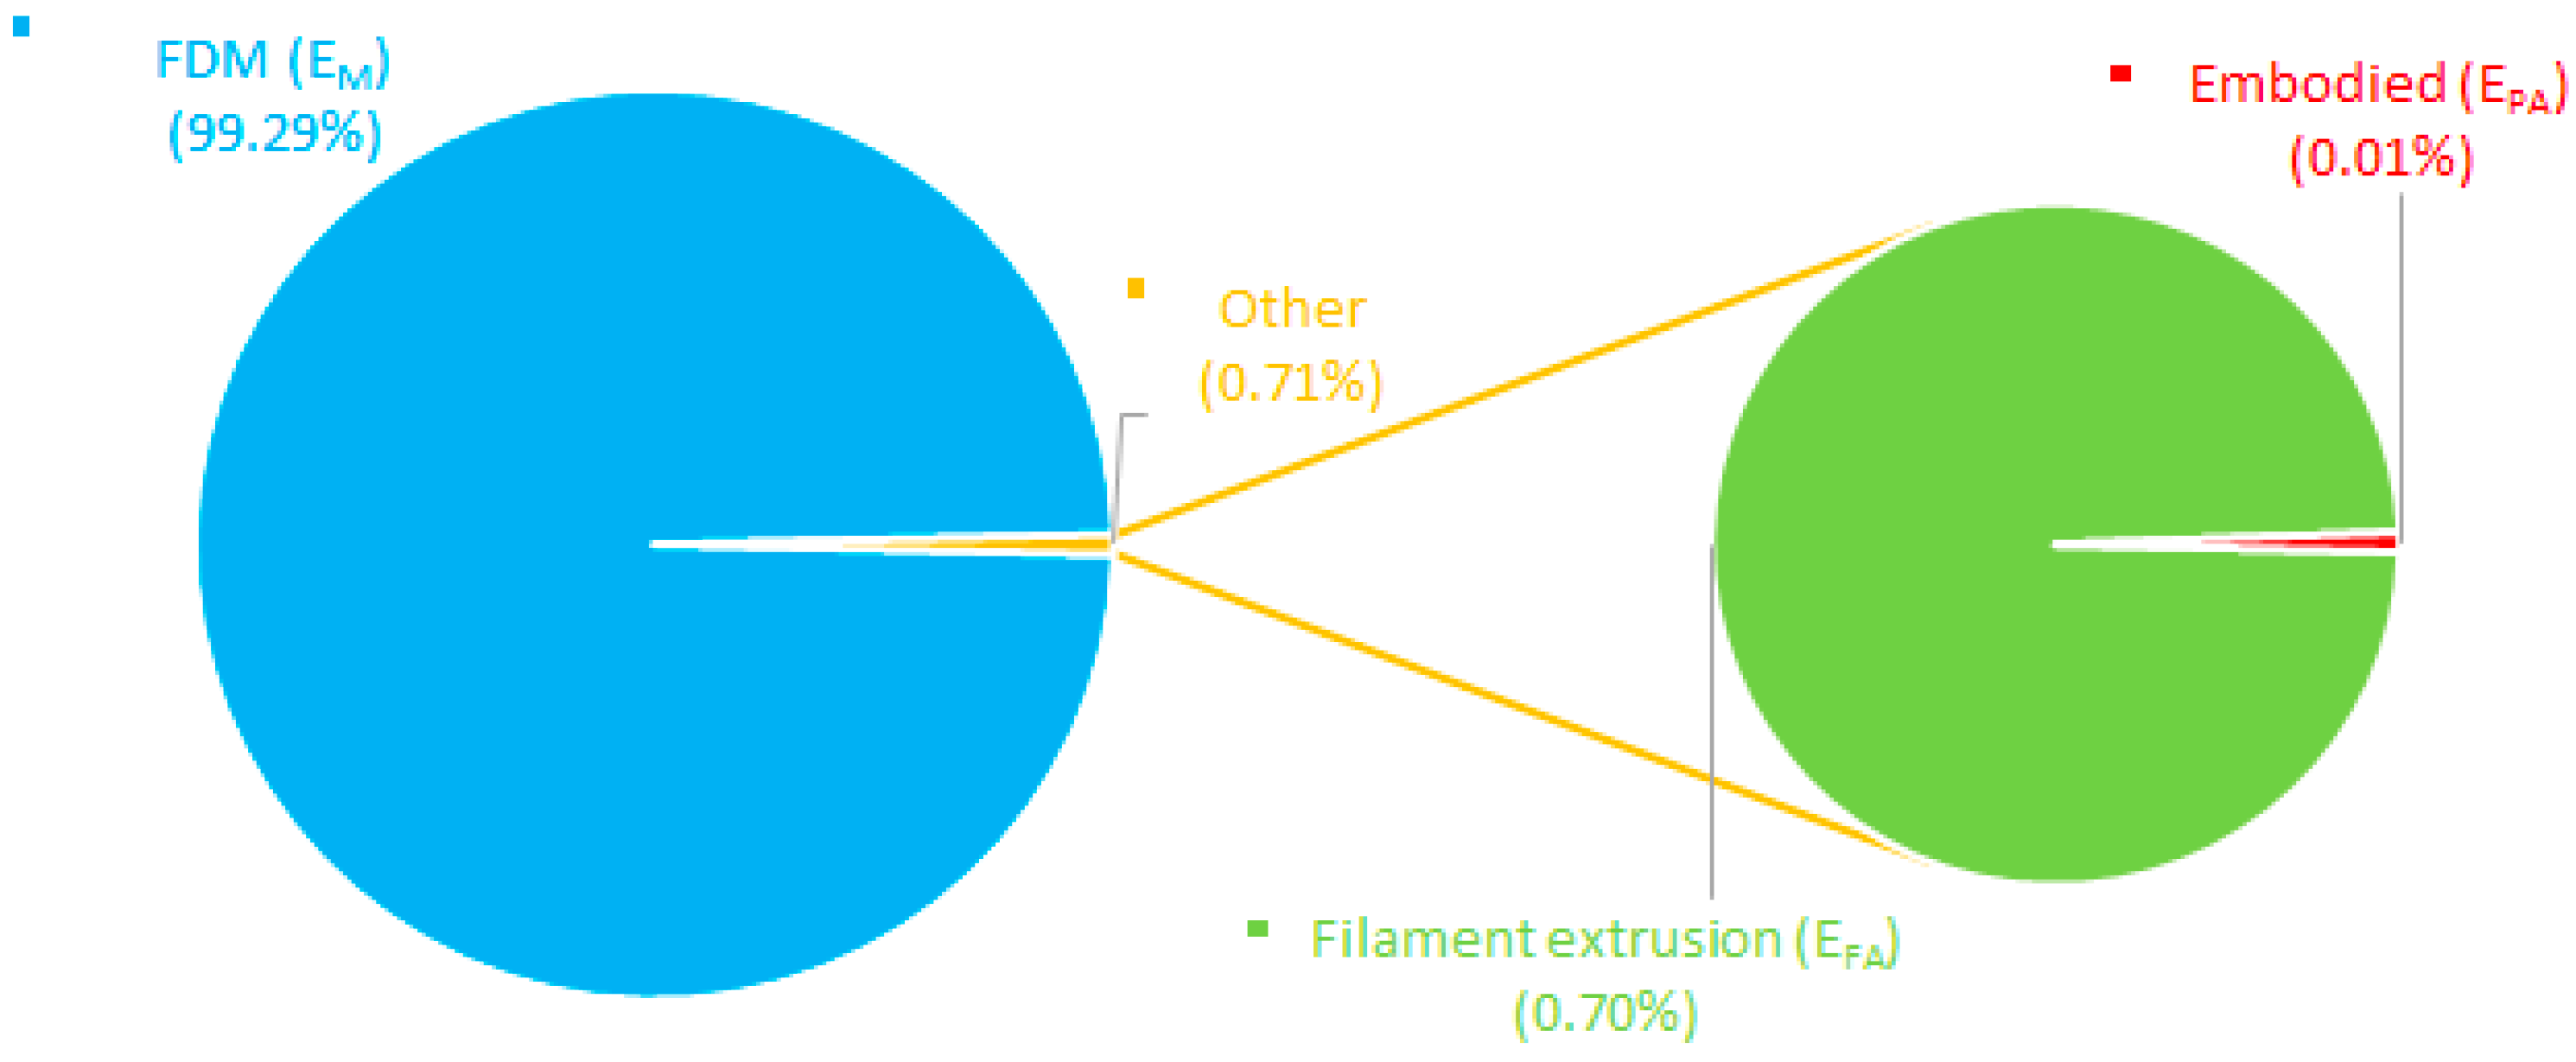
3.1. Energy of Fused Deposition Modeling Forming

A spool of PLA filament weighing 195.921 g was produced by extrusion, with a total energy consumption of about E X A =   0.0695 kWh, as shown in Table 4. This is equivalent to a functional unit of about 0.355 kWh per kg of PLA extruded. The energy consumption percentage of each unit of the Filabot system during the filament extrusion process is shown in Figure 8. About 90.67% (functional unit E   X e x t r u d e =   0.322 kWh/kg) of the consumed energy during filament extrusion was accounted for by the extruder unit, wherein about 63.32% (0.225 kWh/kg) of extruder unit energy was consumed during heating up of the extruder. The impact of heat-up energy percentage can be decreased by extruding more material (filling more than one spool in one extrusion session). The air path and spooling units accounted, respectively, for about 7.89% (functional unit E X c o o l i n g =   0.028 kWh/kg) and 1.44% (functional unit E X s p o o l i n g =   0.005 kWh/kg) of the energy consumption during this filament extrusion process.
The power consumption during FDM of one dog bone-shaped sample (6.53 g) was measured at E P A =   0.331 kWh, as shown in Table 5. This resulted in functional unit energy consumption during FDM of PLA of about 50.069 kWh per kg. The energy consumption percentage of each stage during the FDM of a dog bone is illustrated in Figure 9. Most of the energy (95.47%) during the FDM of the dog bone was consumed during the FDM (printing) process. The pre- and post-FDM accounted only for about 4.53% for the consumed energy—3.93% pre-FDM and 0.60% post-FDM. The consumed energy percentage for pre- and post-FDM can be decreased by printing multiple dog bones in one printing session, as discussed in Section 3.3.
The three major types of energy per kg for fabricating the dog bone are shown in Figure 10. The values of these energies were used in Equation (7) to evaluate the total energy consumed ( E T ) to print 1 kg mass of PLA by FDM as follows: (0.0033 + 0.355 + 50.069) kWh = 50.427 kWh per kg. It is deduced that the actual fused deposition modeling of PLA has a significant dominance of about 99.29% of the total energy consumption of the forming of PLA by FDM, as illustrated in Figure 11. This indicates that more focus on optimizing the FDM process parameters to decrease energy consumption can be explored, especially the extrusion (printing) phase, which has the highest value of energy consumption, as shown in Figure 9.

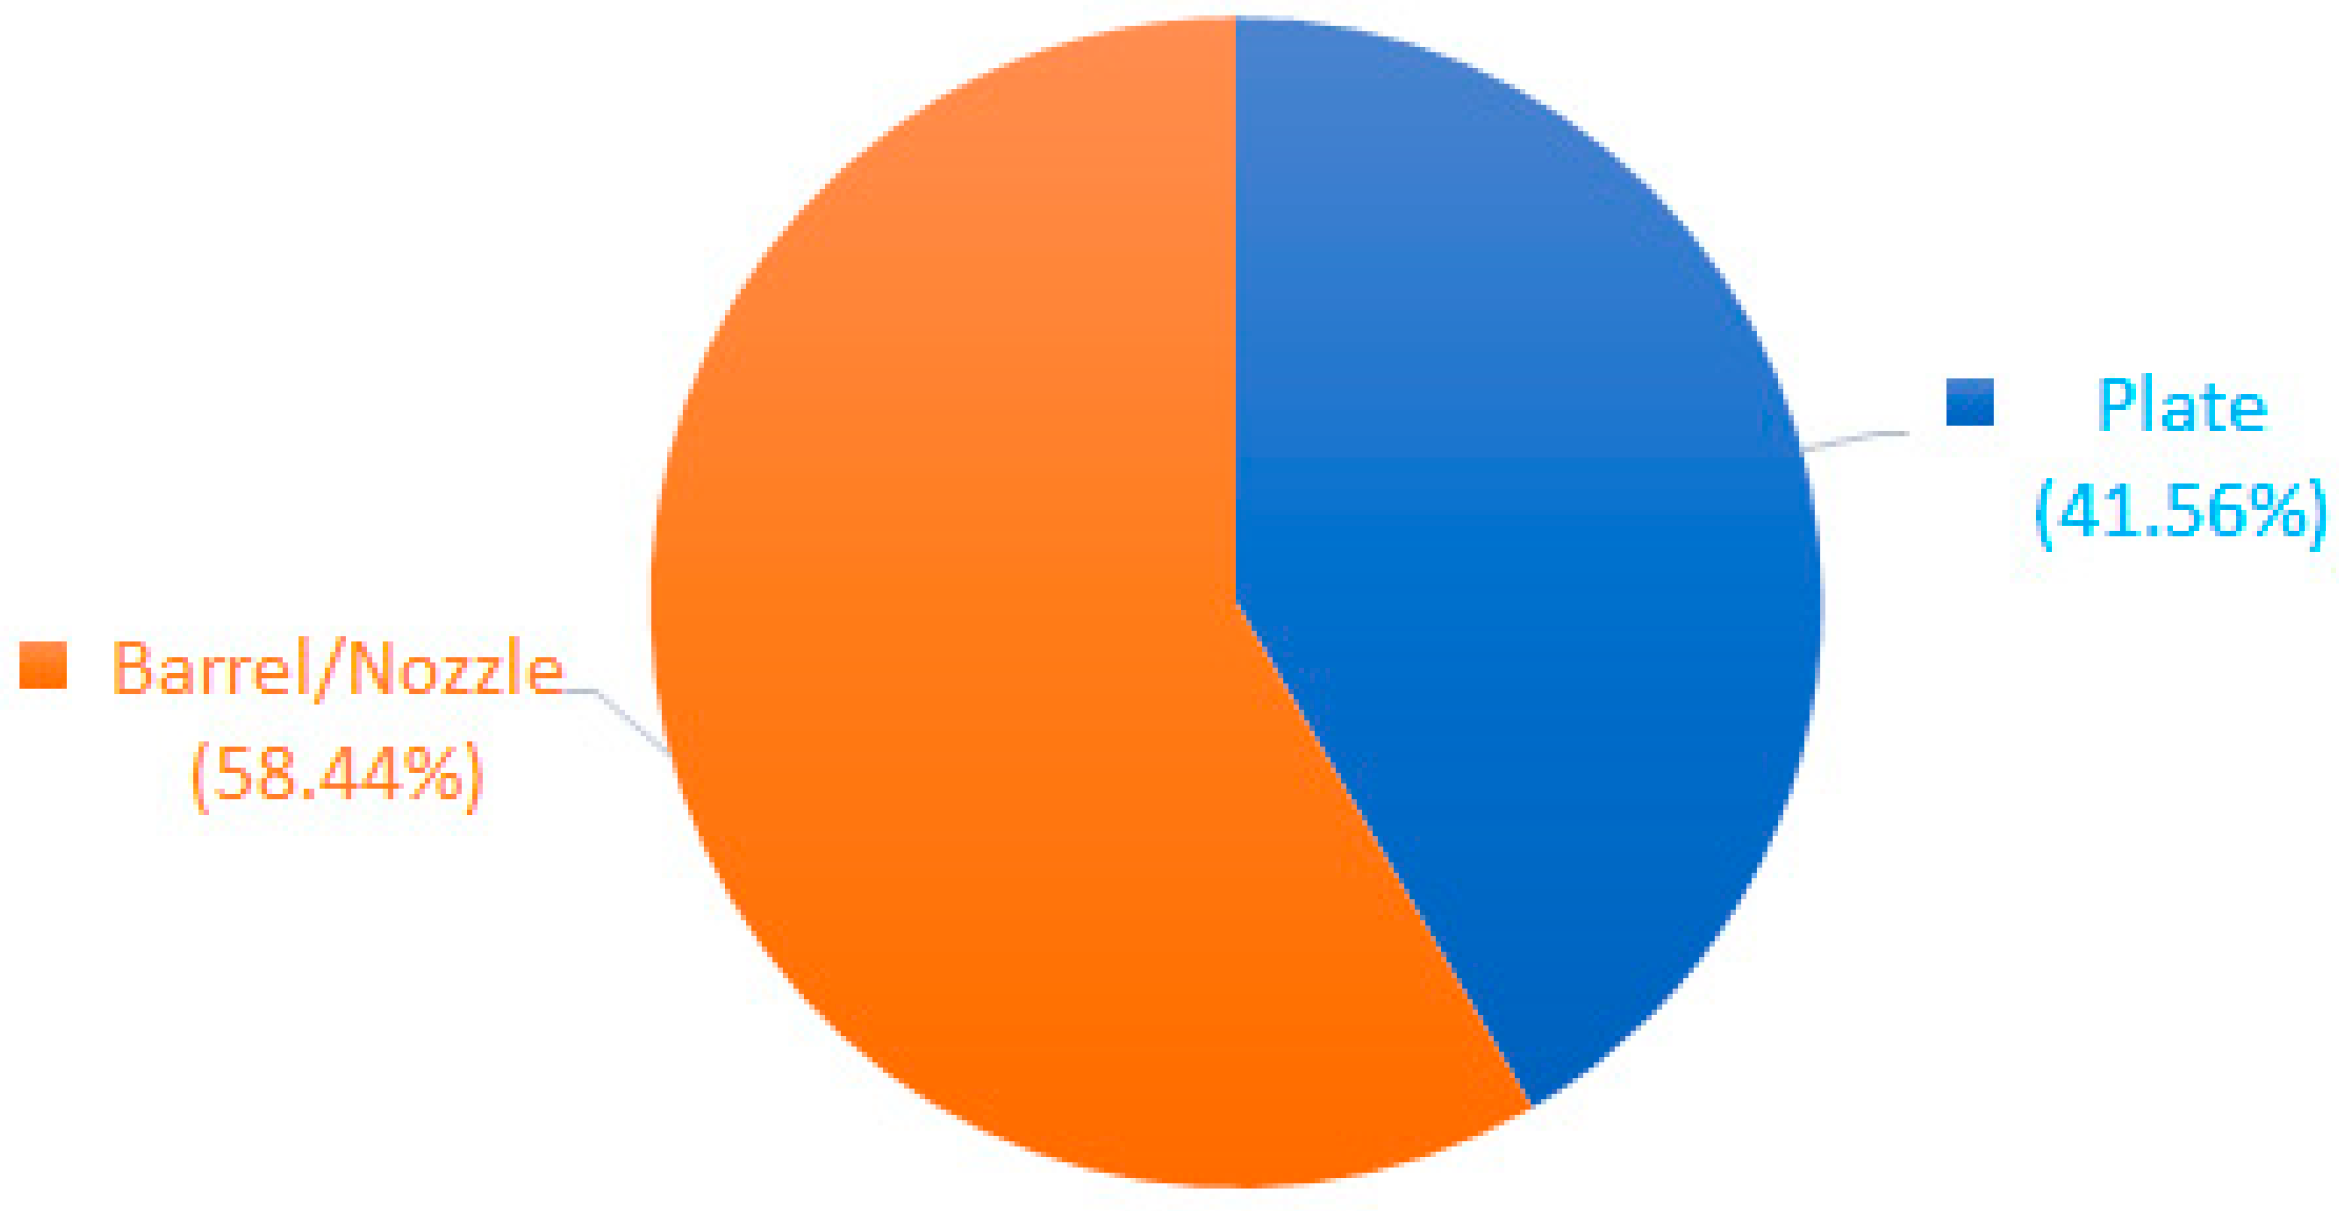
3.2. Energy of Injection Molding

The electric injection molding machine described in Section 2.6.2 was used to form the same dog bone to allow for energy consumption comparison. The total energy consumption during injection molding to produce the dog bone was measured at E F M = 0.474 kWh, as shown in Table 6. This resulted in a functional unit energy consumption of 36.49 kWh per kg. The two major elements of the process that accounted for this energy were maintaining the temperatures of the plate and barrel/nozzle, and the percentage of energy consumption of each is shown in Figure 12. The barrel/nozzle accounted for about 58.44% while the plate accounted for 41.56% of the energy consumption during the injection molding of the dog bone sample. Most of the PIM energy was consumed during heating up of these elements—40.51% for heating the plate and 57.38% for heating the barrel/nozzle. The energy spent during the injection process was about 1% of the total injection molding energy. The opportunity for sustainable PIM can be found in the design of efficient barrel/nozzle and plate elements.

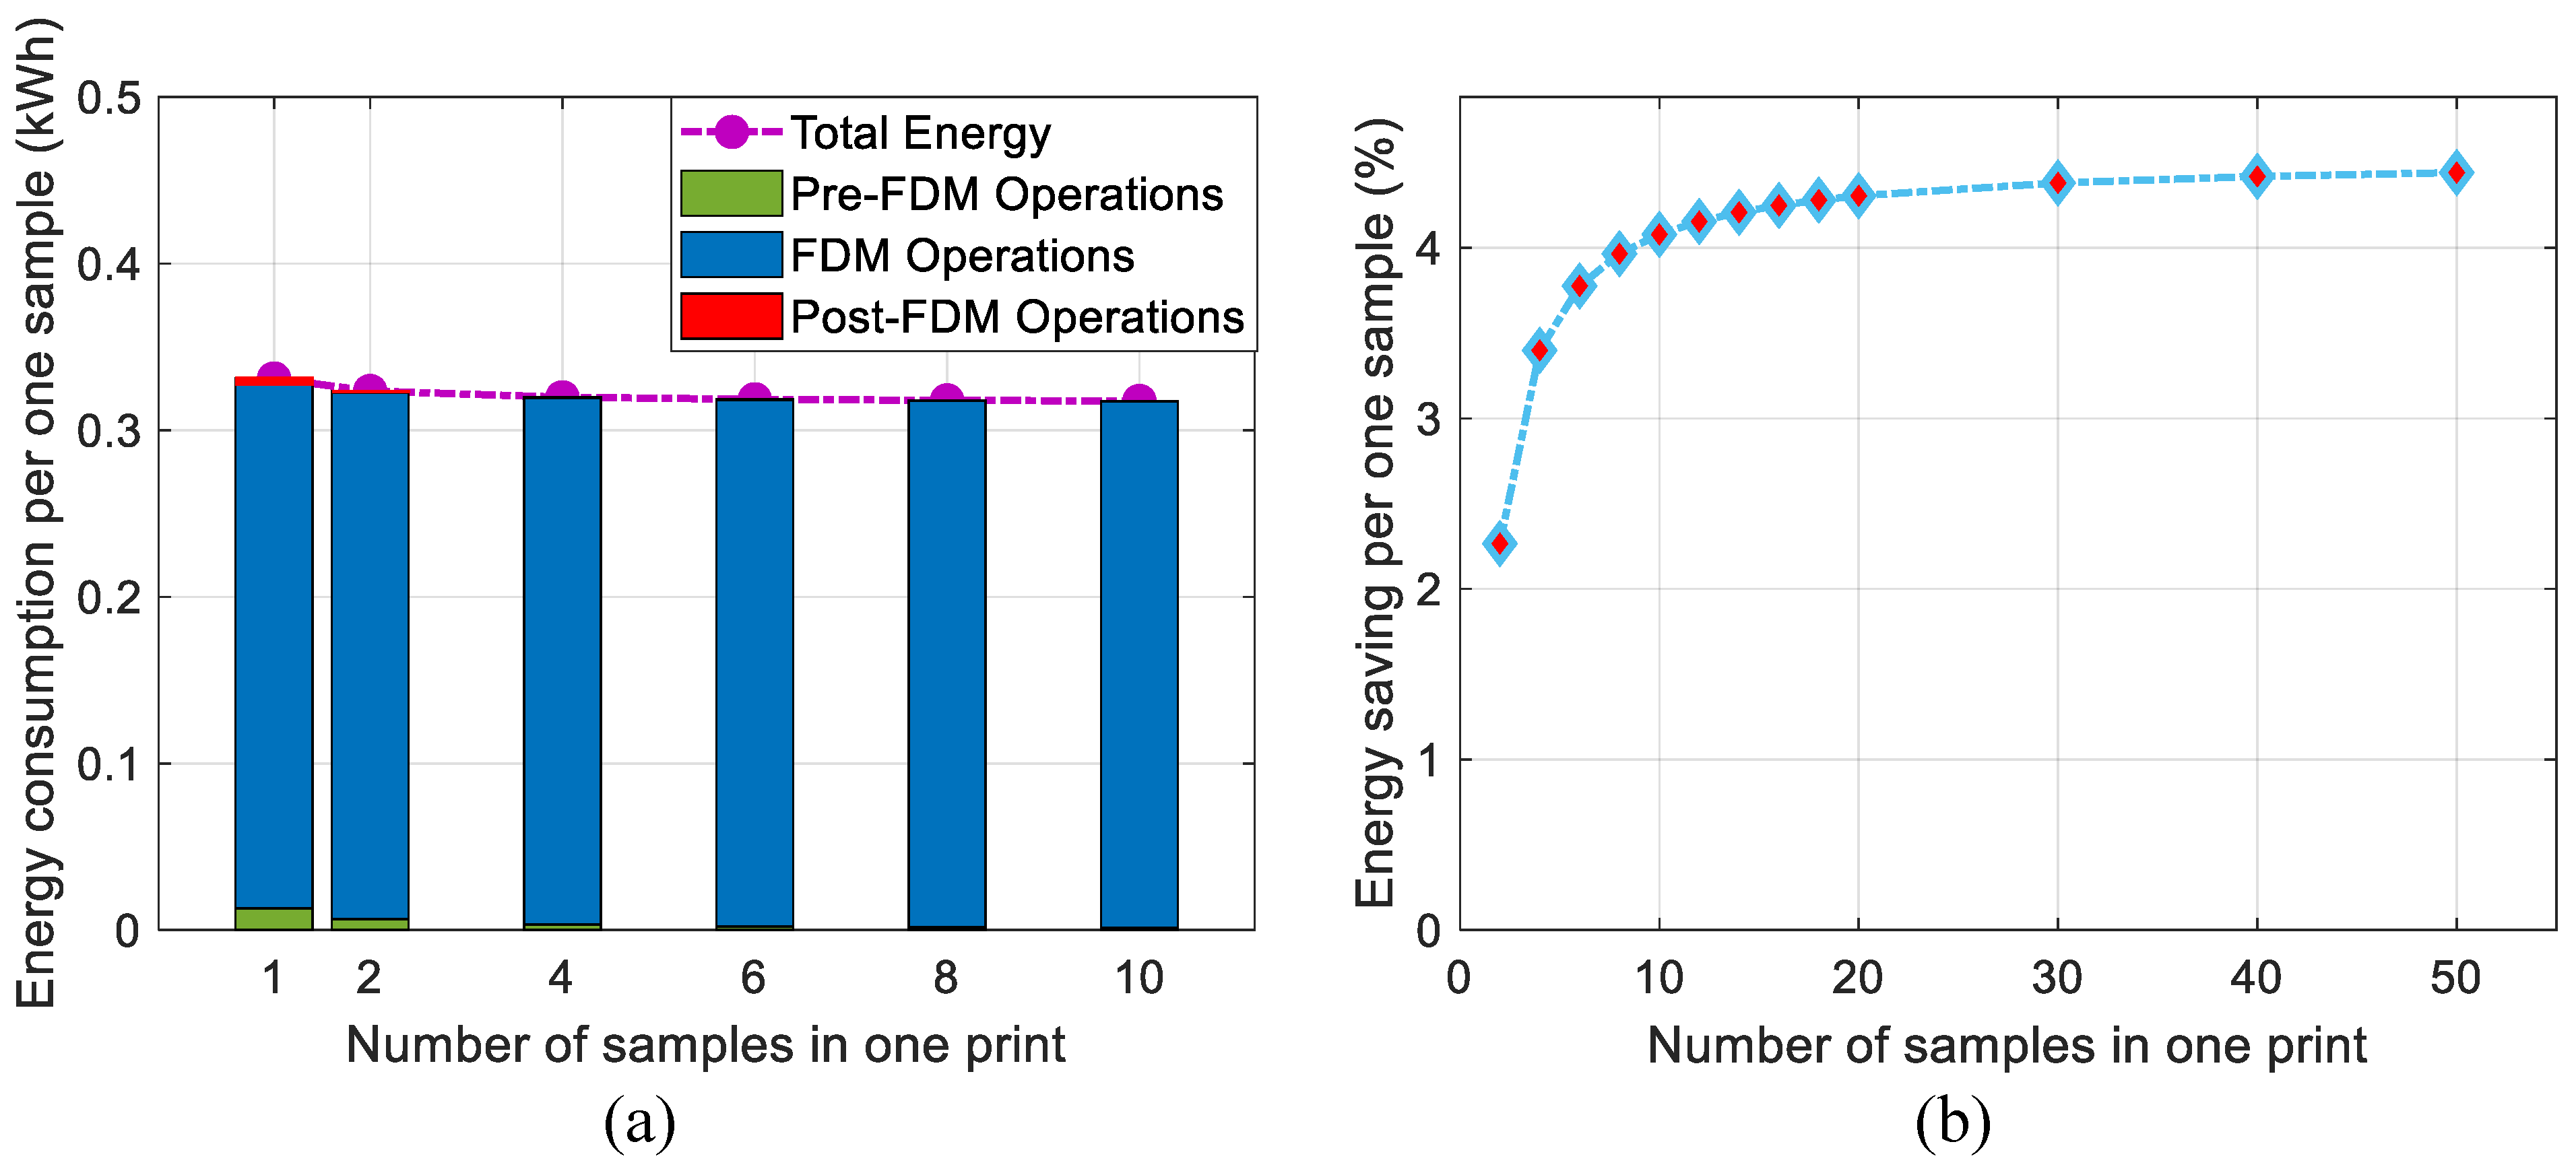
3.3. Effect of Volume of Production on Energy Consumption

The effect of number of parts per run on energy consumption by FDM and PIM processes was investigated. In the FDM process, it was found that the average amount of energy consumed per part reduced in multi-part printing as the number of parts per run increased (Figure 13a). This is attributed to the reality that the same amount of energy will be consumed during the pre- and post-FDM operations, regardless of the number of printed parts. The pre- and post-FDM energy is distributed over the parts in multi-part printing rather than reporting it for one sample in single-part printing. This ultimately leads to energy reduction (energy-saving) in the high-volume production process. However, the rate of energy saving decreases with increase in the number of printed samples, as seen in Figure 13b. This rate reduction is caused by the constant pre- and post-FDM energies being distributed over an increasing number of samples, as indicated by the green and red bars in Figure 13a. In the PIM process, the effect of volume of production is not as significant as in FDM process because the PIM process has an inherent two-part forming mold for this study.

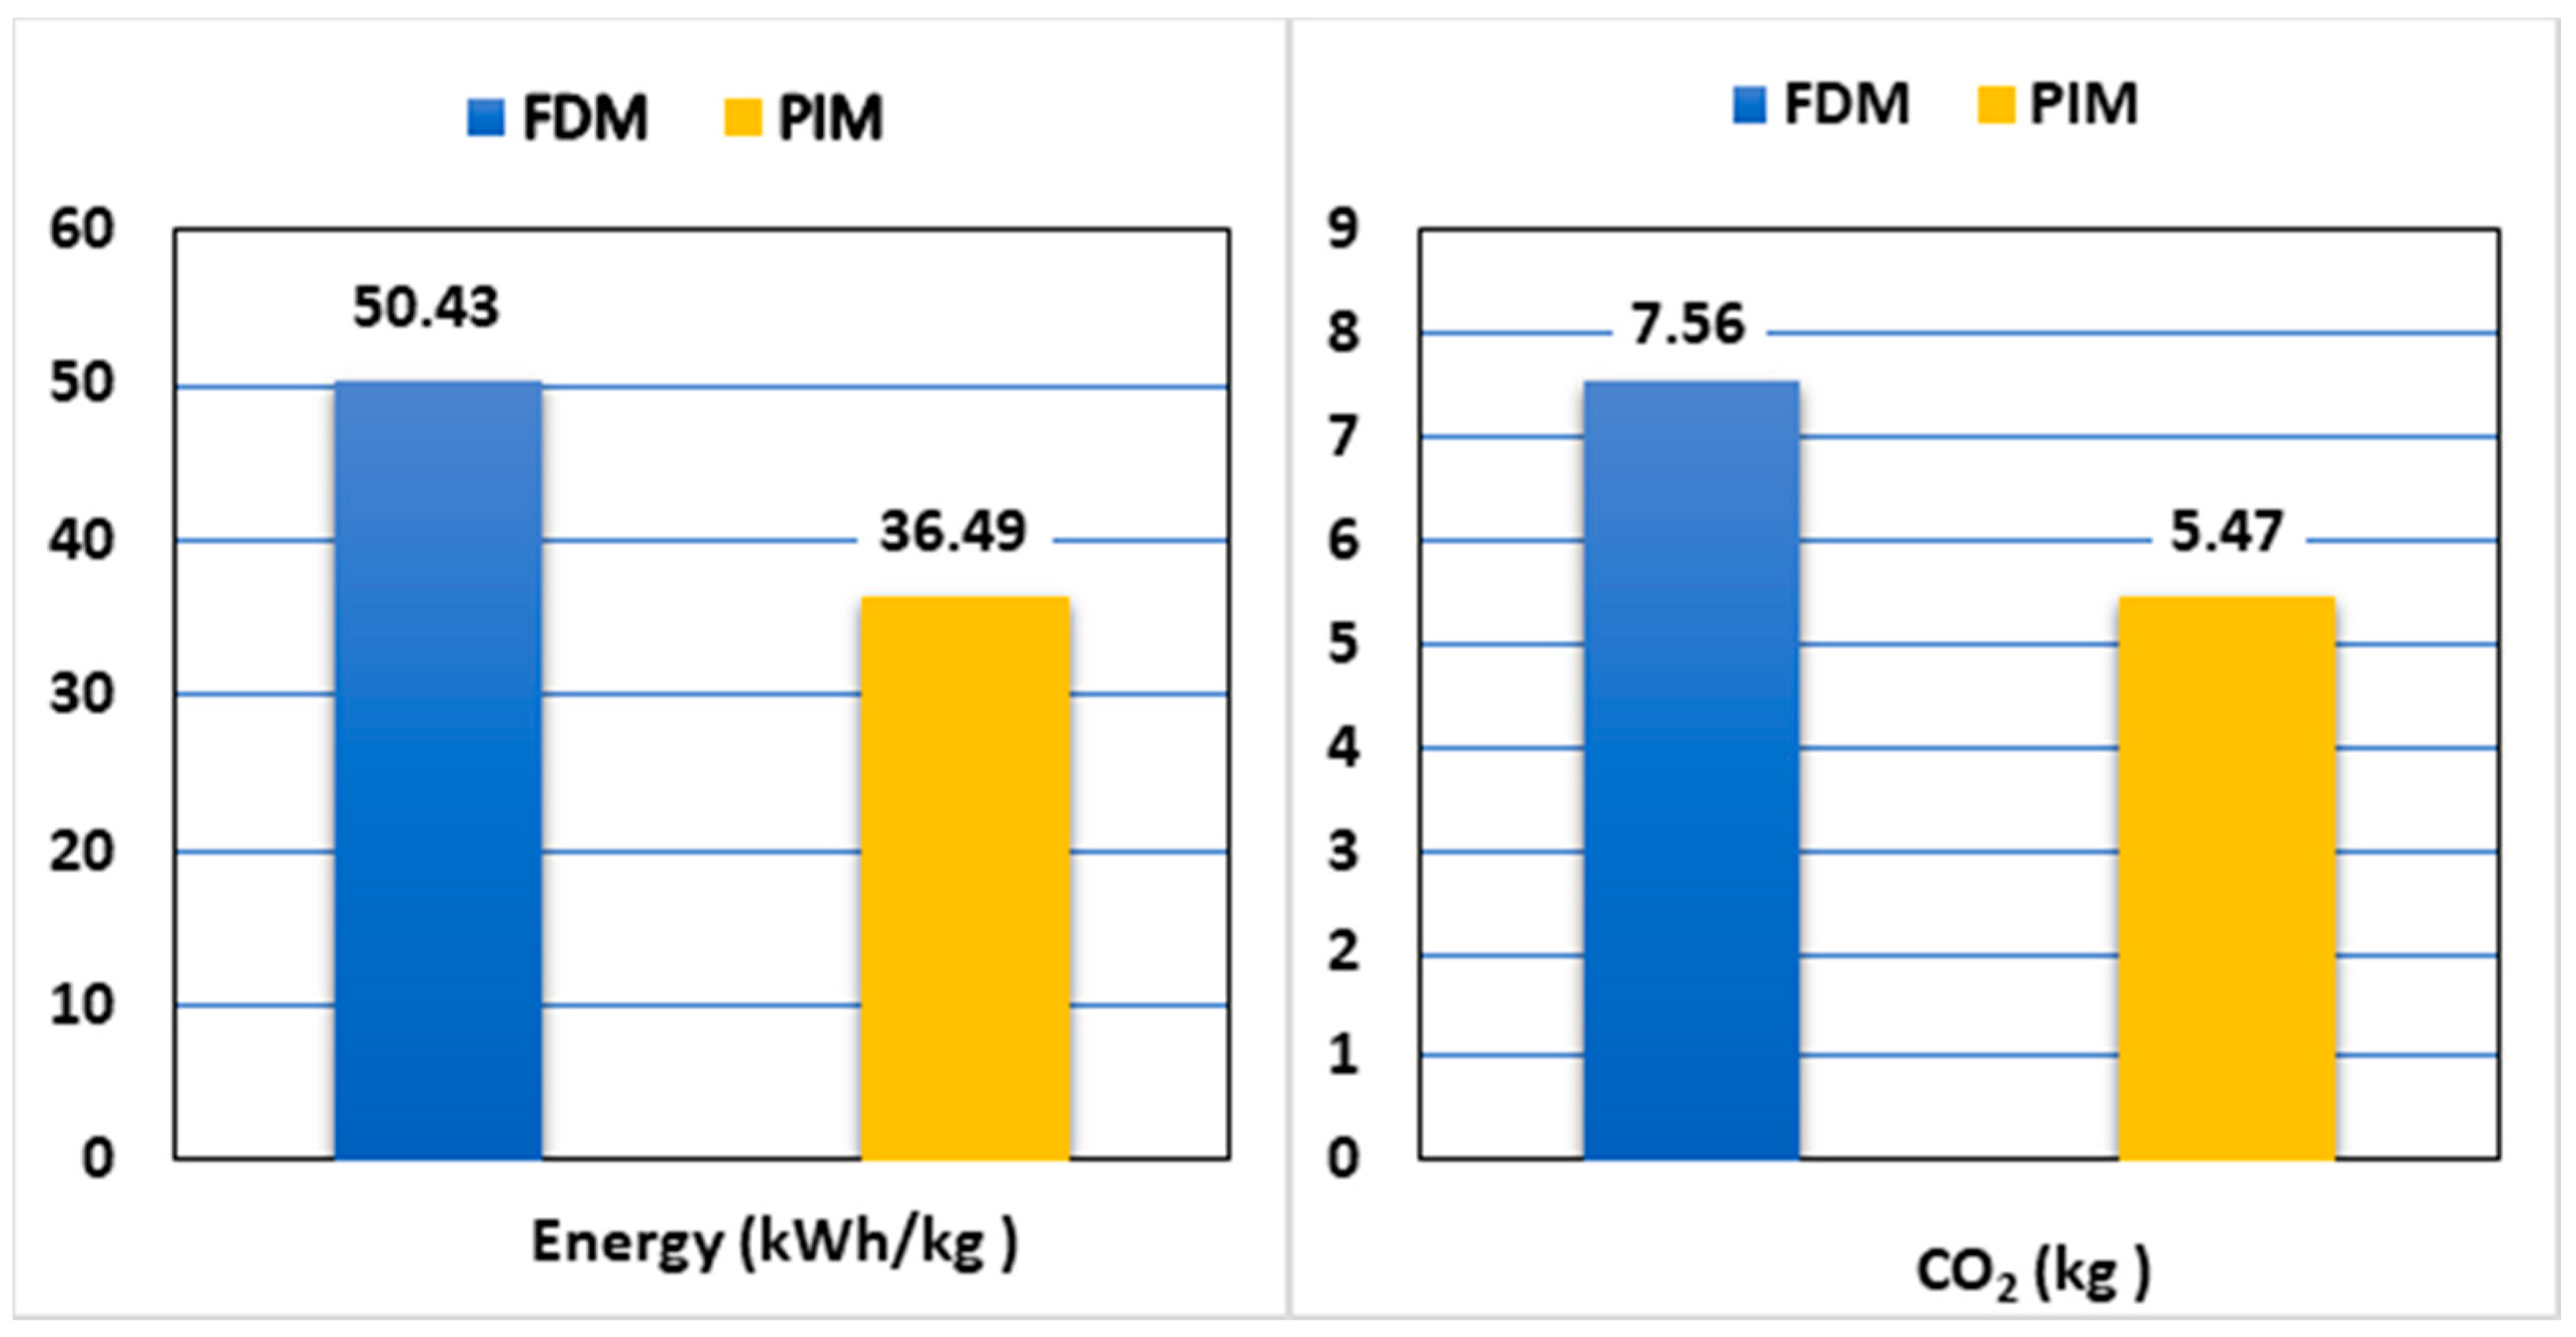
3.4. Carbon Emission of FDM and PIM

The carbon emission per kilogram during the three major phases of the PLA forming process can be estimated with Equation (3), as shown in Figure 14. The new, simple Carbon Emission Signature (CES) is used by knowing the CES for a power grid and the total energy consumption estimated in Equation (7) to estimate the carbon emitted. In the United States, an average 0.15 CESTM factor is used [2].
This approach of carbon emission quantification leads to estimates that are directly correlated with the total energy consumption. It is shown that the carbon emissions by the Ultimaker S3 printer FDM are 38% higher than the carbon emissions caused by the electric Morgan Press G-125T PIM for single part production.

4. Conclusions

In this study, we used a simplified life cycle approach and empirical models to compare energy demand and carbon emissions associated with forming PLA using Ultimaker S3 FDM additive manufacturing and electric Morgan Press G-125T plastic injection molding. The developed functional unit measurement models can be used to predict energy consumption and carbon emission in scale-up FDM and PIM productions of PLA products and can be employed in setting sustainable manufacturing goals for PLA.
The PLA plastic injection molding, in general, consumed about 38.2% less energy and produced less carbon emissions per one kilogram of PLA formed into the final product compared to the fused deposition modeling process. This can be explained by the longer cycle time associated with the actual product forming phase of FDM, which led to more energy consumption and higher carbon emission.
When the three forming cycles of PLA FDM additive manufacturing were considered, it was found that the FDM cycle dominated the filament extrusion and PLA pellet production cycle, with, overwhelmingly, 99% contribution to the total energy consumption by the three cycles. This is chiefly the reason why FDM used more energy and produced a larger carbon emission footprint than PIM.
About 95.5% of the energy consumed during FDM of PLA was seen during the actual layer-by-layer part building. This means that process parameters such as infill percentage and printing speed can be used to significantly improve the energy footprint of FDM.
When we looked at the effect of volume of production on the energy demand of FDM and PIM, it was established that the rate of energy saving decreases with increase in the number of printed samples per run of FDM process. This trend would not be applicable in PIM, where the mold can only hold two parts per run.

Author Contributions

Conceptualization, E.U.E. and V.G.M.; methodology, E.U.E., V.G.M., A.A., S.O., L.I.K. and J.R.; formal analysis, E.U.E., V.G.M., A.A., S.O., L.I.K. and J.R; investigation, E.U.E., V.G.M., A.A., S.O., L.I.K. and J.R; resources, E.U.E. and V.G.M.; data curation, A.A., S.O., L.I.K. and J.R.; writing—original draft preparation, E.U.E., V.G.M., A.A., S.O., L.I.K. and J.R.; writing—review and editing, E.U.E., V.G.M., A.A., S.O., L.I.K., J.R.; visualization, E.U.E., V.G.M., A.A., S.O, L.I.K. and J.R; supervision, E.U.E. and V.G.M. All authors have read and agreed to the published version of the manuscript.

Funding

This research received no external funding.

Institutional Review Board Statement

Not applicable.

Informed Consent Statement

Not applicable.

Data Availability Statement

Not applicable.

Conflicts of Interest

The authors declare no conflict of interest.

References

  1. Ashby, M.F. Materials and the Environment: Eco-Informed Material Choice; Butterworth-Heinemann: Oxford, UK, 2009. [Google Scholar]
  2. Jeswiet, J.; Kara, S. Carbon emissions and CESTM in manufacturing. CIRP Ann. Manuf. Technol. 2008, 57, 17–20. [Google Scholar] [CrossRef]
  3. Peng, T.; Sun, W. Energy modelling for FDM 3D printing from a life cycle perspective. Int. J. Manuf. Res. 2017. [Google Scholar] [CrossRef]
  4. Tofail, S.A.M.; Koumoulos, E.P.; Bandyopadhyay, A.; Bose, S.; O’Donoghue, L.; Charitidis, C. Additive manufacturing.: Scientific and technological challenges, market uptake and opportunities. Mat. Today 2018, 21, 22–37. [Google Scholar] [CrossRef]
  5. Kim, Y.; Yoon, C.; Ham, S.; Park, J.; Kim, S.; Kwon, O.; Tsai, P.-J. Emissions of Nanoparticles and Gaseous Material from 3D Printer Operation. Environ. Sci. Technol. 2015, 49, 12044–12053. [Google Scholar] [CrossRef] [PubMed]
  6. Lee, J.Y.; An, J.; Chua, C.K. Fundamentals and applications of 3D printing for novel materials. Appl. Mat. Today 2017, 7, 120–133. [Google Scholar] [CrossRef]
  7. Ford, S.; Despeisse, M. Additive manufacturing and sustainability: An exploratory study of the advantages and challenges. J. Clean. Prod. 2016, 137, 1573–1587. [Google Scholar] [CrossRef]
  8. Ribeiro, I.; Peças, P.; Henriques, E. Assessment of Energy Consumption in Injection Moulding Process. In Leveraging Technology for a Sustainable World, Proceedings of the 19th CIRP Conference on Life Cycle Engineering, Berkeley, CA, USA, 23–25 May 2012; Springer: Berlin/Heidelberg, Germany, 2012; pp. 263–268. [Google Scholar]
  9. Park, H.S.; Nguyen, T.T. Optimization of injection molding process for car fender in consideration of energy efficiency and product quality. J. Comput. Des. Eng. 2014, 1, 256–265. [Google Scholar] [CrossRef] [Green Version]
  10. Madan, J.; Mani, M.; Lyons, K.W. Characterizing Energy Consumption of the Injection Molding Process. In ASME 2013 International Manufacturing Science and Engineering Conference Collocated with the 41st North American Manufacturing Research Conference; American Society of Mechanical Engineers Digital Collection: Madison, WI, USA, 2013. [Google Scholar] [CrossRef] [Green Version]
  11. Injection Molding: Global Markets and Technologies Through. 2023. Available online: https://www.bccresearch.com/market-research/plastics/injection-molding-global-markets-and-technologies.html (accessed on 22 September 2020).
  12. Weissman, A.; Gupta, S.K. Selecting a Design-Stage Energy Estimation Approach for Manufacturing Processes. In International Design Engineering Technical Conferences and Computers and Information in Engineering Conference; American Society of Mechanical Engineers Digital Collection: Washington, DC, USA, 2011. [Google Scholar] [CrossRef] [Green Version]
  13. Peng, T. Analysis of Energy Utilization in 3D Printing Processes. Procedia CIRP 2016, 40, 62–67. [Google Scholar] [CrossRef] [Green Version]
  14. Yosofi, M.; Kerbrat, O.; Mognol, P. Energy and material flow modelling of additive manufacturing processes. Virtual Phys. Prototyp. 2018, 13, 83–96. [Google Scholar] [CrossRef]
  15. Balogun, V.A.; Kirkwood, N.D.; Mativenga, P.T. Direct Electrical Energy Demand in Fused Deposition Modelling. Procedia CIRP 2014, 15, 38–43. [Google Scholar] [CrossRef] [Green Version]
  16. Balogun, V.A.; Kirkwood, N.D.; Mativenga, P.T. Energy consumption and carbon footprint analysis of Fused Deposition Modelling: A case study of RP Stratasys Dimension SST FDM. Int. J. Sci. Eng. Res. 2015, 6, 442–447. [Google Scholar]
  17. Mognol, P.; Lepicart, D.; Perry, N. Rapid prototyping: Energy and environment in the spotlight. Rapid Prototyp. J. 2006, 12, 26–34. [Google Scholar] [CrossRef] [Green Version]
  18. Peng, T.; Yan, F. Dual-objective Analysis for Desktop FDM Printers: Energy Consumption and Surface Roughness. Procedia CIRP 2018, 69, 106–111. [Google Scholar] [CrossRef]
  19. Qureshi, F.; Li, W.; Kara, S.; Herrmann, C. Unit Process Energy Consumption Models for Material Addition Processes: A Case of the Injection Molding Process. In Leveraging Technology for a Sustainable World; Dornfeld, D.D., Linke, B.S., Eds.; Springer: Berlin/Heidelberg, Germany, 2012; pp. 269–274. [Google Scholar]
  20. Weissman, A.; Ananthanarayanan, A.; Gupta, S.K.; Sriram, R.D. A Systematic Methodology for Accurate Design-Stage Estimation of Energy Consumption for Injection Molded Parts. In Proceedings of the International Design Engineering Technical Conferences and Computers and Information in Engineering Conference, Montreal, QC, Canada, 15–18 August 2010; 2010. [Google Scholar] [CrossRef] [Green Version]
  21. Mianehrow, H.; Abbasian, A. Energy monitoring of plastic injection molding process running with hydraulic injection molding machines. J. Clean. Prod. 2017, 148, 804–810. [Google Scholar] [CrossRef]
  22. He, D.; Zhang, Y.; Zhuang, J.; Fan, Y.; Zhou, G. Numerical Simulation for Optimization of Plastics Process Parameters of Injection Molding Machine Based on Energy Consumption. DEStech Trans. Eng. Technol. Res 2016. [Google Scholar] [CrossRef]
  23. Kanungo, A.; Swan, E. All Electric Injection Molding Machines: How Much Energy Can You Save? Available online: https://oaktrust.library.tamu.edu/handle/1969.1/87974 (accessed on 1 December 2020).
  24. Telenko, C.; Seepersad, C.C. A Comparative Evaluation of Energy Consumption of Selective Laser Sintering and Injection Molding of Nylon Parts. Rapid Prototyp. J. 2012, 18, 6. [Google Scholar] [CrossRef]
  25. Yoon, H.S.; Lee, J.Y.; Kim, H.S.; Kim, M.S.; Kim, E.S.; Shin, Y.J.; Chu, W.S.; Ahn, S.H. A comparison of energy consumption in bulk forming, subtractive, and additive processes: Review and case study. Int. J. Precis. Eng. Manuf. Green Tech. 2014, 1, 261–279. [Google Scholar] [CrossRef]
Figure 1. The polylactic acid (PLA) material life cycle, showing consumption of energy, material processing, and emission of waste heat, solid, liquid, and gases.
Sustainability 13 01875 g001
Figure 2. Demonstration of embodied energy—the energy per kg of usable PLA material.
Sustainability 13 01875 g002
Figure 3. Extrusion of PLA filament using Filabot system.
Sustainability 13 01875 g003
Figure 4. Geometric shape of the samples built. All dimensions are in mm.
Sustainability 13 01875 g004
Figure 5. 100% infill PLA sample fabricated with Ultimaker S3 FDM.
Sustainability 13 01875 g005
Figure 6. Morgan Press G-125T injection molding machine.
Sustainability 13 01875 g006
Figure 7. Injection-molded dog bone sample.
Sustainability 13 01875 g007
Figure 8. Energy consumption percentage by the filament extrusion unit.
Sustainability 13 01875 g008
Figure 9. Energy consumption percentage per each FDM stage.
Sustainability 13 01875 g009
Figure 10. Energy consumption at three major phases of FDM of PLA.
Sustainability 13 01875 g010
Figure 11. Energy consumption percentage at three major phases of FDM of PLA.
Sustainability 13 01875 g011
Figure 12. Energy consumption percentage for each injection molding element.
Sustainability 13 01875 g012
Figure 13. (a) Stacked energy consumption during print operations in single- and multi-printing and (b) change in energy saving as the number of printed samples increases.
Sustainability 13 01875 g013
Figure 14. Carbon emission from the FDM and PIM processes.
Sustainability 13 01875 g014
Table 1. Life cycle inventory of PLA.
TypeAmountSource
Embodied Energy (EM)(1.03–1.13) BTU/kgANSYS Granta
CO2 Footprint(1.22–1.34) kg/kgANSYS Granta
Table 2. Ultimaker 3D printer parameters.
ParameterSpecification
Nozzle diameter0.4 mm
Outer shell speed15 mm/s
100% infill speed50 mm/s
Speed without extrusion80 mm/s
Material flow rate2.5 mm3/s
Table 3. Injection molding processing parameters.
FactorLevel
Injection pressure25.5 MPa
Nozzle temperature 185 °C
Barrel temperature176.7 °C
Plate temperature 121.1 °C
Injection time11 sec
Table 4. Power consumption during production of 195.921 g of filament.
Extruder (kW h)Fan
(kW h)
Spooler
(kW h)
Temperature ramp-up (17 to 190 °C)0.044N/AN/A
Filament extrusion0.0190.0050.001
Total per unit0.0630.0050.001
Total (kWh)0.0695
Table 5. Power consumption in fused deposition modeling (FDM) of one sample (6.53 g).
FDM StagesEnergy Consumption (kWh)
Pre-FDM operations0.013
FDM0.316
Post-FDM operations0.002
Total0.331
Table 6. Power consumption in PLA plastic injection molding (PIM) during one run (about 13 g).
Plate
(kWh)
Barrel/Nozzle (kWh)
Heating up0.1920.272
Injection 0.0050.005
Total per element0.1970.277
Total (kWh)0.474
Publisher’s Note: MDPI stays neutral with regard to jurisdictional claims in published maps and institutional affiliations.

