Article

The Hydration, Mechanical, Autogenous Shrinkage, Durability, and Sustainability Properties of Cement–Limestone–Slag Ternary Composites

1
Department of Architectural Engineering, Kangwon National University, Chuncheon-si 24341, Korea
2
Department of Integrated Energy and Infra System, Kangwon National University, Chuncheon-si 24341, Korea
*
Author to whom correspondence should be addressed.
Sustainability 2021, 13(4), 1881; https://doi.org/10.3390/su13041881
Submission received: 18 January 2021 / Revised: 3 February 2021 / Accepted: 5 February 2021 / Published: 9 February 2021
(This article belongs to the Special Issue Low CO2 Concrete)

Abstract

:
This study examines the hydration–mechanical–autogenous shrinkage–durability–sustainability properties of ternary composites with limestone filler (LF) and ground-granulated blast furnace slag (BFS). Four mixtures were prepared with a water/binder ratio of 0.3 and different replacement ratios varying from 0 to 45%. Multiple experimental studies were performed at various ages. The experimental results are summarized as follows: (1) As the replacement levels increased, compressive strength and autogenous shrinkage (AS) decreased, and this relationship was linear. (2) As the replacement levels increased, cumulative hydration heat decreased. At the age of 3 and 7 days, there was a linear relationship between compressive strength and cumulative hydration heat. (3) Out of all mixtures, the ultrasonic pulse velocity (UPV) and electrical resistivity exhibited a rapid increase in the early stages and tended to slow down in the latter stages. There was a crossover of UPV among various specimens. In the later stages, the electrical resistivity of ternary composite specimens was higher than plain specimens. (4) X-ray diffraction (XRD) results showed that LF and BFS have a synergistic effect. (5) With increasing replacement ratios, the CO2 emissions per unit strength reduced, indicating the sustainability of ternary composites.

1. Introduction

The world consumes large quantities of cement every year. Large-scale cement production leads to a large amount of CO2 emissions [1,2]. In recent years, an increasing number of researchers have tried to use supplementary cementitious materials (SCMs) to reduce cement consumption [3,4]. Blast furnace slag (BFS) is a by-product of the steel industry, and BFS-blended concrete has a low hydration heat, good durability and fire resistance, and high long-term strength [5,6,7,8]. However, the addition of BFS can lower the material strength in the early period due to the low reactivity of BFS [7,9]. To overcome the weak point of BFS-blended concrete, limestone filler (LF) is increasingly used in BFS-blended binary concrete [10,11,12]. Compared with slag-blended binary concrete, ternary-blended concrete containing LF and BFS together shows a higher potential cost/benefit ratio and lower environmental impact [9,10,13,14].
Many studies have examined the properties of ordinary Portland cement (OPC)–LF–BFS ternary blends. First, regarding its mechanical properties, Li and Jiang [15] found that the addition of 10% LF can improve the compressive strength of BFS concrete. Moreover, it can effectively reduce CO2 emissions and manufacturing costs. Carrasco et al. [9] proposed that in the LF–BFS–OPC system, LF can improve the early compressive strength, while BFS can improve the later compressive strength. Menéndez et al. [7] studied the compressive strength of a ternary mixture (OPC, LF, and BFS) at 1, 3, 7, 28, and 90 days. In the cases of mixing 5–15% LF and 0–20% BFS, LF contributed to the compressive strength at 1 and 3 days. BFS effectively increases the compressive strength at 90 days. Second, regarding the hydration and microstructure properties of OPC–LF–BFS ternary blends, Adu-Amankwah et al. [16] showed that when LF was added to BFS cement, the Al/Si of C-S-H was lower and the Mg/Al in hydrotalcite was higher. They also indicated that the presence of LF not only promotes the hydration of the clinker but also of BFS. Arora et al. [13] demonstrated the synergistic effect of LF and BFS, finding a linear relationship between the formation of the monocarbonate phase and the consumption of carbonate. Third, regarding the autogenous shrinkage of ternary composites, Bouasker et al. [10] proposed that LF effectively slows down the development of AS in BFS cement systems, and the doping amount ranges from 10% to 20%, delaying the first crack appearance as the amount of replacement increased. In addition, Itim et al. [17] proposed that the replacement of cement with LF (less than 15%) and BFS in appropriate amounts reduces the shrinkage and increases the compressive strength.
However, there are some limitations to the current research on ternary composites. The main weak points can be summarized as follows: First, previous studies mainly focused on individual experiments, and the connections between individual experiments have not been fully elucidated. The microscopic mechanisms of macroscopic phenomena should be further investigated. Second, the addition of limestone and slag shows various effects on concrete such as a dilution effect, nucleation effect, slag secondary reaction, and synergistic effect. Previous studies have not clarified these effects. Third, the issue of sustainability of cement–limestone–slag ternary composites has not been fully considered. Researchers and concrete producers are eager to know whether cement–limestone–slag ternary composites are sustainable materials or not.
To address the existing gaps in research, this study investigates the hydration and mechanical properties, autogenous shrinkage, durability, and sustainability of OPC–LF–BFS ternary composites. In this study, individual tests were conducted on compressive strength, AS, isothermal calorimetry, ultrasonic pulse velocity (UPV), electrical resistivity, XRD, and attenuated total reflectance (ATR)-Fourier-Transform Infrared Spectroscopy (FTIR) spectra. The innovation of this paper lies in the following three points: First, the evolution of ternary mixture properties is elucidated through a macro–micro perspective. Second, based on various experimental studies, the various effects of LF and BFS are systematically clarified. Third, the sustainability of OPC–LF–BFS ternary composites were analyzed by CO2 emissions for unit strength.

2. Materials and Methods

2.1. Materials and Mixtures

2.1.1. Material

Table 1 shows the chemical composition of the binders, such as OPC (Type I ordinary Portland cement, provided by Sung Shin Cement Company, Seoul, Korea), LF, and BFS used in this study. The measurement accuracy of each component in Table 1 is 0.01%. X-ray fluorescence spectrometry provided by Rigaku (ZSX Primus II) was used for chemical composition measurements. To perform the X-ray fluorescence (XRF) experiment, the sample should be put into the furnace and heated to 1025 °C. The decomposition of LF occurs at about 720 °C, which resulted in a large loss on ignition of LF (41.30%). A polycarboxylate ethers (PCE)-based superplasticizer is used. This superplasticizer is liquefier. The amount of solid in superplasticizer is about 41%. PCE is a comb-like molecular structure. The backbone chain was a polymer of methacrylic acid partially esterified with methoxy-terminated polyoxyethylene chains. The particle size distribution obtained by laser diffraction is shown in Figure 1a,b. LF has more fine particles compared to OPC. The BFS particle size distribution falls between LF and OPC. The Blaine fineness of OPC, LF, and BFS were 365, 510.9, and 420 m2/kg, respectively.

2.1.2. Mixture Ratio

LF and BFS were used as partial substitutes for cement, replacing cement content at 15%, 30%, and 45% by weight. BFS/LF was added with a fixed ratio of 2 by weight. Table 2 shows that the mixing ratios according to the different replacement contents. The mixture used a fixed water-to-binder ratio (w/b) of 0.3 and added 0.25% (binder) of superplasticizer. The flows of mixture PC0LF0S, PC5LF10S, PC10LF20S, and PC15LF30S were 220, 230, 270, and 290 mm, respectively.

2.2. Experimental Method

The experimental methods used in this experiment and the scope are summarized in Table 3.

2.2.1. Compressive Strength Tests

A compressive strength test was conducted using a digital motorized compressive tester (Shin Gang Precision IND CO., Youngin-myeon Asan, Korea). Compressive strength was measured according to ASTM C39 [18]. We used the standard mold size of 50 × 50 × 50 mm. After 24 h, the samples were demolded and sealed at a constant temperature of 20 °C for curing. Three samples were taken from each group and tested at 3, 7, and 28 days after the samples were poured, and the average of the strength measurements of the three test samples was used as the final compressive strength.

2.2.2. Autogenous Shrinkage Tests

The autogenous shrinkage value was detected using a corrugated tube autogenous shrinkage instrument (Instrument Creation Era, Beijing, China). The measurement of autogenous shrinkage (AS) of cement paste was carried out according to ASTM C 1698-09 [19]. This method not only effectively prevents the loss of water but also effectively reduces the constraint of volume change during the hardening process of the paste [20]. In this study, a corrugated pipe 425 mm long was used and placed horizontally on a steel support after pouring. This was placed in a constant temperature and humidity chamber at 20 °C to record the change in length of the test sample. Data were collected in minutes from the final setting time until the end of 7 days of recording [21]. The change in the measured length of the sample from the original length (the length measurement obtained at the final setting time of the mixture) was used to measure the AS rate.

2.2.3. Isothermal Calorimetry Tests

A TAM Air isothermal calorimeter (TA Instruments, New Castle, DE, USA) was used to test the heat released rate and cumulative heat of hydration of the early paste. A cement paste of 5 g was prepared at 0.3 w/b and measured continuously at a constant temperature of 20 °C for 7 days. The slow internal mixing speed could lead to uneven mixing of the paste [22]. Therefore, to reduce the experimental error, we used external mixing and quickly put the mixture into glass bottles.

2.2.4. Non-Destructive Techniques (NDT)

UPV and electrical resistivity, as non-destructive techniques, can be used to study the properties of cement [23,24]. A non-destructive digital indicator tester (Pundit Lab, Proceq company, Schwerzenbach, Switzerland) was used to determine the propagation velocity of the longitudinal wave obtained from the ultrasonic pulse through the samples. UPV measurements were performed using standard samples 50 × 50 × 50 mm in size for 1–28 days. Due to the rapid development of ultrasound in the early phase of the reaction, measurements were taken three times a day for 1–7 days.
We used a four-point Wenner probe surface testing device (ResiPod portable non-destructive resistivity tester, Proceq company, Schwerzenbach, Switzerland) to measure electrical resistivity. This was measured on standard samples Ø100 × 200 mm in size for 1–28. This was measured three times a day for the first seven days. Three samples were measured at three different locations and the data were recorded.

2.2.5. XRD and ATR-FTIR

The sample powder after hydration (at 3 and 28 days of curing) was analyzed using PANalytical X’pert pro MPD diffractometers (PANalytical, Almelo, The Netherlands). XRD was used in the range of 10–70° 2θ under CuKα radiation. The crystalline phases of the samples were scanned in 0.02° steps at 3 and 28 days of age.
The ATR-FTIR spectrum of the sample after the hydration stoppage was measured. The hydrated samples were scanned using a Frontier spectrometer (PerkinElmer, Waltham, MA, USA) at a resolution of 0.4 cm−1. The ATR-FTIR spectrum were collected in the range of 4000–500 cm−1. All samples were scanned 32 times.

3. Results and Discussion

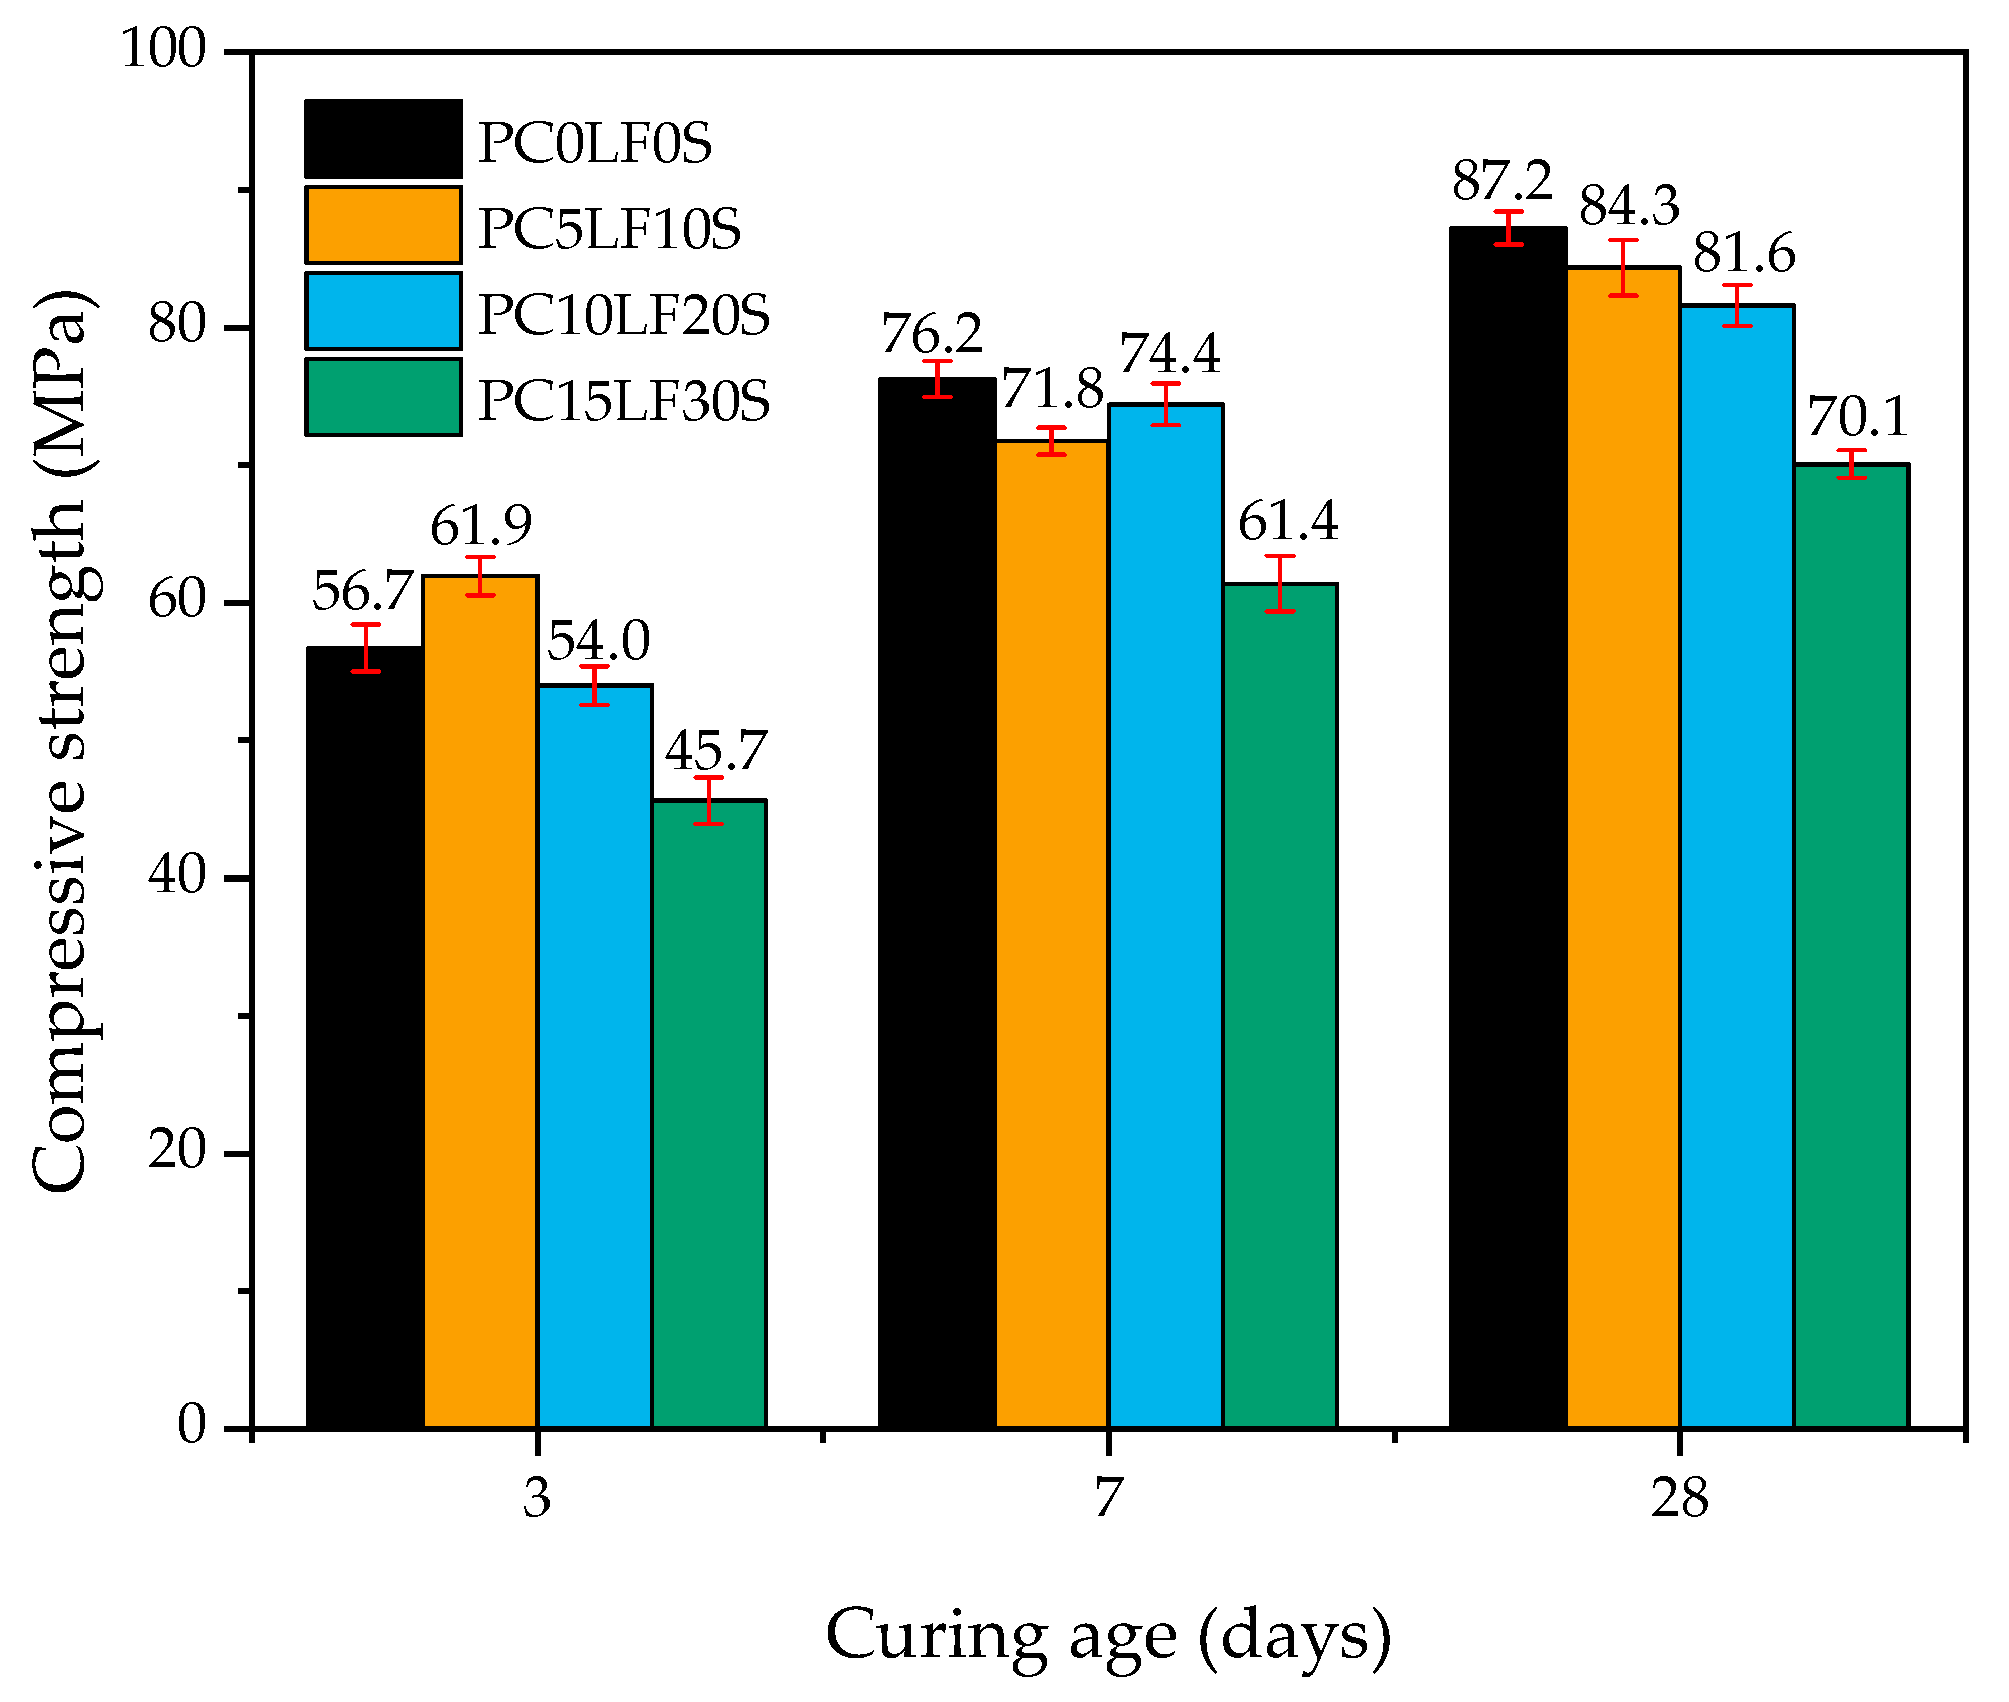
3.1. Compressive Strength

The change in compressive strength of the mixture was related to several mechanisms. First, LF and BFS partly replace OPC to produce a dilution effect, after which the effective water–cement ratio increases, reducing the strength [8]. The compressive strength is significantly reduced at high substitution rates. Eventually, this affects the compressive strength at the early and late stages. Second, LF particles act as nucleation sites, leading to the formation of additional mixed crystallization of C–S–H (nucleation effect), thus improving early cement hydration [9,11]. Third, BFS undergoes pozzolan reactions to produce additional C–S–H. Menéndez et al. [7] also indicated that BFS facilitates the development of late compressive strength. Finally, the synergistic effect of LF and BFS produces hemicarboaluminate (Hc) and monocarboaluminate (Mc) [25]. Adu-Amankwah et al. [26] clarified that calcite reacts with aluminum phase to produce Hc and Mc, which stabilizes ettringite, reduces porosity, and contributes to both early and late compressive strength. The variation of all mixtures compressive strength is shown in Figure 2.
After 3 days, the compressive strength of PC0LF0S was higher than that of PC10LF20S and PC15LF30S. This was caused by the dilution effect brought about by LF and BFS [8]. However, the compressive strength of PC5LF10S was significantly higher than that of the control (PC0LF0S). This can be attributed to the nucleation effect of LF, which effectively promotes the hydration reaction and increases the early compressive strength [9,11], and it can also be attributed to the Hc generated in the early stage, which increases strength [26]. Hc production can be observed in the early stage, as shown in in Section 3.6.
The compressive strength of PC10LF20S after 7 days of the hydration reaction was found to be higher than PC5LF10S and lower than PC0LF0S. The pozzolanic reaction of the BFS improved the compressive strength. The Hc and Mc produced by the synergistic action of LF and BFS contributed to the compressive strength [25].
After 28 days, the replacement ratios of mineral admixture of PC5LF10S and PC10LF20S were 15% and 30%, respectively. Compared to the control specimen, the reduction of compressive strength for PC5LF10S and PC10LF20S was 3.3% and 6.4%, respectively. That is, the percentage of intensity reduction was greater compared to the replacement ratio. In addition, for specimen PC15LF30S, the strength was lower. This is because the dilution effect was significantly higher for this specimen than the other strength-promoting effects.

3.2. Effect of LF and BFS on AS

For each sample studied, the change of AS over 1–7 days was measured at a constant temperature of 20 °C. The changes in AS during the hydration of the samples over 7 days are shown in Figure 3. A significant swelling phenomenon can be observed initially, and the reasons for this swelling are summarized as follows: First, the most important factor leading to the appearance of the swelling is related to the fineness of the LF added, as LF surfaces can absorb and/or adsorb water and generate disjoining pressure, resulting in the swelling of mixtures [27,28]. Second, this is related to the production of hydration products (ettringite) [29]. In addition, the internal variable temperature of cement and the water absorption of hydration products can also cause the initial expansion phenomenon observed [30].
The overall AS of the samples decreased as the substitution rate increased. The AS values of the PC5LF10S, PC10LF20S, and PC15LF30S samples were significantly reduced compared to the control specimen PC0LF0S, with even sample PC15LF30 exhibiting swelling. The AS of HPC can be explained in combination with its capillary tension. Capillary tension is related to pore structure, relative humidity, self-stress, hydration, and interfacial structure [31]. Ghafari et al. [6] also suggested that the early material type has a significant effect on AS.
Here, we can explain the early AS response in four ways. First, it can be explained in terms of the dilution effect of early LF and BFS. As the LF and BFS replacement rate increased, the cement content decreased and the effective water–cement ratio increased, thus maintaining a high relative humidity, leading to lower AS [8]. Second, the swelling effect of the early cement matrix effectively reduces AS [32]. Third, high substitution rates result in large reductions in hydration products, reducing AS [17]. It can also be explained through the effect of BFS on AS. On the one hand, the BFS reaction produces more small pores, leading to an increase in AS [32]. The BFS reaction produces additional C–S–H, which fills the early pores and leads to pore refinement. On the other hand, the BFS reaction is weaker than that of cement, resulting in reduced AS. Bouasker et al. [10] also indicated that BFS substitution as low as 30% reduces AS. In conclusion, the effect of BFS on AS depends on the different factors that cause an increase or decrease of AS.
The nucleation of LF that occurs as the reaction proceeds (without pozzolanic properties) increases hydration, reduces the setting time and total porosity, and increases the compressive strength [33]. In addition, the pozzolanic reaction of BFS improves the microporous structure, decreases the porosity and average diameter, and increases the pore volume percentage between 5 and 50 nm diameter [31,34]. As porosity decreases, there is a continuous increase in AS. It is also evident from Figure 3 that the control group tends to have a slow increase rate during the later stage. However, the AS of the samples doped with LF and BFS showed a continuous increasing trend.
As shown in Figure 4 and Table 4, a linear equation is used to make regressions between AS and strength at the ages of 3 and 7 days. Moreover, detailed data are added to show the values of regression equations. It can be clearly seen that there is a linear relationship between the AS and compressive strength, and the value of the correlation coefficient R2 is within the acceptable range. Itim et al. [17] also found linear relationships between compressive strength and total shrinkage, and AS and drying shrinkage. Among them, the linear relationship between total shrinkage and compressive strength is more obvious. This also suggests that AS can be predicted by compressive strength.

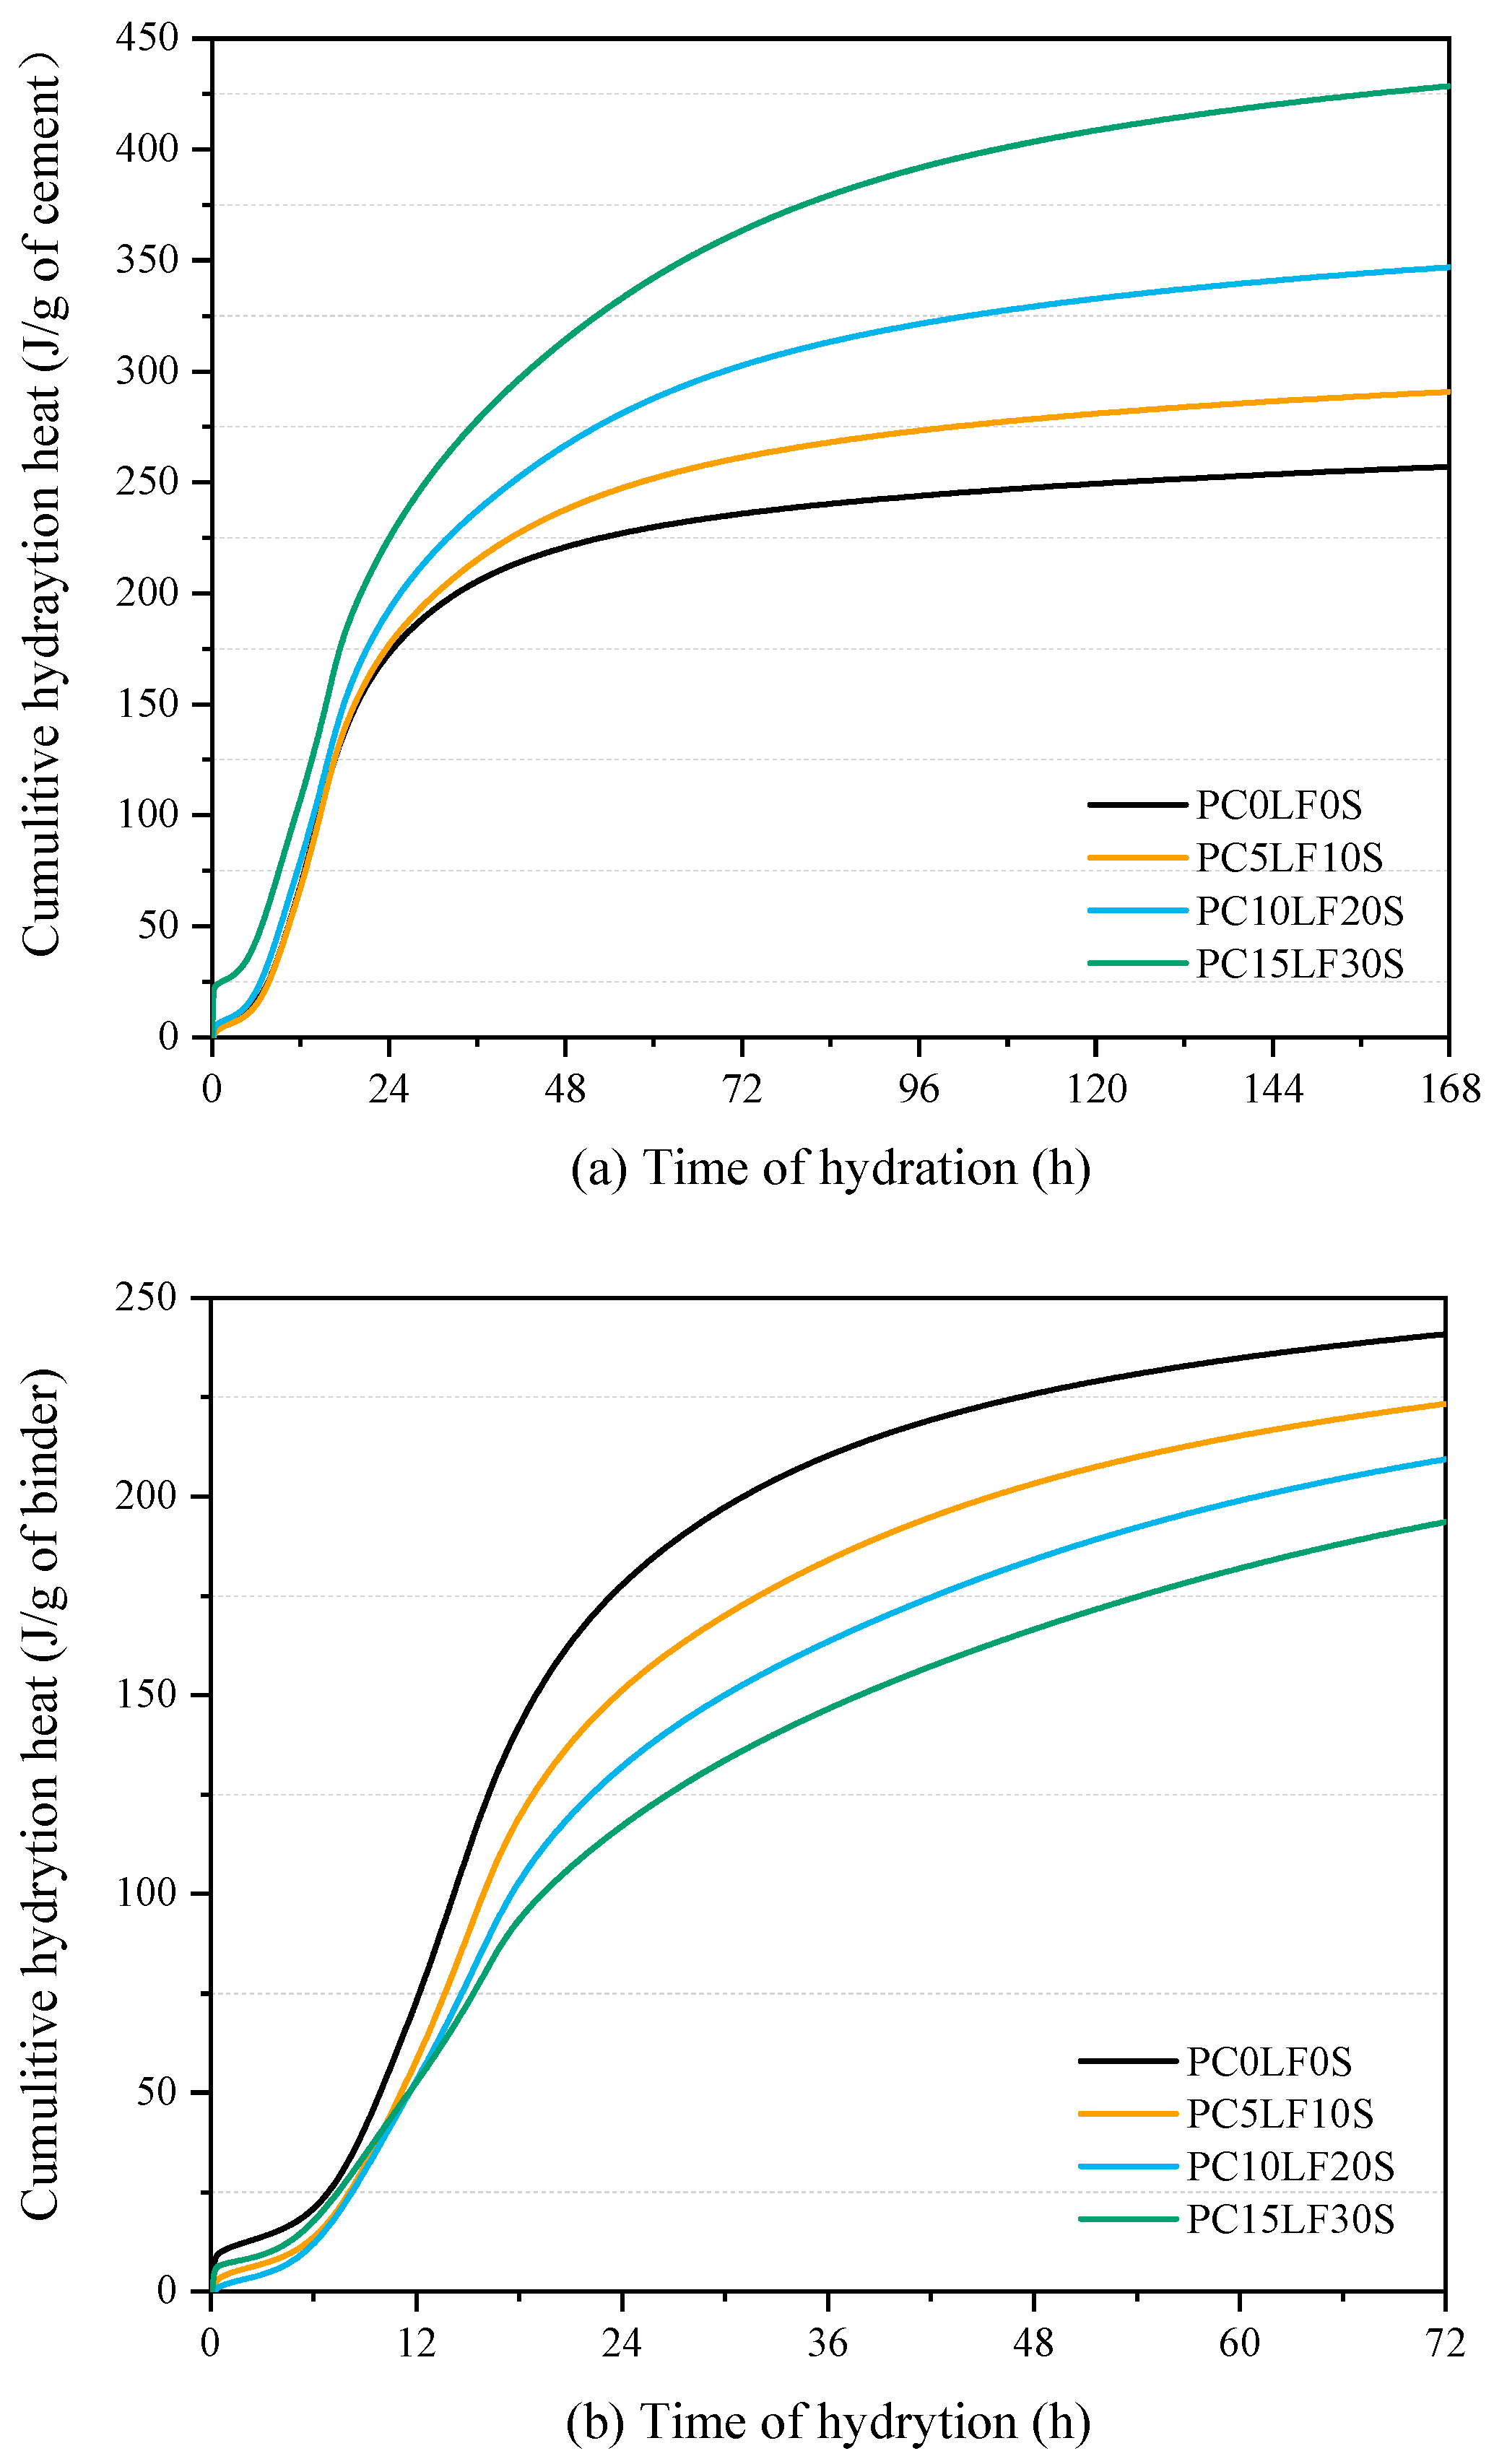
3.3. Hydration Reaction and Released Curve

Isothermal calorimetry tests of cement hydration kinetics were performed at a constant temperature of 20 °C (Figure 5a,b). The five stages of the hydration reaction include the initial reaction, the induction period, the acceleration period, the deceleration period, and the period of slow continued reaction [35]. During the acceleration period (Figure 5a), the hydration of samples PC10LF20S and PC15LF30 was significantly accelerated compared to the control (PC0LF0S). This can be attributed to the addition of SCMs during the acceleration period, which created additional shear force and accelerated the reaction rate of C3S [36]. Similar results were obtained in the study of [13], where the peak corresponding to the C3S reaction shifts forward as the amount of LF and BFS substitution in the mixture increases. This can be attributed to the increased rate of hydration with increasing LF and BFS substitution rates in the mixture, the increased heat of hydration, and the forward shift of the peak [5,33,36,37]. Therefore, it can be concluded that the filling effect of LF and BFS (i.e., the modification of the reaction by the physical presence of LF and BFS) can accelerate early-stage hydration.
After the main peak of the C3S reaction, the sulfate adsorbed in C–S–H is released, and C3A continues to react secondarily to produce calcium alumina, leading to the shoulder peak (the first peak of the aluminate reaction) [5,38,39]. It can be clearly observed from Figure 5a that the shoulder peaks corresponding to PC5LF10S, PC10LF20S, and PC15LF30 are higher than for PC0LF0S. Darquennes et al. [32] proposed that an increase in the water–cement ratio can increase the peak of the shoulder and that the fineness of the additive can also have an effect. Therefore, there are several reasons for the variation in the height of the shoulder peaks we observed: First, the replacement of LF and BFS produces a dilution effect and the effective water–cement ratio increases, leading to an increase in the shoulder peak. Second, the fineness of LF in the additive is higher than OPC, which can provide more nucleation sites for the hydration product, accelerate the hydration of cement, and contribute to the reduction of pores. However, the dilution effect of LF increases the amount of pores. The overall results of amount of pores depend on the competition of nucleation effect (increasing factor) and dilution effect (decreasing factor). In addition, Escalante-Garcia and Sharp [40] indicated that the peak of the shoulder is related to the early reaction of the BFS (alumina-rich component) in the mixture. Arora et al. [13] also found that the shoulder peak becomes more pronounced with increased substitution of BFS.
The promotion of the aluminate reaction by replacing part of the cement with SCMs is further demonstrated in Figure 6. Ternary composites (PC5LF10S, PC10LF20S, and PC15LF30) show progressively higher shoulder peaks corresponding to the aluminum phase reactions as the LF and BFS replacement rate increases. LF and BFS not only increased the peak of the main and shoulder peaks but also shifted the main peak corresponding to C3S toward the early stage. Figure 7a,b show the thermal evolution of the cumulative hydration of the mixture. From Figure 7b, it can be observed that the cumulative heat of hydration is significantly reduced by the addition of LF and BFS. This is due to the dilution effect of LF and BFS, that is, the higher the substitution rate of the cement content, the lower the cumulative heat released per gram of binder [12].
However, the cumulative heat per mass of cement increased significantly with increasing cement replacement (Figure 7a). This was due to the nucleation of LF, which promotes the hydration of cement and releases more heat of hydration [3], and because BFS undergoes an exothermic pozzolanic reaction, which increases the cumulative heat of hydration.
The correlation between cumulative hydration heat and compressive strength at 3 and 7 days is shown in Figure 8 and Table 5. A linear equation is used to make regressions between cumulative hydration heat and strength. Moreover, detailed data are added to show the values of regression equations. It can be concluded that the compressive strength increases as the cumulative hydration heat increases.

3.4. UPV

Figure 9 shows the evolution of the UPV as the curing age increases. In this study, the ultrasonic pulse test results were analyzed based on the following four aspects.
First, UPV increased rapidly during the early stages and development slowed in the later stage. In the early stage, the rate of increase of the ternary composites was significantly higher than that of the pure cement. This is attributed to the nucleation effect of LF (non-pozzolanic properties). This effect increases hydration, reduces the solidification time and total porosity, and increases early strength [33]. This phenomenon is similar to the early reaction of the heat of hydration.
Second, in the plot of UPV against curing time (Figure 9), the slope flattens with curing age. The slope of the PC0LF0S sample in the later stage is almost constant. Moreover, the slope of the samples with BFS mixed in the later stage was higher than that of pure cement. This is due to the pozzolanic reaction that occurred in the late stage of the BFS, which produced additional C–S–H gels that reduced the internal pore space.
Third, there was a crossover between the ternary composite samples and pure cement of the PC0LF0S samples. This is similar to the crossover phenomena during the development of compressive strength. Cement content decreased due to the dilution effect, the effective water–cement ratio increased, and the strength decreased, leading to a decrease in hydration products [11,41,42]. However, as the BFS response increased in the late stage, this increased the UPV development.
Fourth, as shown in Figure 10 and Table 6, an exponential equation is used to make regressions between UPV and strength at the ages of 3, 7 and 28 days. Moreover, detailed data are added to show the values of regression equations. Figure 10 shows the greater the compressive strength, the greater the value of UPV. This relationship has been verified by many other studies. Simple correlations (linear or exponential) can be used to estimate the compressive strength [43,44,45,46,47]. The results of this experiment also show an exponential regression relationship between compressive strength and UPV. Thus, we have demonstrated the feasibility of predicting the compressive strength by the UPV results measured by the NDT method.

3.5. Electrical Resistivity
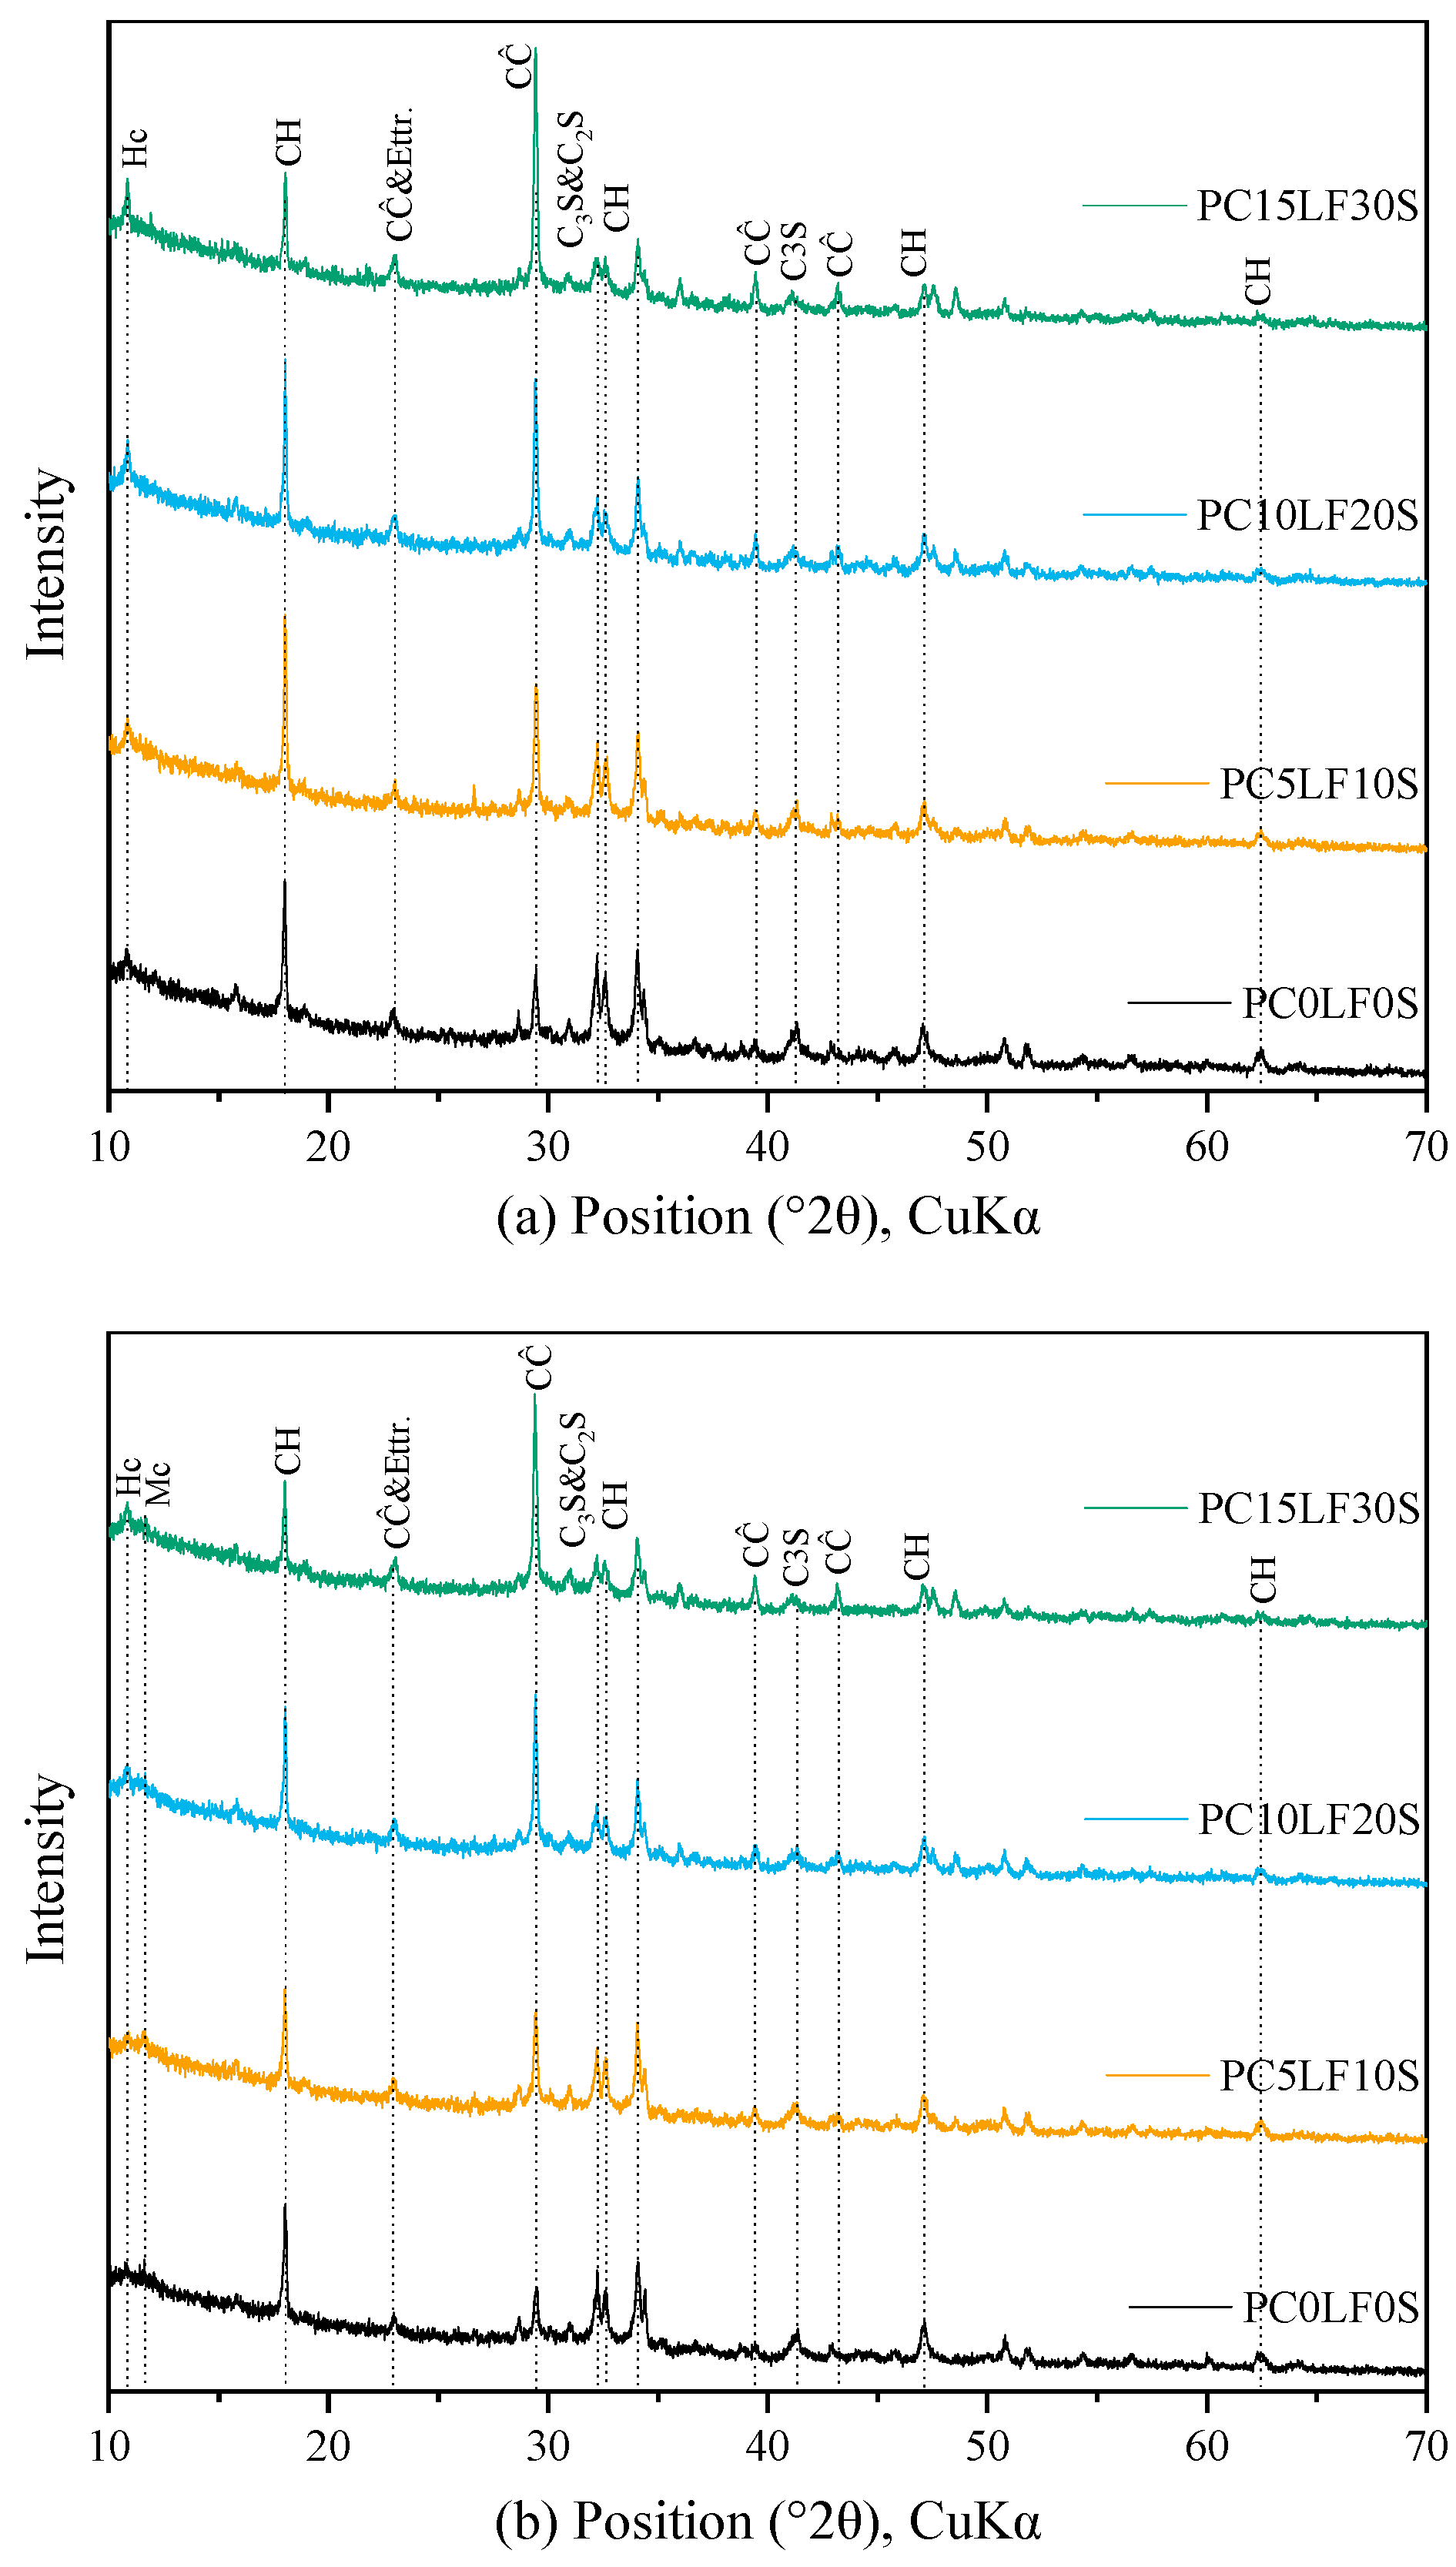
The measured surface resistivity for samples at different ages is shown in Figure 11. The electrical resistivity of the sample was mainly influenced by the pore structure (i.e., pore connectivity) and saturation [24]. The variation of the pore space of the mixture is related to several factors. First, the nucleation effect of LF accelerates the hydration rate and reduces the early mixture porosity, resulting in increased electrical resistivity [33]. Second, the dilution effect of LF filler and SCMs leads to a decrease in hydration products, a decrease in strength, and a decrease in electrical resistivity [48]. Third, the refinement of the dense structure produced by the pozzolanic reaction of the BFS and the densification of the composite matrix increases the late-stage electrical resistivity. Finally, LF reacts with aluminum phase of BFS to produce Hc and Mc, which fills the pore space and reduces the internal porosity [49].
Based on the above mechanism, we made the following three findings: First, the electrical resistivity of the mixture gradually increased with curing age. This is due to the decrease in porosity of the mixture as the age of maintenance increases [50]. Moreover, the resistivity showed a rapid increase in the early stage and a slow increase in the later stage. This is similar to the hydration heat trend.
Second, the electrical resistivity of the mixture mixed with LF and BFS increased significantly in the later stage. The electrical resistivity of samples PC5LF10S, PC10LF20S, and PC15LF30S increased by 219.5%, 397.7%, and 630.4% between 3 and 28 days, respectively, with increasing replacement content. However, the resistivity of pure cement samples PC0LF0S only increased by 97.7%. This was due to the increase in the fine pores of the pozzolanic reaction of the BFS.
Third, the electrical resistivity curves of the ternary composite samples and the pure cement samples exhibit a crossover phenomenon. The high porosity and lower electrical resistivity of BFS than pure cement was due to the dilution effect in the early stage. The later BFS reaction led to a gradual decrease in porosity and increased the electrical resistivity. Our findings show that the electrical resistivity mainly depends on the content of fine pores.

3.6. XRD

Figure 12 shows the XRD of HPC mixtures containing different replacement contents at 3 and 28 days. The main phases seen are portlandite and calcite, with a small amount of ettringite, Hc, and Mc. The presence of early LF promotes cement hydration and the dilution effect of LF, leading to a decrease of unhydrated clinker. Through electron microscopy experiments, Huang et al. [51] showed that the dehydrated cement content decreases with increasing levels of mixture replacement. However, the presence of a small amount of unhydrated clinker content can be observed even in PC15LF30S, which has the lowest cement content.
By comparing the reaction phases at 3 and 28 days, the peak corresponding to portlandite was found to be significantly weaker. This is related to the pozzolanic reaction of the BFS. Pozzolanic reactions consume portlandite, resulting in a significant decrease in calcium hydroxide content as the replacement rate increases. Due to the presence of BFS (containing aluminum phase) in the mixture, it reacts with LF to form Mc and Hc [25]. The formation of Hc can be observed at 3 days, but as the hydration reaction proceeds, the Hc content decreases, and Mc is formed [52,53]. The presence of LF prevents the decomposition of ettringite to monosulfate, and the formation of Hc and Mc indirectly stabilizes ettringite [49,54].

3.7. Fourier-Transform Infrared Spectroscopy (FTIR)

Figure 13 shows the FTIR spectra of samples at 28 days. Table 7 shows that the absorption peak at 3640 cm−1 is the O–H stretching vibration of CH [55]. The absorption bands appearing at 3395 and 1644 cm−1 are O–H tensile vibrations and bending vibrations, respectively. The asymmetric stretching vibration of CO32− occurs at a wavelength of approximately 1416 cm−1. At the wavelengths of 873 and 713 cm−1, the out-of-plane bending vibration of CO32− causes the absorption peak to be obvious [56,57]. The absorption peak caused by CO32− is related to the addition of LF. The asymmetric tensile vibration and bending vibration absorption peaks of the Si-O bond are located at wavelengths of 873 and 657 cm−1, respectively [58].
After adding LF and BFS, it can be seen that the FTIR spectra differed to those of pure cement. First, the absorption peak of CH at 3640 cm−1 decreased as BFS increased. This is because the pozzolanic reaction of BFS consumes part of the CH and the cement content decreases. Second, the wavelengths at 1109 cm−1 can be found to decrease with the reduction of cement content, because as the cement content decreases, gypsum content also decreases, and gypsum and BFS react to reduce gypsum content. Third, the wavelengths at 1416, 873, and 713 cm−1 increased with the addition of LF. The FTIR and XRD results are consistent. Fourth, the absorption peak at about 952 cm−1 of all samples did not change appreciably.

3.8. CO2 Emissions

It is well known that as global urbanization has greatly accelerated the demand for cement and cement-based materials, CO2 emissions have also increased. Finding ways to reduce CO2 emissions throughout the cement production process has become an issue that cannot be ignored. We analyzed the CO2 emissions of the samples of the designed compound in this study. The CO2 emissions of each component of cement and its density are shown in Table 8. The calculation formula we used is as follows:
CO 2 T = i = 1 5 m i CO 2 i
where CO2T is the total CO2 emissions of the mixture, mi is the mass of each component (water, superplasticizer (SP), OPC, LF, BFS) of the mixture, and CO2i is the CO2 emission per unit of each component. The CO2 emissions for each of the five components were calculated and summed. The magnitudes of CO2 emissions for each component are shown in Table 9.
Figure 14a,b show that as the cement substitution rate increases, the CO2 emissions decrease. However, according to the results of the analysis of substitution rates and compressive strength (at the ages of 28 days) in Section 3.1, it is clear that the higher the substitution rate, the lower the compressive strength of the material.
In order to better evaluate the samples in this study, the CO2 emissions of the samples were calculated by Equation (2). The results are shown in Figure 14b, where the amount of substitution increases and the CO2 emissions reduce. Thus, by replacing a portion of the cement content, the CO2 emissions are effectively reduced, while the desired mechanical properties can be maintained.
CO 2 U = CO 2 T / f c
Here, CO2U is the CO2 emission for unit strength, CO2T is the total CO2 emissions of the mixture, and fc is the compressive strength of the mixture.

4. Conclusions

In this study, the hydration, mechanical, and AS properties, durability, and sustainability of OPC–LF–BFS ternary composites were investigated based on the compressive strength, AS, isothermal calorimetry, UPV, electrical resistivity, XRD, and FTIR tests. The relationship between the macroscopic properties and the microstructure of the mixtures was also elucidated. The following conclusions can be drawn from our study:
(1)
In terms of early-stage strength (at 3 days), the compressive strength of PC5LF10S was 5.2 MPa higher than that of the control PC0LF0S. This can be attributed to the nucleation effect of LF and formation of Hc. The nucleation effect effectively promotes the hydration reaction and Hc can fill the porosity.
(2)
In terms of late-stage (28 days) strength, specimens PC5LF10S and PC10LF20S exhibited a small reduction in strength. This was due to the BFS reaction and synergistic effect of LF and BFS. However, the compressive strength of PC15LF30S was significantly lower due to the dilution effect and the lower reactivity of LF and BFS compared with cement.
(3)
The autogenous shrinkage of the ternary composites decreased with increasing cement substitution. In addition, the PC15LF30S specimen exhibited a slight swelling phenomenon in the early stage. A linear regression revealed a linear relationship between compressive strength and AS.
(4)
In terms of heat of hydration, when heat flow is normalized to the cement content, the main and shoulder peaks of the ternary composites were higher than those of the control PC0LF0S. As the replacement rate increased, the main peak shifted forward, and the peak of the silicate reaction peak appeared earlier. At 3 and 7 days, there was a linear relationship between compressive strength and cumulative hydration heat.
(5)
The experimental results for UPV showed a rapid increase in the early stage and a slow increase in the later stage, which was similar to the development of the hydration reaction. UPV showed a crossover phenomenon among various specimens, which was similar to the compressive strength development phenomenon.
(6)
In terms of electrical resistivity, the ternary composite specimen had increased the electrical resistivity, which was 91%, 160%, and 321% higher than the plain specimen at 28 days. This was due to the pore refinement due to BFS secondary reactions and the synergic effect between LF and BFS.
(7)
XRD analysis revealed the variation of Hc and Mc in the mixture. In the early stage, only Hc production was found. As the reaction proceeded, Hc transformed into Mc. The presence of LF prevented the decomposition of ettringite to monosulfate, while the formation of Hc and Mc indirectly stabilizes ettringite. A significant reduction in CH content was observed from the FTIR results.
(8)
For ternary composites, as the replacement ratio increased, the strength and total CO2 emissions decreased. CO2 emissions per unit strength were determined as the ratio of total CO2 emission to strength. For ternary composites, as the replacement ratio increased, CO2 emissions per unit strength reduced significantly. Therefore, the use of OPC–LF–BFS ternary concrete has a positive impact on sustainable development.

Author Contributions

Conceptualization, M.-Y.X.; formal analysis, M.-Y.X.; funding acquisition, X.-Y.W.; investigation, M.-Y.X. and Y.H.; methodology, M.-Y.X.; writing—original draft, M.-Y.X. and X.-Y.W.; writing—review and editing, M.-Y.X., X.-Y.W. and Y.H. All authors have read and agreed to the published version of the manuscript.

Funding

This research was supported by the Basic Science Research Program through the National Research Foundation of Korea (NRF), funded by the Ministry of Science, ICT and Future Planning (no. 2015R1A5A1037548), and an NRF grant (no. NRF-2020R1A2C4002093).

Institutional Review Board Statement

Not applicable.

Informed Consent Statement

Not applicable.

Data Availability Statement

The data presented in this study are available from the corresponding author upon a reasonable request.

Conflicts of Interest

The authors declare that they have no conflict of interest pertaining to this work. The authors also declare that they do not have any commercial or associative interests that represent a conflict of interest in connection with the work submitted.

References

  1. Yan, P.; Mi, G.; Wang, Q. A comparison of early hydration properties of cement–steel slag binder and cement–limestone powder binder. J. Therm. Anal. Calorim. 2013, 115, 193–200. [Google Scholar] [CrossRef]
  2. Miller, S.A.; John, V.M.; Pacca, S.A.; Horvath, A. Carbon dioxide reduction potential in the global cement industry by 2050. Cem. Concr. Res. 2018, 114, 115–124. [Google Scholar] [CrossRef]
  3. Wang, D.; Shi, C.; Farzadnia, N.; Shi, Z.; Jia, H.; Ou, Z. A review on use of limestone powder in cement-based materials: Mechanism, hydration and microstructures. Constr. Build. Mater. 2018, 181, 659–672. [Google Scholar] [CrossRef]
  4. De Weerdt, K.; Kjellsen, K.; Sellevold, E.; Justnes, H. Synergy between fly ash and limestone powder in ternary cements. Cem. Concr. Compos. 2011, 33, 30–38. [Google Scholar] [CrossRef]
  5. Lothenbach, B.; Scrivener, K.; Hooton, R. Supplementary cementitious materials. Cem. Concr. Res. 2011, 41, 1244–1256. [Google Scholar] [CrossRef]
  6. Ghafari, E.; Ghahari, S.A.; Costa, H.; Júlio, E.; Portugal, A.; Durães, L. Effect of supplementary cementitious materials on autogenous shrinkage of ultra-high performance concrete. Constr. Build. Mater. 2016, 127, 43–48. [Google Scholar] [CrossRef]
  7. Menéndez, G.; Bonavetti, V.; Irassar, E. Strength development of ternary blended cement with limestone filler and blast-furnace slag. Cem. Concr. Compos. 2003, 25, 61–67. [Google Scholar] [CrossRef]
  8. Courard, L.; Michel, F. Limestone fillers cement based composites: Effects of blast furnace slags on fresh and hardened properties. Constr. Build. Mater. 2014, 51, 439–445. [Google Scholar] [CrossRef] [Green Version]
  9. Carrasco, M.; Menéndez, G.; Bonavetti, V.; Irassar, E. Strength optimization of “tailor-made cement” with limestone filler and blast furnace slag. Constr. Build. Res. 2005, 35, 1324–1331. [Google Scholar] [CrossRef]
  10. Bouasker, M.; Khalifa, N.E.H.; Mounanga, P.; Kahla, N.B. Early-age deformation and autogenous cracking risk of slag–limestone filler-cement blended binders. Constr. Build. Mater. 2014, 55, 158–167. [Google Scholar] [CrossRef]
  11. Elgalhud, A.A.; Dhir, R.K.; Ghataora, G. Limestone addition effects on concrete porosity. Cem. Concr. Compos. 2016, 72, 222–234. [Google Scholar] [CrossRef]
  12. Celik, K.; Hay, R.; Hargis, C.W.; Moon, J. Effect of volcanic ash pozzolan or limestone replacement on hydration of Portland cement. Constr. Build. Mater. 2019, 197, 803–812. [Google Scholar] [CrossRef]
  13. Arora, A.; Sant, G.; Neithalath, N. Ternary blends containing slag and interground/blended limestone: Hydration, strength, and pore structure. Constr. Build. Mater. 2016, 102, 113–124. [Google Scholar] [CrossRef] [Green Version]
  14. Schöler, A.; Lothenbach, B.; Winnefeld, F.; Zajac, M. Hydration of quaternary Portland cement blends containing blast-furnace slag, siliceous fly ash and limestone powder. Cem. Concr. Compos. 2015, 55, 374–382. [Google Scholar] [CrossRef]
  15. Li, C.; Jiang, L. Utilization of limestone powder as an activator for early-age strength improvement of slag concrete. Constr. Build. Mater. 2020, 253, 119257. [Google Scholar] [CrossRef]
  16. Adu-Amankwah, S.; Zajac, M.; Stabler, C.; Lothenbach, B.; Black, L. Influence of limestone on the hydration of ternary slag cements. Cem. Concr. Res. 2017, 100, 96–109. [Google Scholar] [CrossRef]
  17. Itim, A.; Ezziane, K.; Kadri, E.-H. Compressive strength and shrinkage of mortar containing various amounts of mineral additions. Constr. Build. Mater. 2011, 25, 3603–3609. [Google Scholar] [CrossRef]
  18. ASTM C349-14. Standard Test Method for Compressive Strength of Hydraulic–Cement Mortars (Using Portions of Prisms Broken in Flexure); ASTM International: West Conshohocken, PA, USA, 2014. [Google Scholar]
  19. ASTM C1698-09. Standard Test Method for Autogenous Strain of Cement Paste and Mortar; ASTM International: West Conshohocken, PA, USA, 2014. [Google Scholar]
  20. Kumarappa, D.B.; Peethamparan, S.; Ngami, M. Autogenous shrinkage of alkali activated slag mortars: Basic mechanisms and mitigation methods. Cem. Concr. Res. 2018, 109, 1–9. [Google Scholar] [CrossRef]
  21. Li, Z.; Liu, J.; Xiao, J.; Zhong, P. Internal curing effect of saturated recycled fine aggregates in early-age mortar. Cem. Concr. Compos. 2020, 108, 103444. [Google Scholar] [CrossRef]
  22. Scrivener, K.; Snellings, R.; Lothenbach, B. A Practical Guide to Microstructural Analysis of Cementitious Materials; CRC Press: Boca Raton, FL, USA, 2018. [Google Scholar]
  23. Concu, G.; Trulli, N. Concrete defects sizing by means of ultrasonic velocity maps. Buildings 2018, 8, 176. [Google Scholar] [CrossRef] [Green Version]
  24. Azarsa, P.; Gupta, R. Electrical resistivity of concrete for durability evaluation: A review. Adv. Mater. Sci. Eng. 2017, 2017, 8453095. [Google Scholar] [CrossRef] [Green Version]
  25. Wang, Y.; Shui, Z.; Wang, L.; Gao, X.; Huang, Y.; Song, Q.; Liu, K. Alumina-rich pozzolan modification on Portland-limestone cement concrete: Hydration kinetics, formation of hydrates and long-term performance evolution. Constr. Build. Mater. 2020, 258, 119712. [Google Scholar] [CrossRef]
  26. Adu-Amankwah, S.; Black, L.; Skocek, J.; Haha, M.B.; Zajac, M. Effect of sulfate additions on hydration and performance of ternary slag-limestone composite cements. Constr. Build. Mater. 2018, 164, 451–462. [Google Scholar] [CrossRef]
  27. Craeye, B.; De Schutter, G.; Desmet, B.; Vantomme, J.; Heirman, G.; Vandewalle, L.; Cizer, Ö.; Aggoun, S.; Kadri, E. Effect of mineral filler type on autogenous shrinkage of self-compacting concrete. Cem. Concr. Res. 2010, 40, 908–913. [Google Scholar] [CrossRef]
  28. Duran-Herrera, A.; De-León-Esquivel, J.; Bentz, D.P.; Valdez-Tamez, P. Self-compacting concretes using fly ash and fine limestone powder: Shrinkage and surface electrical resistivity of equivalent mortars. Constr. Build. Mater. 2019, 199, 50–62. [Google Scholar] [CrossRef]
  29. Baroghel-Bouny, V.; Mounanga, P.; Khelidj, A.; Loukili, A.; Rafai, N. Autogenous deformations of cement pastes: Part II. W/C effects, micro–macro correlations, and threshold values. Cem. Concr. Res. 2006, 36, 123–136. [Google Scholar] [CrossRef] [Green Version]
  30. Zhang, G.-Z.; Cho, H.-K.; Wang, X.-Y. Effect of Nano-Silica on the Autogenous Shrinkage, Strength, and Hydration Heat of Ultra-High Strength Concrete. Appl. Sci. 2020, 10, 5202. [Google Scholar] [CrossRef]
  31. Wu, L.; Farzadnia, N.; Shi, C.; Zhang, Z.; Wang, H. Autogenous shrinkage of high performance concrete: A review. Constr. Build. Mater. 2017, 149, 62–75. [Google Scholar] [CrossRef]
  32. Darquennes, A.; Staquet, S.; Delplancke-Ogletree, M.-P.; Espion, B. Effect of autogenous deformation on the cracking risk of slag cement concretes. Cem. Concr. Compos. 2011, 33, 368–379. [Google Scholar] [CrossRef]
  33. Acharya, P.K.; Patro, S.K. Effect of lime and ferrochrome ash (FA) as partial replacement of cement on strength, ultrasonic pulse velocity and permeability of concrete. Constr. Build. Mater. 2015, 94, 448–457. [Google Scholar] [CrossRef]
  34. Li, Y.; Bao, J.; Guo, Y. The relationship between autogenous shrinkage and pore structure of cement paste with mineral admixtures. Constr. Build. Mater. 2010, 24, 1855–1860. [Google Scholar] [CrossRef]
  35. Hu, J.; Ge, Z.; Wang, K. Influence of cement fineness and water-to-cement ratio on mortar early-age heat of hydration and set times. Constr. Build. Mater. 2014, 50, 657–663. [Google Scholar] [CrossRef]
  36. Scrivener, K.L.; Juilland, P.; Monteiro, P.J. Advances in understanding hydration of Portland cement. Cem. Concr. Res. 2015, 78, 38–56. [Google Scholar] [CrossRef]
  37. Puerta-Falla, G.; Balonis, M.; Le Saout, G.; Falzone, G.; Zhang, C.; Neithalath, N.; Sant, G. Elucidating the role of the aluminous source on limestone reactivity in cementitious materials. J. Am. Ceram. Soc. 2015, 98, 4076–4089. [Google Scholar] [CrossRef]
  38. Quennoz, A.; Scrivener, K.L. Interactions between alite and C3A-gypsum hydrations in model cements. Cem. Concr. Res. 2013, 44, 46–54. [Google Scholar] [CrossRef]
  39. Bergold, S.; Goetz-Neunhoeffer, F.; Neubauer, J. Interaction of silicate and aluminate reaction in a synthetic cement system: Implications for the process of alite hydration. Cem. Concr. Res. 2017, 93, 32–44. [Google Scholar] [CrossRef]
  40. Escalante-Garcia, J.-I.; Sharp, J. The chemical composition and microstructure of hydration products in blended cements. Cem. Concr. Compos. 2004, 26, 967–976. [Google Scholar] [CrossRef]
  41. Ye, G.; Lura, P.; Van Breugel, K.; Fraaij, A. Study on the development of the microstructure in cement-based materials by means of numerical simulation and ultrasonic pulse velocity measurement. Cem. Concr. Compos. 2004, 26, 491–497. [Google Scholar] [CrossRef]
  42. Afrakoti, M.T.P.; Choobbasti, A.J.; Ghadakpour, M.; Kutanaei, S.S. Investigation of the effect of the coal wastes on the mechanical properties of the cement-treated sandy soil. Constr. Build. Mater. 2020, 239, 117848. [Google Scholar] [CrossRef]
  43. Estévez, E.; Martín, D.A.; Argiz, C.; Sanjuán, M.Á. Ultrasonic Pulse Velocity—Compressive Strength Relationship for Portland Cement Mortars Cured at Different Conditions. Crystals 2020, 10, 133. [Google Scholar] [CrossRef]
  44. Yoo, D.-Y.; Shin, H.-O.; Yoon, Y.-S. Ultrasonic monitoring of setting and strength development of ultra-high-performance concrete. Materials 2016, 9, 294. [Google Scholar] [CrossRef]
  45. Demirboğa, R.; Türkmen, İ.; Karakoc, M.B. Relationship between ultrasonic velocity and compressive strength for high-volume mineral-admixtured concrete. Cem. Concr. Res. 2004, 34, 2329–2336. [Google Scholar] [CrossRef]
  46. Godinho, J.P.; De Souza Júnior, T.; Medeiros, M.H.F.; SILVA, M.A. Factors influencing ultrasonic pulse velocity in concrete. Rev. IBRACON Estrut. Mater. 2020, 13, 222–247. [Google Scholar] [CrossRef]
  47. Shen, D.; Wen, C.; Zhu, P.; Wu, Y.; Yuan, J. Influence of Barchip fiber on early-age autogenous shrinkage of high strength concrete. Constr. Build. Mater. 2020, 256, 119223. [Google Scholar] [CrossRef]
  48. Cyr, M.; Lawrence, P.; Ringot, E. Efficiency of mineral admixtures in mortars: Quantification of the physical and chemical effects of fine admixtures in relation with compressive strength. Cem. Concr. Res. 2006, 36, 264–277. [Google Scholar] [CrossRef]
  49. Ramezanianpour, A.M.; Hooton, R.D. A study on hydration, compressive strength, and porosity of Portland-limestone cement mixes containing SCMs. Cem. Concr. Compos. 2014, 51, 1–13. [Google Scholar] [CrossRef]
  50. Dhandapani, Y.; Santhanam, M. Assessment of pore structure evolution in the limestone calcined clay cementitious system and its implications for performance. Cem. Concr. Compos. 2017, 84, 36–47. [Google Scholar] [CrossRef]
  51. Huang, W.; Kazemi-Kamyab, H.; Sun, W.; Scrivener, K. Effect of cement substitution by limestone on the hydration and microstructural development of ultra-high performance concrete (UHPC). Cem. Concr. Compos. 2017, 77, 86–101. [Google Scholar] [CrossRef]
  52. Lothenbach, B.; Le Saout, G.; Gallucci, E.; Scrivener, K. Influence of limestone on the hydration of Portland cements. Cem. Concr. Res. 2008, 38, 848–860. [Google Scholar] [CrossRef]
  53. Mo, Z.; Gao, X.; Su, A. Mechanical performances and microstructures of metakaolin contained UHPC matrix under steam curing conditions. Constr. Build. Mater. 2021, 268, 121112. [Google Scholar] [CrossRef]
  54. Qin, L.; Gao, X.; Su, A.; Li, Q. Effect of carbonation curing on sulfate resistance of cement-coal gangue paste. J. Clean. Prod. 2021, 278, 123897. [Google Scholar] [CrossRef]
  55. Silva, D.; Roman, H.; Gleize, P. Evidences of chemical interaction between EVA and hydrating Portland cement. Cem. Concr. Res. 2002, 32, 1383–1390. [Google Scholar] [CrossRef]
  56. Ylmén, R.; Jäglid, U.; Steenari, B.-M.; Panas, I. Early hydration and setting of Portland cement monitored by IR, SEM and Vicat techniques. Cem. Concr. Res. 2009, 39, 433–439. [Google Scholar] [CrossRef]
  57. Ren, M.; Wen, X.; Gao, X.; Liu, Y. Thermal and mechanical properties of ultra-high performance concrete incorporated with microencapsulated phase change material. Constr. Build. Mater. 2020, 121714. [Google Scholar] [CrossRef]
  58. Lin, R.-S.; Lee, H.-S.; Han, Y.; Wang, X.-Y. Experimental studies on hydration–strength–durability of limestone-cement-calcined Hwangtoh clay ternary composite. Constr. Build. Mater. 2020, 269, 121290. [Google Scholar] [CrossRef]
Figure 1. Comparison of particle size distributions and cumulative volume. (a) Particle size distributions; (b) cumulative volume.
Sustainability 13 01881 g001
Figure 2. Development of compressive strength with curing age.
Sustainability 13 01881 g002
Figure 3. The change curve of autogenous shrinkage (AS) in over the first seven days.
Sustainability 13 01881 g003
Figure 4. Relationship between AS and compressive strength.
Sustainability 13 01881 g004
Figure 5. Seventy-two hour isothermal calorimetry curve. (a) Normalized heat flow of the cement content; (b) normalized heat flow of the binder content.
Sustainability 13 01881 g005aSustainability 13 01881 g005b
Figure 6. Variation of aluminate peak at different replacement rates.
Sustainability 13 01881 g006
Figure 7. Cumulative hydration heat of mixed paste: (a) Cumulative heat is normalized to the cement content; (b) cumulative heat is normalized to the binder content.
Sustainability 13 01881 g007
Figure 8. Relationship between cumulative hydration heat and compressive strength.
Sustainability 13 01881 g008
Figure 9. Ultrasonic pulse velocity (UPV) change with the development of the curing age.
Sustainability 13 01881 g009
Figure 10. Relationship between compressive strength and UPV.
Sustainability 13 01881 g010
Figure 11. Electrical resistivity with the development of curing age.
Sustainability 13 01881 g011
Figure 12. Effect of LF and BFS on the reaction phase of the mixture after (a) 3 days and (b) 28 days of hydration. Hc—hemicarboaluminate, Mc—monocarboaluminate, CH—portlandite, CĈ— Calcite, Ettr—ettringite.
Sustainability 13 01881 g012
Figure 13. Fourier-Transform Infrared Spectroscopy (FTIR) spectra of hydrated cements.
Sustainability 13 01881 g013
Figure 14. Trends in CO2 emissions with cement replacement: (a) Trend in CO2 emissions; (b) CO2 emissions per unit strength.
Sustainability 13 01881 g014
Table 1. Chemical composition of materials.
OxidesOrdinary Portland Cement (OPC)Limestone Filler (LF)Blast Furnace Slag (BFS)
CaO63.2857.6238.30
SiO222.1236.10
Al2O35.670.2014.80
Fe2O32.600.48
MgO2.900.526.47
Na2O0.050.05
TiO20.240.61
SO32.341.60
Loss on ignition0.5441.301.17
Table 2. Mixture ratio of high-performance cement.
LabelsBinders (%)w/bSuperplasticizer
(wt % of Binder)
OPCLFBFS
PC0LF0S1000.30.25
PC5LF10S855100.30.25
PC10LF20S7010200.30.25
PC15LF30S5515300.30.25
Table 3. Experimental methods and scope.
MethodTest SamplesTest Time
Compressive strengthAll samples3, 7, and 28 days
Autogenous shrinkageAll samples1–7 days
Isothermal calorimetryAll samples168 h
Ultrasonic pulse velocityAll samples1–28 days
Electrical resistivityAll samples1–28 days
X-ray diffractionAll samples3 and 28 days
ATR-FTIR spectraAll samples28 days
Table 4. Detailed data of Figure 4.
DaysRatio
(%)
Compressive Strength
(Mpa)
Experiment-AS
(μm/m)
Regression-AS
(μm/m)
3 D056.74−990.02−538.68
1561.95−582.05−694.47
3054.02−493.84−457.35
4545.65−49.14−207.08
7 D076.23−1168.51−1121.45
1571.75−1061.74−987.50
3074.41−950.23−1067.03
4561.40−456.26−678.02
Table 5. Detailed data of Figure 8.
DaysRatio
(%)
Heat
(J/g)
Experiment-Compressive Strength
(MPa)
Regression-Compressive Strength
(MPa)
3 D0240.9056.7467.07
15223.3761.9559.48
30209.4154.0253.44
45193.6645.6546.62
7 D0262.0376.2376.21
15248.4371.7570.33
30240.3874.4166.84
45229.4161.4062.10
Table 6. Detailed data of Figure 10.
DaysRatio
(%)
UPV
(m/s)
Experiment-Compressive Strength
(MPa)
Regression-Compressive Strength
(MPa)
3 D0362556.7458.87
15361061.9557.65
30357654.0254.97
45349045.6548.73
7 D0370076.2365.39
15373171.7568.29
30373174.4168.29
45371561.4066.77
28 D0373187.2268.29
15380484.3475.64
30386081.5981.80
45387670.0883.66
Table 7. Bands identification.
RegionFrequency cm−1Group
3640ν OH
3395ν3 H2O
1644ν2 H2O
1416ν3 CO32−
1109ν3 SO42−
952ν3 SiO44−
873ν2 CO32−, ν4 SiO44−
713ν4 CO32−
657ν4 SiO44−
Table 8. CO2 emissions and density of cement mixture [2].
ComponentUnit CO2 Emissions (kg/kg)Density (kg/m3)
Water0.0001961000
SP0.251220
OPC0.863150
LF0.0082710
BFS0.092880
Table 9. Comparison of CO2 emissions from OPC and ternary composites production.
TypeMass of Binder (kg/m3)CO2 Emission (kg/kg)Total
(kg/m3)
CO2 Emission per Unit Strength
OPCLFBFSOPCLFBFS
PC0LF0S1614.181388.201389.3015.93
PC5LF10S1359.8679.99159.981169.480.6414.401185.6114.06
PC10LF20S1110.03158.58317.15954.621.2728.54985.5212.08
PC15LF30S864.55235.79471.57743.511.8942.44788.9211.26
Publisher’s Note: MDPI stays neutral with regard to jurisdictional claims in published maps and institutional affiliations.

