Abstract
This study evaluates the potential of sewage sludge, farm manure, rock phosphate, and their composts or biochar as useful materials for phosphorous (P) recovery. An alkaline–calcareous soil was incubated with different compost-based amendments to discern their impact on the P sorption characteristics. The treatments examined consisted of sewage sludge (SS), SS biochar (SS-BC), or composts of SS with rock phosphate (RP) and farm manure (FM) in different ratios, i.e., (i) control, (ii) SS, (iii) SS-BC, (iv) SS50:FM50, (v) SS75:FM25, (vi) SS25:FM25:RP50, (vii) SS50:FM25:RP25, (viii) SS75:FM0:RP25, and (ix) SS50:FM0:RP50. Prior to incubation for 45 days, the composts and biochar treatments combinations were characterized for elemental composition using Fourier transform infrared (FTIR) spectroscopy and X-ray diffraction (XRD) spectroscopy. The treated soils were analyzed for soil pH, electrical conductivity (EC), Olsen’s P, and P adsorption isotherms, at day 5 and 45 of the incubation. Langmuir and Freundlich’s equations were used to calculate P adsorption. Results showed that there was no significant influence on soil pH for any treatment throughout the experiment. However, soil EC decreased significantly for all treatments after 5 days of incubation; however, this effect was diminished after 45 days of incubation. All the treatments significantly decreased P sorption capacity both at the start (day 5) and end of the incubation (day 45) period compared to control. The treatment combination SS25:FM25:RP50 recovered the highest Olsen-P (79.41 mg kg−1). The other treatment combinations including SS and FM also recovered a greater Olsen’s P compared to the control. However, the sole application of only SS showed lower P recovery than the control soil, which further decreased with increase in incubation time. These findings improve our understanding that the stable pool of bioavailable P within an alkaline calcareous soil can be mobilized by using different organic treatment combinations instead of only SS. However, further in situ investigations may help to valorize the potential of sewage sludge, farm manure, rock phosphate, and their composts or biochar to improve P recovery in alkaline–calcareous.
Keywords:
adsorption isotherms; alkaline; aridisol; biochar; calcareous soil; phosphorus; sewage sludge 1. Introduction
Phosphorus (P), a macronutrient required in sufficient amounts in soils to ensure the productivity of agroecosystems, is becoming depleted, posing a serious threat to global food security [1,2]. The availability of P to agroecosystems is further lowered in soils with high P-sorbing capacity [3,4]. Recent developments in global agriculture have led to the overuse of P as a result—through application to lands as inorganic P fertilizers, leading to associated environmental concerns such as eutrophication [5,6]. Thus, the understanding and management of the complex P biogeochemical cycle processes, which vary greatly in different soil types and with different soil properties (pH, organic matter, and ionic concentrations etc.), are of great importance for the effective management of soil properties for agriculture ecosystems [6,7,8]. For instance, in calcareous soils that are rich in calcium carbonate (CaCO3) and with higher pH (8 to 8.5), P is highly reactive with CaCO3 [9]. Reactions between P and CaCO3 lead to precipitation, reducing the availability of P for plant uptake [10] and further increasing dependence on inorganic P fertilizer applications. To meet this demand, large quantities of inorganic P fertilizers are manufactured by mining of non-renewable rock phosphate, which further influences the global P cycle [11]. P depletion is an increasingly global issue [12,13] and, as such, it has become necessary to revisit existing agricultural practices to determine new resource management practices that utilize renewable resources [6,12].
The potential for the use of renewable P resources obtained from waste materials (e.g., food waste, slaughterhouse waste, crop residues, farm manure, compost, pyrolysis of inorganic waste for biochar production) has been the subject of increasing research attention as an option for increasing sustainable P management in agricultural ecosystems [7,13,14,15]. The P recovery from waste waters or sludges is associated with metals and pathogens [16,17]. The conversion of farm manure and sewage sludge to biochar generates additional benefits, which include reduced waste volume, decreased risk of pathogenicity and organic pollutants, and, most significantly, the conversion of these materials to a stable carbon form that is resistant to temperature or microbial degradation, and enables the reduction of greenhouse gas emissions through carbon capture [18,19,20,21,22]. The other benefits linked with biochar preparation using sludge are value addition, volume change, and the formation of a stable product [23] and conversion of toxic metals into relatively low biological available fraction [24].
The effects of crop residues on P transformation in soils is increasingly well understood [25]; however, investigations into the utilization efficiency of other organic P sources such as compost, sewage sludge, farm manure, biochar and struvite [12,26], and their interactions with soil P pools are required to model and manage organic P on a sustainable basis. For instance, the use of organic P resources can affect the soil chemistry, leading to changes to the P fractions and their quantities [27]. P uptake by maize was reported to be significantly increased with increasing rate of biochar addition (pine wood and pruning biochar; at 0, 15 and 30 Mg ha−1) in rain-fed or irrigated treatments in a temperate field study [28], suggesting that greater water-holding capacity also has an additional role in organically amended soils. [29] reported that the use of manure and sewage sludge as a source of organic P prevented the sorption of P, thereby enhancing the recyclability of P in the soils. Another study by [30] investigated seven organic materials—(i) anaerobic digestate (AD), (ii) sewage sludge (SS), (iii) green compost (GC), (iv) chicken manure (CM), (v) food waste compost (FWC), (vi) seaweed, and (vii) biochar)—for their mineral composition and P speciation. The P leaching/availability for some of the organic sources (CM, SS, GC, and AD) was varied significantly; as such, it was suggested that a greater understanding of the organics chemical behavior is required in order to determine their suitability for use in agronomic applications.
Herein, we have worked to address the identified research gaps. To do so, we investigate alkaline soil due to its abundance in the Pakistan’s cultivable land, which is extremely deficient in available P. To improve the mechanistic understanding of P sorption characteristics, the impact of various amendments: sewage sludge (SS), SS-biochar, and composts of SS with rock phosphate (RP) and farm manure (FM) on the P sorption characteristics of the alkaline calcareous soils under incubation was assessed. It was hypothesized that the composition and mixture of different organic sources would regulate the P behavior (sorption and release) in agricultural soils. This hypothesis was tested through (1) evaluating the impact of single component amendments of sorption isotherms and (2) evaluating P sorption behavior of their combinations in different ratios.
2. Material and Methods
2.1. Experimental Site
The soil used in this study was collected from the experimental area of the Bahauddin Zakariya University, Multan (Latitude 030°15′36″ N and Longitude 071°30′53″ E). The selected soil is well-drained, weakly structured, and moderate to strongly calcareous. A detailed characterization of this soil may be seen in our previous study [31]. The experimental region falls under a semi-arid subtropical climate.
2.2. Experimental Inputs
The sewage sludge was collected from a waste-water treatment plant of Multan district in south Punjab of Pakistan [31]. The rock phosphate was collected from rocks classified as sedimentary and igneous consistent with those commonly used in the production of P-based fertilizers. A detailed description of the source and characteristics of the rock phosphate are reported by [32]. The biochar was produced through the slow pyrolysis of sewage sludge at 450 °C using a vertical silo-type reactor [33].
The detailed composting procedure and basic properties are referred to in our recent studies [34]. Briefly, the mixtures of sewage sludge (SS), rock phosphate (RP), and farm manure (FM) were packed into belowground compost heaps and covered. Aeration was provided through perforated pipes, and mixtures were turned regularly until maturity. Each material was ground to <150 µm using a pestle and mortar. The Fourier transform infrared spectroscopy (FTIR, Agilent Cary 630 FTIR Spectrometer) was used for the analysis of the farm manure, sewage sludge, rock phosphate, and co-composts. The spectra wavelength range used was 400 to 4000 cm−1. The X-ray diffraction (XRD) analysis was performed on 15 mg samples using an Olympus BTX90012 with a cobalt X-ray source (30 kV Co anode micro-focus X-ray tube) coupled with a high-resolution charge-coupled device (CCD) detector (0.25° 2θ FWHM), and XRD range 5–55° 2θ. X-powder software (version 2010, PRO, XPOWDER Granada, Spain) was used for phase-identification and semi-quantification of the generated spectra. For the preparation of the compost, different proportions of the sewage sludge, farm manure and rock phosphate were mixed and composted (Table 1, detailed physicochemical properties have been reported in Rehman and Qayyum [27]).

Table 1.
Composition of the composted mixtures used as sample treatments. SS = sewage sludge, SS-BC = co-composted sewage sludge and biochar, FM = farm manure, RP = rock phosphate.
2.3. Experimental Setup
The following treatments were prepared: T1 control, T2 sewage sludge, T3 sewage sludge biochar, T4 SS50:FM50, T5 SS75:FM25, T6 SS25:FM25:RP50, T7 SS5O:FM25:RP25, T8 SS75:FM0:RP25, and T9 SS50:FM0:RP50. All the treatments, except for T1 (control), were thoroughly homogenized at a rate of 1 g inorganic-P (KH2PO4) in 100 g air-dried soil and filled into glass jars (capacity 250 mL). The jars were covered with a lid and incubated in the dark at 26 °C for 45 days. The jars were maintained at 50% water-holding capacity (WHC) with water loss monitored twice a week and corrected on a weight loss basis. The soil was sub-sampled (50 g sample collected) at day 5 and 45 of the incubation period. Sub-samples were oven-dried at 65 °C before being ground to pass through a 2 mm sieve and analyzed for pH, electrical conductivity (EC), Olsen-P, and P-adsorption isotherm.
A suspension of soil and water (1:5) was used for the determination of pH and EC using pH meter (BANTE PHS-25CW) and EC meter (BANTE DDS-11AW). For Olsen-P, a commonly used indicator of soil fertility, a 0.5 g sample was equilibrated with 10 ml of NaHCO3 and filtered. The P concentration in the extracts was determined using the molybdenum blue methods as described by Murphy and Riley [28].
Briefly, for determination of the P sorption, 1 g of each soil treatment was equilibrated with 10 mL (0.01 M) CaCl2 solution containing different P concentrations (0, 1, 2, 5, 10, 20, 40, 80, and 100 mg P L−1 as KH2PO4). Then, samples were shaken for 24 h at 25 ± 1 °C, after which the suspensions were allowed to settle and filtered (Whatman 42). A 1 mL sample of the filtrate was taken for molybdenum blue color development following [35] and analyzed for P on a spectrophotometer (BMS CANADA UV 1602) at a wavelength of 882 nm. The concentration of adsorbed P was plotted against intensity (equilibrium P concentration), and Langmuir and Freundlich equations were using to calculate the P absorption isotherms for each treatment.
2.4. Statistical Analyses
The results obtained for the P sorption and physicochemical properties of the incubated soils were subjected to analysis of variance (ANOVA). Any significant difference among various treatment means were determined by applying Tukey’s Honest Significant Difference Test (Tukey’s HSD). The relationship between the measured physicochemical properties was determined by correlation analysis. All statistical analyses were performed using Statistix (version 8.1, Analytical Software, FL, USA).
3. Results
3.1. Characterization of the SS, SS-BC, RP, FM, and Their Co-Composts
The physicochemical properties of the co-composts used in this study have been reported and discussed in detail by [34]. Herein, we present the identification of minerals through XRD and characteristics of functional groups through FTIR.
3.1.1. Nutrient Analysis of SS and SS-BC
The sewage sludge (SS) and sewage sludge biochar (SS-BC) were analyzed for pH, EC, total organic matter, metal concentration, nitrogen, and phosphorus concentration. In SS, pH and EC were almost 6.67 and 1200 µsm−1, respectively. Total organic matter was 22.45%, and total nitrogen was 1.45%. The phosphorus fractions—total-P, inorganic-P, organic-P, and Olsen-P—were 13.33 g kg−1, 12.89 g kg−1, 0.44 g kg−1, and 7.76 mg kg−1, respectively. In SS-BC, the pH, EC, and OM were 8.45, 1600 µsm−1, and 25.5%, respectively. The total nitrogen concentration was 0.43% while phosphorus fractions—total-P, inorganic-P, organic-P and Olsen-P—were 13.03 g kg−1, 12.77 g kg−1, 0.27 g kg−1, and 8.25 mg kg−1, respectively.
3.1.2. Mineralogical Analysis of the Raw SS, SS-BC, RP, and FM Materials
The XRD patterns of the SS and SS-BC presented in Figure 1 show a mixture of various phases.
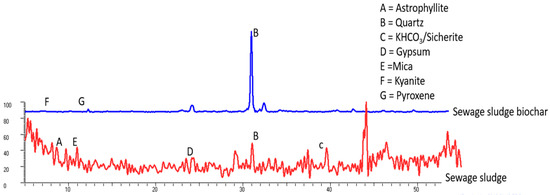
Figure 1.
X-ray diffraction (XRD) pattern of the sewage sludge (SS, red line) and sewage sludge biochar (SS-BC, blue line) showing different minerals.
The SS samples comprised astrophyllite mineral (2θ 9.68, d-spacing 10.595), which contains K, Na, Mg, Ti, Mn, Fe, Si, H, O, and F as constituent elements; quartz (2θ 31, d-spacing 3.34); KHCO3 as sicherite (2θ 39.67, d-spacing 2.64); gypsum (2θ 24.14 d-spacing 4.25); and mica (2θ 10.85 d-spacing 9.46).
Meanwhile, the SS-BC sample showed quartz enrichment, kyanite (2θ 4.51 d-spacing 4.48), and traces of pyroxene (2θ 24.14 d-spacing 4.25). The rest of the minerals found in the SS such as astrophyllite, gypsum, and mica were not observed in the SS-BC.
The XRD spectrum for the FM shows the presence of three main minerals: armstrongite (CaZrSi6O15•3(H2O), d-spacing 3.05 and 4.30), berlinite (AlPO4, d-spacing 3.33), and heklaite (KNaSiF6, d-spacing 2.28) (Figure 2). Based on the XRD data, it is evident that the FM was composed of alkaline element enriched minerals such as armstrongite, and kyanite minerals (aluminosilicates) and heklaite), which comprise K, Na, Si, and F. The presence of these elements in the FM is expected to have occurred through the food chain (coming from soil to fodder, which is eaten and then becomes part of cattle manure (FM)).
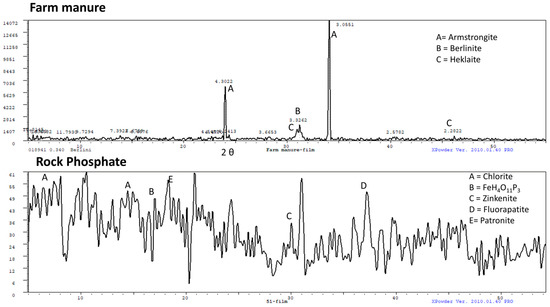
Figure 2.
X-ray diffraction (XRD) pattern of the farm manure (FM) and rock phosphate (RP).
The XRD spectra of the RP show the presence of chlorite (7.40, 14.79, and 29.87 2θ, with d-spacings 13.71, 6.94, and 4.37 respectively), FeH4O11P3 = F (2θ 17.08, d-spacing 6.02), zinkenite (2θ 30.08, d-spacing 3.45), fluorapatite (2θ 37.27, d-spacing 2.80), and patronite (2θ 18.32, d-spacing 5.62) minerals.
The XRD for the co-composts of SS, FM, and RP (T4–T9 treatments, Table 1) are presented in Supplementary Figure S1. The XRD peaks show a mixture of various phases in the treatments:
T4 (SS50:FM50) comprises pentagonite (2θ 12.30, 16.81, 23.0, d-spacing 8.34, 6.12, 4.48), moganite (2θ 30.9, 23.0, d-spacing 3.6, 4.48), kanemite (2θ 10.05, 25.79, 30.26, d-spacing 10.21, 4.0, 3.43), and kyanite (2θ 22.93, d-spacing 4.50).
T5 (SS75:FM25) comprises moganite, (2θ 30.9, 23.0, d-spacing 3.6, 4.48, fibraferrite (2θ 8.48, d-spacing 12.1); pentagonite (2θ 12.30, 16.81, 23.0, d-spacing 8.34, 6.12, 4.48), astrophyte (2θ 9.77, d-spacing 10.51), and gypsum (2θ 24.14, d-spacing 4.28).
T6 (SS25:FM25:RP50) showed an enrichment of pentagonite (2θ 12.30, 16.81, 23.0, d-spacing 8.34, 6.12, 4.48), kyanite (2θ 22.93, d-spacing 4.50), moganite (2θ 30.9, 23.0, d-spacing 3.6, 4.48), and fluorapatite (2θ 37.30, d-spacing 2.79).
T7 (SS50:FM25: RP25) showed an enrichment of coalingite (2θ 16.50, 8.25, d-spacing 6.23, 12.43), cancrinite (2θ 16.30, d- spacing 6.31), feldspar 2θ 32.05, d-spacing 3.24), and fibroferrite (2θ 8.50, d-spacing 12.07).
T8 (SS75:FM0:RP25) indicated an enrichment of MgSO4.(H2O) (2θ 21.45,30.46, d-spacing 4.80, 3.40), moganite (2θ 30.9, 23.0, d-spacing 3.6, 4.48), fibraferrite (2θ 8.48, d-spacing 12.05), pentagonite (2θ 12.30, 16.81, 23.0, d-spacing 8.34, 6.12,4.48), kyanite (2θ 22.93, d-spacing 4.50)), and gypsum (2θ 24.14, d-spacing 4.28).
T9 (SS50:FM0: RP50) showed a presence of moganite (2θ 30.9, 23.0, d-spacing 3.6, 4.48), and kyanite (2θ 22.91, d-spacing 4.50); however, the pentagonite mineral was lost in this XRD-pattern.
3.1.3. FTIR Spectra of Co-Compost Materials
The FTIR spectra for the co-composts are provided in Figure 3. The major spectra peaks for each co-compost were:
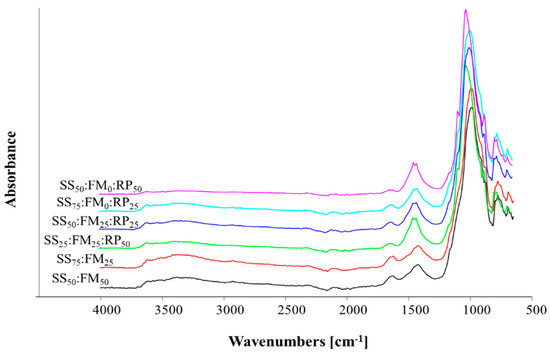
Figure 3.
Fourier transform spectra of the co-composts of different treatment mixtures in ratios where SS = sewage sludge, FM = farm manure, RP = rock phosphate.
T4 (SS50:FM50) showed major peaks at 774.8, 988.3, 1422.8, 1626.4, 2104.9, 2323.7, 2925.9, and 3522.7 cm−1.
T5 (SS75:FM25) showed major peaks at 775.19, 990.4, 1422.01, 1625.7, 2096.2, 2924.15, 3366.3, and 3386.9 cm−1.
T6 (SS25:FM25: RP50) showed peaks at 776.96, 1025.5, 1425.5, 1638.06, and 1774.46 cm−1.
T7 (SS50:FM25:RP25) showed the major peaks at 776.47, 997.8, 1429.4, 1628.19, 2116.0, 2320.4, and 3381.0 cm−1.
T8 (SS75:FM0:RP25) showed major peaks at 775.9, 998.0, 1428.7, 1638.63, 1776.9, 2095.2, 2322.0, and 3375.8 cm−1.
T9 (SS50:FM0:RP50) showed major peaks at 777.8, 1028.8, and 1453.1 cm−1.
The weak peaks at 770–780 cm−1 show the presence of multiple arsenic species (As). The peaks are varied across the spectra as their solubilities changed during composting processes. Peaks at 774.8–777.8 cm−1 have been attributed to the presence of aromatic rings [36]; however, as the source of these compost materials was sewage sludge, we suggest that in this study, they are due to the presence of arsenic. Very sharp peaks were observed at 988 to 1025 cm−1 in all the composts, which may be attributed to the polysaccharides and silicate vibrations.
3.2. Soil pH and EC, and Olsen’s P
The post-incubation soil pH was not significantly affected by any of the treatments after either the 5 or 45 days of incubation (Figure 4). For most treatments, soil EC was significantly higher after 5 days of incubation. The maximum EC (330 µSm−1) was observed in control treatment after 5 days, while the soil EC was lower for all other treatments when compared to control (Figure 4).
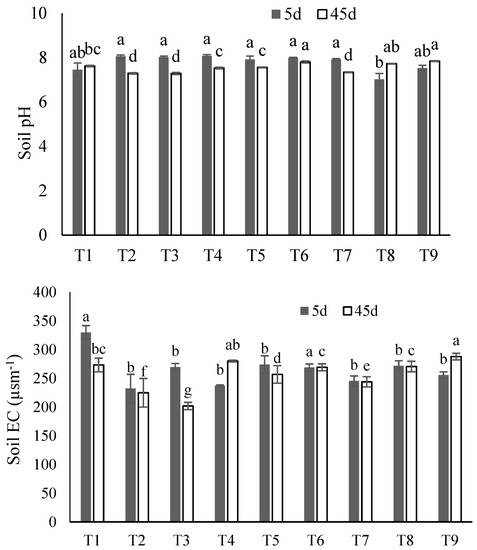
Figure 4.
Soil pH and electrical conductivity (EC) in all soil treatments: T1 (control), T2 (SS), T3 (SS-BC), T4 (SS50:FM50), T5 (SS75:FM25), T6 (SS25:FM25:RP50), T7 (SS50:FM25:RP25), T8 (SS75:FM0:RP25), and T9 (SS50:FM0:RP50) after 5- and 45-days incubation. The bars represent means ± SE for three replicates. Different letters (for 5 d and 45 d) above bars represent significant differences among treatments at p ≤ 0.05 using ANOVA followed by Tukey’s Honest Significant Difference Test (Tukey’s HSD) test.
The soil Olsen-P was analyzed after 5 and 45 days of incubation and showed the significant variation between treatments at both time intervals (Figure 5). After 5 days of incubation, the maximum Olsen-P was in T6 (79.41 mg kg−1 soil) and T4 (76.79 mg kg−1 soil), and the minimum in T2 (50.41 mg kg−1 soil) and T1 (control) (31.01 mg kg−1 soil). Whilst a similar trend was seen after 45 days of incubation, the observed Olsen-P values were lower overall.
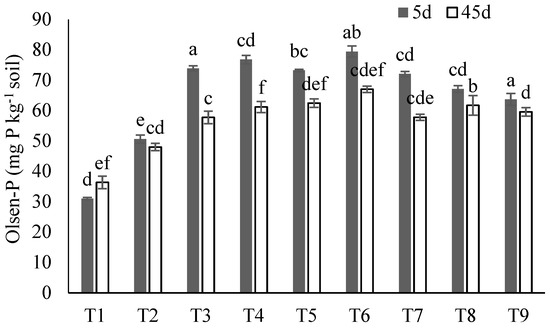
Figure 5.
The effect of each treatment combination: T1 (control), T2 (SS), T3 (SS-BC), T4 (SS50:FM50), T5 (SS75:FM25), T6 (SS25:FM25:RP50), T7 (SS50:FM25:RP25), T8 (SS75:FM0:RP25), and T9 (SS50:FM0:RP50); on Olsen-P concentration following 5 days (dark gray bars) and 45 days (white bars) of incubation. The bars represent means ± SE for three replicates. Different letters (for 5 d and 45 d) above bars represent significant differences among treatments at p ≤ 0.05 using ANOVA followed by Tukey’s HSD test.
3.3. Sorption Parameters
The P adsorption characteristics as derived using Langmuir and Freundlich equations are shown in Table 2 and Table 3, respectively. The results indicated that both adsorption equations have a good ability to predict the amount of P adsorption, which indicates that there are variabilities in the P adsorption characteristics for the studied soil. This is further supported by the uniform linearity (r2 > 90) of the curves generated for both equations (Supplementary Figures S2–S5). The P adsorption was observed to increase with increasing P concentration in solution. After 5 and 45 days of incubation, the treatments significantly affected (p ≤ 0.05) the sorption capacity (Sm). However, significant differences (p ≤ 0.05) were observed between treatments (Table 2). The sorption capacity was lower in 45 d incubated samples compared with 5 d incubated samples. Treatments T2, T3, and T4 had significantly lower values of maximum sorption (Smax) after 45 d of incubation compared to the T1 (control) and other treatments. Stronger conformity (r2) was observed for both 5- and 45-days incubated soil treatments. Sorption capacity (Sm) decreased significantly in all combinations of treatments when compared with the control.
Table 2.
Sorption (Langmuir equation) parameters for each treatment combination after 5 and 45 days of incubation. The values are means ± standard error for four replicates. The treatments sharing a letter in the parenthesis are not significantly different from each other at p ≤ 0.05.
Table 3.
Sorption (Freundlich equation) parameters for each of the treatment combinations after 5 and 45 days of incubation. The values are means ± standard error for four replicates. The treatments sharing a letter in the parenthesis are not significantly different from each other at p < 0.05.
4. Discussion
The mineralogy data for the co-composts show an abundance of alkaline minerals in the SS, which were modified in the SS-BC as well as when composted with FM and RP. The soluble minerals present in the raw materials, such as K2CO3, were not present in the co-composts. In addition, the armstrongite found in the raw FM disappeared in all FM co-composts. This suggests that the composting process resulted in their loss through biochemical changes. Comparison between treatments shows that soluble minerals, such as potassium carbonates, became soluble in most of the composts tested during this study as their proportions decreased [37]. Moreover, the soluble organic compounds are converted into stable humic complexed during composting and thus influence on mineralogy of the end product [38].
The pyrolysis of SS altered its mineralogy as a result of the thermal transformations [39]. The identification of the minerals in SS and SS-BC match those described by [40]. The FTIR data show that the weak C-stretching peaks at 1410 to 1450 cm−1, which are obvious in all compost treatments, may be assigned to the presence of heteroaromatic structures [41]. In all composts where FM was added, the C-stretching shifted from 1414 to 1428 cm−1 [42].
The increase in soil pH after application of compost is a well-known mechanism; however, our results show that the pH was not affected by the co-compost of sewage. In contrast to our results, Ref. [43] reported a significant increase in soil pH because of the application of compost. In that study, the application rates of composts were much higher as compared with present experiment. This might be the possible reason for the higher increase in soil pH.
The results presented herein (Figure 5) show that the application of co-composts significantly influenced Olsen-P and adsorption parameters. After the 45-day incubation period, the maximum P was recorded in the T9 SS50:FM0:RP50 (87.19 mg kg−1) treatment. The SS and RP in combination with FM (T6 SS25:FM25:RP50 and T7 SS50:FM25:RP25) enriched the total-P as well plant-available P, suggesting that the final product has the potential to be an alternative to non-renewable inorganic-P fertilizer. [34] also observed that the P concentration was increased by the application of compost. Initially, the efficiency of various SS treatments (depending on collection site and properties) in improving the soil properties and wheat growth was investigated, with the best-performing SS chosen for further investigation. The results of the incubation experiment and the adsorption isotherm calculations clearly demonstrated the importance of co-compost application in alkaline–calcareous soil. Composting of RP in combination with organic wastes, such as manures, increases the P solubility. However, this is greatly dependent on the type and amount of organic waste. Previous studies show that total-P as well as plant-available P increase in the soil after the application of RP composts [44,45]. Moreover, the composted RP tends to decompose and solubilize the P in soil over time. The P sorption capacity was decreased with the application of co-composts of sewage sludge, which is in line with previous findings [46,47].
After 5 d and 45 d of incubation, the treatments affected the sorption capacity (Sm), and significant differences were observed between treatments (Table 2). For instance, higher Sm values were observed after 5 days of incubation, suggesting the release of the soluble P fraction from all treatments. However, this effect was decreased with the passage of time, as indicated after 45 days of incubation. Previously, it was reported that the P release from P-enriched composts is increased in 8 to 12 days of soil amendment [48] while later, on a stable pool is formed. The T3 (SS-BC) yielded the lowest Sm values, which is probably because of the adsorbent nature of the biochar [49]. Stronger conformity (r2) was observed in the treatments that were incubated for 45 days incubation soil compared to those that were incubated for 5 days. The results of this study demonstrate that soil pH and P adsorption were the main predictors of P activity in the studied soil.
5. Conclusions
This study considered the P sorption mechanisms taking place within the treated alkaline and calcareous soils. The results revealed that the presence of a stable pool of bioavailable P within an alkaline calcareous soil can be achieved through amendment with sewage sludge and biochar. Whilst the composts of sewage sludge can be used effectively, however, they contain a higher portion of soluble P, which may be adsorbed to the soil surfaces. Further work is required to better understand the potential for co-composting with rock phosphate and farm manure to improve the availability of phosphorus. Furthermore, here, we have used only one soil; therefore, insight into the factors that govern these mechanisms may be gained through the study of a wider range of soil types. Field evidence further augments the observed mechanisms under controlled conditions. Thus, field studies under a wider variety of environmental (temperature and moisture) and soil conditions are suggested.
Supplementary Materials
The following are available online at https://www.mdpi.com/2071-1050/13/4/1779/s1, Figure S1. X-ray diffraction pattern of different treatment mixtures; Figure S2. Sorption equation fitted using Langmuir (5 d incubation samples); Figure S3. Sorption equation fitted using Langmuir (45 d incubation samples); Figure S4. Sorption equation fitted using Freundlich (5 d incubation samples); Figure S5. Sorption equation fitted using Freundlich (45 d incubation samples).
Author Contributions
Conceptualization, M.F.Q., K.S., M.R. and S.A.; Data curation, R.A.R., M.F.Q., G.H. and M.A.; Formal analysis, R.A.R. and M.F.Q.; Funding acquisition, M.F.Q. and S.A.; Investigation, R.A.R. and M.A.; Methodology, R.A.R. and G.H.; Project administration, M.F.Q. and M.R.; Resources, M.F.Q., G.H., K.S. and M.A.; Software, M.A., M.R. and S.A.; Supervision, M.F.Q. and K.S.; Validation, G.H. and M.A.; Visualization, G.H.; Writing—original draft, R.A.R., M.R. and S.A.; Writing—review and editing, K.S. and S.A. All authors have read and agreed to the published version of the manuscript.
Funding
The research was supported through funding from Higher Education Commission of Pakistan under NRPU Projects No. 3935 and 7272.
Institutional Review Board Statement
Not applicable.
Informed Consent Statement
Not applicable.
Data Availability Statement
Data is contained within the article.
Acknowledgments
Authors appreciate all supporting staff at BZ University Multan.
Conflicts of Interest
The authors declare that they have no conflict of interest.
References
- Gagnon, B.; Demers, I.; Ziadi, N.; Chantigny, M.H.; Parent, L.É.; Forge, T.A.; Larney, F.J.; Buckley, K.E. Forms of phosphorus in composts and in compostamended soils following incubation. Can. J. Soil Sci. 2012, 92, 711–721. [Google Scholar] [CrossRef]
- Daneshgar, S.; Callegari, A.; Capodaglio, A.G.; Vaccari, D. The potential phosphorus crisis: Resource conservation and possible escape technologies: A review. Resources 2018, 7, 37. [Google Scholar] [CrossRef]
- Lambers, H.; Bishop, J.G.; Hopper, S.D.; Laliberté, E.; Zúñiga-Feest, A. Phosphorus-mobilization ecosystem engineering: The roles of cluster roots and carboxylate exudation in young P-limited ecosystems. Ann. Bot. 2012, 110, 329–348. [Google Scholar] [CrossRef] [PubMed]
- Suriyagoda, L.; De Costa, W.A.J.M.; Lambers, H. Growth and phosphorus nutrition of rice when inorganic fertiliser application is partly replaced by straw under varying moisture availability in sandy and clay soils. Plant Soil 2014. [Google Scholar] [CrossRef]
- Barberis, E.; Ajmone Marsan, F.; Scalenghe, R.; Lammers, A.; Schwertmann, U.; Edwards, A.C.; Maguire, R.; Wilson, M.J.; Delgado, A.; Torrent, J. European soils overfertilized with phosphorus: Part 1. Basic properties. Fertil. Res. 1995, 45, 199–207. [Google Scholar] [CrossRef]
- Elser, J.J.; Bracken, M.E.S.; Cleland, E.E.; Gruner, D.S.; Harpole, W.S.; Hillebrand, H.; Ngai, J.T.; Seabloom, E.W.; Shurin, J.B.; Smith, J.E. Global analysis of nitrogen and phosphorus limitation of primary producers in freshwater, marine and terrestrial ecosystems. Ecol. Lett. 2007, 10, 1135–1142. [Google Scholar] [CrossRef]
- Faucon, M.P.; Houben, D.; Reynoird, J.P.; Mercadal-Dulaurent, A.M.; Armand, R.; Lambers, H. Advances and Perspectives to Improve the Phosphorus Availability in Cropping Systems for Agroecological Phosphorus Management; Elsevier Ltd.: Amsterdam, The Netherlands, 2015; Volume 134, ISBN 9780128033234. [Google Scholar]
- Han, J.; Ro, H.M. Interpreting competitive adsorption of arsenate and phosphate on nanosized iron (hydr)oxides: Effects of pH and surface loading. Environ. Sci. Pollut. Res. 2018, 25, 28572–28582. [Google Scholar] [CrossRef]
- von Wandruszka, R. Phosphorus retention in calcareous soils and the effect of organic matter on its mobility. Geochem. Trans. 2006. [Google Scholar] [CrossRef]
- Westermann, D.T. Lime Effects on Phosphorus Availability in a Calcareous Soil. Soil Sci. Soc. Am. J. 1992, 56, 489–494. [Google Scholar] [CrossRef]
- Vaccari, D.A.; Powers, S.M.; Liu, X. Demand-Driven Model for Global Phosphate Rock Suggests Paths for Phosphorus Sustainability. Environ. Sci. Technol. 2019, 53, 10417–10425. [Google Scholar] [CrossRef]
- Honvault, N.; Houben, D.; Nobile, C.; Firmin, S.; Lambers, H.; Faucon, M.-P. Tradeoffs among phosphorus-acquisition root traits of crop species for agroecological intensification. Plant Soil 2020. [Google Scholar] [CrossRef]
- DeLuca, T. Biochar effects on soil nutrient transformations. In Biochar for Environmental Management Science and Technology; Lehmann, J., Joseph, S., Eds.; Earthscan: London, UK, 2009; pp. 251–270. ISBN 978-1-84407-658-1. [Google Scholar]
- Cordell, D.; Rosemarin, A.; Schröder, J.J.; Smit, A.L. Towards global phosphorus security: A systems framework for phosphorus recovery and reuse options. Chemosphere 2011, 84, 747–758. [Google Scholar] [CrossRef]
- Tomei, M.C.; Stazi, V.; Daneshgar, S.; Capodaglio, A.G. Holistic approach to phosphorus recovery from urban wastewater: Enhanced biological removal combined with precipitation. Sustainability 2020, 12, 575. [Google Scholar] [CrossRef]
- Amann, A.; Zoboli, O.; Krampe, J.; Rechberger, H.; Zessner, M.; Egle, L. Environmental impacts of phosphorus recovery from municipal wastewater. Resour. Conserv. Recycl. 2018. [Google Scholar] [CrossRef]
- Daneshgar, S.; Buttafava, A.; Callegari, A.; Capodaglio, A.G. Economic and energetic assessment of different phosphorus recovery options from aerobic sludge. J. Clean. Prod. 2019, 223, 729–738. [Google Scholar] [CrossRef]
- Inguanzo, M.; Domínguez, A.; Menéndez, J.A.; Blanco, C.G.; Pis, J.J. On the pyrolysis of sewage sludge: The influence of pyrolysis conditions on solid, liquid and gas fractions. J. Anal. Appl. Pyrolysis 2002. [Google Scholar] [CrossRef]
- Cantrell, K.B.; Martin, J.H. Stochastic state-space temperature regulation of biochar production. Part I: Theoretical development. J. Sci. Food Agric. 2012, 92, 481–489. [Google Scholar] [CrossRef]
- Lehmann, J.; Joseph, S. Biochar for Environmental Management: Science and Technology; Routledge: Abingdon, UK, 2012; Volume 9781849770, ISBN 9781849770552. [Google Scholar]
- Muhmood, A.; Wu, S.; Lu, J.; Ajmal, Z.; Luo, H.; Dong, R. Nutrient recovery from anaerobically digested chicken slurry via struvite: Performance optimization and interactions with heavy metals and pathogens. Sci. Total Environ. 2018. [Google Scholar] [CrossRef]
- Bolognesi, S.; Bernardi, G.; Callegari, A.; Dondi, D.; Capodaglio, A.G. Biochar production from sewage sludge and microalgae mixtures: Properties, sustainability and possible role in circular economy. Biomass Convers. Biorefinery 2019. [Google Scholar] [CrossRef]
- Callegari, A.; Capodaglio, A.G. Properties and beneficial uses of (bio)chars, with special attention to products from sewage sludge pyrolysis. Resources 2018, 7, 20. [Google Scholar] [CrossRef]
- Racek, J.; Sevcik, J.; Komendova, R.; Kucerik, J.; Hlavinek, P. Heavy metal fixation in biochar after microwave pyrolysis of sewage sludge. Desalin. Water Treat. 2019, 159, 79–92. [Google Scholar] [CrossRef]
- Cope, C.O.; Webster, D.S.; Sabatini, D.A. Arsenate adsorption onto iron oxide amended rice husk char. Sci. Total Environ. 2014, 488–489, 554–561. [Google Scholar] [CrossRef] [PubMed]
- Daneshgar, S.; Vanrolleghem, P.A.; Vaneeckhaute, C.; Buttafava, A.; Capodaglio, A.G. Optimization of P compounds recovery from aerobic sludge by chemical modeling and response surface methodology combination. Sci. Total Environ. 2019, 668, 668–677. [Google Scholar] [CrossRef]
- Audette, Y.; O’Halloran, I.P.; Evans, L.J.; Martin, R.C.; Voroney, R.P. Kinetics of phosphorus forms applied as inorganic and organic amendments to a calcareous soil II: Effects of plant growth on plant available and uptake phosphorus. Geoderma 2016, 279, 70–76. [Google Scholar] [CrossRef]
- Haider, G.; Steffens, D.; Moser, G.; Müller, C.; Kammann, C.I. Biochar reduced nitrate leaching and improved soil moisture content without yield improvements in a four-year field study. Agric. Ecosyst. Environ. 2017, 237, 80–94. [Google Scholar] [CrossRef]
- Kahiluoto, H.; Kuisma, M.; Ketoja, E.; Salo, T.; Heikkinen, J. Phosphorus in manure and sewage sludge more recyclable than in soluble inorganic fertilizer. Environ. Sci. Technol. 2015, 49, 2115–2122. [Google Scholar] [CrossRef] [PubMed]
- Stutter, M.I. The composition, leaching, and sorption behavior of some alternative sources of phosphorus for soils. Ambio 2015, 44, 207–216. [Google Scholar] [CrossRef]
- Rehman, R.A.; Rizwan, M.; Qayyum, M.F.; Ali, S.; Zia-ur-Rehman, M.; Zafar-ul-Hye, M.; Hafeez, F.; Iqbal, M.F. Efficiency of various sewage sludges and their biochars in improving selected soil properties and growth of wheat (Triticum aestivum). J. Environ. Manag. 2018, 223, 607–613. [Google Scholar] [CrossRef]
- Sabiha-Javied; Mehmood, T.; Chaudhry, M.M.; Tufail, M.; Irfan, N. Heavy metal pollution from phosphate rock used for the production of fertilizer in Pakistan. Microchem. J. 2009, 91, 94–99. [Google Scholar] [CrossRef]
- Qayyum, M.F.; Abid, M.; Danish, S.; Saeed, M.K.; Ali, M.A. Effects of various biochars on seed germination and carbon mineralization in an alkaline soil. Pakistan J. Agric. Sci. 2014, 51, 977–982. [Google Scholar]
- Rehman, R.A.; Qayyum, M.F. Co-composts of sewage sludge, farm manure and rock phosphate can substitute phosphorus fertilizers in rice-wheat cropping system. J. Environ. Manag. 2020, 259. [Google Scholar] [CrossRef]
- Murphy, J.; Riley, J.P. A modified single solution method for the determination of phosphate in natural waters. Anal. Chim. Acta 1962, 27, 31–36. [Google Scholar] [CrossRef]
- IR Spectrum Table & Chart | Sigma-Aldrich. Available online: https://www.sigmaaldrich.com/technical-documents/articles/biology/ir-spectrum-table.html (accessed on 16 January 2021).
- Li, R.; Wang, J.J.; Zhang, Z.; Shen, F.; Zhang, G.; Qin, R.; Li, X.; Xiao, R. Nutrient transformations during composting of pig manure with bentonite. Bioresour. Technol. 2012, 121, 362–368. [Google Scholar] [CrossRef] [PubMed]
- Yu, H.; Zhao, Y.; Zhang, C.; Wei, D.; Wu, J.; Zhao, X.; Hao, J.; Wei, Z. Driving effects of minerals on humic acid formation during chicken manure composting: Emphasis on the carrier role of bacterial community. Bioresour. Technol. 2019, 294, 122239. [Google Scholar] [CrossRef]
- Praspaliauskas, M.; Pedišius, N.; Striuigas, N. Elemental Migration and Transformation from Sewage Sludge to Residual Products during the Pyrolysis Process. Energy Fuels 2018. [Google Scholar] [CrossRef]
- Karim, A.A.; Kumar, M.; Singh, S.K.; Panda, C.R.; Mishra, B.K. Potassium enriched biochar production by thermal plasma processing of banana peduncle for soil application. J. Anal. Appl. Pyrolysis 2017, 123, 165–172. [Google Scholar] [CrossRef]
- Song, X.D.; Xue, X.Y.; Chen, D.Z.; He, P.J.; Dai, X.H. Application of biochar from sewage sludge to plant cultivation: Influence of pyrolysis temperature and biochar-to-soil ratio on yield and heavy metal accumulation. Chemosphere 2014, 109, 213–220. [Google Scholar] [CrossRef]
- Xu, J.; Xu, X.; Liu, Y.; Li, H.; Liu, H. Effect of microbiological inoculants DN-1 on lignocellulose degradation during co-composting of cattle manure with rice straw monitored by FTIR and SEM. Environ. Prog. Sustain. Energy 2016, 35, 345–351. [Google Scholar] [CrossRef]
- Qayyum, M.F.; Abdullah, M.A.; Rizwan, M.; Haider, G.; Ali, M.A.; Zafar-ul-Hye, M.; Abid, M. Different nitrogen and biochar sources’ application in an alkaline calcareous soil improved the maize yield and soil nitrogen retention. Arab. J. Geosci. 2019, 12, 664. [Google Scholar] [CrossRef]
- Efthymiou, A.; Grønlund, M.; Müller-Stöver, D.S.; Jakobsen, I. Augmentation of the phosphorus fertilizer value of biochar by inoculation of wheat with selected Penicillium strains. Soil Biol. Biochem. 2018, 116, 139–147. [Google Scholar] [CrossRef]
- Biswas, D.R.; Narayanasamy, G. Rock phosphate enriched compost: An approach to improve low-grade Indian rock phosphate. Bioresour. Technol. 2006, 97, 2243–2251. [Google Scholar] [CrossRef] [PubMed]
- Guo, B.; Liang, Y.; Li, Z.; Han, F. Phosphorus adsorption and bioavailability in a paddy soil amended with pig manure compost and decaying rice straw. Commun. Soil Sci. Plant Anal. 2009, 40, 2185–2199. [Google Scholar] [CrossRef]
- Dao, T.H.; Sikora, L.J.; Hamasaki, A.; Chaney, R.L. Manure Phosphorus Extractability as Affected by Aluminum- and Iron By-Products and Aerobic Composting. J. Environ. Qual. 2001, 30, 1693–1698. [Google Scholar] [CrossRef] [PubMed]
- Nishanth, D.; Biswas, D.R. Kinetics of phosphorus and potassium release from rock phosphate and waste mica enriched compost and their effect on yield and nutrient uptake by wheat (Triticum aestivum). Bioresour. Technol. 2008, 99, 3342–3353. [Google Scholar] [CrossRef] [PubMed]
- Morales, M.M.; Comerford, N.; Guerrini, I.A.; Falcão, N.P.S.; Reeves, J.B. Sorption and desorption of phosphate on biochar and biochar-soil mixtures. Soil Use Manag. 2013, 29, 306–314. [Google Scholar] [CrossRef]


Publisher’s Note: MDPI stays neutral with regard to jurisdictional claims in published maps and institutional affiliations. |
© 2021 by the authors. Licensee MDPI, Basel, Switzerland. This article is an open access article distributed under the terms and conditions of the Creative Commons Attribution (CC BY) license (http://creativecommons.org/licenses/by/4.0/).