Project Report

The Feasibility of Renewable Natural Gas in New Jersey

1
PSEG Institute for Sustainability Studies, Montclair State University, Montclair, NJ 07043, USA
2
Department of Accounting, Taxation, and Law, Fairleigh Dickinson University, Madison, NJ 07940, USA
3
Program of Environmental Studies, Middlebury College, Middlebury, VT 05753, USA
4
Department of Environmental Science, William Paterson University, Wayne, NJ 07470, USA
5
Department of Mathematics and Computer Science, Raritan Valley Community College, Branchburg, NJ 08876, USA
6
Department of Chemical Engineering, Rowan University, Glassboro, NJ 08028, USA
7
Department of Physics and Astronomy, Montclair State University, Montclair, NJ 07043, USA
8
Department of Chemical Engineering, Hampton University, Hampton, VA 23668, USA
9
Department of Earth and Environmental Studies, Montclair State University, Montclair, NJ 07043, USA
*
Author to whom correspondence should be addressed.
Sustainability 2021, 13(4), 1618; https://doi.org/10.3390/su13041618
Submission received: 28 January 2021 / Revised: 28 January 2021 / Accepted: 30 January 2021 / Published: 3 February 2021
(This article belongs to the Section Energy Sustainability)

Abstract

:
With traditional natural gas being one of the top options for heating in the United States and the present threat of climate change, there is a demand for an alternative clean fuel source. A Renewable Natural Gas Implementation Decision-Making Conceptual Model was created to provide a framework for considering the feasibility of renewable natural gas (RNG) projects and applied to New Jersey, specifically investigating landfills and wastewater treatment plants (WWTPs). Data from the US EPA’s Landfill Methane Outreach Program and New Jersey’s Department of Environmental Protection Sewage Sludge databases were used to identify seven landfills and 22 WWTPs as possible locations for RNG projects. Landfills were found to have a higher potential for producing RNG, on average potentially producing enough RNG to heat 12,792 homes per year versus 1227 for the average WWTP. Additionally, landfills, while having higher capital expenses, have lower projected payback periods, averaging 5.19 years compared to WWTP’s 11.78 years. WWTPs, however, generally are located closer to existing natural gas pipelines than landfills and when they produce more than 362 million standard cubic feet per year (MMSCFY) of biogas are financially feasible. RNG projects at Monmouth County Reclamation Center, Ocean County Landfill, and Passaic Valley Sewerage Commission WWTP show the greatest potential. Greenhouse gas emission reductions from RNG projects at these facilities utilizing all available biogas would be 1.628 million metric tons CO 2 equivalents per year, synonymous to removing over 351,000 passenger vehicles from the road each year. In addition, expanding federal and state incentives to encompass RNG as a heating fuel is necessary to reduce financial barriers to RNG projects throughout the US. Overall, this paper supports the hypothesized conceptual model in examining the feasibility of RNG projects through examples from New Jersey and confirms the potential for RNG production utilizing existing waste streams.

1. Introduction

Rapidly increasing populations are causing a high demand for the energy supply for industrial operations, transportation, and personal use. Additionally, natural gas has historically been a big sector of energy consumption in the United States, with the country responsible for over 21% of global natural gas consumption [1]. As such, in 90 years, the natural gas supply in America may be entirely depleted [2]. The introduction of renewable natural gas (RNG) can be substituted as a low carbon energy source to reduce the dependence on traditional natural gas. RNG and fossil fuels emit similar amounts of greenhouse gas (GHG) emissions, but different production processes result in an overall GHG emissions reduction for RNG.
Renewable natural gas can be produced from a number of different sources such as landfills, livestock, and wastewater treatment plants (WWTPs). Utilizing the methane that would be naturally emitted from these sources can be viewed as a carbon neutral process [3]. Not only does utilizing RNG create a more diverse energy profile, but it also can help with climate change. Methane is 25 times more effective at absorbing heat than carbon dioxide [4]. Rather than emitting methane into the atmosphere, renewable natural gas could be produced from it to help power rather than pollute. With landfills contributing approximately 20% of the anthropogenic emissions, changing the source from non-renewable to renewable could be one of many ways to help combat climate change [5].
Growing populations also means an increase in waste going to landfills and wastewater treatment plants, especially because other countries are no longer accepting certain waste from the United States [6]. Unavoidably, landfills will continue to grow and WWTPs will receive more wastewater in the foreseeable future. This is an opportunity to create RNG from methane produced in landfills and WWTPs. Over the past few years, RNG production from landfills, livestock, and WWTPs have proven environmentally beneficial and economically feasible for California, specifically utilizing state specific incentives [7,8]. The use of RNG as a low-carbon vehicle produced from various waste sources in the United States has also been studied and has been shown to be feasible as well, specifically utilizing organic waste from landfills and manure from farms [9]. Landfills, in particular, have shown great promise as a waste-to-energy source for compressed natural gas but also for electricity production and an alternative vehicle fuel [10].
The source of RNG is one of many parts of the decision process for implementation of RNG projects. An RNG Implementation Decision-Making (RNG IDM) model (Figure 1) was created to assess the components that impact the feasibility of implementing an RNG project. The first among them is the source and amount of RNG produced. This model gives specific examples of sources for RNG such as landfills and WWTPs, though other sources also may be considered. The amount of waste entering a given facility has a large impact on the biogas and thus methane production at the facility [11]. The production of methane is directly related to the amount of RNG produced which in turn impacts the logistical considerations, financial analysis, and the environmental impacts of the project. Logistical considerations primarily consist of the viable site criteria, necessary equipment, proximity to existing pipelines, and consideration of ongoing projects at a facility [12]. Timmerberg and Kaltschmitt have shown that a shorter proximity to existing pipelines is beneficial for alternative fuel projects [13]. Important components of the financial analysis are the net present value (NPV) of projects and the availability of incentives. Availability of incentives have led to many projects that were not previously financially feasible, becoming financially feasible [14]. Additionally, NPVs, Internal Rate of Returns (IRR), and payback periods are important indicators of any project’s possibility for success [15]. Renewable energy is one of the major aspects of reducing greenhouse gas emissions and a given project’s ability to contribute to reducing greenhouse gas emissions is a key indicator of whether the project should be conducted [16]. Finally, the decision-making process should also consider stakeholders which play an important role in the support of the project, the need for energy security and resilience, and the current energy profiles of the location [17,18].
This project specifically utilizes this framework to determine where the most feasible locations for RNG projects are in New Jersey, where in 2019, 766,824 million cubic feet (MMCF) of natural gas were consumed [19]. The project also focuses on landfills and wastewater treatment plants as potential RNG sources. Part of the analysis includes calculating the potential RNG production and greenhouse gas emission reductions of such projects, as well as considering financial and legislative perspectives. These considerations may be applied to other systems to determine feasibility for implementation of RNG elsewhere.

1.1. Project Framework

In the summer of 2019, New Jersey Natural Gas (NJNG), a gas utility company, engaged with Montclair State University’s PSEG Institute for Sustainability Studies (PSEG ISS), and requested a team of five undergraduate students who were selected as part of the established Green Teams Program to investigate the feasibility of renewable natural gas in New Jersey. The initial project was focused over a ten-week period, but additional research has been conducted beyond that. The objectives of the project were to establish the needed variables for the creation of a financially and environmentally sustainable RNG market for the state of New Jersey. The project analyzes incentives, financial and environmental models, and successful RNG projects in other states. NJNG has opted to respond to the need for cleaner sources of energy that are financially viable for its customers by using the information gathered and analyses conducted in a process indicated in Figure 1 to ultimately decide how to implement sourcing of RNG from in-state and how to use or upgrade current infrastructure to bring RNG to its customers. Via the analysis and study shown in the project of potential sources for RNG, incentives and infrastructure specific to New Jersey, NJNG can take the first steps to create the first successful RNG market in the state.

1.2. What Is Renewable Natural Gas?

RNG, or biomethane, is a pipeline-quality gas that can replace traditional natural gas. RNG is a biogas-derived methane that has been upgraded to meet the natural gas purity standard required in homes or businesses [20]. Biogas is a mixture of carbon dioxide ( CO 2 ) and hydrocarbon materials. It is produced from the various biomass resources, such as: landfills, fats, oils and grease (FOG), certain crops, and manure through a biochemical process, which includes anaerobic digestion (AD), or through thermochemical means, like gasification. The raw biogas has low methane content; therefore, it must be upgraded to remove the impurities before it can be used for transportation fuel, electricity, and pipeline injection. Figure 2, below, summarizes the process of RNG production from the available biomass resources.

1.3. Renewable Natural Gas Resources

Biogas can be produced from various different waste resources before being upgraded to RNG. Some of these options include landfills, wastewater treatment plants, livestock or fats, oils, and greases through anaerobic digestion [7]. There are limited livestock operations in New Jersey, but in other areas this has proven to be an efficient RNG producer. The food industry option is more feasible in New Jersey, but there would be significant external factors that would add cost and risk to the project. These food industry operations also produce far less biogas. Because of this, landfills and WWTPs appear to be the most viable sources from an RNG production and cost efficiency standpoint and are thus the focus of this report.

1.3.1. Landfills

Landfill gas (LFG) to energy is a method of capturing the naturally occurring methane from the breakdown of waste in a landfill. The LFG is collected by wells periodically to control odor and the release of emissions. The collected LFG is either flared to convert methane into carbon dioxide or is used to supply biogas for current projects on site. The amount of landfill gas that each landfill plant produces is dependent on the moisture, quality, and quantity of the source. To produce RNG from the landfill, the LFG is sent to a purification plant to remove the impurities from the methane gas in order to convert LFG into pipeline-quality gas. This process is referred to as upgrading. After the LFG is upgraded to pipeline quality standards, it is now RNG and can be injected into gas pipelines for use [12].
Municipal Solid Waste (MSW) landfills are the focus of this paper rather than industrial or hazardous waste landfills because while MSW landfills receive only 69% of the total waste generated, they produce 94% of landfill emissions in the United [21]. A greater number of emissions in this case is beneficial, as it means a higher potential to produce more renewable natural gas.

1.3.2. Wastewater Treatment Plants

New Jersey has many wastewater treatment plants (WWTPs) that have the potential to produce RNG. The standard process for turning wastewater into RNG is similar to that of a landfill, but may or may not require the same treatment depending on the impurities’ concentration levels. The sludge from the wastewater is put into digesters from which methane gas can be extracted. From there, the methane gas will go into the upgrading process in order to turn it into pipeline quality gas [22].

1.4. Application for Biogas

Biogas, as a resource, has several main uses. Biogas in the production of RNG can be used for heating and cooling. There is also a growing market in the production of biogas to convert it into Liquefied Natural Gas (LNG) and Compressed Natural Gas (CNG) for vehicle use. However, for the purposes of this project, the sole focus will be on the conversion of biogas into High British Thermal unit (BTU) RNG for heating and cooling [23].

1.5. RNG Production Process (Landfills and WWTPs)

After biogas from a facility is collected, it is directed to a separate on-site treatment facility. Medium BTU biogas needs to be conditioned to create biomethane which has similar characteristics to natural gas and will suffice the pipeline standards to heat homes. The production or “upgrading” of pipeline quality gas from biogas is typically performed in two main steps. The first step, known as pre-treatment, is the removal of moisture and trace components by refrigeration, dehydration, filtration, adsorption, and/or other processes. The second step is to separate impurities, which includes carbon dioxide, hydrogen sulfide ( H 2 S ), ammonia, water vapor, dust, siloxanes, from the methane in the biogas. In doing so, methane is enhanced allowing it to meet the typical pipeline quality standards. A basic schematic of the equipment needed to condition biogas is pictured in Figure 3. What equipment is needed in order to properly execute the upgrading process can vary from facility to facility. It is important to note the enhancements of a facility is dependent on what upgrading equipment is already in place and the concentration level of impurities. For instance, in Figure 3, the biogas can either be flared or travel towards the compressor to start pre-treatment. After the blower, the biogas would flow through the process involving units such as: compressors to regulate the pressure drop, removal of hydrogen sulfide, pressure swing adsorption to separate gases, etc. If concentrations of the impurities for the landfill are not high, some units may vary. For example, nitrogen content could be lower in some landfills than others, in turn making the nitrogen rejection unit unnecessary [22].
Before being sent to an upgrading system, an anaerobic digestion (AD) system could be used for landfills. Using an AD would require the separation of organic waste from inorganic waste but would improve the gas quality making it richer in methane and would make for a cleaner biogas [24]. This would, however, be a costly addition to the RNG production process. Because landfills are already required to have a well system in place to collect the landfill biogas, the required separation of organic from inorganic waste and the additional capital costs required for AD would become extra expenses ultimately deemed unnecessary for RNG production for landfills specifically [12].
Because wastewater treatment plants do not have this existing gas collection infrastructure, an AD is required for RNG production [24]. This process would come before being sent to an upgrading system. Because many digesters are already in place at WWTPs in New Jersey, this additional capital expense would not be required making the upgrading system process less of a financial obstacle. Most AD projects at WWTPs are on a scale of raw gas production from 75 standard cubic feet per minute (SCFM) to 1800 SCFM versus that of landfills that usually produce from 1000 to 10,000+ SCFM [25].

1.6. Successful Renewable Natural Gas (RNG) Projects

This section examines the implementations, incentives, and regulations of Southern California Gas Company and Vermont Gas.

1.6.1. Southern California Gas Company (SoCal Gas)

The Point Loma Wastewater RNG project developed by BioFuels Energy (BFE), LLC is the first project in the state of California to inject RNG into pipelines, pure enough to meet San Diego Gas & Electric’s (SDG&E) standards [26]. BFE nominates the cleaned biogas (“directed biogas”) to the BioFuels customers and provides renewable energy under a long term Power Purchase Agreement (PPA). A PPA is a financial agreement where a developer will arrange for the design, installation, and financing of an energy system on a customer’s property at little to no cost. Their customers include the University of California San Diego (UCSD) and the City of San Diego South Bay Water Reclamation Plant. The Point Loma plant has an inlet capacity of 1100 SCFM and a product gas capacity of 850 MMBtu/day [26].
The capital costs for the project mentioned above totaled at approximately $45 million USD. The self-generation incentive program [26] that was used to help finance this project states the following benefits: USD 4500 per KW of electricity rebate for first MW at each site, USD 2250 per KW of electricity rebate for capacity 1 to 2 MW, USD 1125 per KW of electricity rebate for capacity two to three MW.
Another RNG project is located at the Hale Avenue Resource Recovery Facility (HARRF), a wastewater treatment facility located in Escondido, CA that is undergoing a biogas upgrading project. There is nearly 95 million cubic feet of biogas that can be produced each year, the equivalent of providing enough energy to supply 1200 homes annually [27]. A sustainability company in Ontario, Canada called Anaergia opened a combined heat and power (CHP) system at the HARRF to generate heat and electricity for their facilities. As a result of this new system, all the biogas produced by HARRF’s Anaerobic Digestion (AD), which was previously flared, is now utilized to generate sustainable green energy. Anaergia and the City of Escondido have entered into a PPA. The electricity and heat are sold by Anaergia at below market rates for operations of HARRF. The California Public Utilities Commission’s (CPUC) Self-Generation Incentive Program (SGIP) supported this project [28].
One of the setbacks of switching to RNG is the initial capital investment. SoCal had the opportunity to cut their capital investment down by millions through the Biomethane Interconnector Monetary Incentive Program. This is another California specific program put in place by the California Public Utilities Commission. The program funds half the cost of the pipeline up to USD 3 million. When facilities cluster together, however, this incentive goes up to USD 5 million. The program will continue until the end of 2021 or the state of California exhausts the program’s USD 40 million budget [29].
Additionally, the clean energy generation from SoCal’s RNG projects counts towards the Renewable Portfolio Standards. The Renewable Portfolio Standards are goals for utility providers to generate a varying percentage of their energy from renewable sources. The idea is to reduce reliance on fossil fuels to generate electricity. These standards vary by state. For example, “California requires municipal and investor owned utilities to generate 33% of their energy from renewable sources by 2020” [30]. On the other hand, New Jersey requires utilities to produce only 22.5% of their electricity from renewable sources by 2021 [31].

1.6.2. Vermont Gas System (VGS)

While VGS does not make its own RNG, the company is developing programs to be able to produce RNG with resources in the state. Vermont Gas System’s current supply of RNG comes from the EBI Landfill in Quebec, Canada. While the RNG produced at this site does not directly feed into Vermont’s natural gas pipelines, the environmental attributes are owned by VGS and can be purchased by their customers. VGS is currently working on increasing in-state RNG resources, specifically a farm digester in Salisbury, Vermont will begin producing RNG in the coming year. The cost of RNG is passed to customers through an RNG consumption choice of 10–100% based on their standard natural gas consumption [32]. In terms of pricing, Vermont Gas company charges an RNG Adder of USD 1.2377/Therm to those that opt into the program. VGS aims to have over 500 residential customers and 63 commercial customers enrolled in the optional RNG project by the end of fiscal year 2021. Previously, VGS conducted a survey which states that 85% of its customers are willing to opt into the 10% RNG option for their monthly consumption. On average, a customer utilizing the 10% option of RNG, will only pay an extra USD 5 on their monthly bill [32].
While financial incentives for RNG projects are not as widely available as they are in California, VGS works to incentivize enrollment their program through environmental benefits. The consumers are willing to pay more for products they know will be environmentally friendly, and VGS markets on the environmental side heavily. VGS shares that their program “is a simple way for our customers to reduce fossil fuel use, achieve their carbon reduction objectives and contribute in an innovative way to addressing climate change” [32]. It is critical to diversify the supply portfolio of a natural gas organization given the finite quantity of fossil fuels.

1.7. Incentives

As the market for low carbon energy options continues to grow, more customers are looking to decarbonize their entire lifestyle. Natural gas is one of the last industries in need of a substitute. It is difficult for RNG to enter the market as a substitute while so many other renewable alternatives are more financially incentivized. Environmental incentives are in abundance, but financial incentives lag behind. Incentives from both the state and federal level could only help to encourage more RNG projects.
On the federal level, there is the Renewable Fuel Standards program [33]. This program allocates credits for fuel sources that meet specific carbon intensities such as RNG, that can then be traded or sold. The fuel producers that exceed carbon intensity limits must buy these credits to meet the designated compliance level. These standards were designed to reduce GHG emissions from the transportation sector and as such the program is only applicable to RNG as a vehicle fuel. Additionally, there is a federal investment tax credit through the U.S. Energy Policy Action of 2005 that states 30% of net project costs less the applicable rebates are available as a tax credit at year end [26].
In New Jersey, the Biomass Works Group has suggested adding a Sustainable Biomass Power & Fuels Initiative to the state’s Energy Master Plan. New Jersey’s Energy Master Plan focuses around New Jersey’s goal to have 100% clean energy by 2050. The Energy Master Plan has strategies listed to help meet their goal, and one of them is to assist with getting renewable energies like RNG started. Part of the discussion is based around developing new incentives to make a new competitive market for renewables in New Jersey. This is similar to the mindset that was built around solar energy when it was starting to take off. The Sustainable Biomass Power & Fuels initiative would not make any additional tax incentives but would instead expand current incentives for renewables to include RNG [34].
Besides the commonly cited environmental incentives that RNG reduces greenhouse gas emissions and reliance on fossil fuels, RNG projects also localize natural gas sourcing operations. Landfills and wastewater treatment facilities in New Jersey can be used. There is no need to transport natural gas from Texas to New Jersey to meet the demand. On a long-term scale, this could cut the need to rely on outside suppliers. This also helps build the local economies. These facilities will need employees to run them, creating more jobs. In addition, the initial development will help employ contractors. Over the years, facilities may need expansions which will bring back other contracting opportunities [22].

2. Materials and Methods

2.1. Site Descriptions for Landfills and Wastewater Treatment Plants (WWTP) in New Jersey

2.1.1. Landfills

Renewable Natural Gas (RNG) can be produced from a landfill if the amount of Landfill Gas (LFG) is sufficient. To make sure a landfill can be a viable source of LFG and in turn RNG, the landfill has to meet all of the following criteria: contain at least 1 million tons of MSW, have a depth of 50 feet or more, receive at least 25 inches of rain annually, be currently open or have been closed for less than three years, and have a biogas flow rate of over 1000 standard cubic feet per minute (SCFM) [12]. The quantity of LFG that is produced can be determined by the moisture content and the quantity and composition of the waste present [35]. The average Municipal Solid Waste (MSW) landfill contains 20.5% food scraps, 17.3% plastics, and 16.2% paper and paperboards [21]. Using these criteria and the 2019 US EPA’s Landfill Methane Outreach Program (LMOP) database [36], seven landfills were found to be viable for RNG projects in New Jersey. Details of these landfills can be found in Table 1.

2.1.2. Wastewater Treatment Plants (WWTP)

The only requirement to determine if a wastewater treatment plant is a viable source for RNG production is that it should produce over 100 normal meters cubed per hour (Nm3/h) of biogas [37]. One hundred Nm3/h is equivalent to 60 SCFM. Additionally, in order to determine which WWTPs produce over 60 SCFM of biogas, Equation (1) was used to calculate biogas production from wastewater inflow in million gallons per day (MGD). These data on wastewater inflow (WWF), also called ‘existing flow,’ to WWTPs came from the 2018 NJ Department of Environmental Protection and the Bureau of Pretreatment and Residuals’ “Sewage Sludge Production by Management Mode” database [38].
Biogas   Production   SCFY = WWF × g × 365  
One MGD of wastewater flow generates approximately 9700 SCF of Biogas, signified by g [39]. Additionally, the wastewater flow is reported in million gallons per day and so is multiplied by 365 days per year to convert.
While producing 60 SCFM of biogas is the only requirement to determine whether a WWTP is a viable source of RNG, we also decided to only consider WWTPs that currently have an anaerobic digester onsite. This decision was made from a financial perspective because installing a new digester will more than likely double the equipment and operating costs for a given operation and render almost any RNG project financially infeasible.

2.2. Renewable Natural Gas Production at Landfills and Wastewater Treatment Plants

2.2.1. Landfills

Once we identified the viable landfills, we calculated the amount of RNG that each of the landfills can produce. The age and composition of a landfill determine the quality of the LFG generated. Generally, landfill gas is approximately 50% methane and 50% carbon dioxide. There are also trace amounts (<1 percent) of nitrogen, oxygen, hydrogen sulfide, hydrogen, and non-methane organic compounds [40]. As previously stated, the RNG is produced from the methane in the LFG. Therefore, the production of high BTU RNG is calculated from LFG in SCFY as show in Equation (2):
RNG   MMSCFY =   LFG   SCFY × m LFG × f E × m BTU ng BTU × 1000000
In Equation (2), m LFG represented the 0.5 SCF of methane in 1 SCF of LFG and fE is the 90% efficiency factor. The efficiency factor accounts for the RNG losses during production because of inefficiencies with equipment [41]. Equation (2) also contains the heating conversion rates of 1012 BTU per SCF methane ( m BTU ) and 1050 BTU per SCF natural gas to convert from methane in the LFG to natural gas ( ng BTU ) and 1,000,000 in the denominator to convert from SCF to MMSCF [42].
It is important to note that calculations for RNG production for landfills include assumptions that the amount of LFG/biogas produced year to year by each facility will remain the same. Due to the nature of the material in each landfill, the amount of biogas produced can increase or decrease from year to year. In order to figure out how much biogas will be produced in a landfill’s lifespan, engineering firms will need to be hired to examine these aspects for each landfill.

2.2.2. Wastewater Treatment Plants

Because the upgrading process from biogas to RNG is very similar to landfills, a similar equation can be used to calculate the amount of RNG potentially produced from biogas at each WWTP. The only modification comes from the higher percent content of the biogas methane in WWTPs than that in landfills. Biogas from WWTPs is approximately 63–67% methane [37]. Therefore, the production of high BTU RNG from WWTP biogas (BG) is calculated in Equation (3):
RNG   MMSCFY =   WWTP   BG   SCFY × m WWTP × f E   × m BTU ng BTU × 1000000
The same efficiency factor, heating conversion rates, and conversion factor from the LFG to RNG are used in this equation. The 0.63 SCF of methane per 1 SCF of WWTP BG is signified by m WWTP . Additionally, the same disclaimers outlined above for RNG calculation for landfills also apply to WWTPs.

2.2.3. Renewable Natural Gas Production Analysis

RNG production from the viable landfills and WWTPs can be found in Table 2 and Table 3. Statistical analysis to test for differences between the mean RNG production of landfills versus WWTPs was conducting using a one-way ANOVA with alpha set at 0.05. The test was run using the stats package in R 2018 version 3.5.1 [43].

2.3. Environmental Comparisons

In addition to all of the renewable natural gas production calculations, the average homes heated with the potential renewable natural gas produced was calculated to help better conceptualize the impact of these projects. These calculations also help to highlight the impact of landfill versus WWTP projects. Equation (4) was obtained from the previously used US EPA Landfill Gas Energy Benefits calculator and relies on the information that the average household uses 57,800 SCF of natural gas each year for their heating needs ( h avg ) [44].
  Homes   Heated   =   RNG   SCFY × h avg
While the RNG projects will lead to large emissions reductions, the production of RNG from LFG and WWTP biogas will also produce some carbon dioxide that will be discharged from the RNG facilities. In order to calculate how many metric tons of carbon dioxide (MT CO 2 ) will be discharged the following values should be used: 36.8 kg CO 2 e/MMBTU for landfills ( lfg CO 2 e ) and 8.2 kg CO 2 e/MMBTU for WWTPs bg CO 2 e [45]. Additionally, to convert from MMBTU, the heating value of 1050 MMBTU per 1 MMSCF of natural gas was used ( ng BTU ) and to convert from kg to metric tons the equation is divided by 1000 [42].
Average Landfills CO 2 Emission Production is calculated in Equation (5):
MTCO 2 year   =   RNG   MMSCFY × ng BTU × lfg CO 2 e 1000
Average Wastewater Treatment Plants CO 2 Emission Productions is calculated in Equation (6):
MTCO 2 year   =   RNG   MMSCFY × ng BTU × bg CO 2 e 1000
Statistical analysis between the mean CO 2 produced through RNG production of landfills versus WWTPs was conducting through a one-way ANOVA with alpha set at 0.05 in R 2018 version 3.5.1 using the stats package [43].

2.4. Financial Calculations for Landfills and WWTPs

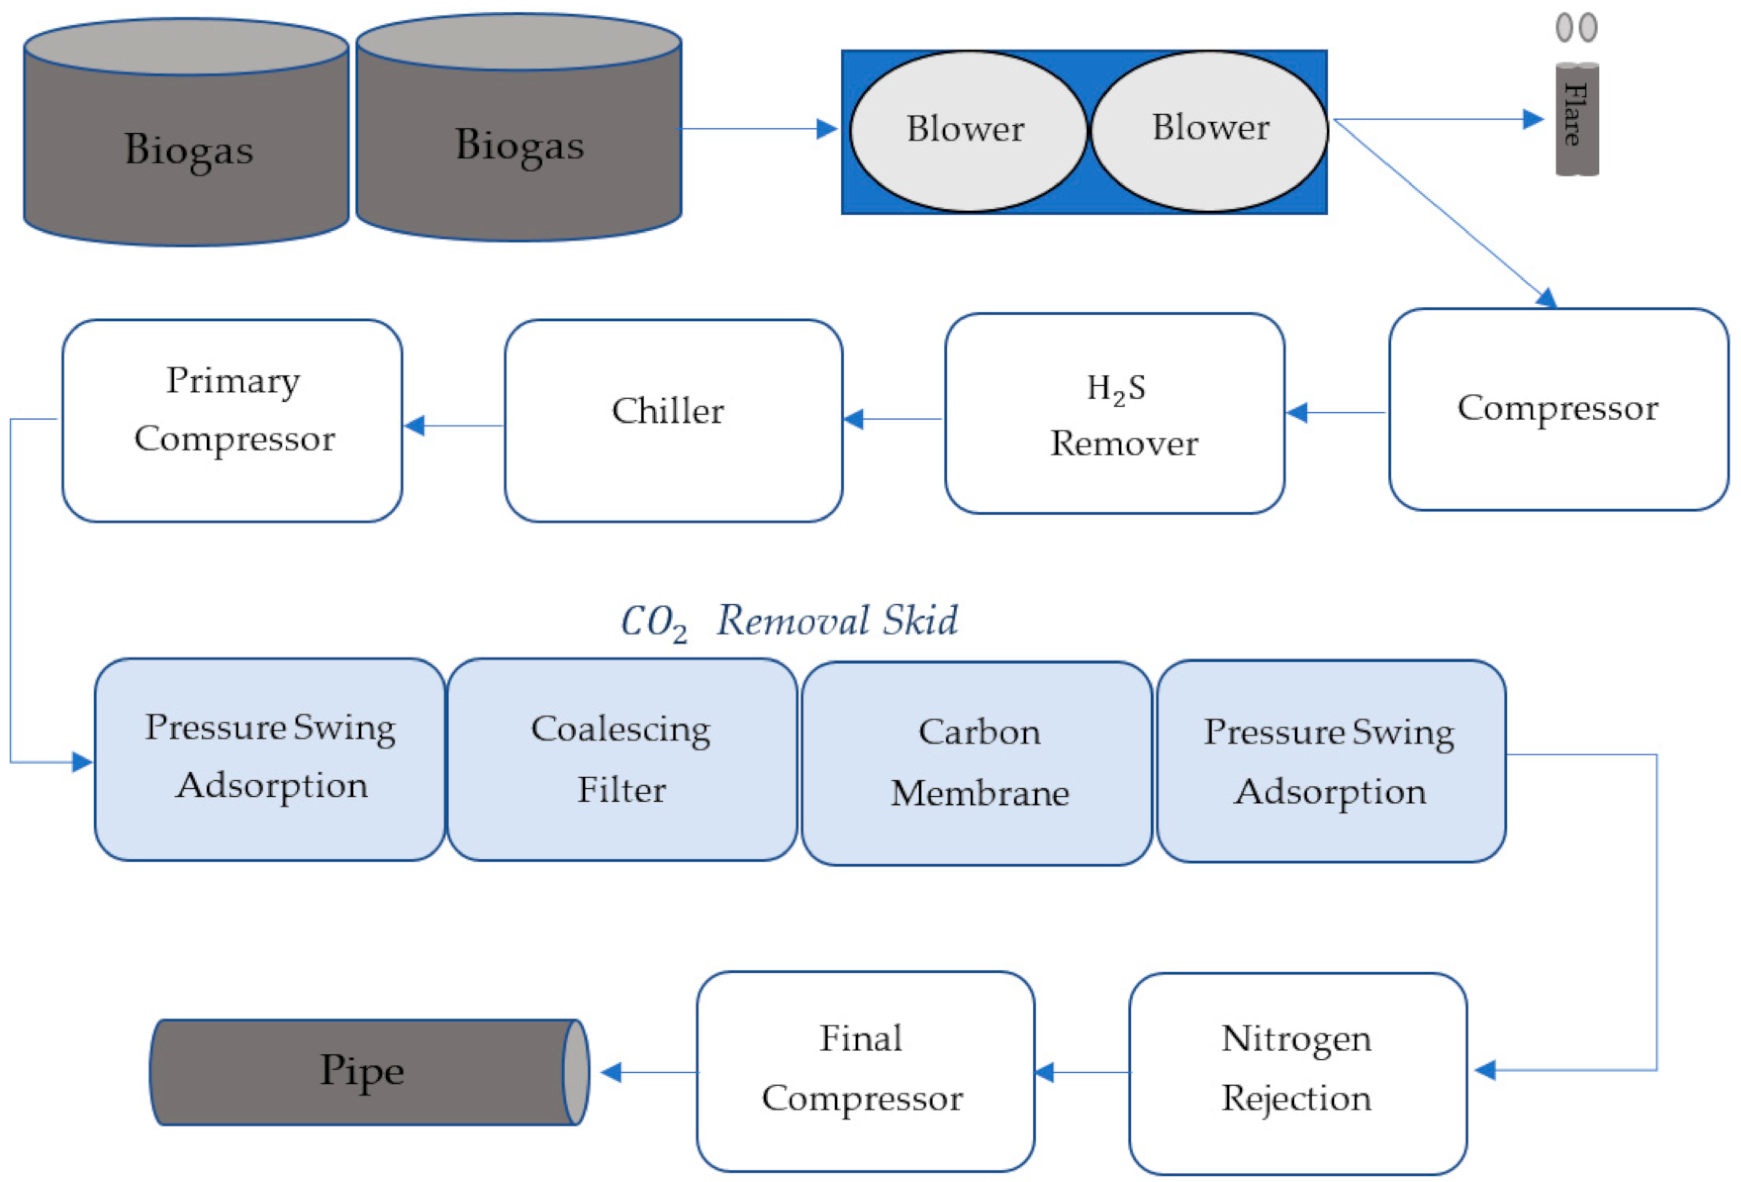
The costs of renewable natural gas projects can be broken out into capital investment and operating and maintenance (O&M) costs. The capital investment includes compressors, gas separators, and dryers for pipeline quality gas [25]. It is important to note that the cost of upgrading for each landfill varies depending on the contents and impurities of gas from each location. For example, if there is high nitrogen content in the gas then an additional nitrogen rejection unit may be needed before the final compression stage. This would increase the capital expense by an additional USD 3 million [25]. Additionally, operational expenses (OEt) can vary from 15–20% depending on how much equipment is needed to convert biogas to RNG. If a facility has additional equipment in place due to different gas qualities, additional maintenance would be needed for that facility. The equipment is assumed to have a 20-year usable lifetime. Approximated costs for capital expenses (CE), annual O&M expenses without electricity expenses (O&Mt without EEt), and annual electricity expenses (EEt) are calculated based on biogas flow (landfill gas and WWTP biogas).
RNG Project Expenses are calculated in Equations (7)–(10):
CE = LFG   or   WWTP   BG   SCFM 2000 0.63 × C
O & M t   without   EE t = LFG   or   WWTP   BG   SCFY × m
EE t   =   LFG   or   WWTP   BG   SCFY × k × D KWH
OE t   =   O & M t   without   EE t + EE t
The capital expense varies based on components that would need to be measured on a per case basis. Therefore, the calculation above is designed to give an estimate taking into consideration the amount of biogas coming in with the expectation that more gas flow means a higher chance of needing extra equipment. It factors in the SCFM when calculating potential equipment costs and SCFY when calculating annual operation and maintenance costs. It is based on a 2000 SCFM operation, which would estimate between USD 16 and USD 18 million in 2019 based on information provided from an RNG specific contractor [25]. When making a formula to use universally based on SCFM, the upper range of the cost estimates was used to be conservative. This can be seen in Equation (7) ( C = 18 , 000 , 000 ). The true capital expense will change by year and location, so an estimate was used to calculate the costs. The O&M cost is taking into consideration the amount of biogas flowing per year. The more biogas being produced the more maintenance is necessary, so this formula scales with the size of production. The operating expense is charged at an operating and maintenance rate (m) of USD 0.22/1000 SCF [25]. The electricity expense takes into consideration the cost on an industrial level per kilowatt hour and an average of how much electricity is estimated to be consumed per year based on the amount of gas flow. This is signified by k, which is 0.009 KWH per ft3. The costs of electricity were calculated with the current price of electricity at the date in which this report was written ( D KWH = USD   0.1012 / KWH ) .
It is also important to note that landfills require collection systems to collect the byproduct of their decomposing waste- biogas or landfill gas. LFG collection typically begins after a portion of the landfill, known as a “cell”, is closed to additional waste placement. Collection systems can be configured as either vertical wells or horizontal trenches [12]. On average, one acre of a landfill requires one well. The cost of one well is about USD 19,500 per acre [25], and the typical cost of maintenance for one well per year is USD 2250 [25]. Costs can vary based on the depth that a collection well needs to go into the landfill. This report only focuses on candidate landfills, meaning that the wells are already in place and so the cost of the collection wells does not need to be included in the financial model.
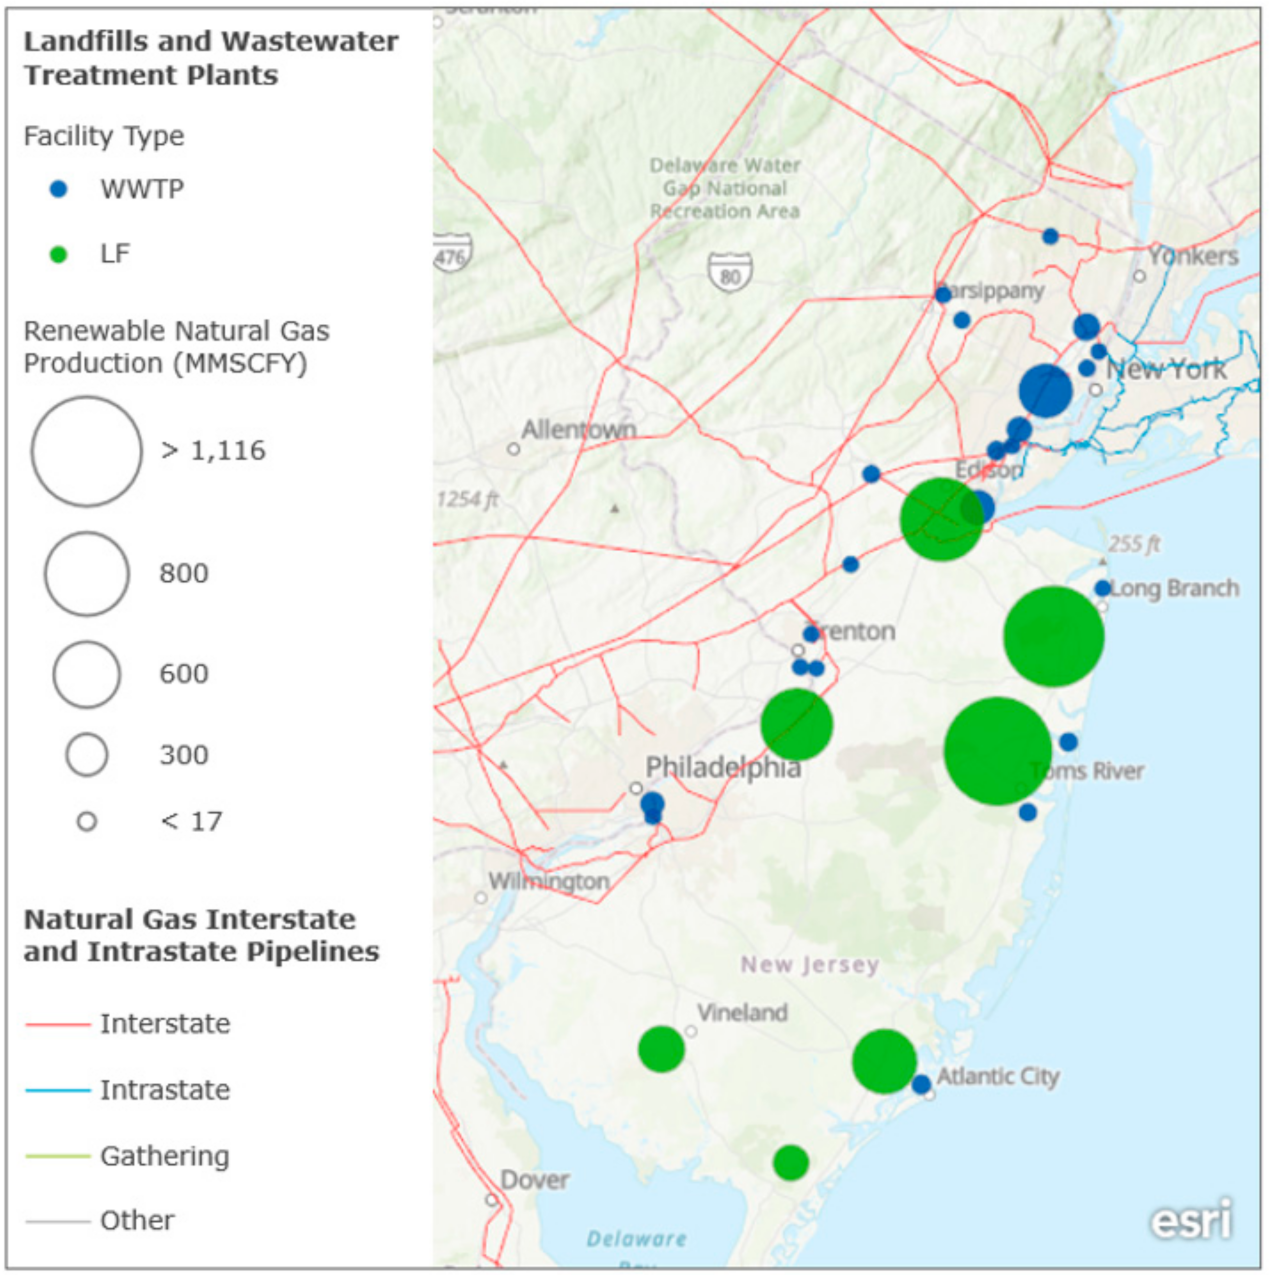
In addition, all RNG projects whether located at a landfill or WWTP would need to be connected to natural gas pipelines. Depending on the size of a pipeline and the location of the site, interconnection costs can be very expensive. The interconnection cost would be approximately USD 1.5–3 million per mile [29], and so the farther the facility is from the existing natural gas pipeline, the more expensive the construction would be. In the case of this project, these expenses are not including in the financial analysis because the New Jersey Board of Public Utilities (NJBPU) helps to finance this construction [46].
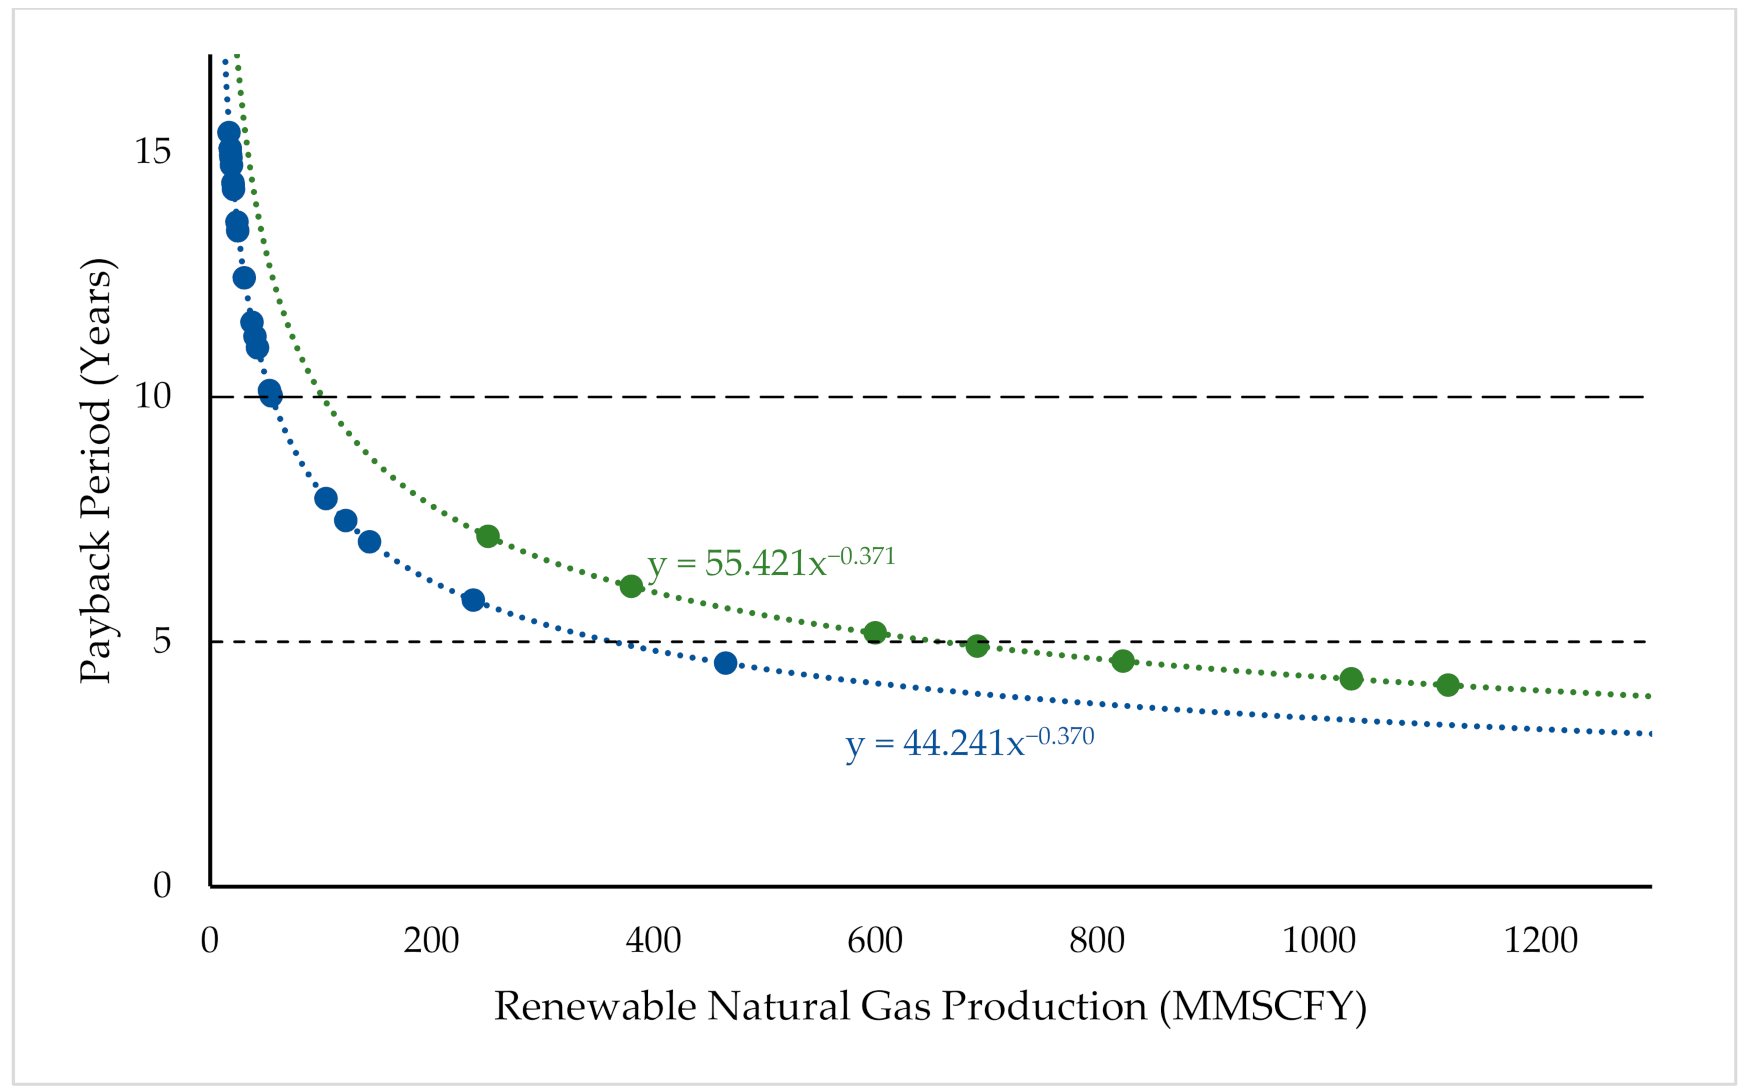
A payback period was calculated (Equation (11)) for all viable RNG locations including both WWTPs and landfills. This offered comparability with a universal measurement that did not discriminate between the two different types of projects. Once the total capital expenses, yearly operating expenses, and potential yearly revenue were calculated, the annual profit margin ( PM t ,   Equation (12)) for the landfills and WWTPs could be calculated in order to find the payback period for each of the facilitates. The payback period shows how many years it will take before the project turns a profit assuming all revenue goes towards paying off the project. It is a simplified calculation used to compare profitability across options. The following equations were used in these calculations:
Payback   Period = CE PM t
PM t   =   R t OE t
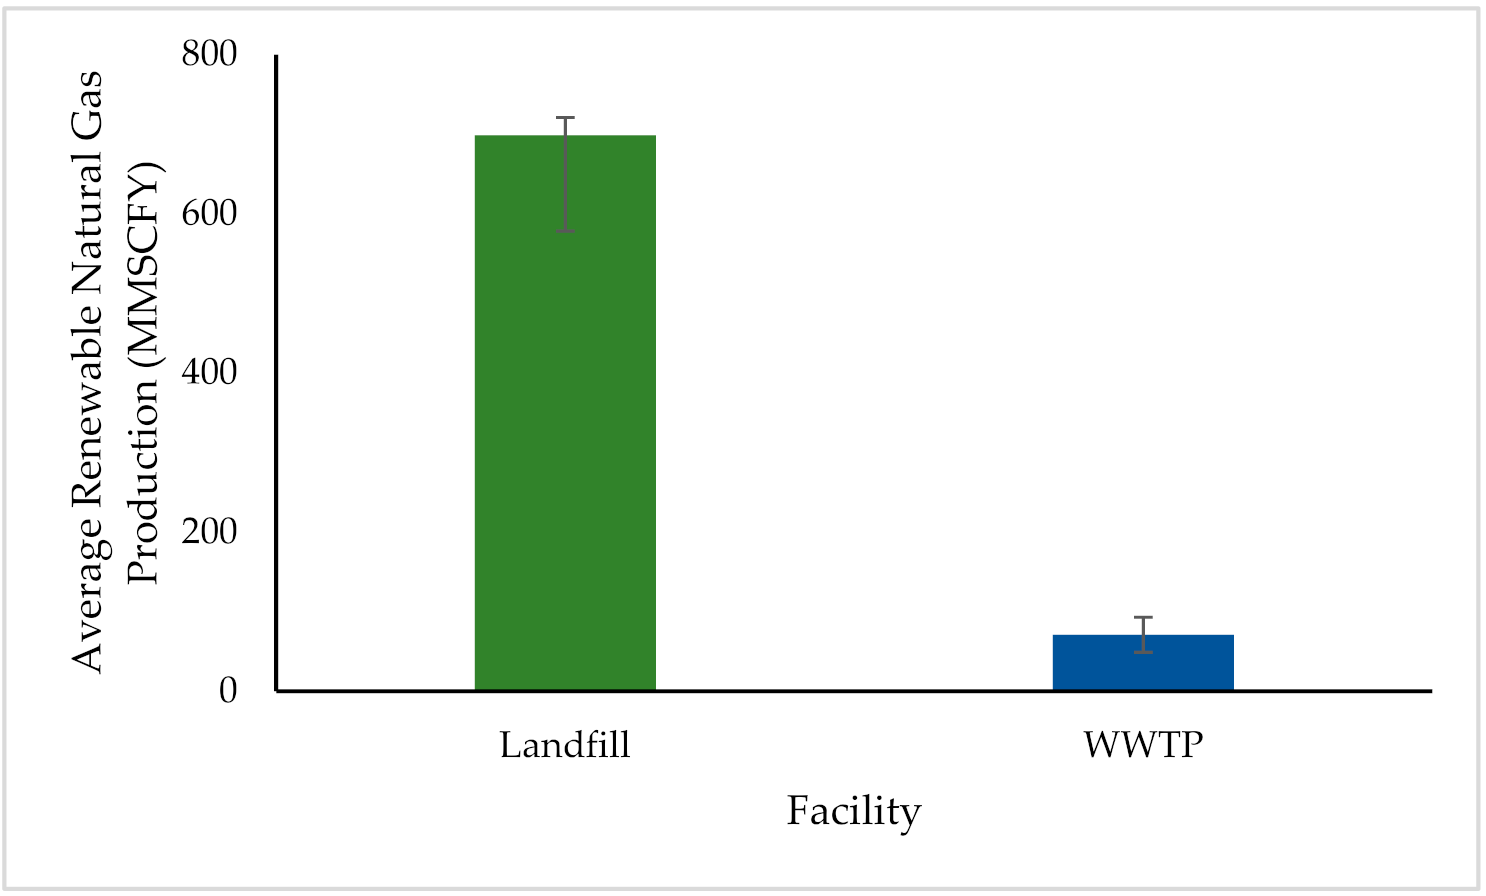
Internal rate of return (IRR) and net present value (NPV) models were also created to represent the potential outcomes for each of the seven viable landfills. The models only focused on the landfills because they were producing significantly more biogas which in turn meant these facilities should be more profitable. This was supported by the results of the initial payback period calculations that predated further modeling. The initial cash outflow is the capital investment. The models use the net cash flows of the annual retail sales revenue, the United States modified accelerated cost recovery system (MACRS) that acts as a tax shield on investments, and annual O&M expense including electricity. The projects were constructed on a 20-year timeline due to the projected lifetime of the machinery. The discount rate (r) of 13% was used because this was the provided hurdle rate from New Jersey Natural Gas. The IRR and NPV models are designed to take into consideration the value of the investment if it was otherwise spent on an alternative project. High risk investments such as investing in a new energy source must meet higher yields to be worth the risk to investors. This means that a utility company would not pursue a project such as this unless the IRR was over 13%. With these factors considered, the NPV (Equation (13)) and IRR (Equation (14)) of each data set were calculated through 2016 Microsoft Excel’s formula for each. In the equations, T represents the number of time periods, t is the time period of each summation, and r signifies the discount rate. The equations also utilize the revenue ( R t ) and all costs C t during the given time period.
NPV = t = 0 T   R t     C t 1 + r t
IRR : t = 0 T   R t     C t 1 + r t = 0
In order to calculate the true revenue ( R t , Equation (15)), the IRR model had to be constructed first. The 2016 Microsoft Excel data tool “Goal Seek” was used to determine what the gas must be sold at per Therm in order to return the IRR value of 13%. Excel’s Goal Seek changes one factor in a formula in order to produce the end goal desired. This means for each landfill there would be a different price in order to make the project meet the 13% hurdle rate. The capital expense and annual operating expense will be the same no matter what the gas is sold for, so the price per Therm was used as the changing factor. In Table 4, the prices vary from as low as USD 0.8063 per Therm to as high as USD 1.2126 per Therm. The average price is calculated to be USD 0.9499 per Therm, so this would become the standard retail price of RNG in order to meet required return levels. This average was used in all financial modeling, and it was retroactively filled into the payback period models to improve accuracy. Equation (15) uses this rate of USD 0.9499 per Therm ( D th ) to calculate the annual revenue of RNG projects. The amount of Therms produced each year at a given RNG project was calculated with Equation (16) to utilize in Equation (15) and utilizes the conversion rate of 10,000 Therms per 1 MMSCFY of RNG ( th RNG ) . This also means that projects that required a price higher than USD 0.9499 will not meet the hurdle rate, and therefore will not be accepted as options.
R t =   RNG   Therms × D th
RNG   Therms = RNG   MMSCFY × th RNG
The incentive gap (Equation (17)) was calculated with consideration of the current natural gas rate (CR). Natural gas at the time of this study is being sold at an average price through NJNG of USD 0.4667 [47]. Because the RNG needs to be sold at the retail rate (RR) of USD 0.9499 to meet the financial goals and the conventional natural gas is being sold at USD 0.4667, the incentive gap (IG) would be the difference between these two or USD 0.4832.
IG = RR CR
This means that the customer either has to pay an additional USD 0.4832 per Therm in order to be enrolled in the RNG option, or an incentive system must be in place to subsidize this extra cost.
Another option to offset the higher cost of RNG per Therm is renewable identification numbers (RINs). For the calculation of revenue that could potentially be brought in from RIN sales (Equation (18)), the units of a RIN must be understood. A RIN is measured in the equivalence of burning one gallon of ethanol fuel which is equivalent to 77,000 BTU [48]. At the time of this report, RINs for renewable natural gas could have been sold or brought at USD 0.5864 per Therm according to the EPA’s RIN Trades [49]. The RINs are classified by where they are sourced from with varying price ranges. Landfill gas related RINs fall under D5 classification. The price range for D5 class RINs are starting from USD 0.05 and ranges up to USD 2.00 per RIN [49]. D5 RINs generated in 2018 are being sold in 2019 at an average price of USD 0.50 per RIN [49]. RINs are currently generated for every gallon of renewable fuel produced. This is equivalent to USD 0.5864 per Therm (DRIN). Since New Jersey does not currently accept RNG for heating purposes, regulations would have to change in order to take advantage of this. However, if this program was adjusted, this would eliminate the incentive gap.
RIN   R t = RNG   Therms × D RIN

2.5. Financial and Logistical Comparisons of Landfills and Wastewater Treatment Plants

Because of the finding that landfills have higher potentials for RNG production and lower payback periods, a comparison was done between the RNG production of WWTPs and landfills and their payback periods to attempt to better understand the relationship between the two variables. Trend lines and analyses were conducted using Microsoft Excel 2016 [50].
Finally, because of the necessity to connect RNG projects to the existing gas pipelines in New Jersey, the locations of viable landfills and WWTPs were mapped with these pipelines to better understand their proximity. This was done using ArcGIS maps from the Energy Information Administration (EIA) and ESRI [51].

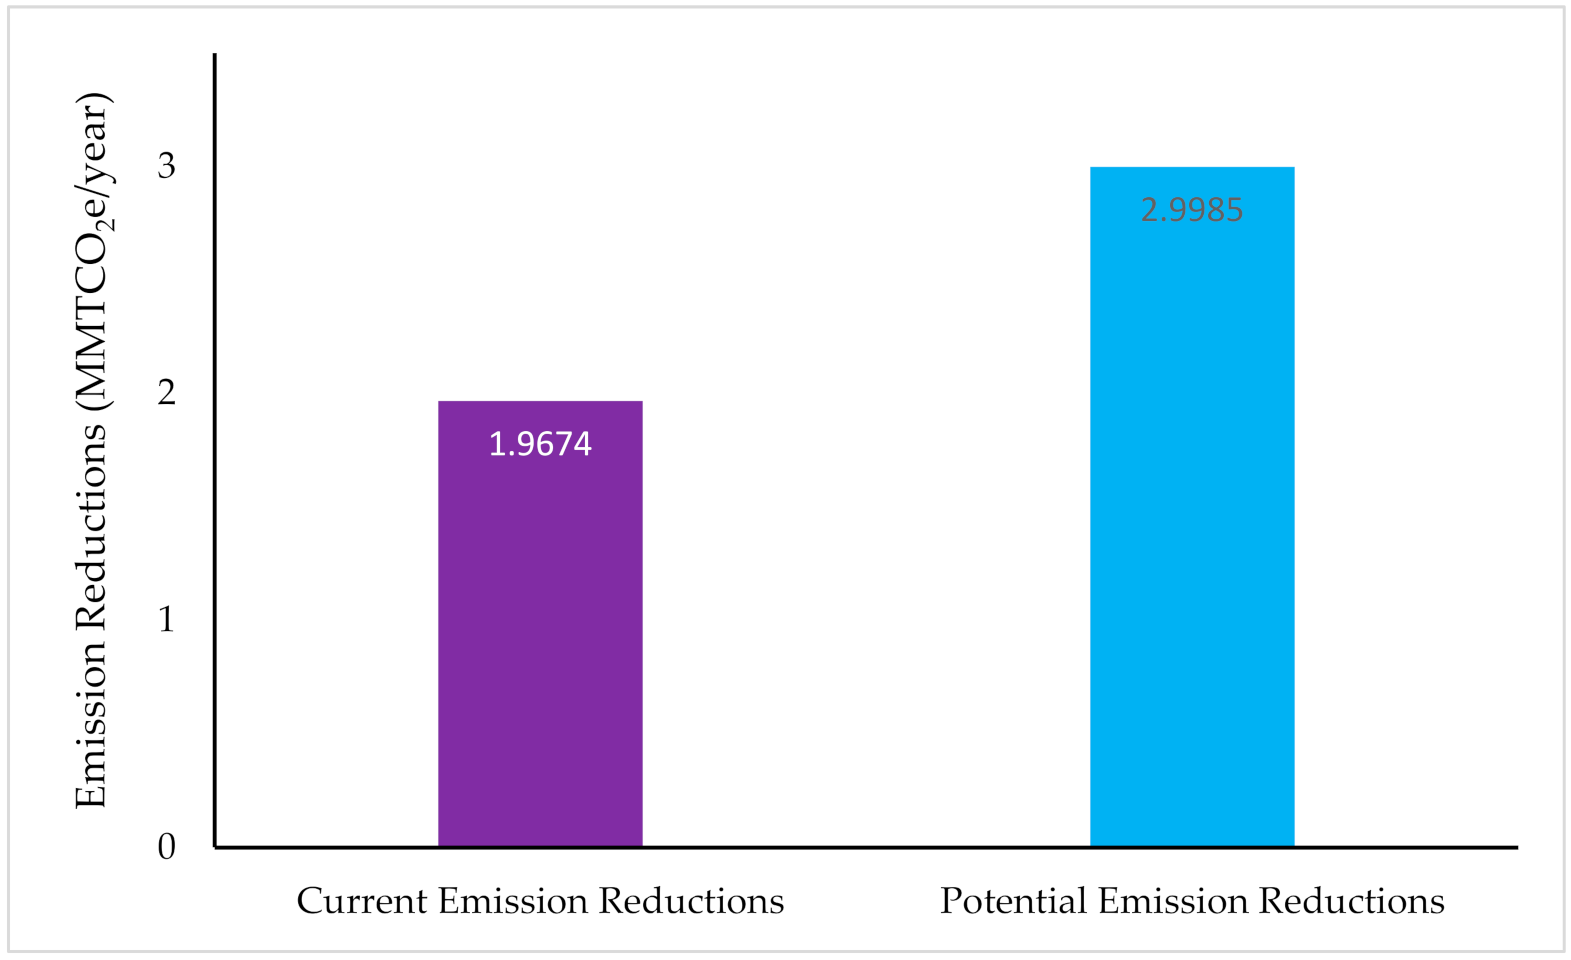
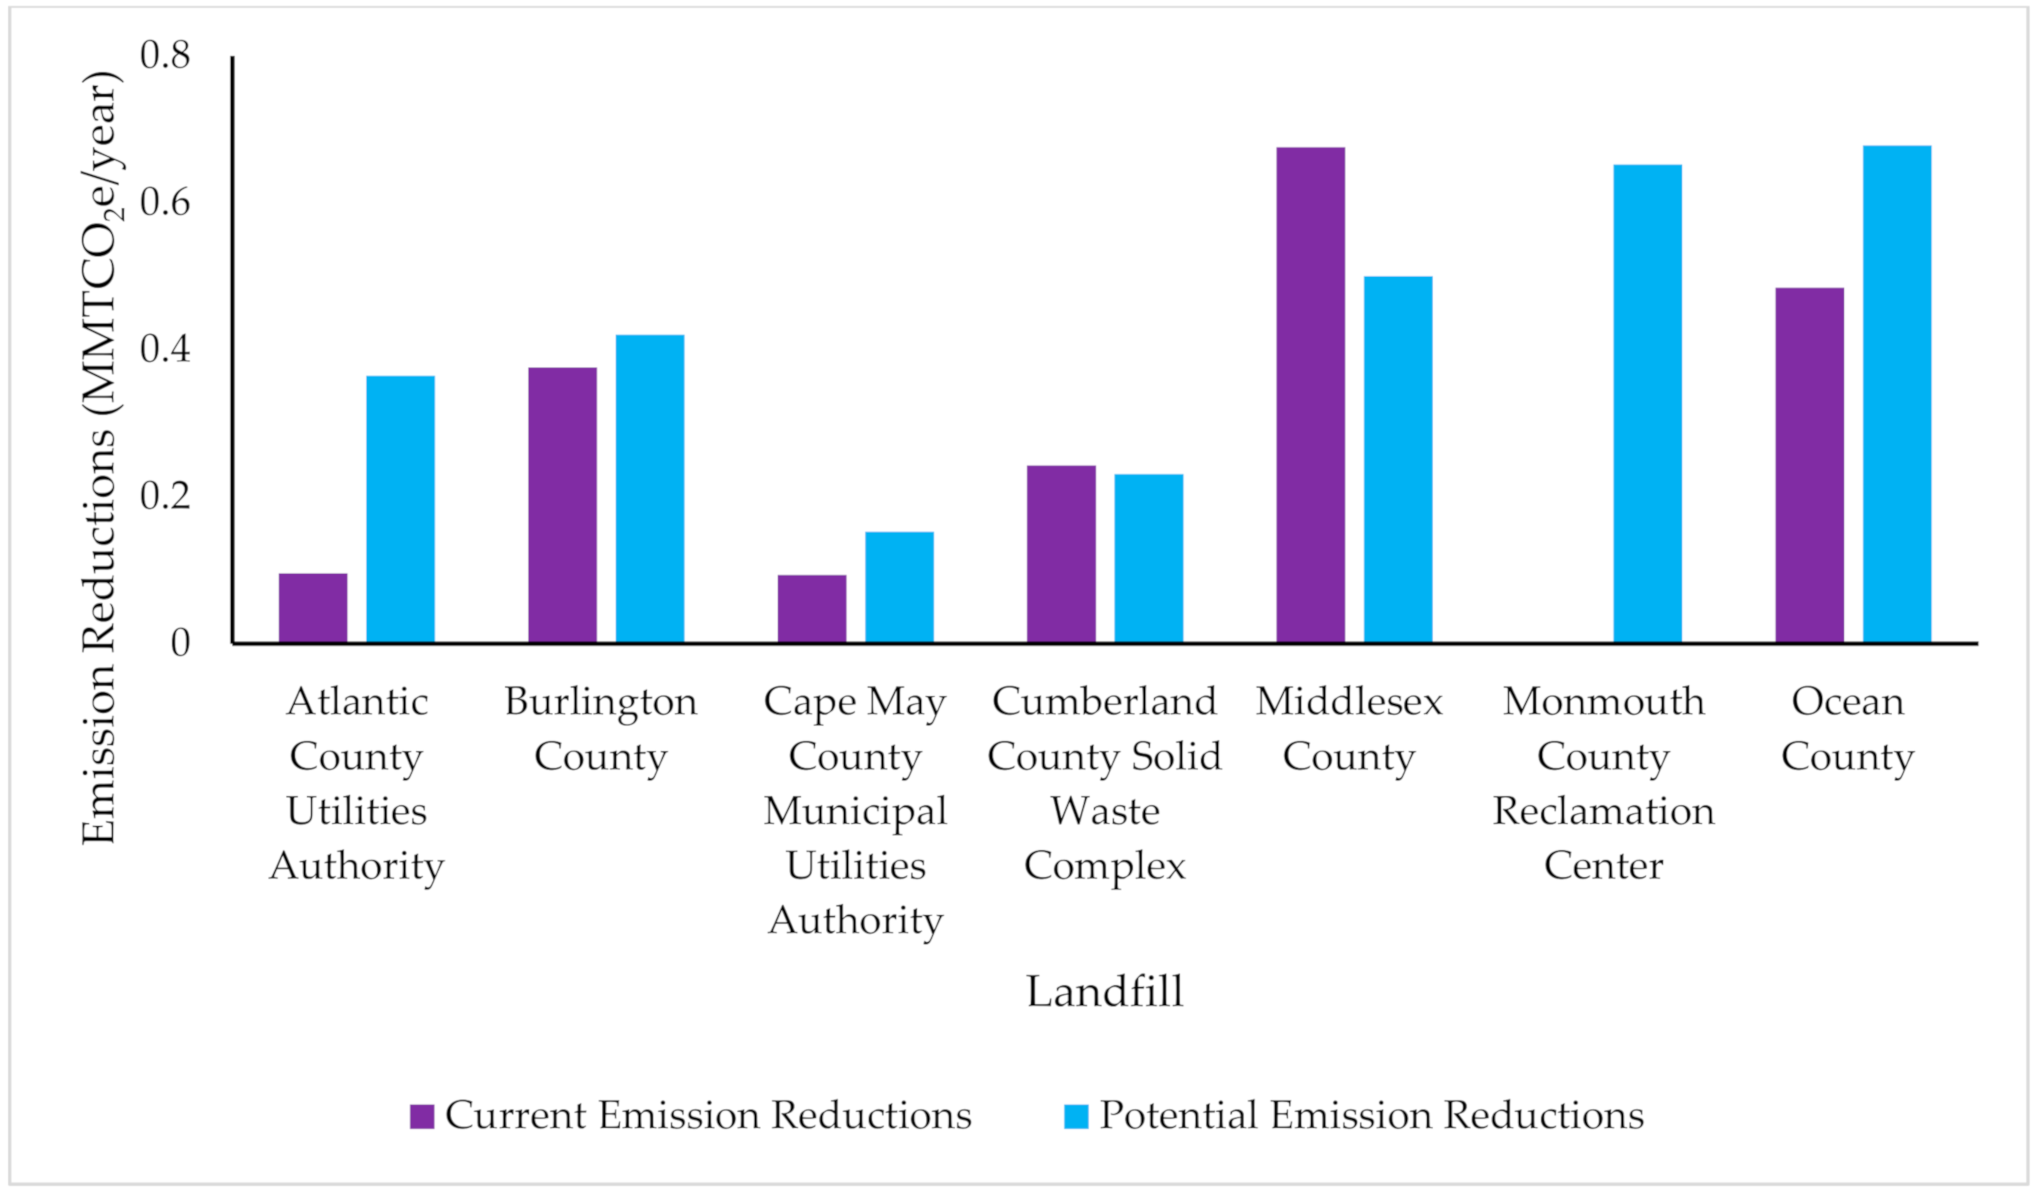
2.6. Current and Potential Emission Reductions from Renewable Natural Gas Projects at Landfills

Current emission reductions from ongoing electricity projects at landfills and potential emission reductions from possible RNG projects were compared for each landfill in order to gain better insight into RNG projects. Current emission reductions are based on the present gas to electricity projects of the viable landfills. These projects, found in the 2019 US EPA LMOP database, recorded the amount of landfill gas collected, megawatt (MW) generation of the project, direct methane reductions, and avoided carbon dioxide reductions each year [52]. In order for the US EPA to calculate the current total emissions reductions, the MW generation of each project at each viable landfill was inputted into the US Environmental Protection Agency (EPA) Landfill Gas Energy Benefits calculator [44]. MW generation is being used over LFG flow to project based on data availability from the EPA’s LMOP. These calculations provide an estimate of the potential methane emitted directly from the landfill, the offset of carbon dioxide from avoidance of fossil fuels, and the total emissions reduced by adding direct and avoided emissions. The equations used by the US EPA to calculate the direct emissions reductions (Equation (19)), avoided emissions reductions (Equation (20)), and total emissions reductions (Equation (21)) based on the MW capacity of the project can be found below.
Direct Equivalent Emissions Reduced Calculations for Electricity Generation Projects:
MMTCO 2 e yr   =   MW   generation × f G × 8760 × 1000 × b KWH × m lbs × s × gwp m BTU × l × 1000000
Avoided Equivalent Emissions Reduced Calculations for Electricity Generation Projects:
MMTCO 2 e yr   =   MW   generation × f N × 8760 × 1000 × RF × s l × 1000000
Emission   Reductions   =   Direct + Avoided
The following are conversion factors used in the equations to convert to the proper units: 8760 h per year, 1000 KW per MW, 0.9072 metric tons per short ton ( s ) , 2000 pounds per short ton ( l ) , and 1,000,000 metric tons per million metric tons [42]. In the Direct Emissions Reductions calculations (Equation (19)), the 0.93 in the numerator is the gross capacity factor ( f G ) which accounts for the energy loss during production because of inefficiencies with equipment or weather-related impacts [41]. The following are heating values and rates used in the Direct Emissions Reduction Equation (19): 11,700 BTU per KWH ( b KWH ) and 1012 BTU per SCF of methane ( m BTU ) , and are used to convert the equation from units of power (watts) to units of heat (BTU). Additionally, the methane conversion of 0.0423 pounds of methane per SCF of methane ( m lbs ) is used to convert units of heat to methane. The gwp stands for Global Warming Potential of methane which refers to methane having 25 time the global warming potential than carbon dioxide as reported by the 2014 IPCC. This is used to convert from methane to carbon dioxide equivalents. In the Avoided Emissions Reductions calculations (Equation (20)), the 0.85 in the numerator refers to the net capacity factor ( f N ) for generation units of electricity projects and accounts for operating load, availability, and small loses. Additionally, the 1540 pounds per MWH is the regional grid factor ( RF ) for 2019 for the mid-Atlantic region and is based on the AVoided Emissions and geneRation Tool (AVERT) to calculate the avoided carbon dioxide emissions. More specifics about the creation of the equations can be found through the US EPA’s Landfill Gas Energy Benefits calculator [44].
In order to find the potential emissions reductions of RNG projects, the same Landfill Gas Energy Benefits calculator was used [44]. This time, however, the LFG collected (MMSCFD) was used to calculate the direct and avoided emissions. This operates under the assumption that RNG projects would utilize all LFG collected at each landfill. The equations used by the US EPA in their landfill gas benefits calculator to calculate the direct emissions reductions, avoided emissions reductions, and total emissions reductions based on the LFG can be found below.
Direct Equivalent Emissions Reduced Calculations for Direct-Use Projects:
MMTCO 2 e yr   =   LFG   MMSCFD × 365 × 1000000 × m LFG × m lbs × s × gwp l × 1000000
Avoided Equivalent Emissions Reduced Calculations for Direct-Use Projects:
MMTCO 2 e yr   =   LFG   MMSCFD × f G × 365 × 1000000 × m LFG × m BTU × c lbs × s ng BTU × l × 1000000
Many of the conversion factors, methane conversions, and heating values and rates from the first set of Direct and Avoided Emissions equations are used in the second set. Additional conversion factors used in these equations are: 365 days per year and 1,000,000 SCF per 1 MMSCF in the numerator [42]. Both of the direct-use equations based on LFG collected also rely on the previously stated information that 50% of LFG is methane ( m LFG ) . The Avoided Emissions equation also utilizes the heating rate of 1050 BTU per 1 SCF of natural gas ( ng BTU ) and the carbon dioxide conversion of 0.12037 pounds of carbon dioxide per 1 SCF of natural gas ( c lbs ) . These components allow for the conversion from heat units to SCF of natural gas to carbon dioxide. Additionally, the Avoided Emissions equation multiplies the MMSCFD of LFG by 0.9, which is the gross capacity factor ( f G ) for direct-use LFG projects. Further information about the creation of these equations can be found through the US EPA Landfill Gas Energy Benefits calculator spreadsheet [44]. In order to determine the total emission reductions of RNG projects at WWTPs, we replaced the MMSCFD LFG with MMSCFD of biogas from WWTPs and changed the methane conversion factor of 0.5 SCF methane per SCF LFG to 0.63 SCF methane per SCSF biogas for both the direct and avoided emissions equations.

3. Results

3.1. Viable Landfills and Wastewater Treatment Plants in New Jersey and Their Renewable Natural Gas Production

We found that there are currently seven landfills in New Jersey that meet the criteria for renewable natural gas (RNG) projects. Table 2 shows the biogas production and the RNG produced for each of the seven viable landfills. RNG production at these seven landfills range from 250.8 million standard cubic feet per year (MMSCFY) at Cape May County MUA Landfill to 1116.1 MMSCFY at Ocean County Landfill.
We found that there are 22 wastewater treatment plants in New Jersey that fit the criteria for an RNG project. Table 3 shows the biogas and RNG produced for the seven largest wastewater treatment plants (WWTP) out of the viable 22 plants for reasons of brevity and for comparison against the seven viable landfills. The WWTP that produces the most RNG is Passaic Valley Sewerage Commission at 465.0 MMSCFY of RNG. This is more than the amount produced by each of two of the above landfills: Cumberland County Solid Waste Complex and Cape May County MUA Secure Landfill.
Including all 22 viable WWTPs, the average RNG production per WWTP is 70.9 MMSCFY while the average of the top seven WWTPs is 169.0 MMSCFY. The average RNG produced from the landfills is 698.6 MMSCFY per landfill. The average RNG production of the seven landfills is significantly larger than the average RNG production of both the top seven WWTPS and of the 22 viable WWTPs (p = 0.0018, p < 0.001, ANOVA, Figure 4). The average RNG production of the landfills is more than 9.85 times that of the average production of the 22 viable WWTPs.

3.2. Environmental Comparisons between Landfills and Wastewater Treatment Plants

If all seven viable landfills used the entirety of their collected LFG to produce RNG, which in turn was used to heat the average home, 89,542 homes would be heated (Figure 5). For all 22 WWTPs, this would result in 26,997 homes heated. This means that the seven landfills could produce enough RNG to power over three times the number of homes than all 22 WWTPs. On average, an RNG project at a landfill would produce enough RNG to power approximately 12,792 average homes and an RNG project at a WWTP would produce enough RNG to power approximately 1227 average homes.
While landfills produce significantly more RNG per project than WWTPs, they also produce higher quantities of CO 2 per RNG project. The average landfill produces 26,995.8 MTCO2 while the average WWTP produces 610.7 MT CO 2 . The average CO 2 produced at RNG projects at landfills is significantly higher than RNG projects at WWTPs (p < 0.001, ANOVA, Figure 6). The average CO 2 production of RNG projects at landfills is more than 44 times that of the average CO 2 production of the 22 viable WWTPs.

3.3. Financial Results for Landfills and WWTPs

The price per Therm that would have to be charged in order for a project to meet the 13% IRR goal, as determined using the “Goal Seek” function as described in Section 2.4 is different at every landfill (Table 4) because there are different flow rates that effect various costs. The average of these numbers was taken to be used as the retail rate in all revenue calculations.
The financial aspects of the seven viable landfills and top seven WWTPs in New Jersey as well as the average financial information for the landfills and all 22 WWTPs were summarized (Table 5 and Table 6). Only the top seven WWTPs are shown for brevity and comparability reasons against the seven viable landfills. The average capital expense of landfills is over 5.5 times the average capital expense for WWTPs, but the average profit margin of landfills is roughly 9.1 times that of WWTPs. The average payback period, calculated from the capital expenses and the profit margin, of landfills is 5.19 years, and the average payback period of the top seven WWTPs is 7.57 years and of all viable landfills is 11.78 years. Only the WWTP with the lowest payback period, Passaic Valley Sewerage Commission with a payback period of 4.56 years, has a lower payback period than the average payback period for landfills. It is clear that landfills account for less time in terms of payback period to cover the initial investment of biogas upgrading equipment. Additionally, it is evident that WWTPs have an increasing trend where only a few plants can be profitable in a manageable amount of time in comparison to the landfills.

3.4. Landfill and WWTP Payback Period versus Renewable Natural Gas Production

In the financial results, a general relationship between renewable natural gas production and payback period became apparent. As the RNG production at a facility increases, the payback period decreases. Figure 7 displays a scatterplot of this information for landfills and WWTPs. In addition, dotted black lines at a payback period of five years and ten years were also included to aid in visualization. The equations of these trend lines can be derived from the RNG production and financial equations in the methods. Because the biogas from WWTP’s is 63% methane versus 50% for landfills, and subsequently produces more RNG per biogas input, the coefficient of the WWTP line is less than that of the landfill. This also means that WWTPs require a smaller amount of RNG produced in order to have a five-year payback period, approximately 362.3 MMSCFY. Landfills would need to produce 666.1 MMSCFY of RNG in order to have a five-year payback period. Even though WWTPs have a lower threshold to hit the five-year payback period, only one of the 22 WWTPs meets this while four of the seven landfill projects produce more RNG than their respective threshold.

3.5. Internal Rate of Return and Net Present Value

Using the standardized retail price of USD 0.9499 per Therm, the true IRR of each landfill can be calculated (Table 7). When using the hurdle rate of 13%, Cape May County MUA Secure Landfill and Cumberland County Landfill do not meet the required return levels. From an investment standpoint, this cuts the potential landfills down to five out of seven. Additionally, it can be seen that Ocean County Landfill has the highest return on investment followed by Monmouth County Reclamation Center.
Table 7 also shows the results of the net present value (NPV) calculations. This reflects similar information to the IRR except the NPV is showing all profits that would be made on the project in present day value. The Cape May and Cumberland locations are nonviable options at the current retail price. While they would still turn a profit after six to seven years, as seen in Table 4, the money could be invested elsewhere in a more profitable investment. Landfills such as Monmouth County and Ocean County show more potential to bring in high profits.

3.6. Landfill vs. WWTP Proximity to Pipelines

Although landfills are a heavily supported option when discussing the implementation of RNG from a financial and RNG production standpoint, there are other considerations when deciding what RNG projects to pursue. As previously stated, the RNG projects at landfills and WWTPs would need to be connected to existing natural gas pipeline. The viable landfills (green) and WWTPs (blue) are varying distances from this existing infrastructure (Figure 8). Figure 8 also displays the RNG potential in MMSCFY of the landfills and WWTPs through the size of the dot representing their location. While only two of the landfills lie in close proximity to the existing natural gas pipeline (Middlesex County and Burlington County landfill), 18 of the 22 WWTPs are located closely to the natural gas pipelines. Additionally, it is apparent again that landfills have the potential to produce more RNG than WWTPs.

3.7. Current versus Potential Emissions Reductions for Landfills

Based on the 2019 US EPA Landfill Methane Outreach Program (LMOP) database [36], there are eight current LFG to electricity projects at the seven viable landfills in New Jersey. Monmouth County Reclamation Center has no projects while Middlesex County and Burlington County landfill each have two projects. The remaining four landfills each have one ongoing project. These projects use various amounts of the LFG collected at their respective landfills while the proposed RNG projects would use all available LFG collected. Figure 9 depicts the total emissions being reduced for the current landfill electricity projects (purple) in New Jersey compared to if all the viable landfills were to pursue an RNG project (blue) using all of their collected LFG in million metric tons carbon dioxide equivalents per year (MMT CO 2 e/yr). Decreasing by one MMT CO 2 is equivalent to taking 216,000 fossil fuel burning passenger cars off of the road [53]. The potential emission reductions (blue) outweigh the current emission reductions (purple) by 1.0311 MMT CO 2 e/yr making the difference in possible emission reductions equivalent to removing approximately 222,718 fossil fuel burning passenger cars from the roads. It should be noted that the potential emission reductions from RNG projects at all WWTPs is 0.9481 MMT CO 2 e/yr.
While the potential emission reductions from all RNG projects is greater than the current emission reductions seen from all existing LFG to electricity projects, this is not the case when considering landfills individually (Figure 10). RNG projects can provide higher greenhouse gas reductions at all but two of the facilities than the current projects that the facilities are managing.
Both Cumberland County Solid Waste Complex and Middlesex County have estimated current emission reductions greater than the estimated potential emission reductions. This is counterintuitive because potential emission reductions from RNG projects are based on all available LFG, meaning that if the current emissions reductions are higher than potential emission reductions then the existing LFG to electricity projects would be using more LFG than is available. This will be explained in the Discussion. Because Monmouth County Reclamation Center has no ongoing LFG to electricity projects, it has the highest difference between current and potential emission reductions. It also has the second highest potential emission reductions at 0.6522 MMT CO 2 e/yr. Ocean County Landfill has the highest potential emission reductions at 0.6781 MMT CO 2 e/yr, which is approximately 1.4 times its current emission reductions. These two landfills show the biggest opportunity for RNG projects based on the potential emission reductions from RNG projects.

3.8. Landfills versus Wastewater Treatment Plants Summarizaiton

The key components of the proposed RNG Implementation Decision-Making conceptual model considered in the results section were RNG production, CO 2 emissions from RNG production, project expenses, project revenues, NPV/IRR/payback periods, RNG threshold to meet a five-year payback period, proximity to existing natural gas pipelines, and total potential CO 2 e emission reductions. A summation of which facility performed more desirably for the given aspect of the project for New Jersey can be found in Table 8.
On average, landfills produced more RNG, had higher project revenues, lower payback periods, and higher potential CO 2 e emission reductions. Conversely, WWTPs have lower CO 2 emissions from RNG production, lower project expenses, a lower RNG threshold to meet a five-year payback period, and were in closer proximity to existing natural gas pipelines.

4. Discussion

4.1. Renewable Natural Gas Production

Renewable natural gas (RNG) provides economic and environmental benefits that vary depending on the source of RNG. This is because the source impacts the logistical, financial, and environmental aspects of the project, as seen in the RNG Implementation Decision-Making (RNG IDM) conceptual model (Figure 1). For example, a benefit of RNG projects at landfills is that on average a landfill can produce more renewable natural gas than a wastewater treatment plants (WWTP) (Figure 4). A possible explanation for this is the scale at which landfill waste is produced versus sewage. The United States generates approximately 265.3 million metric tons (MMT) of municipal solid waste each year compared to 6.5 MMT of sludge, the component in wastewater used to produce renewable natural gas (RNG) [21,54]. Ultimately, because landfills produce more RNG, they also have a higher potential for heating more homes (Figure 5). Specifically, the average landfill can theoretically heat ten times the number of homes than the average WWTP. The landfills that produce the most RNG in this study are Ocean County Landfill with approximately 1116 million standard cubic feet per year (MMSCFY) and Monmouth County Reclamation Center with 1028 MMSCFY (Table 2). The largest RNG producing WWTP is Passaic Valley Sewerage Commission with 465 MMSCFY of RNG (Table 3).

4.2. Financial Considerations

4.2.1. Financial Analysis

While landfills produce more RNG, they also have higher capital expenses, more than five times that of the average WWTPs (Table 5 and Table 6). This is because the dirtier biogas of landfills requires more upgrading than biogas of WWTPs [40]. The lower quality of landfill gas (LFG) and the greater amount of it present at landfills when compared to WWTPs also means that average operating expenses of landfills exceeds that of the average WWTP by over USD 1.6 million per year. WWTPs have cleaner biogas because the waste is sent through an anaerobic digester (AD) before it goes through the upgrading equipment. An AD system could be put in place for all organic substances that comes into a landfill, but this would require greater capital investments and separation of organic waste from inorganic landfill waste. Other projects have highlighted the feasibility of AD systems that utilize organic waste separated from landfills [55]. It is important to note that the cost of an AD was not included in the financial analysis because only WWTPs with existing AD were considered as viable locations for RNG projects. Capital expenses such as well systems for landfills were also left out of the financial analysis for similar reasons. Required equipment may vary depending on the RNG project and would affect project expenses.
In addition to higher capital and O&M expenses, RNG projects at landfills also have higher potential revenue generation. Revenue is linearly related to the amount of RNG produced. Landfills produce more RNG than WWTPs and therefore have higher potential revenues. The average revenue generated from RNG projects at landfills in New Jersey is approximately 9.85 times the amount generated at WWTPs, the exact same ratio of RNG production from landfills to WWTPs (Table 2, Table 3, Table 5, and Table 6). Therefore, it is clear that lower generation of biogas, and thus RNG, poses a challenge to having economically feasible RNG projects at WWTPs. Shen and others also identified the slow rate of biogas production from WWTPs as an economic barrier in effectively utilizing WWTPs for energy generation [56]. The increased revenue seen at landfills equates to a higher average NPV and IRR, and lower payback periods ranging from 4.11 to 7.15 years. This is similar to payback periods ranging from three to nine years for LFG to electricity projects using various technologies calculated by Bove and Lunghi [57]. In the case of this study, the most financially feasible landfills for an RNG project are Ocean County Landfill and Monmouth County Reclamation Center, both with payback periods under 4.25 years (Table 5) and NPVs greater than USD 6 million (Table 7).
There are, however, exceptions to this generalization. Two of the landfills, Cape May County Municipal Utilities Authority and Cumberland County Solid Waste Complex have negative NPVs and IRRs below the hurdle rate of 13% (Table 7). This is because, while they produce more RNG than the average WWTP, they do not produce enough to overcome the high capital expenses. Additionally, there is one WWTP, Passaic Valley Sewerage Commission, that while it generally produces less RNG than a landfill, it produces enough RNG to overcome the lower capital expenses of a WWTP. Interestingly, WWTPs have a lower threshold of RNG to meet an estimated payback period of five years, approximately 362 MMSCFY of RNG compared to a landfill’s required threshold of approximately 666 MMSCFY (Figure 6). This is because of a higher methane content in WWTP biogas and lower capital expenses. Passaic Valley Sewerage Commission was the only WWTP in New Jersey to meet this threshold, but it is a prime example of why WWTPs should still be considered as possible RNG project locations in other states or regions. For example, three of New York City’s 14 WWTPs have design capacities of over 187 million gallons per day of wastewater flow, the approximate amount of wastewater flow needed to generate 362 MMSCFY of RNG [58].

4.2.2. Financial Incentives

Case studies from California have acknowledged the importance of financial incentives on the feasibility of RNG projects [7,8]. For instance, Hale Avenue Resource Recovery Facility (HARRF) is a wastewater treatment facility that generates enough RNG to heat approximately 1200 homes, very similar to the average of the WWTPs in this study which could heat 1227 homes [27]. In California, because of their existing incentives, this project is financially feasible while in New Jersey it is not. Similarly, the Vermont case study focused only on two RNG projects occurring in the state [32] while California has a greater number of RNG projects than any other state in the country [59]. The framing of RNG projects also differs in these states. Vermont Gas Supply is marketing RNG from an environmental standpoint, emphasizing a value of clean energy and the need to address climate change because utilizing RNG requires additional payments from the consumer [32]. California, on the other hand, does not have to so heavily rely on emphasizing environmental benefits over financial feasibility because of existing incentives. Ultimately, similar studies that use the RNG IDM Conceptual Model (Figure 1) may result in different conclusions simply because one project includes incentives available through the state and another does not have access to similar incentives in another state. To cover current estimated costs and meet return levels in New Jersey, the RNG must be sold at the retail rate of USD 0.9499 per Therm (Table 4). There is a USD 0.4832 incentive gap between the determined RNG rate and the conventional natural gas rate. This gap needs to be filled to make RNG competitive against natural gas in New Jersey.
Renewable energy credits are one of the main monetary incentives to increase financial feasibility of renewable energy. One example is the Low Carbon Fuel Standards (LCFS), a California incentive, which has a compliance level relative to CO2 emissions that vehicle fuels must stay under [60]. When the fuel source is beneath this compliance level, the fuel provider is given energy credits. When the fuel source is above this compliance level, the fuel provider must buy enough energy credits to offset their excess. On the federal level, the Renewable Fuel Standards (RFS) follow a similar path to the LCFS in California [33]. These programs are used for targeting transportation fuels, but RNG is a qualifying source for both. The RFS already covers heating oil, a non-transportation fuel. An argument can be made that RNG used for heating through pipeline injection could be added to the list of qualifying fuels. This would require proposing changes to the legislation and thus, is not an immediate option.
The credits that are given in the RFS are referred to as renewable identification numbers (RINs) as mentioned in the Section 2.4. If RINs were provided to RNG used for heating purposes, each Therm of RNG would bring in revenue from both the selling of the energy source and the selling of the RIN. The RINs would bring in a profit that could be used to subsidize the price of RNG. There are also potential alternatives to RINs. The New Jersey Biomass Works Group has suggested a tax credit in the past that would cover RNG for home heating [34], but the tax credit was never accepted. However, the presence of past proposals could prove that new legislation is desired. Additionally, new RNG projects can be financed using traditional financing solutions such as bonds. RNG is a green project and therefore qualifies for green bonds such as Clean Renewable Energy Bonds (CREBs) and Qualified Energy Conservation Bonds (QECBs) [61]. Moreover, one of the current qualifying tax incentives is the Modified Accelerated Cost-Recovery System (MACRS). MACRS is a federal tax incentive that helps to encourage new investments in order to stimulate the economy. It works through a bonus depreciation deduction up to 100% and is currently valid through January 2023. The financial models produced herein are calculated taking MACRS into consideration. While this financing aids in the feasibility of RNG projects, increased incentives are needed to increase the economic viability of RNG projects.

4.3. Environmental Impact

While RNG results in emission reductions because of where and how it is being sourced, the process to create RNG from biogas or LFG results in CO 2 emissions. The average landfill RNG project will produce 0.0270 MMT CO 2 /yr versus the average WWTP producing only 0.000611 MMT CO 2 /yr (Figure 6). Therefore, landfills will produce 44 times more CO 2 emissions than WWTPs. The reasons for this are twofold: landfills produce more RNG and so equipment is being utilized more, and LFG is a dirtier biogas and so requires more intense upgrading [35]. When considering CO 2   emissions released from the processing of biogas to RNG, WWTPs are the more desirable facility for RNG projects because they produce significantly less.
The GHG emissions produced during the upgrading process of RNG, however, are much smaller than the GHG emission reductions from using RNG rather than conventional natural gas for heating purposes. Additionally, because the viable landfills from this study produce more RNG, they also have the potential for greater reductions in emissions. The average landfill emission reductions from landfills examined in this study are approximately 0.428 MMT CO 2 e/yr while WWTPs studied would reduce emissions on average by 0.0431 MMT CO 2 e/yr. Because of higher potential emission reductions, landfills are the preferable facility for RNG projects in New Jersey from an environmental benefits perspective.

4.4. Logistical Considerations

Many of the landfills have current LFG to electricity projects and RNG production at these locations would not be as advantageous. Specifically, Burlington County landfill, Cumberland County Solid Waste Complex, and Middlesex County have current LFG to electricity projects that do not make them good candidates for RNG production (Figure 10). All three of these landfills have very similar emission reductions from existing projects and potential emission reductions from an RNG project. In the case of Cumberland County Solid Waste Complex and Middlesex County Landfill, the current emission reductions are higher than potential emission reductions. Though this does not seem possible, it is because potential reductions were calculated assuming all available LFG was used, while the current emission reductions were calculated using the megawatt (MW) capacity of the existing project. This was done based on the availability of the data from the US EPA LMOP database. The equations from the two different methods may produce slightly different results because of small differences in methodology or varying assumptions. It is also possible that the rated MW capacity of the projects are not fully generated [62].
While there are landfills that are not ideal candidates for RNG projects because of their existing LFG to electricity projects, Monmouth County Reclamation Center has no current projects and so is an attractive location for an RNG project based on this criterion. Additionally, Ocean County Landfill could see increased emission reductions by ending their current project and starting an RNG project. Their existing project began in 2007 and may be at the end of its lifecycle in the coming years [52].
Another logistical consideration is the proximity to the existing natural gas pipelines. Close proximity to existing pipeline was not a necessary requirement for the facilities considered in this study because of an expressed willingness by the New Jersey Board of Public Utilities to aid with this construction [46]. Timmerberg and Kaltschmitt, however, limited their research on the costs and potentials for hydrogen injection into the pipeline to only those locations that lie within 2° of existing pipeline [13]. In New Jersey, five of the seven viable landfills are not in close proximity to the pipelines while 18 of the 22 WWTPs are in close proximity (Figure 8). Landfills would be considered much less feasible if the costs for connection to pipelines had to be included in our financial analysis. Projects outside of New Jersey should pay special attention to the location of natural gas pipelines as it could have a large impact on the logistical feasibility of an RNG project.

4.5. Renewable Natural Gas Project Recommendations

When considering the RNG IDM conceptual model in Figure 1 and RNG project aspects in Table 8, landfills generally result in higher production of RNG, higher project revenue generation, lower payback periods along with higher NPV and IRR, and higher total potential emission reductions. WWTPs have lower capital and operating costs and thus a lower threshold to meet a five-year payback period, produce lower CO 2 emissions from RNG production, and are closer in proximity to existing natural gas pipelines. When looking at individual sites, Monmouth County Reclamation Center has a strong feasibility for an RNG project because it falls into the general patterns seen in landfills and also has no existing projects on site. Additionally, Ocean County Landfill experiences all of the general patterns seen in landfills, and has the most attractive financial outputs of any landfill. Passaic Valley Sewerage Commission is the outlier in that it is a WWTP that has the benefits seen in WWTPs such as proximity to pipelines but also shows traits normally seen in landfills of producing high amounts of RNG and having a payback period under five years. It is important to acknowledge the general trends seen in this study in which landfills are more economically feasible and produce more environmental benefits than WWTPs, which was also found to be the case by Parker et al. for renewable natural gas projects in California [7]. However, because of outliers such as Passaic Valley, it is also necessary to examine individual facilities using the RNG IDM conceptual model when considering the feasibility of an RNG project.

4.6. Decision Making

While several of the components in the ‘Decision Making’ aspect of the RNG IDM conceptual model (Figure 1) were not investigated in this paper, it is important to consider them when discussing an RNG project. Specifically, as mentioned in the case studies, states have set targets for the percentage of energy that must come from renewable sources. RNG projects could aid in reaching these goals, especially as states look to increase them in the coming decades [63]. Additionally, there is a growing need to diversify our energy portfolio for both security reasons and resiliency in the energy system [64]. RNG projects would contribute to both of these needs by localizing the energy source and better utilizing existing and growing waste streams.

5. Conclusions

Using the RNG IDM conceptual model, the feasibility of RNG projects at landfills and wastewater treatment plants (WWTPs) in New Jersey was studied. The main components of the conceptual model considered in this paper were viable sites for RNG projects, RNG production, project expenses, project revenue generation, financial analysis such as net present value (NPV) and payback period, financial incentives, carbon dioxide emissions produced from RNG production, greenhouse gas emission reductions from the use of RNG rather than conventional natural gas, proximity to existing natural gas pipelines, and existing projects involving landfill gas (LFG) to electricity.
Seven landfills and 22 WWTPs were determined to be viable sites for RNG projects in New Jersey. Landfills performed better in the following categories of the model: RNG production, project revenue generation, financial analysis including higher NPV and lower payback periods, and greenhouse gas emission reductions. Conversely, WWTPs performed better in the following: project expenses, carbon dioxide emissions produced form RNG production, and proximity to existing natural gas pipelines. Further analysis of these project aspects, as well as consideration of existing LFG to electricity projects at landfills showed that Monmouth County Reclamation Center and Ocean County Landfill are prime locations for RNG projects in New Jersey because of their high NPVs of USD 6.2 million and USD 7.6 million, respectively, and high potential for greenhouse gas emission reductions, 0.6522 million metric tons of carbon dioxide equivalents per year (MMT CO 2 e/yr) and 0.6781 MMT CO 2 e/yr. While landfills usually garnered higher RNG production and better financial outcomes, Passaic Valley Sewerage Commission WWTP was an exception to this. It was the only one of the 22 viable WWTPs to achieve the RNG threshold for meeting an estimated five-year payback period. Interestingly, this threshold is only 362 million standard cubic feet per year (MMSCFY) of RNG for WWTPs compared to 666 MMSCFY of RNG for landfills. This is because of higher methane content in WWTP biogas and thus lower project expenses.
The conclusions drawn from using the conceptual model to consider RNG projects in New Jersey also highlighted the need for greater financial incentives both in New Jersey and around the country. Greater incentives at the federal level such as the Renewable Fuel Standards expanding to include RNG as a heating fuel on top of a vehicle fuel and the state level opening incentives available to other renewable energy sources to RNG production would make projects at both landfills, WWTPs, and other RNG sources more financially feasible.
Because of the growing need to find a renewable replacement for conventional natural gas and the environmental degradation caused by our reliance on fossil fuels, renewable natural gas projects are the logical next step in building up our renewable energy portfolio. Additionally, localizing the sourcing of the state’s natural gas and diversifying that state’s energy portfolio with more renewable energy means more energy security as well as increased jobs and investments in the local economy [65,66].
RNG in the United States, and in New Jersey, has the potential to be a reliable energy source for the future, contributing to greenhouse gas emission reductions, increased landfill and WWTP revenues, prominent incentive opportunities, job creation, and a sustainable gas delivery process moving forward. Because of this, further study in this area is recommended, as it will contribute to the field of sustainability and improved financial practices on renewable energy sources. This study helps to validate the use of our Renewable Natural Gas (RNG) Implementation Decision-Making Conceptual Model to determine the feasibility of RNG projects through the case study of landfills and WWTP in New Jersey. Renewable natural gas projects, utilizing the waste we produce and will continue to produce, are the next step in reaching our renewable energy goals.

Author Contributions

Conceptualization, A.D., A.C.M. and A.R.T.; methodology, A.D., A.C.M. and B.C.; formal analysis, A.D., A.C.M. and B.C.; investigation, A.D, A.C.M., B.C., J.G.M., C.T. and J.B.; data curation, A.D. and A.C.M.; writing—original draft preparation, A.D., B.C., J.G.M., C.T., J.B. and V.O.; writing—review and editing, A.D., A.C.M. and A.R.T.; visualization, A.D. and A.C.M.; software, A.C.M.; supervision, A.C.M., V.O. and A.R.T.; project administration, A.D. and V.O.; funding acquisition, A.R.T.; resources, A.R.T., validation, A.R.T. All authors have read and agreed to the published version of the manuscript.

Funding

This research was funded by a grant to Montclair State University from the Conserve to Preserve Foundation at New Jersey Natural Gas. The APC also was funded by a grant to Montclair State University from the Conserve to Preserve Foundation at New Jersey Natural Gas.

Institutional Review Board Statement

Not applicable.

Informed Consent Statement

Not applicable.

Data Availability Statement

Publicly available datasets were analyzed in this study. They can be found here: https://www.epa.gov/lmop/lmop-landfill-and-project-database#comp, https://www.nj.gov/dep/dwq/pdf/sludgeproductiondata2018.pdf.

Acknowledgments

The authors would like to thank the New Jersey Natural Gas company representatives: Katherine Feery, Chris Micak, Mark Kahrer, and Jayana Shah. The authors would also like to extend their gratitude to Dave Mauney IV from The Hunter Group LLC, as well as Tom Murray from Vermont Gas Systems. The authors also thank the following team members of PSEG Institute for Sustainability Studies for their cooperation and resourcefulness with this report: Julia Flores, Graphic Design Specialist; Ariana Leyton, Project Manager; Nicholas Araya, Assistant Project Manager.

Conflicts of Interest

The authors declare no conflict of interest. The funders had no role in the design of the study; in the collection, analyses, or interpretation of data; in the writing of the manuscript, or in the decision to publish the results.

References

  1. BP Global. BP Statistical Review of World Energy, 68th ed.; BP PLC: London, UK, 2019. [Google Scholar]
  2. How Much Natural Gas Does the United States Have, and How Long Will It Last? American Geosciences Institute. Available online: www.americangeosciences.org/critical-issues/faq/how-much-natural-gas-does-united-states-have-and-how-long-will-it-last (accessed on 18 July 2019).
  3. Adnan, A.I.; Ong, M.Y.; Nomanbhay, S.; Chew, K.W.; Show, P.L. Technologies for Biogas Upgrading to Biomethane: A Review. Bioengineering 2019, 6, 92. [Google Scholar] [CrossRef] [PubMed] [Green Version]
  4. Greenhouse Gas Equivalencies Calculator. Available online: https://www.epa.gov/energy/greenhouse-gas-equivalencies-calculator (accessed on 15 July 2019).
  5. Danthurebandara, M.; Van Passel, S.; Nelen, D.; Tielemans, Y.; Van Acker, K. Environmental and Socio-Economic Impacts of Landfills. Available online: https://www.researchgate.net/publication/278738702_Environmental_and_socio-economic_impacts_of_landfills (accessed on 20 July 2019).
  6. Liang, Y.; Tan, Q.; Song, Q.; Li, J. An Analysis of the plastic waste trade and management in Asia. Waste Manag. 2021, 119, 242–253. [Google Scholar] [CrossRef] [PubMed]
  7. Parker, N.; Williams, R.; Dominguez-Faus, R.; Scheitrum, D. Renewable natural gas in California: An assessment of the technical and economic potential. Energy Policy 2017, 111, 235–245. [Google Scholar] [CrossRef]
  8. Jaffe, A.M.; Dominguez-Faus, R.; Parker, N.C.; Scheitrum, D.; Wilcock, J.; Miller, M. The Feasibility of Renewable Natural Gas as a Large-Scale, Low Carbon Substitute; UC Davis: Davis, CA, USA, 2019. [Google Scholar]
  9. Gasper, R.; Searchinger, T. The Production of Renewable Natural Gas as a Climate Strategy in the United States; World Resources Institute: Washington, DC, USA, 2018. [Google Scholar]
  10. Winslow, K.M.; Laux, S.J.; Townsend, T.G. An economic and environmental assessment on landfill gas to vehicle fuel conversion for waste hauling operations. Resour. Conserv. Recycl. 2019, 142, 155–166. [Google Scholar] [CrossRef]
  11. Themelis, N.J.; Ulloa, P.A. Methane generation in landfills. Renew. Energy 2007, 32, 1243–1257. [Google Scholar] [CrossRef]
  12. EPA. LFG Energy Project Development Handbook; LMOP: Washington, DC, USA, 2020. [Google Scholar]
  13. Timmerberg, S.; Kaltshmitt, M. Hydrogen from renewables: Supply from North Africa to Central Europe as blend in existing pipelines—Potentials and costs. Appl. Energy 2019, 237, 795–809. [Google Scholar] [CrossRef]
  14. Thamsiriroj, T.; Smyth, H.; Murphy, J.D. A roadmap for the introduction of gaseous transport fuel: A case study for renewable natural gas in Ireland. Renew. Sustain. Energy Rev. 2011, 15, 4642–4651. [Google Scholar] [CrossRef]
  15. Ayodele, T.R.; Ogunjuyigbe, A.S.O.; Alao, M.A. Economic and environmental assessment of electricity generation using biogas from organic fraction of municipal solid waste for the city of Ibadan, Nigeria. J. Clean. Prod. 2018, 203, 718–735. [Google Scholar] [CrossRef]
  16. Sims, R.E.H. Renewable energy: A response to climate change. Sol. Energy 2004, 76, 9–17. [Google Scholar] [CrossRef]
  17. Kretschmer, F.; Neugebauer, G.; Stoeglehner, G.; Ertl, T. Participation as a Key Aspect for Establishing Wastewater as a Source of Renewable Energy. Energies 2018, 11, 3232. [Google Scholar] [CrossRef] [Green Version]
  18. Feofilovs, M.; Gravelsins, A.; Pagano, A.J.; Romagnoli, F. Increasing resilience of the natural gas system with implementation of renewable methane in the context of Latvia: A system dynamics model. Energy Procedia 2019, 158, 3944–3950. [Google Scholar] [CrossRef]
  19. U.S. Energy Information Administration. EIA—Independent Statistics and Analysis. Available online: https://www.eia.gov/opendata/qb.php?sdid=NG.NA1490_SNJ_2.A (accessed on 17 July 2019).
  20. Renewable Natural Gas (Biomethane) Production. Available online: https://afdc.energy.gov/fuels/natural_gas_renewable.html (accessed on 24 July 2019).
  21. EPA. National Overview: Facts and Figures on Materials, Wastes and Recycling. Available online: https://www.epa.gov/facts-and-figures-about-materials-waste-and-recycling/national-overview-facts-and-figures-materials (accessed on 17 January 2021).
  22. Mauney, D. Conference Call Between Mr. Mauney and NJNG-RNG Team; PSEG Institute for Sustainability Studies: Montclair, NJ, USA, 11 July 2019. [Google Scholar]
  23. Biogas Applications. Available online: http://www.methania.com/biogas-applications/ (accessed on 26 July 2019).
  24. EPA. An Overview of Renewable Natural Gas from Biogas; 456-R-20-001; EPA: Washington, DC, USA, 2020. [Google Scholar]
  25. Mauney, D. Renewable Natural Gas as an Infinite Source; PSEG Institute for Sustainability Studies: Montclair, NJ, USA, 2019. [Google Scholar]
  26. Mazanec, F. Turning Waste Into Renewable Natural Gas Point Loma Wastewater Treatment Plant Case Study Five Years after Commercial Operation; BioFuels Energy LLC: Encinitas, CA, USA, 2016. [Google Scholar]
  27. Lucas, J. Renewable Natural Gas and Interconnecting to the SoCalGas Pipeline; SoCalGas: Los Angeles, CA, USA, 2017. [Google Scholar]
  28. City of Escondido Invests in Clean Energy Generation with SGIP Incentive. Available online: https://energycenter.org/thought-leadership/news/city-escondido-invests-clean-energy-generation-sgip-incentive (accessed on 20 July 2019).
  29. Biomethane Monetary Incentive Program: SoCalGas. Available online: https://www3.socalgas.com/smart-energy/renewable-gas/biomethane-monetary-incentive-program (accessed on 12 July 2019).
  30. Renewable Portfolio Standard. Available online: http://www.rngcoalition.com/policies-legislation-1-1 (accessed on 9 July 2019).
  31. DEP. Renewable Portfolio Standard. Available online: https://www.state.nj.us/dep/aqes/opea-renewable-portfolio.html (accessed on 9 July 2019).
  32. VGS RNG Program Manual. Available online: www.vermontgas.com/wp-content/uploads/2018/09/VGS-RNG-Manual-Final-V-1.01.pdf (accessed on 16 July 2019).
  33. EPA. Overview for Renewable Fuel Standard. Available online: https://www.epa.gov/renewable-fuel-standard-program/overview-renewable-fuel-standard (accessed on 22 July 2019).
  34. Biomass Work Group. Biomass Resources for Producing Renewable Power and Fuels in the State of New Jersey and Incentives to Promote Their Development; NJBPU: Trenton, NJ, USA, 2011. [Google Scholar]
  35. Nwaokorie, K.J.; Bareither, C.A.; Mantell, S.C.; Leclaire, D.J. The influence of moisture enhancement on landfill gas generation in a full-scale landfill. Waste Manag. 2018, 79, 647–657. [Google Scholar] [CrossRef] [PubMed]
  36. Landfill Methane Outreach Program (LMOP). Available online: https://www.epa.gov/lmop (accessed on 18 July 2019).
  37. Bachmann, N.; Bochmann, G.; Montpart, N. Sustainable Biogas Production in Municipal Wastewater Treatment Plants. Available online: http://www.iea-biogas.net/files/daten-redaktion/download/Technical%20Brochures/Wastewater_biogas_grey_web-1.pdf (accessed on 15 July 2019).
  38. DEP. Sewage Sludge Production by Management Mode—2018. Available online: https://www.nj.gov/dep/dwq/pdf/sludgeproductiondata2018.pdf (accessed on 8 January 2021).
  39. EPA. Combined Heat and Power Partnership. In Opportunities for Combined Heat and Power at Wastewater Treatment Facilities: Market Analysis and Lessons from the Field; EPA: Washington, DC, USA, 2011. [Google Scholar]
  40. Basic Information About Landfill Gas. Available online: https://www.epa.gov/lmop/basic-information-about-landfill-gas (accessed on 8 January 2021).
  41. EPA. User’s Manual. Available online: https://www.epa.gov/sites/production/files/2017-05/documents/lfgcost_webv3.2manual_052617.pdf (accessed on 8 January 2021).
  42. EPA. Miscellaneous Data and Conversion Factors. Available online: https://www3.epa.gov/ttn/chief/ap42/appendix/appa.pdf (accessed on 8 January 2021).
  43. R Core Team. R: A Language and Environment for Statistical Computing. Available online: https://www.R-project.org/ (accessed on 8 January 2021).
  44. EPA. Landfill Gas Energy Benefits Calculator. Available online: https://www.epa.gov/lmop/landfill-gas-energy-benefits-calculator (accessed on 8 January 2021).
  45. Raju, A.; Wallerstein, B.; Vu, A. Optimal Pathways to Achieve Climate Goals—Inclusion of a Renewable Gas Standard. Available online: https://www.cert.ucr.edu/sites/g/files/rcwecm1251/files/2019-01/Optimal_Pathways_Report.pdf (accessed on 23 July 2019).
  46. Kahrer, M. Regulatory Affairs of Natural Gas Utilities. Presented at the NJNG RNG Meeting, Wall, NJ, USA, 9 July 2019. [Google Scholar]
  47. Kahrer, M. NJNG Tariff—BPU No. 9 Gas. Available online: https://www.njng.com/regulatory/pdf/Tariff%208-1-19.pdf (accessed on 1 July 2019).
  48. 101 for RINs. Available online: https://www.biocycle.net/101-for-rins/ (accessed on 8 January 2021).
  49. RIN Trades and Price Information. Available online: https://www.epa.gov/fuels-registration-reporting-and-compliance-help/rin-trades-and-price-information (accessed on 8 January 2021).
  50. Microsoft Excel. Available online: https://office.microsoft.com/excel (accessed on 7 July 2019).
  51. ArcGIS Natural Gas Interstate and Intrastate Pipelines. Available online: https://www.rcgis.com/home/webmap/viewer.html?webmap=cc3813401e0849c193213d5793959dc7 (accessed on 5 July 2019).
  52. EPA. Project and Landfill Data by State. Available online: https://www.epa.gov/lmop/project-and-landfill-data-state (accessed on 8 January 2021).
  53. Nunez, F.; Pavley, F. Conversion of 1 MMT CO2 to Familiar Equivalents. Available online: https://ww3.arb.ca.gov/cc/factsheets/1mmtconversion.pdf (accessed on 22 July 2019).
  54. Venkatesan, A.K.; Done, H.Y.; Halden, R.U. United States National Sewage Sludge Repository at Arizona State University—A new resource and research tool for environmental scientists, engineers, and epidemiologists. Environ. Sci. Pollut. Res. Int. 2015, 22, 1577–1586. [Google Scholar] [CrossRef] [PubMed] [Green Version]
  55. Ranieri, L.; Mossa, G.; Pellegrino, R.; Digiesi, S. Energy Recovery from the Organic Fraction of Municipal Solid Waste: A Real Options-Based Facility Assessment. Sustainability 2018, 10, 368. [Google Scholar] [CrossRef] [Green Version]
  56. Shen, Y.; Linville, J.L.; Urgun-Demirtas, M.; Mintz, M.; Snyder, S.W. An overview of biogas production and utilization at full-scale wastewater treatment plants (WWTPs) in the United States: Challenges and opportunities towards energy-neutral WWTPs. Renew. Sustain. Energy Rev. 2015, 50, 346–362. [Google Scholar] [CrossRef] [Green Version]
  57. Bove, R.; Lunghi, P. Electric power generation from landfill gas using traditional and innovative technologies. Energy Convers. Manag. 2006, 47, 1391–1401. [Google Scholar] [CrossRef]
  58. DEP. Wastewater Treatment Plants 26th Ward. Available online: https://www1.nyc.gov/site/dep/water/wastewater-treatment-plants.page (accessed on 19 January 2021).
  59. EPA. Renewable Natural Gas. Available online: https://www.epa.gov/lmop/renewable-natural-gas#rngmap (accessed on 9 January 2021).
  60. SRECTrade, Inc. California Low Carbon Fuel Standard (LCFS) Market Overview and Pricing. Available online: https://www.srectrade.com/blog/srec-markets/california/california-low-carbon-fuel-standard-lcfs-market-overview-and-pricing (accessed on 1 July 2019).
  61. Tax Incentives for Issuers and Investors. Available online: https://www.climatebonds.net/policy/policy-areas/tax-incentives (accessed on 1 July 2019).
  62. Alvis, J.; EPA, Washington, DC, USA. Personal Communication, 2021.
  63. Peretzman, P.; Fiordaliso, J.; Holden, M.A.; Solomon, D.; Chivukula, U.; Gordon, B. New Jersey Energy Master Plan. Available online: https://nj.gov/emp/docs/pdf/2020_NJBPU_EMP.pdf (accessed on 22 June 2019).
  64. Roege, P.E.; Collier, Z.A.; Mancillas, J.; McDonagh, J.A.; Linkov, I. Metrics for energy resilience. Energy Policy 2014, 72, 249–256. [Google Scholar] [CrossRef]
  65. Li, X. Diversification and localization of energy systems for sustainable development and energy security. Energy Policy 2005, 33, 2237–2243. [Google Scholar] [CrossRef]
  66. Bulavskaya, T.; Reynès, F. Job creation and economic impact of renewable energy in the Netherlands. Renew. Energy 2018, 119, 528–538. [Google Scholar] [CrossRef] [Green Version]
Figure 1. Renewable Natural Gas Implementation Decision-Making Conceptual Model. A framework of renewable natural gas projects and the considerations that impact the feasibility of the project.
Sustainability 13 01618 g001
Figure 2. Renewable Natural Gas (RNG) Production Process.
Sustainability 13 01618 g002
Figure 3. Biogas Upgrading Process Schematic, created by authors with assistance from David Mauney of the Hunter Group LLC [22].
Sustainability 13 01618 g003
Figure 4. Average (±SE) Renewable Natural Gas Production in million standard cubic feet per year (MMSCFY) for wastewater treatment plants (WWTP) and landfills (n for WWTPs = 22, n for landfills = 7).
Sustainability 13 01618 g004
Figure 5. Total homes theoretically heated per year by renewable energy projects at all viable landfills and wastewater treatment plants (WWTP) assuming all available landfill gas or biogas is used. Assumes average household use of 57,800 standard cubic feet per year of natural gas for heating (n for WWTPs = 22, n for landfills = 7).
Sustainability 13 01618 g005
Figure 6. Average (±SE) CO 2 produced through renewable natural gas production at landfills and wastewater treatment plants (WWTP) in metric tons CO 2 (MT CO 2 ) (n for WWTPs = 22, n for landfills = 7).
Sustainability 13 01618 g006
Figure 7. Renewable natural gas production in million standard cubic feet per year (MMSCFY) and payback period (years) for the seven viable landfills (green) and the 22 viable wastewater treatment plants (blue). Equations of trend lines, including forecasting beyond data included. Black dotted lines at y = 5 and y = 10 are present to help represent commonly accepted payback periods.
Sustainability 13 01618 g007
Figure 8. Landfills (green) and wastewater treatment plants (blue) with Natural Gas Interstate and Intrastate pipelines. Size of dots indicates renewable natural gas potential production.
Sustainability 13 01618 g008
Figure 9. Total Landfill Current Emission Reductions from existing landfill gas to electricity projects versus Potential Emission Reductions from renewable natural gas projects in million metric tons of CO 2 equivalents per year.
Sustainability 13 01618 g009
Figure 10. Landfill Current Emission Reductions from existing landfill gas to electricity projects versus Potential Emission Reductions from renewable natural gas projects in million metric tons of CO 2 equivalents per year at each viable landfill.
Sustainability 13 01618 g010
Table 1. Landfill specifications from Landfill Methane Outreach Program Database [36].
Landfill OwnershipCityLandfill Closure DateWaste in Place (Tons)LFG Flowrate (SCFM)
Atlantic County Utilities Authority PublicEgg Harbor Township20266,300,9552631.3
Burlington County PublicBordentown20279,539,4903034.7
Cape May County Municipal Utilities AuthorityPublicWoodbine20944,000,0001100.0
Cumberland County Solid Waste ComplexPublicMillville20415,976,7661666.7
Middlesex County PublicEast Brunswick203014,497,2273611.1
Monmouth County Reclamation CenterPublicTinton Falls202019,179,2944513.9
Ocean County PrivateManchester202518,692,1204895.8
Table 2. Landfill Gas and Renewable Natural Gas Production in million standard cubic feet per year (MMSCFY).
LandfillLandfill Gas Collected (MMSCFY)Renewable Natural Gas Produced (MMSCFY)
Atlantic County Utilities Authority1383599.8
Burlington County1595691.8
Cape May County Municipal Utilities Authority578250.8
Cumberland County Solid Waste Complex876379.9
Middlesex County1898823.2
Monmouth County Reclamation Center23731028.0
Ocean County25731116.1
Average1611698.6
Table 3. Wastewater Treatment Plant (WWTP) Biogas and Renewable Natural Gas Production in Million standard cubic feet per year (MMSCFY) for top seven WWTPs and the average for all 22.
Wastewater Treatment PlantBiogas Collected (MMSCFY)Renewable Natural Gas Produced (MMSCFY)
Atlantic County Utilities Authority9853.8
Bergin County Utilities Authority264144.0
Camden County Municipal Utilities Authority192104.7
Joint Meeting of Essex & Union Co.224122.6
Middlesex County Utilities Authority435237.6
Passaic Valley Sewerage Commission851465.0
Rahway Valley Sewerage Authority10155.4
Average (All 22 WWTPs)13070.9
Table 4. Landfill Retail Rate determined from an Internal Rate of Return hurdle rate of 13%.
LandfillRequired Retail Rate per Therm ($)
Atlantic County Utilities Authority0.9475
Burlington County0.9140
Cape May County Municipal Utilities Authority1.2126
Cumberland County Solid Waste Complex1.0761
Middlesex County0.8710
Monmouth County Reclamation Center0.8217
Ocean County0.8063
Average0.9499
Table 5. Landfill Financial Table. Table 5 summarizes the financial aspects of viable landfills in New Jersey for renewable natural gas projects.
LandfillCapital Expenses (USD)Potential Annual Revenue (USD/yr)Annual Operating Expenses (USD/yr)Annual Profit Margin (USD/yr)Payback Period (Years)
Atlantic County Utilities Authority21,395,6635,697,6941,563,8794,133,8145.18
Burlington County23,407,6896,571,3701,803,6834,767,6874.91
Cape May County Municipal Utilities12,350,9682,381,934653,7831,728,1507.15
Cumberland County Solid Waste Complex16,046,7963,608,990990,5812,618,4106.13
Middlesex County26,117,8457,819,4792,146,2585,673,2214.60
Monmouth County Reclamation Center30,060,1169,774,3492,682,8237,091,5264.24
Ocean County31,638,39010,601,4092,909,8317,691,5784.11
Average23,002,4956,636,4611,821,4584,814,9125.19
Table 6. Wastewater Treatment Plant Financial Table. Table 6 summarizes the financial aspects of the top seven out of 22 viable WWTPs in New Jersey using the method applied for landfills and includes the average financial aspects of all 22 WWTPs.
Wastewater Treatment PlantCapital Expenses (USD)Potential Annual Revenue (USD/yr)Annual Operating Expenses (USD/yr)Annual Profit Margin (USD/yr)Payback Period (Years)
Atlantic County Utilities Authority 4,047,510510,778111,267399,51110.13
Burlington County Utilities Authority7,529,1931,368,061298,0161,070,0467.04
Camden County Municipal Utilities Authority6,159,736994,752216,695778,0577.92
Joint Meeting of Essex & Union Co.6,801,1321,164,123253,590910,5337.47
Middlesex County Utilities Authority 10,320,8252,256,898491,6381,765,2605.85
Passaic Valley Sewerage Commission15,755,5744,417,034962,1983,454,8364.56
Rahway Valley Sewerage Authority 4,125,817526,552114,703411,84910.02
Average (All 22 WWTPs)4,178,209673,747146,768526,97911.78
Table 7. Landfill Internal Rate of Return (%) and Net Present Value (USD).
LandfillInternal Rate of Return (%)Net Present Value (USD)
Atlantic County Utilities Authority13.0763,481
Burlington County 14.181,231,442
Cape May County Municipal Utilities Authority6.82−3,083,170
Cumberland County Solid Waste Complex9.70−2,236,996
Middlesex County 15.583,049,824
Monmouth County Reclamation Center17.466,174,087
Ocean County 18.167,577,694
Table 8. Source of renewable natural gas (RNG) that has the strongest outcomes for performance indicators in various aspects of RNG projects.
LandfillsWastewater Treatment Plants
RNG ProductionX
CO 2 Emissions from RNG Production X
Project Expenses X
Project RevenuesX
NPV/IRR/Payback Periods X
RNG Threshold to meet 5 year payback period X
Proximity to Existing Natural Gas Pipelines X
Total potential CO 2 e Emission ReductionsX
Publisher’s Note: MDPI stays neutral with regard to jurisdictional claims in published maps and institutional affiliations.

