Abstract
(1) Background: Show caves are unique natural attractions and touristic traffic can trigger their degradation within a short time. There are no universal solutions to counter the effects of the touristic impact upon the cave environment and both protection protocols and management plans have to be established on a case-by-case basis. (2) Methods: The study includes four show caves from the Romanian Carpathians, where monitoring of the number of visitors, paralleled by the monitoring of the main physicochemical parameters of the air and water (CO2, temperature, humidity, drip rate, conductivity, and pH) was implemented. (3) Results and Conclusions: The results of the study have: established a set of basic principles to be enforced by the management of show caves and issued a set of preventive measures and instructions to be followed by the personnel and stakeholders of the caves.
1. Introduction
Karst regions are spectacular but sensitive environments present in many regions of the world. With only a few exceptions, they are included within natural protected areas as they preserve biodiversity and valuable groundwater resources. At the same time, they are extremely vulnerable to human impact because aquifers are highly transmissive and prone to rapid pollutant transfer. Air pollution would reach karst underground by means of rainfall and percolating water or as aerosols [1]. Direct water pollution would reach karst springs after short transit times and with almost no filtration. Either way, both subterranean biodiversity and public health may be affected. In regions where karst landscape (surface and underground) is valued as a touristic asset, even minute pollutions may spoil its value and require costly remediation measures.
Caves are also recognized as valuable “natural laboratories”, which preserve climate archives such as speleothems (calcite formations such as stalactites, stalagmites, etc.), sediments, fauna with peculiar adaptations, and fossil remains. All of them are relevant for the reconstruction of past climate and past surface environments, but speleothems have the advantage of being able to record climate changes at remarkably high resolution—from centennial to annual. In the last 20 years, they became invaluable tools that help climate scientists to assess past climate changes and possibly forecast future ones [2].
In karst regions, caves are natural attractions that bring millions of visitors every year. The main assets that would transform a wild cave into a touristic attraction are related to: (i) cave formations (speleothems); (ii) cave fauna, either current fauna, such as bats colonies and cave adapted invertebrates (troglobionts), and other vertebrates or fossil fauna (e.g., remains of cave bears or other large mammals); (iii) past human activity such as prehistoric paintings, drawings, engravings, or burial sites. In many cases, successful touristic caves present a combination of these attractions and 128 natural caves are listed on the UNESCO World Heritage List [3]. However, opening a cave as a public attraction implies the disturbance of the natural habitat by construction of infrastructure elements such as walking trails and lighting systems and by the very presence of large numbers of visitors in a formerly pristine environment. The development of a wild cave into a show cave is especially complicated by the fact that each cave has its own climate, which depends both on its geographical location and internal morphology.
The aesthetic and scientific values of caves are preserved in the subterranean environment especially because of the remarkable constancy of the cave microclimate. Even minute changes of this microclimate may trigger irreversible effects that may destroy the attractions of a given show cave. It has been shown that uncontrolled visitor traffic may lead to degradation of cave paintings or drawings. The Paleolithic paintings of the UNESCO sites of Altamira (Spain) and Lascaux (France) have had to be closed due to rapid degradation of the paintings caused by biodegradation induced by aerosolization of the fine particles from the floor, including bacterial and fungal spores [4]. The recent discovery of old drawings in the Coliboaia cave (cca. 35,000 years BP; Western Carpathians, [5]) calls for a robust protocol of cave-monitoring even before the start of any research campaign.
In many caves, where the main attraction is represented by speleothems, these calcite formations have lost their aesthetic value following a decrease in air relative humidity (RH), and an increase in temperature and partial CO2 pressure in the cave’s air because of touristic activity [6,7]. In other show caves, the distribution and density of cave animals was affected—the most visible effect being recorded on the populations of bats [8]. In the United States, the fungal infection of bats with Geomyces destructans was first documented in 2006 in a commercial cave from the state of New York and has spread rapidly to more than 100 caves in North America leading to the near extinction of several bat species and immeasurable consequences on agriculture [9].
One of the best documented effect of touristic activity in show caves is the appearance of the so-called “lampenflora” (i.e., communities of microbes, algae, ferns, mosses) that develop on cave walls or speleothems in the proximity of light sources [10]. The lampenflora has proven to be difficult to eliminate and the simple installation of LED lamps was proven to be insufficient to stop its development [11].
In theory, the environment of a cave should have only a negligible contact with the external environment. Heaton [12] has reviewed the concept of energy levels and applied it to caves. Accordingly, he classified the caves into three categories of high, moderate, and low energy, respectively. The high-energy caves are those that experience important inputs of energy on a regular basis, such as periodic flooding or seasonal climatic events. Moderate-energy caves would normally undergo regular changes about one order of magnitude lower than the high-energy caves (e.g., caves with permanent streams or air current). Low-energy caves are those where the microclimate is extremely stable and often the highest energy event may be related to something as trivial as the falling of a single water drop [12]. When show caves are fit into the moderate- and low- energy categories, the energetic equilibrium can be very easily unbalanced especially in the deep areas of the caves, where the stable climate can be easily disturbed.
The effect of the visitors in caves on biodiversity was also documented [13]. The deep sections of the caves host a troglobitic fauna, which is highly specialized and highly dependent on even small changes of the microclimatic parameters. Bats colonies were sometimes shown to be disturbed by touristic traffic in show caves [8]. In short, the touristic traffic in a cave should be kept to a level that would allow both the preservation of troglobitic invertebrates and (if any) of bats colonies, without forcing the later to move to new places where they could cause damage to speleothems, caused by guano.
In addition to the above, there is a large body of evidence that the lint (hair, dry-flaking skin, dust, spores) carried on by a cave’s visitors may deteriorate speleothems and create a favorable medium for the development of fungi and algae onto speleothems and fossil remains. Such effects are well known from many touristic caves where originally white speleothems are now covered by a dark layer or where fossil vertebrate remains (e.g., Ursus spelaeus bones) are covered by lampenflora (for example in Urșilor Cave, Chișcău, Romania) [14]. In the Lascaux Cave, attempts to remove the green alga Bracteacoccus minor by using biocides proved to be inefficient since they resulted in a selection of Gram-negative bacterial species adapted to the respective biocide [4]. A synthesis of potential touristic-induced threats to a deep-cave environment is presented in Table 1.

Table 1.
Principal threats for the environment of show caves, their possible causes and effects (modified after [15]).
Throughout the world, at least some of these problems are recognized and sometimes carefully dealt with [16,17,18,19,20,21,22,23,24,25]. Monitoring programs have been enforced for both old show caves [6] and newly discovered caves [26]. The role of microorganisms was recognized not only as a modifying agent for cave biota (e.g., by supporting formation of lampenflora) but also as a triggering agent for speleothem deposition [27].
Besides the conservation issues, the development of a show cave also requires an assessment of the radiological hazards to visitors and cave personnel. The main hazard concerns the potential accumulation of radon, as this gas is known to be one of the causes for lung cancer and bronchial tissue damage and underground cavities are especially prone to radon accumulation [28,29,30]. Radon levels in caves depend on different internal and external factors such as outside–inside temperature differences, wind velocity, variations in atmospheric pressure and humidity, local geomorphology, etc. Numerous studies [31,32,33,34,35] have shown that radon concentration in show caves do not pose a health problem for the visitors, during their short visit, but they may be of concern for professional workers such as the cave guides or cave researchers, due to accumulation rates in time. Depending on specific microclimate of a cave or cave sector, emissions of radon and its short-lived progeny may be higher than the EU-established reference level of 1000 Bq/m3. In the case of most show caves, ensuring an artificial ventilation system is not an option, as any disturbance of the natural microclimate would rapidly compromise the cave assets. It is, therefore, of outmost importance to: (i) preserve caves’ natural environment while (ii) monitoring radon levels on a regular basis to assess the risks for visitors and professionals involved.
In Romania, before 2010, only nine caves were developed for tourism and most of them had only rudimentary touristic fittings such as electric light based on incandescent bulbs, rudimentary tourist trails and infrastructure, poor guidance, and even prolonged periods when caves were virtually abandoned by administrators and subjected to uncontrolled tourism that resulted in vandalism. To date, there are no legal restrictions whatsoever concerning the touristic carrying capacity, nor any systematic monitoring of the microclimate to control the degradation of their environment. In fact, many old show caves have already lost part of their touristic value due to the uncontrolled touristic flow. The most famous show cave of Romania, Urșilor Cave (Chișcău, Apuseni Mountains), already shows significant lampenflora occurrences despite of it being fitted with air locks and despite several attempts of cleaning the speleothems or the fossil remains of cave bear (Ursus spelaeus) on display—one of the main cave’s attractions. Other touristic caves show even greater signs of degradation as a result of the intense visitation despite some of them being slightly renovated. However, in the last six years only, three new show caves were opened (e.g., Valea Cetății, Farcu, Meziad). While they appear so far to be successful as tourist attractions and are fitted with modern pathways and LED lighting systems, their conversion into show caves was done without any previous basic microclimate monitoring and, unless a consistent monitoring program is carried out soon, it is hard to assess whether and when these caves may start to lose their aesthetic values and interest for tourists as well. On the other hand, the “Emil Racovita” Institute of Speleology (ERIS) has developed, in the last ten years, several continuous monitoring programs of both cave physical and microclimatic parameters and the ecology and dynamics of cave fauna. Numerous other cave monitoring studies have been performed in the past (e.g., [36,37,38,39]).
The recent raise in number of show caves in Romania indicates the real need for such touristic attractions in Romania. According to the Romanian Show Caves Association (RoSCA), 10 out of the 13 show caves in the country have attracted more than 500,000 visitors in 2011 only. Little or no data is available concerning the visitor numbers for the other caves but it is clear that: (i) there is a growing demand for developing new caves as touristic attractions; (ii) uncontrolled development and unmonitored touristic exploitation will lead to irreversible damage to cave mineral attractions and subterranean biodiversity; (iii) the pressure for developing new show cave sites will grow as Romania is a country rich in spectacular caves and tourism is considered a valuable asset of future economic growth.
The opening of new caves for tourism without previous microclimatic monitoring and without the implementation of continuous climatic monitoring after their opening was the trigger for starting a monitoring program in Romanian show caves. The four most visited show caves of the country were selected for this program to: (i) understand the interplay between natural behavior of the cave microclimate and tourism, (ii) establish the vulnerabilities of cave visitations caused by the intensity of tourist traffic, and (iii) propose management measures for each of the studied caves, measures to be implemented by the cave administrators. The originality of our study lies in the parallel study of four different caves, each with particular morphology, number of entrances, size of passages, number of tourists, and visitation patterns.
2. Materials and Methods
2.1. Studied Caves
Four Romanian show-caves were considered in the present study (Figure 1, Table 2), each of them with different visitation patterns:
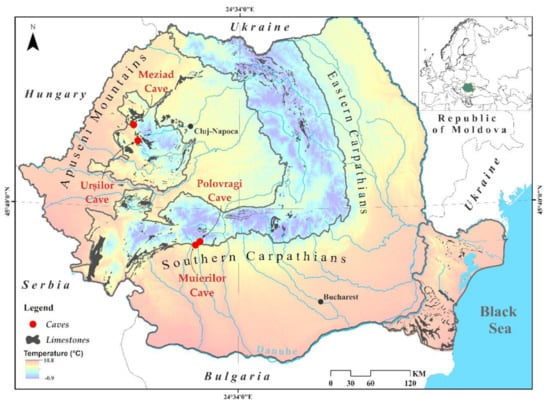
Figure 1.
The location of the four studied show caves in Romania, with the position of the country in Europe. Karstic areas and mean annual temperatures are also shown.
Table 2.
General information on the studied show caves.
1. Peștera Muierilor (peștera = cave in Romanian) is in the Southern Carpathians. It consists of a maze of passages totaling more than 8 km in length, spread across four levels. The cave is famous for the discovery of early modern human remains c. 35 ka old [40], Paleolithic artifacts and a large deposit of fossil remains of cave bears (Ursus spelaeus), cave lions, hyaenas, wolves, and also herbivores and small mammals [41]. It was the first cave of Romania fitted with electric light (1963) and it typically has more than 100,000 visitors/year. The visitation flow is one-way (unidirectional), i.e., tourists enter the cave through the northern entrance and exit it through the southern one. Cave lighting still uses incandescent bulbs, which led to the development of abundant lampenflora on cave walls, speleothems, and fossil remains.
2. Peștera Polovragi is in the vicinity of the Muierilor Cave. It is a multilevel cave with a total length of ~10 km. The touristic sector is ~500 m long and was opened in the 1960s by blasting. This sector has suffered serious degradations following occasionally uncontrolled visits that led to vandalism and the usage of incandescent bulbs that favored the formation of lampenflora. However, the cave still attracts ~30,000 visitors/year. Polovragi is a typical example of a show cave where the original environment has been disturbed by the enlargement of the entrance, the inappropriate lighting, and the bidirectional visitor flow (tourists enter and exit the cave through the same point). However, the cave has still pristine passages that may be developed for tourism and a renovation and extension project is planned. Both Muierilor and Polovragi caves are sheltering bat colonies and are part of the ROSCI 0128 Natura 2000 protected area.
3. Peștera Urșilor (Bears’ Cave) is the most famous show cave in Romania owing to both the abundance of spectacular speleothems and the large number of fossils of cave bears. It is located in Chișcău village in the Bihor Mountains (Apuseni Mountains) and was discovered in 1975 by blasting in a local quarry. Two artificial entrances were excavated and fitted with airlocks. Visitors use different accesses for entrance and exit but in the deeper part of the cave the traffic is bidirectional. This cave is a typical example of a show cave where artificial entrances has caused a change in microclimate despite the airlocks. The cave is developed on two major levels, one fossil with the touristic path, and the base level with the subterranean river that represents a Scientific Reserve. The lighting system uses LED illumination and lampenflora is forming on walls and speleothems in smaller-sized passages and over the displayed fossil remains. The cave attracts more than 120,000 visitors/year.
4. Peștera Meziad is in Pădurea Craiului Mountains (Apuseni Mountains). It is one of the oldest show caves of Romania important for its large passages and chambers, developed on two levels, massive speleothems, and fossil remains. It is a natural monument and part of the ROSCI 0062 Natura 2000 site. It is a maze-like cave ~6.3 km long. Owing to its large entrance the cave is well ventilated in its first 300 m of passages. It shelters a large colony of bats, estimated to as many as 20,000 individuals and rare troglobiontic invertebrate species have been described [42]. After decades of uncontrolled tourism, the cave was partially rehabilitated in 2012. However, the successful rehabilitation is poorly advertised so far, and the cave attracts only ~20,000 visitors/year. The visitation flow is circuit-type, with tourists entering and exiting through the same porch but following a one-way trail inside.
2.2. Monitoring Protocol
Considering both the topography of each cave and the length of the tourist route, the study was carried out between December 2015 and December 2017 (see also Table 3).
Table 3.
Characteristics of measurements in the four studied show caves (December 2015–December 2017).
- -
- Installing monitoring stations in the touristic and non-touristic sectors of each cave. In these stations, the physical and hydrological parameters were recorded continuously, using dataloggers. The measurements were performed at intervals ranging between 5 and 30 min depending on the type of datalogger, the monitored parameter, and the actual situation in the field.
- -
- Periodic monitoring by spot measurements both in the fixed stations and in additional stations. Spot measurements were performed every two months using portable equipment. The measured parameters were: air temperature, relative air humidity, CO2 concentration, air speed and direction. The concentration of CO2 in the air is an important parameter both for the safety of visitors and staff, and especially because it can influence the process of precipitation or dissolution of calcium carbonate. In addition, water samples were collected for chemical analysis. Water saturation index (SI) was also calculated for it provides information on the ability of dripping water to precipitate or dissolve calcite. The SI was computed using the Langelier Saturation Index formula and the Lenntech online calculator (https://www.lenntech.com/calculators/langelier/index/langelier.htm).
- -
- Biological and microbiological monitoring was performed at intervals of two months for water and air microorganisms and invertebrates and for bats the observations were at least seasonal. The results on air and water microorganisms sampled during the present study were published in [43,44].
- -
- Radiological monitoring was performed by distributing 90 SSNTD/CR-39 radon detectors of RSKS type in 10 monitoring stations. The detectors have been installed since December 2014, and then replaced every three months, resulting in complete sets of measurements for each season. Radon measurements were reported by Burghele et al. [45,46].
- -
- The surface climate monitoring was performed by using meteorological data recorded by automatic Vaisala weather station installed at Baia de Fier (for Muierilor and Polovragi) and Chişcău village (for Urşilor and Meziad). The purpose of climate monitoring was to anticipate the response time and amplitude of microclimate changes and hydrological parameters in the cave to meteorological phenomena (mainly temperature and precipitation).
The locations of the monitoring points within the four caves are shown in Figure 2.
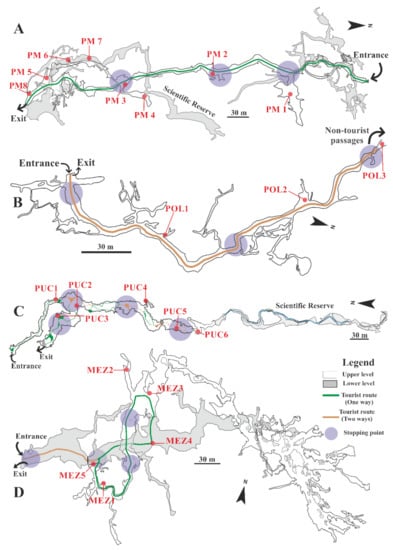
Figure 2.
The four studied show caves and the location of the monitoring stations in Muierilor (A; modified after Mirea et al. [41]), Polovragi (B; modified after Ponta and Aldica [47]), Urșilor (C; modified after Constantin et al. [48]), and Meziad (modified after Rusu et al. [49]).
2.3. Vulnerability Maps
We define here vulnerability maps of a cave as the projection on the cave map of the calculated algorithms (see below) based on the measured parameters in each station. Such maps can be useful in taking management decisions. Such decision can be modification of the touristic path, reducing the number of tourists/day or tourists/season, changes of the ventilation inside the cave by reducing or increasing the periods for gate openings, etc. For modeling the maps with the seasonal vulnerabilities of the four caves, we used the following indicators: temperature variation, humidity variation, CO2 variation, drip rate variation, drip water chemistry, abundance of bat colonies (not published), abundance of pathogenic microorganisms (from [43]), and number of tourists. Four vulnerability classes were established for each indicator and then the vulnerability index was calculated according to the vulnerability class and the number of significant indicators (Table 4). The algorithm for vulnerability calculations applied for each station in the caves was:
where validated indicators are those that were measured in every station.
Vulnerability score = sum of indicators value * weight/no. validated indicators,
Table 4.
The parameters, their weight in the analysis (in italics), and the respective categories used to build vulnerability maps. Human induced (1–4 and 7–8) and natural (5 and 6) parameters were considered here.
The four vulnerability classes, established from the analysis of the time series at the end of the monitoring program, are as described below:
1 = score 0–5—no/reduced vulnerability
2 = score 6–10—medium vulnerability
3 = score 11–15—high vulnerability
4 = score 16+—extreme vulnerability
The vulnerability classes, the weight, and category of each parameter (Table 4) were established relative to the obtained data from the four caves, the experience we have on the range of variation of different parameters in natural caves, and the observed modifications induced by the human presence.
The results on the obtained classes were added within an ArcGIS 10.3.1. ESRI environment. Multiple 0.5 m resolution surfaces were generated with the help of a deterministic interpolation (natural neighbor) that used barriers [50]. The method helped to constrain interpolated values within the cave boundary. Surfaces were generated for each season of interest considering the vulnerability class. Validating the surfaces was not possible, due to the limited amount of information. The surfaces did not consider various volumetric and morphological variations of the cave systems, having just one observation point per certain section of interest. This strongly constrained the obtained results, which were solely used as indicators of the general trend of the observed phenomenon.
3. Results
3.1. Muierilor Cave
Eight stations were installed in the cave (Table 5), of which five stations were set in the touristic sector and three in the Scientific Reserve (see also Figure 2 and Table 3).
Table 5.
The stations in the Muierilor Cave and the values of the measured parameters in air and water.
3.1.1. Temperature
Variations in air temperature decreased towards the interior of the cave (especially in the Scientific Reserve) where it became almost constant. In Figures S1 and S2 the temperature variations recorded in the touristic (PM1, PM2, PM3, PM5, and PM8) and non-touristic (PM6, PM7) stations by comparison with the surface temperature recorded during the 2-year measurement cycle are presented.
Outside the tourist area, the temperatures are much more constant but there was a general trend of increasing temperature since the summer of 2015 followed by a stabilization in 2016. In Figure S3, a temperature increase pulses were measured during the paleontological excavations that were carried out in the Scientific Reserve. It is observed that a group of only 5–6 people triggered a temperature increase by about 0.5 °C in a rather short time (1–2 days) in a medium-sized gallery (~6 × 1.5 m), after a working time of 6–8 h per day. The period of return to the initial state is usually 1–3 days, but it should be noted that after the second campaign, the temperature continued to rise, reaching a maximum in the summer of 2016, even in the absence of researchers.
3.1.2. Tourist Traffic
An infrared traffic recorder was installed at the PM2 station to record the human presence. With many visitors, the temperature rise can exceed 0.5–1 °C in a medium-sized room as is the PM2 station and with a tendency of thermal accumulation. This increase is linked to both the number of visitors per visit and the time spent at the given point. Stationing of the groups for more than 10 min in this station has the effect of rapidly increasing the temperature and at the same time lengthening the time to return to the initial situation.
3.1.3. Air Relative Humidity (RH)
RH has values higher than 90% throughout the year starting about 40–50 m from the two entrances. Inside the cave the RH values are constantly higher than 95%.
3.1.4. Air CO2 Concentration
The touristic sector is relatively well ventilated with measured values of CO2 between about 400 ppm (normal value for atmospheric air, measured in the entrance area) and 1000 ppm, the increases being recorded in the summer months.
3.1.5. Air Speed
The air currents show speeds of up to 0.2 m/s near the entrance area. Their direction varied depending on the air temperature at the surface. In the deep area or adjacent galleries (east and west branches and lower level), air circulation is imperceptible.
3.1.6. Drip Rate
Data obtained on the drip rates (Figure S4) show a good correlation both between the dripping points and between them and the rainfall regime recorded at the surface. Quantitatively, the recorded flows vary between 0.1 L/h in the PM7 station and 1.4 L/h in the PM4 station, respectively. Response time to precipitation events shows a dynamic related both to the amount of precipitation infiltrated and accumulated in the karst system and to their duration and intensity: as a result, response time intervals of the order of months (1–3 months) are identified, in the case of dry periods but also response time on the order of days, especially in constant and abundant rainy periods. In this sense, the PM3 and PM4 dripping points respond most quickly to high-flow events. During periods of heavy rain, the tourist gallery becomes unvisitable due to the flooding of the floor.
3.1.7. Physicochemical Parameters of Drip Water
The conductivity of the water is relatively constant, with slightly lower values during the winter. There is a clear difference between PM3, PM4, PM6, and PM7 stations, for which the average conductivity value was about 362 µS/cm, and the PM5 station where it was about 450 µS/cm. The pH values of the water oscillate between 7.2 and 8.7 in the five measuring points, with average values of 7.8–7.9. Generally, the pH is lower in winter and higher in spring and summer. The total hardness of carbonates varies between 12.6 and 15.8 dH.
The calculated values of the saturation index (SI) showed that the drip water is more saturated in carbonate in summer and aggressive in winter. At PM3, the water is aggressive (corrosive) in winter, while at PM4 the water precipitates calcite throughout the year.
3.2. Polovragi Cave
Three stations were established in the cave (Table 6), with all stations in the touristic sector (see also Figure 2 and Table 3).
Table 6.
The stations in the Polovragi Cave and the values of the measured parameters in air and water.
3.2.1. Temperature
As expected, variations in air temperature decreased deeper inside the cave where the air temperature becomes quasi-constant all year round. Figure S5 shows the temperature variations recorded in Pol1 and Pol2 stations during the 2-year measurement cycle. One may notice that in the Pol1 station the air temperature is influenced by the variations of the surface temperature varying by about 1 °C between the minimums registered in January–February and the maximums registered in August–September. In the Pol2 station, the air temperature was practically constant, varying by only 0.3 °C around the average of 8.4 °C.
3.2.2. Tourist Traffic
An infrared traffic recorder was installed in Pol1 station. No direct correlation between the number of tourists and the variation of air temperature was observed (Figure S6).
3.2.3. Influence of Lighting Sources
The data loggers were oriented towards two reflectors in the cave. In the station Pol1, at about 1 m distance from the reflector and in the station Pol2 at about 3 m distance from the reflector (Figure S6). The analysis of the data shows that the operation of the reflector in the Pol1 station produces a heating of 0.3–0.4 °C at about 20 min from the lighting of the reflector, the effect being felt during the whole day of visiting. The temperature drops by about 0.2 °C after about 16 h. If the visit regime is reduced the next day, the temperature can return to previous values. In the Pol2 station, at 3 m distance from the reflector, no influence on the air temperature is observed.
3.2.4. Relative Humidity
RH has values higher than 90% throughout the year approximatively 100 m from the entrance. Towards the inside of the cave, the RH values are constantly higher than 95%.
3.2.5. Air CO2 Concentration
In the touristic sector, the Polovragi Cave is relatively well ventilated and the measured values of CO2 vary between about 400 ppm, a normal value for atmospheric air measured in the entrance area, and 1300 ppm. The maximum values of the CO2 concentration were measured inside the cave, in all fixed stations in the summer months (June–August) and can be considered normal.
3.2.6. Air Speed
Due to the large volume of the cave passages, the tourist sector is well ventilated, especially along the first 200 m. The air currents had speeds of 0.02–0.11 m/s in the entrance area, their direction varying depending on the air temperature at the surface. In the deep sector, the air circulation is imperceptible, except for the non-touristic zone where the gallery section is reduced and small air currents form.
3.2.7. Drip Rate
The two loggers installed in Pol1 and Pol2 stations show a very good correlation both between the two measuring points and between them and the precipitation regime (Figure S7). Quantitatively, the registered flows reached up to 3.5 L/h in the Pol2 station, and 0.8 L/hour in the Pol1 station, respectively. The response time to precipitation events has two periodicities: a relatively short one, about 3–4 days and a much longer one, which can reach 2–3 months and occurs after prolonged periods of drought. This can be seen by comparing the years 2015 (drier) and 2016.
3.2.8. Physicochemical Parameters of Drip Water
The conductivity of the water is relatively constant, with lower values during the winter. However, there is a clear difference between the two measuring stations. The average conductivity value in Pol1 was about 250 µS/cm, while in Pol2 it was about 384 µS/cm. The pH values of the water are similar in the two points and have average values of 7.63–7.64. The total hardness of carbonates is also much higher at the Pol2 point (11.4 dH) than at the Pol1 point (8.25 dH).
The water saturation index (SI) showed that the dripping water is more saturated in carbonate in summer and aggressive in winter, and in this case there is a difference between points Pol1 and Pol2; in Pol1 the water is aggressive (corrosive), while in Pol2 the water precipitates calcite in summer but dissolves in winter. Water aggressiveness can be considered moderate in Pol1 (values up to −0.8) and neutral in Pol2 (<−0.5).
3.3. Urșilor Cave
Six stations were established in the cave (Table 7), with stations PUC1, PUC2, PUC3, and PUC5 in the touristic sector and stations PUC4 and PUC6 in the non-touristic passages (see also Figure 2 and Table 3).
Table 7.
The stations in the Urșilor Cave and the values of the measured parameters in air and water.
3.3.1. Air Temperature
The constant values registered outside the tourist path (PUC4, upper level) and PUC6 (Scientific Reserve) define the range of natural temperature variation. It is confirmed that under natural conditions, the temperature in the cave should be constant, with variations of maximum 0.1–0.2 °C. In the touristic sector, all the registered values show increases during the summer season, which also corresponds to the peak season for tourism (Figure S8). The registered seasonal variations are slightly higher in the PUC 5 station located in the deeper part of the cave, compared to the PUC2 and PUC3 stations (~1°C versus ~0.7 °C) but this is normal considering that in the PUC5 station the volume of the gallery is lower and tourist traffic in that sector is a round trip. There was no clear correlation between seasonal oscillations of outdoor temperature and those recorded in the cave.
3.3.2. The Influence of Tourist Traffic
Three infrared tourist traffic recorders were installed in stations PUC 1 (unidirectional), PUC 3 (unidirectional), and PUC 5 (bidirectional) to record the tourist transit at the respective points. From the data analysis a correlation is observed between the tourist traffic and the air temperature variations in the measured area (i.e., PUC 3 in Figure S9). The temperature increases are relatively small of 0.1–0.2 °C, but they accumulate in the peak season, when the temperature does not return to normal from one day to the next.
3.3.3. Influence of the Lighting Sources
The loggers in PUC 2, PUC 3, and PUC 5 stations were oriented towards the light sources. In PUC2 and PUC3 they measured the ambient lighting while in PUC 5 the sensor was placed at about 1 m distance from the light source. The analysis of the recorded data shows that the light sources generated in all stations an increase in temperature of 0.1–0.2 °C (Figure S10). In case of low traffic, when the lighting time is limited, the temperature returns to the initial values after a relatively short time, of about 1–2 h. The operation of the light sources in the PUC3 station in the absence of tourists produced a rapid response with a heating of 0.1–0.2 °C, the temperature returning to the initial level after a much longer time, of about 10 h (Figure S11).
As the increase in temperature in the cave is the cumulative effect of the presence of tourists and the operation of the lighting installation, it is difficult to determine how much of the temperature increase is due to the operation of light sources. The situation shown in Figure S10 suggests that the light sources alone can produce heating up to 0.2 °C even in a large space.
3.3.4. Relative Humidity
RH was 95–100% regardless of the registration point, season, or tourist traffic.
3.3.5. CO2 Concentration in the Air
In the touristic sector, the cave had high measured CO2 concentrations that varied between about 1000 ppm and over 10,000 ppm (Figure S12). The CO2 concentrations recorded during the summer in the cave are among the highest measured. Due to sensor limitations, we could not measure values over 10,000 ppm, but point measurements performed with a portable Vaisala instrument, in August 2016, showed values exceeding 14,000 ppm at PUC2. For reference, we specify that the value of 25,000 ppm is considered as a threshold beyond which the CO2 concentration is dangerous for human health [51].
3.3.6. Air Speed
Due to the airlocks system, the Urșilor Cave does not have a high level of ventilation. The most intense air movements were recorded in the PUC2 station, with velocities of maximum 0.46 m/s. The speed of the air currents is slightly higher during the warm season and lower in winter, probably due to the frequency with which the access doors are opened. In stations furthest from the access area (PUC 5 and PUC 3), the average speed of air currents is much lower, up to 0.01 m/s.
3.3.7. Drip Rate
In the cave, the most active dripping point was PUC 5 where maximum flows of over 2.5 L/h were recorded (Figure S13). The drip rates recorded in the cave were not directly correlated with the rainfall events at the surface. The PUC5 station has a clear seasonal behavior, with extremely low flows during the summer (<0.5 L/h) and very high flows during periods of heavy rain or snow melting.
3.3.8. Physicochemical Parameters of Drip Water
The conductivity of the water was relatively constant, with slightly higher values during the winter. Lower values (~200–350 µS/cm) were measured in the non-touristic area at stations PUC4 and PUC 6. Higher values, constantly over 400 µS/cm were recorded in the stations PUC2 and PUC3. The total hardness had the highest values (12–15 dH) in the touristic sector, in all the stations.
The calculated valued of the water saturation index (SI) demonstrated that the dripping water was generally unsaturated (aggressive), especially during the summer. The maximum SI values are recorded in winter, only in PUC2 and PUC3 stations, but they are quite low anyway. This shows that dripping water was generally aggressive and calcite was deposited only in a few points in the touristic sector and only in winter.
3.4. Meziad Cave
In the Meziad Cave, five stations were established in the cave (Table 8), with stations Mez1, Mez3, Mez4, and Mez5 in the touristic sector and station Mez2 in a non-touristic passage (see also Figure 2 and Table 3).
Table 8.
The stations in the Meziad Cave and the values of the measured parameters in air and water.
3.4.1. Air Temperature
The lower level of the cave is strongly influenced by the surface temperature. The multiannual variability of the temperature is over 19 °C near the gate and decreases to about 14 °C deeper inside the cave. In the upper level, the temperature is much higher (on average about 4.5–5 °C). The multiannual temperature variability is about 11 °C in the Mez1, close to the entrance and about 5.5 °C in Mez3, close to the bats’ colony. The most constant temperature is recorded in Mez2, located in the non-touristic area where the temperature recorded variations of maximum 2 °C during the monitoring cycle (Figure S14). The lower level is strongly influenced by variations of surface temperature in the cold season, and the upper level by the warm season, as the warm air remains “captive” on the top level in the cold season. During the summer, the warm air entering the cave portal influences the microclimate of the upper level, registering even diurnal variations. Side passages are much less influenced by seasonal variations.
3.4.2. Tourist Traffic
An infrared traffic recorder was installed in the Mez1 station (Figure S15).
3.4.3. Influence of Lighting Sources
In the stations Mez1, Mez3, and Mez5 the light loggers were oriented towards the nearest lighting sources, located at distances of about 3–5 m. No heating effect could be detected in any of the stations due to the lighting sources, which is to be expected for the LED lighting system.
3.4.4. Relative Humidity
RH had values ranging from 60% to 100% in the upper-level entrance area and between 80% and 100% in the lower level and deep area. In Mez2, RH was constantly higher than 90%.
3.4.5. CO2 Concentration in the Air
In the touristic sector, the Meziad Cave is well ventilated. In the upper tourist level (Mez1), CO2 concentration varies between about 400 ppm (normal value in atmospheric air) and 850 ppm. In the lower level (Mez4), the maximum values reach about 1100 ppm. The highest values of CO2 concentration (1800 ppm) were recorded in Mez2. The maximum values of the CO2 concentration were measured in the summer months (June–September) and can be considered normal. There is no direct link between the higher number of visitors in the summer months or during various holidays and increases in the air temperature in the cave.
3.4.6. Air Speed
Due to the large volume of the galleries, the touristic sector of the Meziad Cave is well ventilated, especially in the entrance area and the lower level. The air currents have speeds of 0.02–0.2 m/s, their direction varying depending on the surface air temperature. In the upper level and the side galleries, the air circulation is imperceptible.
3.4.7. Drip Rate
In the Mez2 and Mez4 stations, the two loggers show a weak correlation between the dripping rate and the precipitation regime (Figure S16). It should be noted, however, that the data used for precipitation are those recorded at the Urșilor Cave. Under these conditions, the values used for precipitation may be different, although it is assumed that the major trends are the same.
Quantitatively, the flow rates recorded for the two drip points are low, with maximum values of 0.45 L/h in the Mez4, respectively 0.1 L/h in the Mez4. These values are about 5–10 times lower than the recorded values in stations in the Urșilor Cave, in the same interval. At both points, the peak flows are recorded in spring and autumn, but without being related to major episodes of precipitation. There is a response gap of 1–4 months between Mez2 (located closer to the surface) and Mez4 (lower level).
3.4.8. Physicochemical Parameters of Drip Water
Water conductivity is relatively constant throughout the year, with a difference between the two measuring stations. The average conductivity value in Mez2 was about 550 µS/cm, while in Mez4 it was about 440 µS/cm. Relatively high conductivity values indicate a high concentration of dissolved salts. This is also observed in the results of the total hardness of the carbonates, which is also high in absolute value (13–16 dH, compared to the usual values of 8–12 dH found in other caves). In Mez2 point, the average total hardness is higher (16.5 dH) compared to Mez 4 point (13.8 dH). The pH of the water had a similar variation over the measurement period in both stations, with an average value of 7.9.
4. Discussion
4.1. Muierilor Cave
The cave represents an important touristic objective that requires a radical redevelopment. Table S1 and Figure 3 shows that the vulnerability of the cave to tourist traffic is maximum during the summer due to the drastic increase in the number of tourists, the presence of bats (as source of pathogens; [33]) in the cave and the corresponding increase in the number of possible pathogenic microorganisms. Vulnerabilities related to temperature changes appear as a combined effect of human presence associated with the operation of incandescent bulbs. During the warm season, the accumulated changes led to an increase in temperature of up to 2 °C.
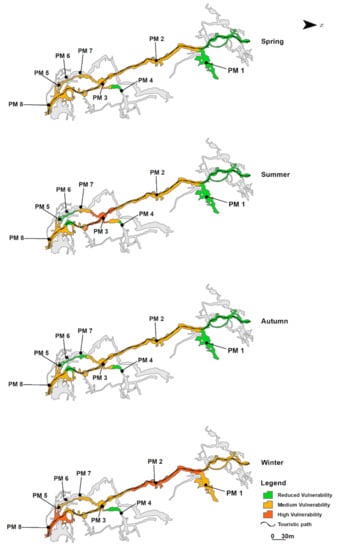
Figure 3.
The Muierilor Cave vulnerability maps by season.
The influences of the external temperature are felt in the Muierilor Cave up to about 50 m from both entrances, especially from the southern entrance. There are three components that influence the variation of temperature: (a) the natural (seasonal) component, with low influence in the deep zone; (b) the operation of light sources whose influence was measured to up to about 2–3 m, corroborated with (c) the presence of groups of tourists. Temperature increases in the tourist gallery can reach about 1 °C during the visiting hours and do not return to previous values until the next day. These increases accumulate over time so that in the peak season (summer) the air temperature can be up to 2 °C higher than normal. The return is gradual during autumn and winter when the cave is less visited.
The current lighting installation has generated the appearance of lampenflora and it also affects the cave exhibits (the cave bear skeleton; Figure 4). They reappear shortly after cleaning, whether chemical or using ultraviolet light. The current lighting installation should be replaced as soon as possible with one based on low power LED sources, at the same time with an action of total eradication of the lampenflora.
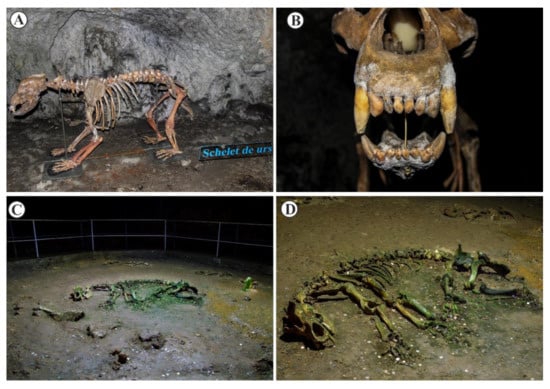
Figure 4.
(A). Lateral view of the cave bear from the Muierilor Cave; (B). Frontal view of the skull showing large areas of the maxilla and jaws extremely affected by lampenflora; (C). Stopping point (approximately 10 min per group) for tourist in the Urșilor Cave near the cave bear skeleton; (D). Cave bear skeleton from the Urșilor Cave extremely affected by lampenflora.
The summer months also have an increased microbiological risk for tourists and guides. The microbial limits in the air are far exceeded by European standards and possible pathogenic bacteria have been identified. That is why it is necessary to limit the time spent by groups of tourists, especially in the summer season [44].
Measured radon doses indicate that staff (guides) is at moderate occupational risk (category B). This risk should be monitored periodically using personal dosimeters. Measured radon concentrations are not a danger to tourists [45,46].
In the case of the tourist redevelopment of the Muierilor Cave, the project will have to secure solutions for the limitation of the air circulation and the restoration of the natural conditions of relative humidity and the attenuation of temperature variations. This can be achieved by building a visitor center over the northern entrance that would allow for ventilation control and adjustment, limit the evaporation of percolating water and mitigation of the microbiological impact.
4.2. Polovragi Cave
The Polovragi Cave could attract a much higher number of tourists that requires a radical redevelopment. Table S2 and Figure 5 show that the cave’s vulnerability to tourist traffic is maximum in summer–autumn, while in the winter season there is only a middle portion of the touristic path that is vulnerable, probably due to the presence of bats that form hibernation colony.
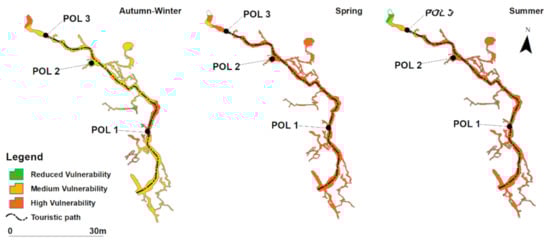
Figure 5.
Maps of the seasonal vulnerability of the Polovragi Cave.
During the monitoring, no vulnerabilities were identified related to changes in the microclimate that could be associated with the presence of tourists. The influences of the surface temperature were detected in the cave to about 50 m from the entrance, after which the air temperature is relatively stable around 8.2–8.4 °C. There was no direct link between the high number of visitors in the summer months and the rising air temperature in the cave.
Significant temperature increases have been directly associated with the lighting installation and which do not return to normal values during a visit cycle. There was a direct influence of light sources, which translates into temperature increases ranging from about 2 °C in the immediate vicinity of the reflectors and about 0.4 °C at 1 m distance during their operation. A return time of about 40 h is required for the temperature to return to the initial values. The current lighting installation has generated the appearance of lampenflora and should be replaced as soon as possible with one based on LED sources, at the same time with an action of total eradication of the lampenflora. However, the simple replacement with LED sources will not lead to the disappearance of the lampenflora.
Measured radon doses indicate that the guides are at high occupational risk. This risk should be monitored periodically using personal dosimeters. Measured radon concentrations are not a danger to tourists [45,46].
Of interest for the vulnerability of the cave is the fact that during periods of intense dripping in some sectors, there is flooding of the floor, which affects tourist traffic. In the event of a future redevelopment, these areas should be provided with stainless steel or other inert material decks raised above the floor level.
In the case of the tourist redevelopment of the cave, we consider it necessary to dig a tunnel between the end of the tourist area and the slope of the Olteţ Gorges, Olteț being the river that flows in front of the cave entrance. This tunnel (provided with at least two airlocks) would fulfill the following functions: (1) it would increase the tourist flow as the groups of tourists could enter the cave at an interval of about 20 min leaving through the final part, in the Olteţ Gorges; (2) it would minimize the impact of tourists on the cave as they would travel the cave in one direction only; (3) could function as an additional ventilation system during periods when high concentrations of radon are recorded.
4.3. Urșilor Cave
The Urșilor Cave is a tourist objective of highest importance that needs a different management approach. Table S3 and Figure 6 shows that the cave’s vulnerability to tourist traffic is maximum during the summer–autumn period, especially in the entrance passages and in the touristic exit area. The vulnerability of the cave is also high in several points along the touristic trail, especially the platforms where tourists are stopping for explanations.
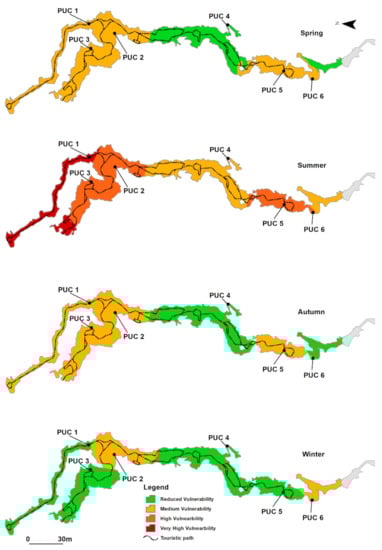
Figure 6.
Maps of the seasonal vulnerability of the Urșilor Cave.
The identified vulnerabilities are related to temperature changes that may be associated with the presence of tourists. These changes appear as a combined effect of human presence associated with the operation of lighting. The outside temperature does not directly influence the microclimate of the cave. The average temperature measured on the tourist route registers seasonal variations, with increases of up to 0.7 °C in the warm season, which overlaps with the peak tourist season. In the non-touristic sector, the temperature has a remarkable constancy, both in the lower and in the upper levels. In the touristic sector, with much larger galleries, the temperature increases by up to 0.7–0.8 °C, with maximum values in August, and returns to the initial values only starting with December. From this increase, up to 0.2 °C is due to the operation of the lighting system.
CO2 concentrations in the cave atmosphere are high during the summer (over 14,000 ppm) and, given the predictable increasing number of visitors in the future, could become potentially dangerous to the health of tourists and guides. The maximum limit for occupational exposure (8 h) to CO2 varies between 5000 and 10,000 ppm. In Romania, this limit is set at 9000 ppm for an 8-h shift by the general labor protection norms [52]. The high concentrations of CO2 were associated with increasing acidity of the dripping water and corrosion of speleothems, which are main attractions of the cave. To reduce the level of CO2, we recommend the opening of the entrance doors to increase ventilation during the peak periods of July–September (the entrance is covered by a concrete building). The measures related to the ventilation of the cave by permanently opening the doors must be tested only under the conditions of a constant monitoring by specialists. Seasonal oscillations of CO2, with maximum values during the summer, are normal in all caves, including non-tourist ones, as they are due to the contribution of additional CO2 formed at the surface because of biotic activity and transported underground by water or percolation. In the case of the Urșilor Cave, however, visitors are the most important source of CO2, as the maximum values measured in the non-tourist area did not exceed 7000 ppm, half of those measured in the touristic sector. In the touristic high season (summer), when the cave receives up to 200 visitors/hour, the CO2 level increases. The restoration to initial values was relatively long, of about two weeks (Figure 7).
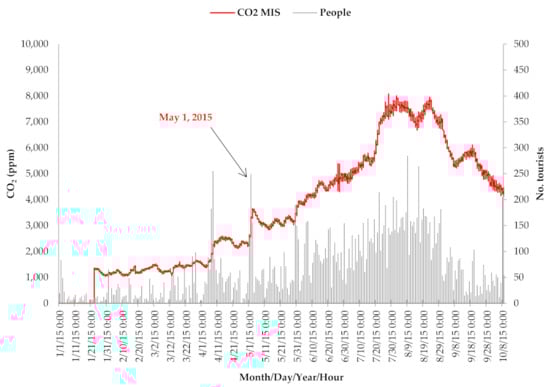
Figure 7.
CO2 concentration (ppm; red) in the Urșilor Cave measured in the PUC2 station compared to tourist traffic (black). There is an immediate increase in CO2 values in the periods corresponding to the national holidays. MIS is the type of climatic station as indicated in Table 3.
The dripping behavior showed that there is a gradual filling of the vadose zone above the cave and rapid release of water once it reaches a certain threshold.
The old lighting installation has generated the appearance of lampenflora, even on the fossil remains (the exposed cave bear skeleton). They reappear shortly after cleaning, whether it is done chemically or by using ultraviolet light. The replacement with LED sources did not lead to the disappearance of the lampenflora and we reinforce the need of using LED light of very low intensity.
We also recommend replacing the fossil cave bear remains at the end of the touristic path with a copy of a skeleton made of a chemically inert material.
Measured radon doses indicate that guides are at high occupational risk (category A). This risk should be monitored periodically using personal dosimeters [45,46]. Measured radon concentrations are not a danger to tourists.
The amounts of bacteria and pathogenic fungi in the air and water exceeded the European standards in many stations during April–August. However, the largest amounts of pathogenic bacteria and fungi appeared in the building at the entrance of tourists [43]. We recommend ventilating it especially during periods with many tourists and perform antifungal hygiene as often as possible. We recommend the immediate installation of systems for disinfecting the feet of tourists at the entrance to the cave.
Considering the summer vulnerability of the Urșilor Cave, we recommend reducing the visiting time and the stopping in the final area, at the cave bear skeleton.
4.4. Meziad Cave
The Meziad Cave is an important and spectacular tourist attraction that could attract a much higher number of tourists than it currently does. Table S4 and Figure 8 show that the vulnerability of the cave to tourist traffic is maximum during the summer due to the drastic increase in the number of tourists, the presence of the bats in the cave, and the corresponding increase in the number of pathogenic microorganisms.
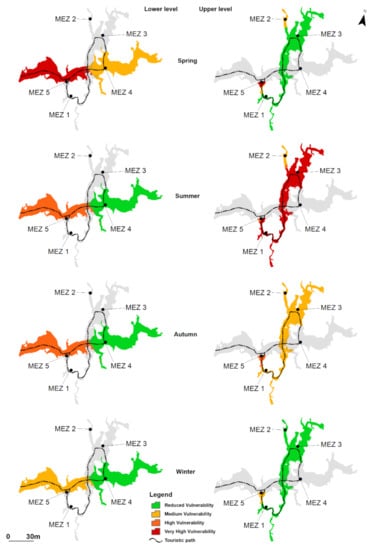
Figure 8.
The Meziad Cave vulnerability maps by season.
No vulnerabilities were identified related to changes in the microclimate (temperature, RH, CO2) that could be associated with the presence of tourists. The spatial modeling of the seasonal evolution of the temperature in the touristic sector shows the strong influence of the temperature from the surface on the first ~ 100 m of the cave in all seasons. There was no direct correlation between the registered traffic and the variation of the air temperature. In the cold season, changes in the outside temperature cause significant temperature variations especially in the lower level. In the warm season, temperature variations are felt predominantly on the upper level. Due to the large spaces, the Meziad Cave has an atypical thermal regime presenting an important thermal variability even in sectors located a few hundred meters away from the entrance. The exception is the side galleries, which are not subject to tourists’ traffic.
No thermal influence of the lighting sources on the air temperature was observed. However, the current lighting installation, although based on LED lights, does not avoid the proliferation of the lampenflora. The lampenflora should be eradicated periodically; either by using mobile UV lamps (local exposure for several hours) or by washing with a H2O2 buffered solution [11].
From the previously published data [43,44] measures were proposed against the presence of pathogenic bacteria in the cave, both in the air and in the water, such as reducing the duration of a visit by avoiding long stay throughout the tourism sector and avoiding winter visits in the southern part of the upper sector.
In general, the dripping is very low in the Meziad Cave, which is a point of vulnerability for the cave as the precipitation of new calcite is also reduced. The absence of a clear response of the dripping points in the cave to surface precipitation events indicates that the karst aquifer had long-term storage and episodic discharges.
5. Conclusions Concerning the Protection and Management Measures
Each of the four monitored show caves in this study represent a different situation due to their morphological characteristics, gating system, and management measures.
Air relative humidity was one of the characteristics that was not influenced by the touristic traffic, all caves having normal values, near the saturation. In the non-ventilated caves, temperature and CO2 concentration were the parameters most influenced by the human traffic and have shown large variations in the touristic high seasons. The CO2 concentration remained low in Muierilor, Polovragi, and Meziad caves and did not endangered the health of visitors or tourists, while the values were high in Urșilor. It is unclear whether there is a direct link between the CO2 levels at Urşilor and drip water aggressiveness, but the SI levels are generally low in the summer when the CO2 levels are also higher. In all caves where speleothems are an attraction, monitoring the SI remains important since it may trigger alerts concerning the anthropically-induced water aggressiveness and potential calcite dissolution.
However, several management measures for a sustainable use of show caves are common to all the four studied caves:
- (i)
- Firstly, the lighting system caused problems by the development of lampenflora. Changing to LED lighting has no effect if the existing lampenflora is not totally removed. Controlling the lighting remains a long-term mitigation measure that must be undertaken permanently through a combination of lampenflora early removal and adjusting of illuminance levels (both light intensity and lighting time).
- (ii)
- In caves with no natural entrance(s), such as Urșilor, a continuous monitoring of CO2 levels should be complemented by occasional ventilation through the airlocks during the high season. However, such measures should be taken on a case-by-case basis and only until low-CO2 levels (those of low-season) are restored.
- (iii)
- In caves such as Meziad, where vulnerability shows a seasonal variability, seasonal changes of the touristic circuits may be applied with benefits to both cave environment and visitors’ health. Finally, microbiological monitoring of surfaces should be routinely done to counter both pathogens introduced by visitors and cave fauna such as bats.
Such a study, on several show caves in parallel and by using different devices and methods for monitoring was an excellent opportunity to establish future protocols for show cave monitoring and suggest measures to improve the management of the caves that were already affected by tourism.
Supplementary Materials
The following are available online at https://www.mdpi.com/2071-1050/13/4/1619/s1, Figure S1: Temperature variation in the fixed monitoring stations of Muierilor Cave, PM1, PM2 and PM3, Figure S2: Temperature variation in the fixed monitoring stations of Muierilor Cave, PM5 and PM8, Figure S3: Temperature variation in Muierilor Cave stations PM2, PM4, PM5, PM6 and PM8, Figure S4: Variation of the drip rate in Muierilor Cave, Figure S5: Temperature variation in the two monitoring stations in Polovragi Cave, Figure S6: The variation of tourists’ number in Pol1 station of Polovragi Cave, Figure S7: Variation of the drip rate in Pol 1 and Pol 2 stations of Polovragi Cave, Figure S8: Temperature variation in the fixed monitoring stations of Ursilor Cave, Figure S9: The variations of the air temperature in the PUC3 station of Urșilor Cave, Figure S10: Temperature variation related to the registered traffic, respectively light intensity, in PUC2 station in Urșilor Cave, Figure S11: Temperature variation in the PUC2 station of Urșilor Cave correlated with the light in the absence of tourists, Figure S12: CO2 concentrations measured continuously in Urșilor Cave, at PUC2, PUC3 and PUC5 stations, Figure S13: The variation of the drip rate in the stations PUC2, PUC3, PUC5 and PUC6 compared to the precipitation values at the Urşilor Cave weather station, Figure S14: The temperature variation in the five monitoring stations from the Meziad Cave, Figure S15: The variation of the tourist traffic in Meziad Cave, Figure S16: Variation of the drip rate in Meziad Cave, Table S1: The calculations of classes for the different stations in Muierilor Cave, Table S2: The calculations of classes for the different stations in Polovragi Cave, Table S3: The calculations of classes for the different stations in Urșilor Cave, Table S4: The calculations of classes for the different stations in Meziad Cave.
Author Contributions
Conceptualization, S.C. and O.T.M.; methodology, S.C.; validation, S.C. and O.T.M.; formal analysis, S.C., O.T.M., D.Ș.M.; investigation, S.C., O.T.M., I.C.M., A.P., R.A.A., D.Ș.M., M.K., M.R.; data curation, S.C.; writing—original draft preparation, S.C. and O.T.M.; funding acquisition, S.C. and O.T.M. All authors have read and agreed to the published version of the manuscript.
Funding
This work was supported by an EEA Financial Mechanism 2009–2014 under the project contract no. 17SEE/2014, a grant of Ministry of Research and Innovation, CNCS—UEFISCDI, project number PN-III-P4-ID-PCCF-2016-0016 (DARKFOOD), within PNCDI III, and from the EEA Grants 2014-2021, under Project contract no. 3/2019 (KARSTHIVES).
Institutional Review Board Statement
Not applicable.
Informed Consent Statement
Not applicable.
Data Availability Statement
Data are deposited in the Emil Racovita Institute of Speleology database and can be requested to S.C.
Acknowledgments
We thank the administrators and guides of the show caves for granting the access and help during the sampling. We are grateful to the three reviewers for their valuable comments and corrections that improved the manuscript clarity.
Conflicts of Interest
The authors declare no conflict of interest. The funders had no role in the design of the study; in the collection, analyses, or interpretation of data; in the writing of the manuscript, or in the decision to publish the results.
References
- Dredge, J.; Fairchild, I.J.; Harrison, R.M.; Fernandez-Cortés, A.; Sanchez-Moral, S.; Jurado, V.; Gunn, J. Cave aerosols: Distribution and contribution to speleothem geochemistry. Quat. Sci. Rev. 2013, 63, 23–41. [Google Scholar] [CrossRef]
- Fairchild, I.J.; Smith, C.L.; Baker, A.; Fuller, L.; Spötl, C.; Mattey, D.; McDermott, F.; E.I.M.F. Modification and preservation of environmental signals in speleothems. Earth-Sci. Rev. 2006, 75, 105–153. [Google Scholar] [CrossRef]
- UNESCO World Heritage List. Available online: https://whc.unesco.org/en/list/ (accessed on 30 December 2020).
- Saiz-Jimenez, C.; Cuezva, S.; Jurado, V.; Fernandez-Cortes, A.; Porca, E.; Benavente, D.; Cañevaras, J.C.; Sanchez-Moral, S. Paleolithic Art in Peril: Policy and Science Collide at Altamira Cave. Science 2011, 334, 42–43. [Google Scholar] [CrossRef]
- Clottes, J.; Gély, B.; Ghemis, C.; Kaltnecker, E.; Lascu, V.-T.; Moreau, C.; Philippe, M.; Prud’homme, F.; Valladas, H. Un art très ancien en Roumanie. Les dates de Coliboaia. Int. Newsl. Rock Art 2011, 61, 1–3. [Google Scholar]
- Bourges, F.; Genthon, P.; Mangini, A.; D’Hulst, D. Microclimates of L’Aven d’Orgnac and other French limestone caves (Chauvet, Esparros, Marsoulas). Int. J. Climatol. 2006, 26, 1651–1670. [Google Scholar] [CrossRef]
- Fernandez-Cortes, A.; Calaforra, J.M.; Jiménez-Espinosa, R.; Sánchez-Martosa, F. Geostatistical spatiotemporal analysis of air temperature as an aid to delineating thermal stability zones in a potential show cave: Implications for environmental management. J. Environ. Manag. 2006, 81, 371–383. [Google Scholar] [CrossRef]
- Fong, D.W. Management of subterranean fauna in karst. In Karst Management; Van Beynen, P.E., Ed.; Springer: Dordrecht, The Netherlands, 2011; pp. 201–224. [Google Scholar]
- Lee, N.M.; Meisinger, D.B.; Aubrecht, R.; Kovacik, L.; Saiz-Jimenez, C.; Baskar, S.; Baskar, R.; Liebl, W.; Porter, M.L.; Engel, A.S. Caves and karst environments. In Life at Extremes: Environments, Organisms and Strategies for Survival; Bell, E.M., Ed.; CAB International: Wallingford, UK, 2012; pp. 320–344. [Google Scholar]
- Cigna, A.A. The problem of lampenflora in show caves. Acta Carsologica Slovaca 2012, 50, 5–10. [Google Scholar]
- Mulec, J. Human impact on underground cultural and natural heritage sites, biological parameters of monitoring and remediation actions for insensitive surfaces; case of Slovenian show caves. J. Nat. Conserv. 2014, 22, 132–141. [Google Scholar] [CrossRef]
- Heaton, T.H.E. Isotopic studies of nitrogen pollution in the hydrosphere and atmosphere: A review. Chem. Geol. Isot. Geosci. Sect. 1986, 59, 87–102. [Google Scholar] [CrossRef]
- Moldovan, O.; Racoviţă, G.; Rajka, G. The impact of tourism in Romanian show caves: The example of the beetle populations in the Urşilor Cave of Chişcău (Transylvania, Romania). Subterr. Biol. 2003, 1, 73–78. [Google Scholar]
- Bercea, S.; Năstase-Bucur, R.; Moldovan, O.T.; Kenesz, M.; Constantin, S. Yearly microbial cycle of human exposed surfaces in show caves. Subterr. Biol. 2019, 31, 1–14. [Google Scholar] [CrossRef]
- Cigna, A.A.; Burri, E. Development, management and economy of show caves. Int. J. Speleol. 2000, 29B, 1–27. [Google Scholar] [CrossRef]
- Cigna, A.A. Environmental management of tourist caves. Environ. Geol. 1993, 21, 173–180. [Google Scholar] [CrossRef]
- Bunting, B.; Megan, R.; Balks, M.R. A quantitative method for assessing the impacts of recreational cave use on the physical environment of wild caves. Ackma J. 2001, 44, 10–18. [Google Scholar]
- Calaforra, J.M.; Fernandez-Cortez, A.; Sanchez-Martos, F.; Gisbert, J.; Pulido-Bosch, A. Environmental Control for Determining Human Impact and Permanent Visitor Capacity in a Potential Show Cave Before Tourist Use. Environ. Conserv. J. 2003, 30, 150–167. [Google Scholar] [CrossRef]
- Fernandez-Cortes, A.; Calaforra, J.M.; Sanchez-Martos, F. Spatiotemporal Analysis of Air Condition as a Tool for the Environmental Management of a Show Cave (Cueva del Agoa, Spain). Atmo. Environ. 2006, 40, 7378–7394. [Google Scholar] [CrossRef]
- Russell, M.J. and McLean, V.L. Management Issues in a Tasmanian Tourist Cave: Potential Microclimate Impacts of Cave Modifications. J. Environ. Manag. 2008, 87, 474–483. [Google Scholar] [CrossRef]
- De Freitas, C.R. The role and importance of cave microclimate in the sustainable use and management of show caves. Acta Carsol. 2010, 39, 477–489. [Google Scholar] [CrossRef]
- Lario, J.; Soler, V. Microclimate Monitoring of Pozalagoa Cave (Vizcaya, Spain): Application to Management and Protection Show Cave Climate Monitoring of Pozalagoa Cave. J. Cave Karst Stud. 2010, 72, 169–180. [Google Scholar] [CrossRef]
- Šebela, S.; Prelovšek, M.; Janez, T. Impact of Peak Period Visits on the Postojna Cave (Slovenia) Microclimate. Appl. Clim. 2013, 111, 51–64. [Google Scholar] [CrossRef]
- Šebela, S.; Turk, J. Natural and Anthropogenic Influences on the Year-Round Temperature Dynamics of Air and Water in Postjona Show Cave. Tour. Manag. 2014, 40, 233–243. [Google Scholar] [CrossRef]
- Moldovan, O.T.; Constantin, S.; Cheval, S. Drip heterogeneity and the impact of decreased flow rates on the vadose zone fauna in Ciur-Izbuc Cave, NW Romania. Ecohydrology 2018, 11, e2028. [Google Scholar] [CrossRef]
- Bourges, F.; Genty, D.; Genthon, P.; Mangini, A.; D’Hulst, D. South-France caves monitoring: Present day cave air dynamics characterization, paleoclimatic and archaeological interests. Geophys. Res. Abstr. 2012, 14, EGU2012-5830. [Google Scholar]
- Sanchez-Moral, S.; Portillo, M.C.; Jancies, I.; Cuezva, S.; Fernandez-Cortes, A.; Canaveras, J.C.; Gonzales, J.M. The role of microorganisms in the formation of calcitic moonmilk deposits and speleothems in Altamira Cave. Geomorphology 2012, 139–140, 285–292. [Google Scholar] [CrossRef][Green Version]
- WHO (World Health Organization). WHO Handbook on Indoor Radon. A Public Health Perspective. 2009. Available online: http://www.who.int/ionizing_radiation/env/radon/en/index1.html (accessed on 20 December 2020).
- UNSCEAR (United Nations Scientific Committee on the Effects of Atomic Radiation); Annex, E. Sources-to-effects Assessment for Radon in Homes and Workplaces. UNSCEAR 2006 Rep. 2009, 2, 197–334. [Google Scholar]
- ICRP (International Commission on Radiological Protection). Lung Cancer Risk from Radon and Progeny and Statement on Radon. Ann. ICRP 2010, 40, 1–64. [Google Scholar] [CrossRef]
- Lario, J.; Sanchez-Moral, S.; Canaveras, J.C.; Cuezva, S.; Soler, V. Radon continuous monitoring in Altamira Cave (northern Spain) to to assess user’s annual effective dose. J. Environ. Radioact. 2005, 80, 161–174. [Google Scholar] [CrossRef]
- Vaupotic, J. Nanosize radon short-lived decay products in the air of the Postojna Cave. Sci. Total Environ. 2008, 393, 27–38. [Google Scholar] [CrossRef]
- Kávási, N.; Somlai, J.; Szeiler, G.; Szabó, B.; Schafer, I.; Kovács, T. Estimation of effective doses to cavers based on radon measurements carried out in seven caves of the Bakony Mountains in Hungary. Radiat. Meas. 2010, 45, 1068–1071. [Google Scholar] [CrossRef]
- Tsvetkova, T.; Przylibski, T.A.; Nevinskaya, I.; Nevinskaya, V. Measurement of radon in the East Europe under the ground. Radiat. Meas. 2005, 40, 98–105. [Google Scholar] [CrossRef]
- Sainz, C.; Quindós, L.S.; Fuent, I.; Nicolás, J.; Luis, Q. Analysis of the main factors affecting the evaluation of the radon dose in workplaces: The case of tourist caves. J. Hazar. Math. 2007, 145, 368–371. [Google Scholar] [CrossRef] [PubMed]
- Racovita, G.; Boghean, V.; Petrescu, M. Le bilan topoclimatique de la grotte du Closani (Monts Mehedinti, Roumanie). Appl. Karstol. 1993, 6, 7–86. [Google Scholar]
- Racovita, G.; Moldovan, O.; Rajka, G. Données préliminaires sur l’environement de la Grotte des Ours en régime d’exploitation touristique. Apppl. Karstol. 1999, 11–12, 61–74. [Google Scholar]
- Borda, C.; Borda, D. Airborne microorganisms in show caves from Romania. Trav. Inst. Spéol. Emile Racovitza 2005, 43–44, 65–73. [Google Scholar]
- Fejer, A.; Moldovan, O.T. Population size and dispersal patterns for a Drimeotus (Coleoptera, Leiodidae, Leptodirini) cave population. Subt. Biol. 2013, 11, 31–44. [Google Scholar]
- Soficaru, A.; Dobos, A.; Trinkaus, E. Early modern humans from the Peştera Muierii, Baia de Fier, Romania. Proc. Nati. Acad. Sci. USA 2006, 103, 17196–17201. [Google Scholar] [CrossRef]
- Mirea, I.-C.; Robu, M.; Petculescu, A.; Kenesz, M.; Faur, L.; Arghir, R.; Tecsa, V.; Timar-Gabor, A.; Roban, R.-D.; Panaiotu, C.-G.; et al. Last deglaciation flooding events in the South Carpathians as revealed by the study of cave deposits from Muierilor Cave, Romania. Palaeogeogr. Palaeoclim. Palaeoecol. 2020, 562, 110084. [Google Scholar] [CrossRef]
- Moldovan, O.T.; Iepure, S.; Brad, T.; Kenesz, M.; Mirea, I.C.; Năstase-Bucur, R. Database of Romanian cave invertebrates with a Red List of cave species and a list of hotspot/coldspot caves. Biodiv. Data J. 2020, 8, e53571. [Google Scholar] [CrossRef]
- Bercea, S.; Nastase-Bucur, R.; Mirea, I.C.; Mantoiu, D.S.; Kenesz, M.; Petculescu, A.; Baricz, A.; Andrei, A.-S.; Banciu, H.L.; Papp, B.; et al. Novel approach to microbiological air monitoring in show caves. Aerobiology 2018, 34, 445–468. [Google Scholar] [CrossRef]
- Moldovan, O.-T.; Bercea, S.; Nastase-Bucur, R.; Constantin, S.; Kenesz, M.; Mirea, I.C.; Petculescu, A.; Robu, M.; Arghir, R.A. Management of water bodies in show caves—A microbial approach. Tour. Manag. 2020, 78, 104037. [Google Scholar] [CrossRef]
- Burghele, B.D.; Cucoș, A.; Papp, B.; Dicu, T.; Pressyanov, D.; Dimitrov, D.; Dimitrova, I.; Constantin, S. Comparative study of radon and thoron measurements in four Romanian show caves. Radiat. Prot. Dosim. 2017, 177, 181–185. [Google Scholar] [CrossRef] [PubMed]
- Burghele, B.D.; Cucos, A.; Papp, B.; Stetca, F.A.; Mirea, I.; Constantin, S. Distribution of Radon gas in Romanian show caves and radiation safety. Radiat. Prot. Dosim. 2018, 181, 1–5. [Google Scholar] [CrossRef] [PubMed]
- Ponta, G.; Aldica, G. Peşteri din Cheile Olteţului—Polovragi. Bul. Speologic 1985, 10, 245–268. [Google Scholar]
- Constantin, S.; Robu, M.; Munteanu, C.M.; Petculescu, A.; Vlaicu, M.; Mirea, I.; Kenesz, M.; Drăguşin, V.; Hoffmann, D.; Anechitei, V.; et al. Reconstructing the evolution of cave systems as a key to understanding the taphonomy of fossil accumulations: The case of Urşilor Cave (Western Carpathians, Romania). Quat. Int. 2014, 339–340, 25–40. [Google Scholar] [CrossRef]
- Rusu, T.; Racoviță, T.; Crăciun, V. La grotte du Meziad. Aspects physico-géographiques, genèse et evolution de la cavité. Trav. Instit. Spéol. E Racovitza 1974, 13, 147–173. [Google Scholar]
- Sibson, R. A brief description of natural neighbor interpolation, interpolating multivariate data. In Multivariate Data; Barnett, V., Ed.; Wiley: New York, NY, USA, 1981; pp. 21–36. [Google Scholar]
- Azuma, K.; Kagi, N.; Yanagi, U.; Osawa, H. Effects of low-level inhalation exposure to carbon dioxide in indoor environments: A short review on human health and psychomotor performance. Environ. Int. 2018, 121, 51–56. [Google Scholar] [CrossRef]
- *** Norme generale de protectia muncii. (in Romanian in original; General norms for work protection). OMMSS 508/2002. 2002.


Publisher’s Note: MDPI stays neutral with regard to jurisdictional claims in published maps and institutional affiliations. |
© 2021 by the authors. Licensee MDPI, Basel, Switzerland. This article is an open access article distributed under the terms and conditions of the Creative Commons Attribution (CC BY) license (http://creativecommons.org/licenses/by/4.0/).