
Environmental Effects of Eco-Driving on Courier Delivery


Abstract
1. Introduction
- Fleet management system: companies which have used them have reduced emissions from their logistical processes by up to 2% each year [9].
- Natural gas vehicles: in 2017, gas consumption grew by 9% in Spain and is expected to take off from 2020 [10].
- Megatruck: according to a study by the European Commission [11], megatrucks (European Modular System Truck) can reduce fuel consumption by up to 20%, CO2 by 20%, and emissions of other pollutants such as NOx (nitrogen oxides) by 40%.
- Eco-driving: according to the guide on Eco-Driving of Industrial Vehicles from the Institute for the Diversification and Saving of Energy of Spain [12], eco-driving enables average savings of 10% in fuel.
2. Literature Review
- To estimate consumption and emissions given off by couriers in normal driving and after attending a theoretical training course, with eco-driving in a small and non-congested city such as Caceres (Spain). To evaluate the reduction in fuel consumption and CO2 emissions in eco-driving.
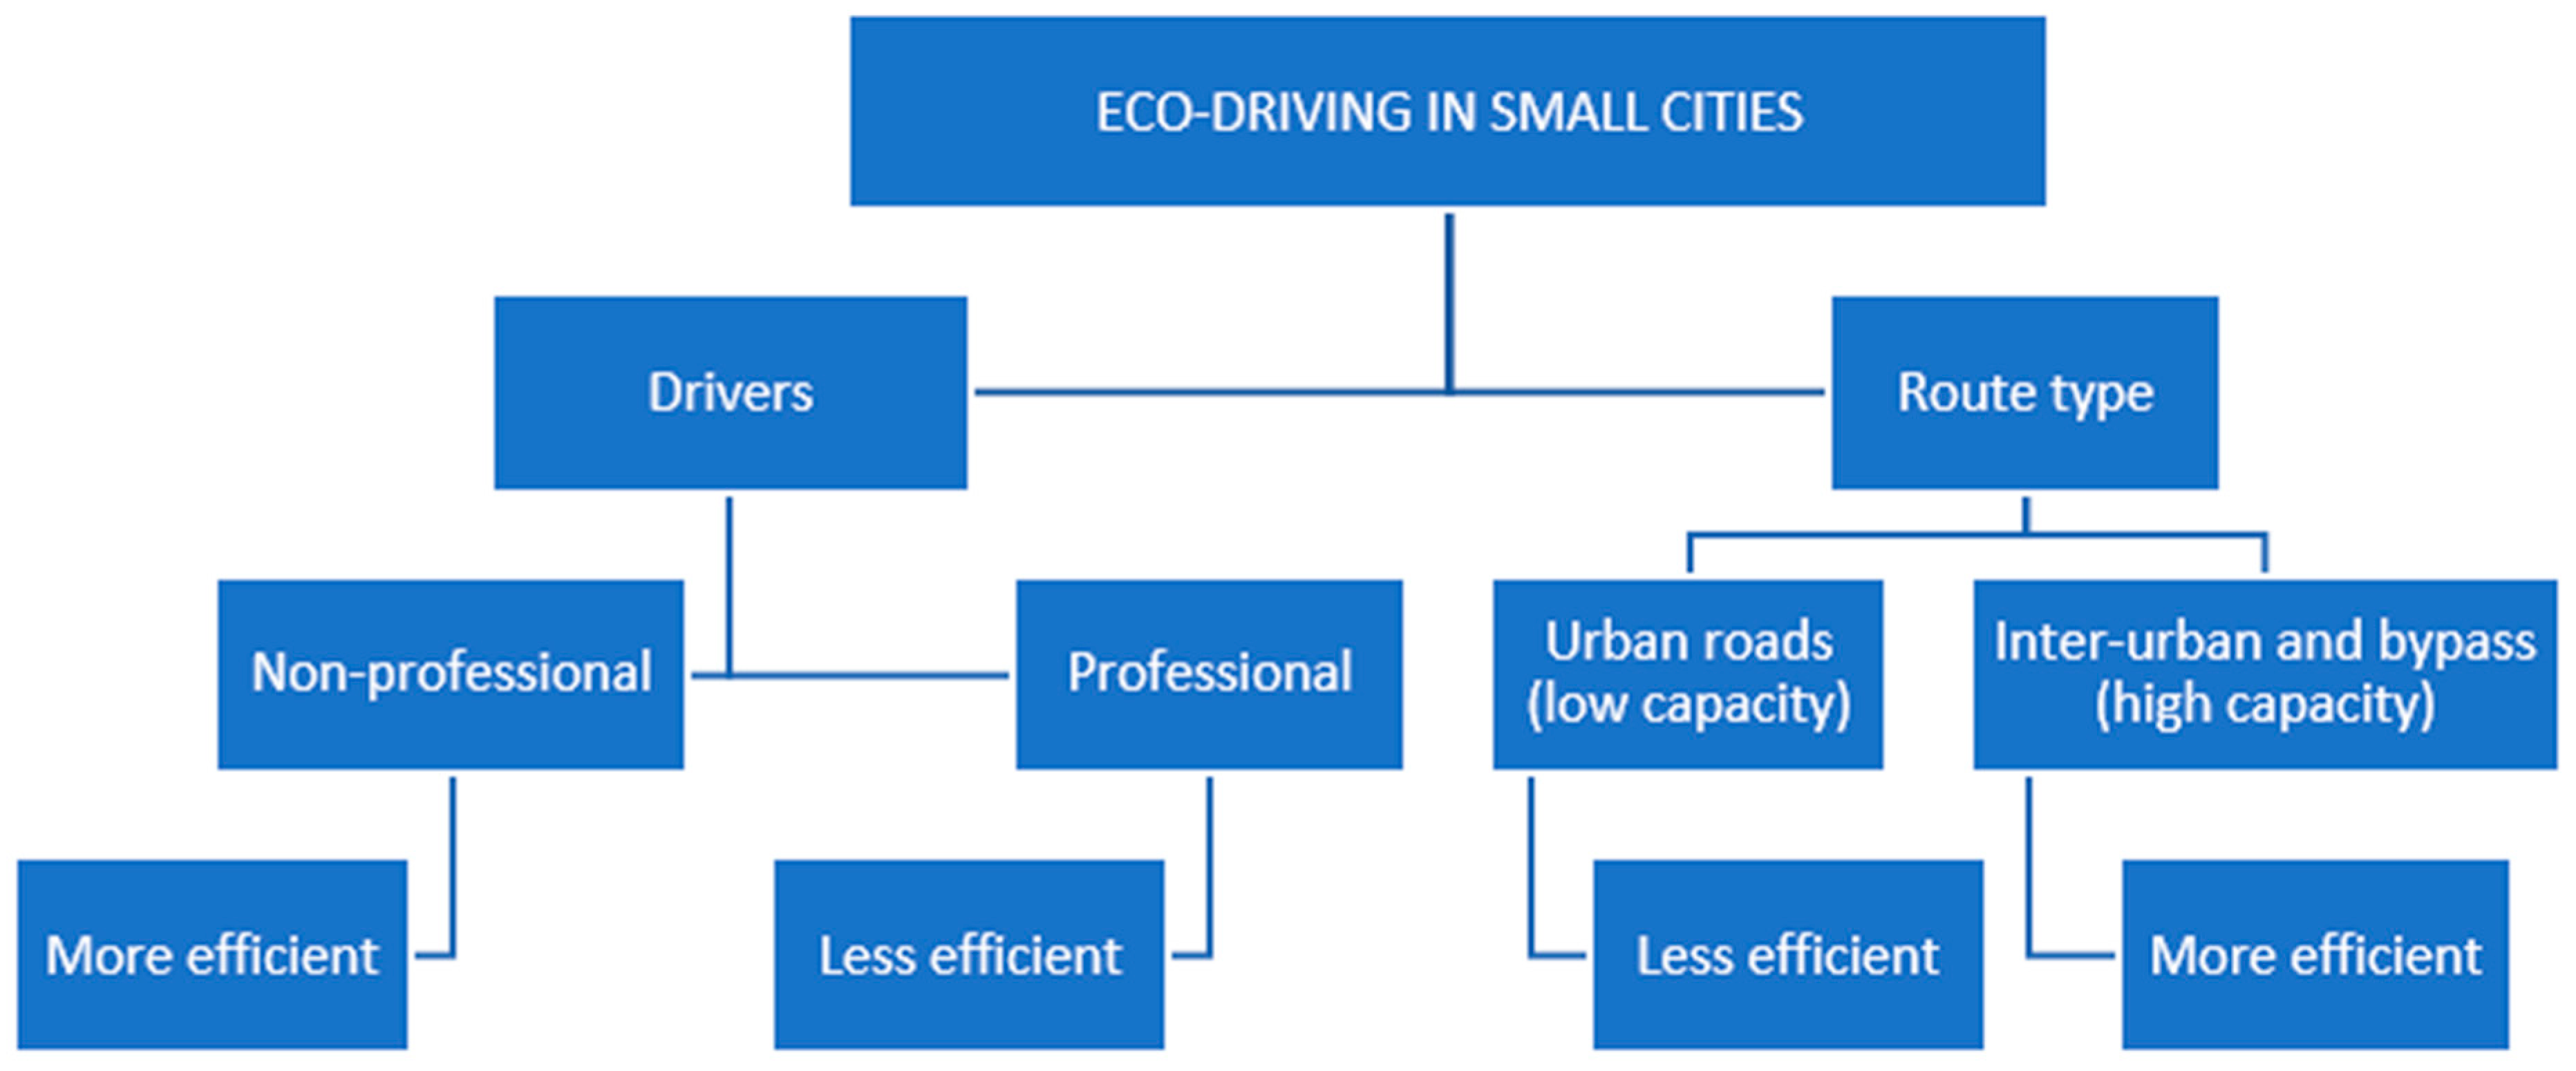
- To evaluate the efficient of eco-driving by road type.
- To study through surveys, the perception of professional drivers on eco-driving techniques and how they apply them to everyday driving.
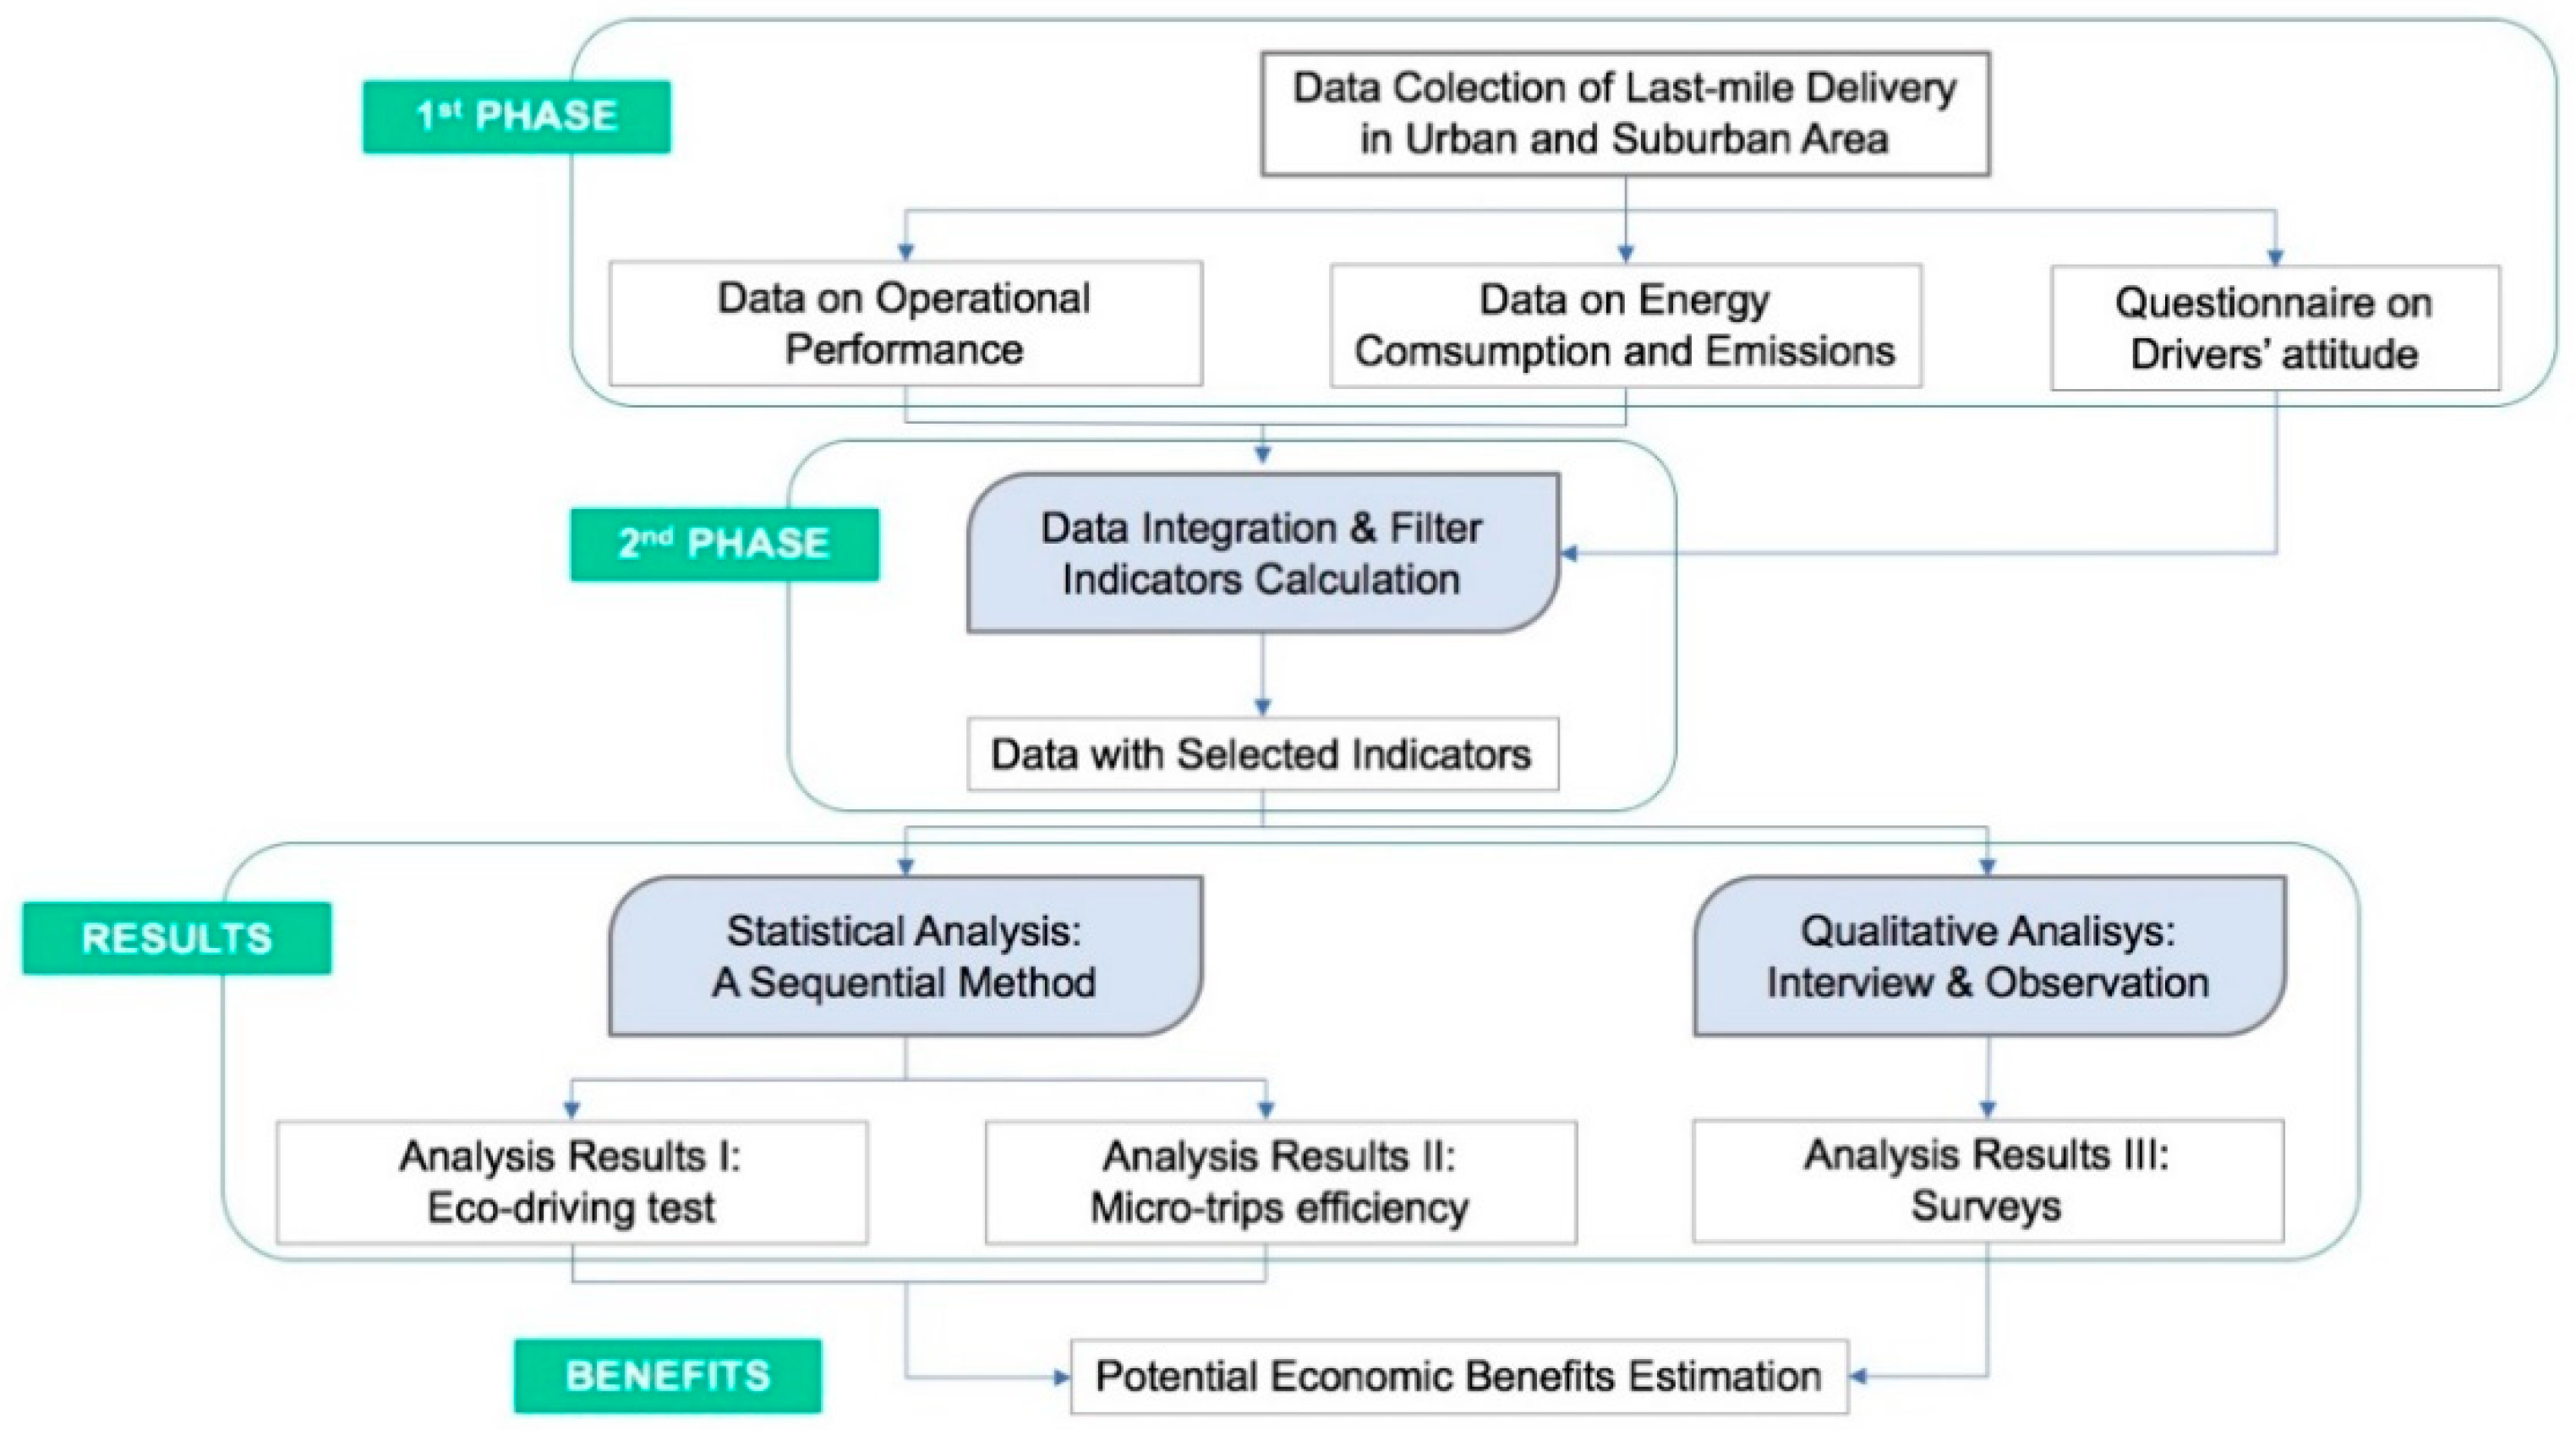
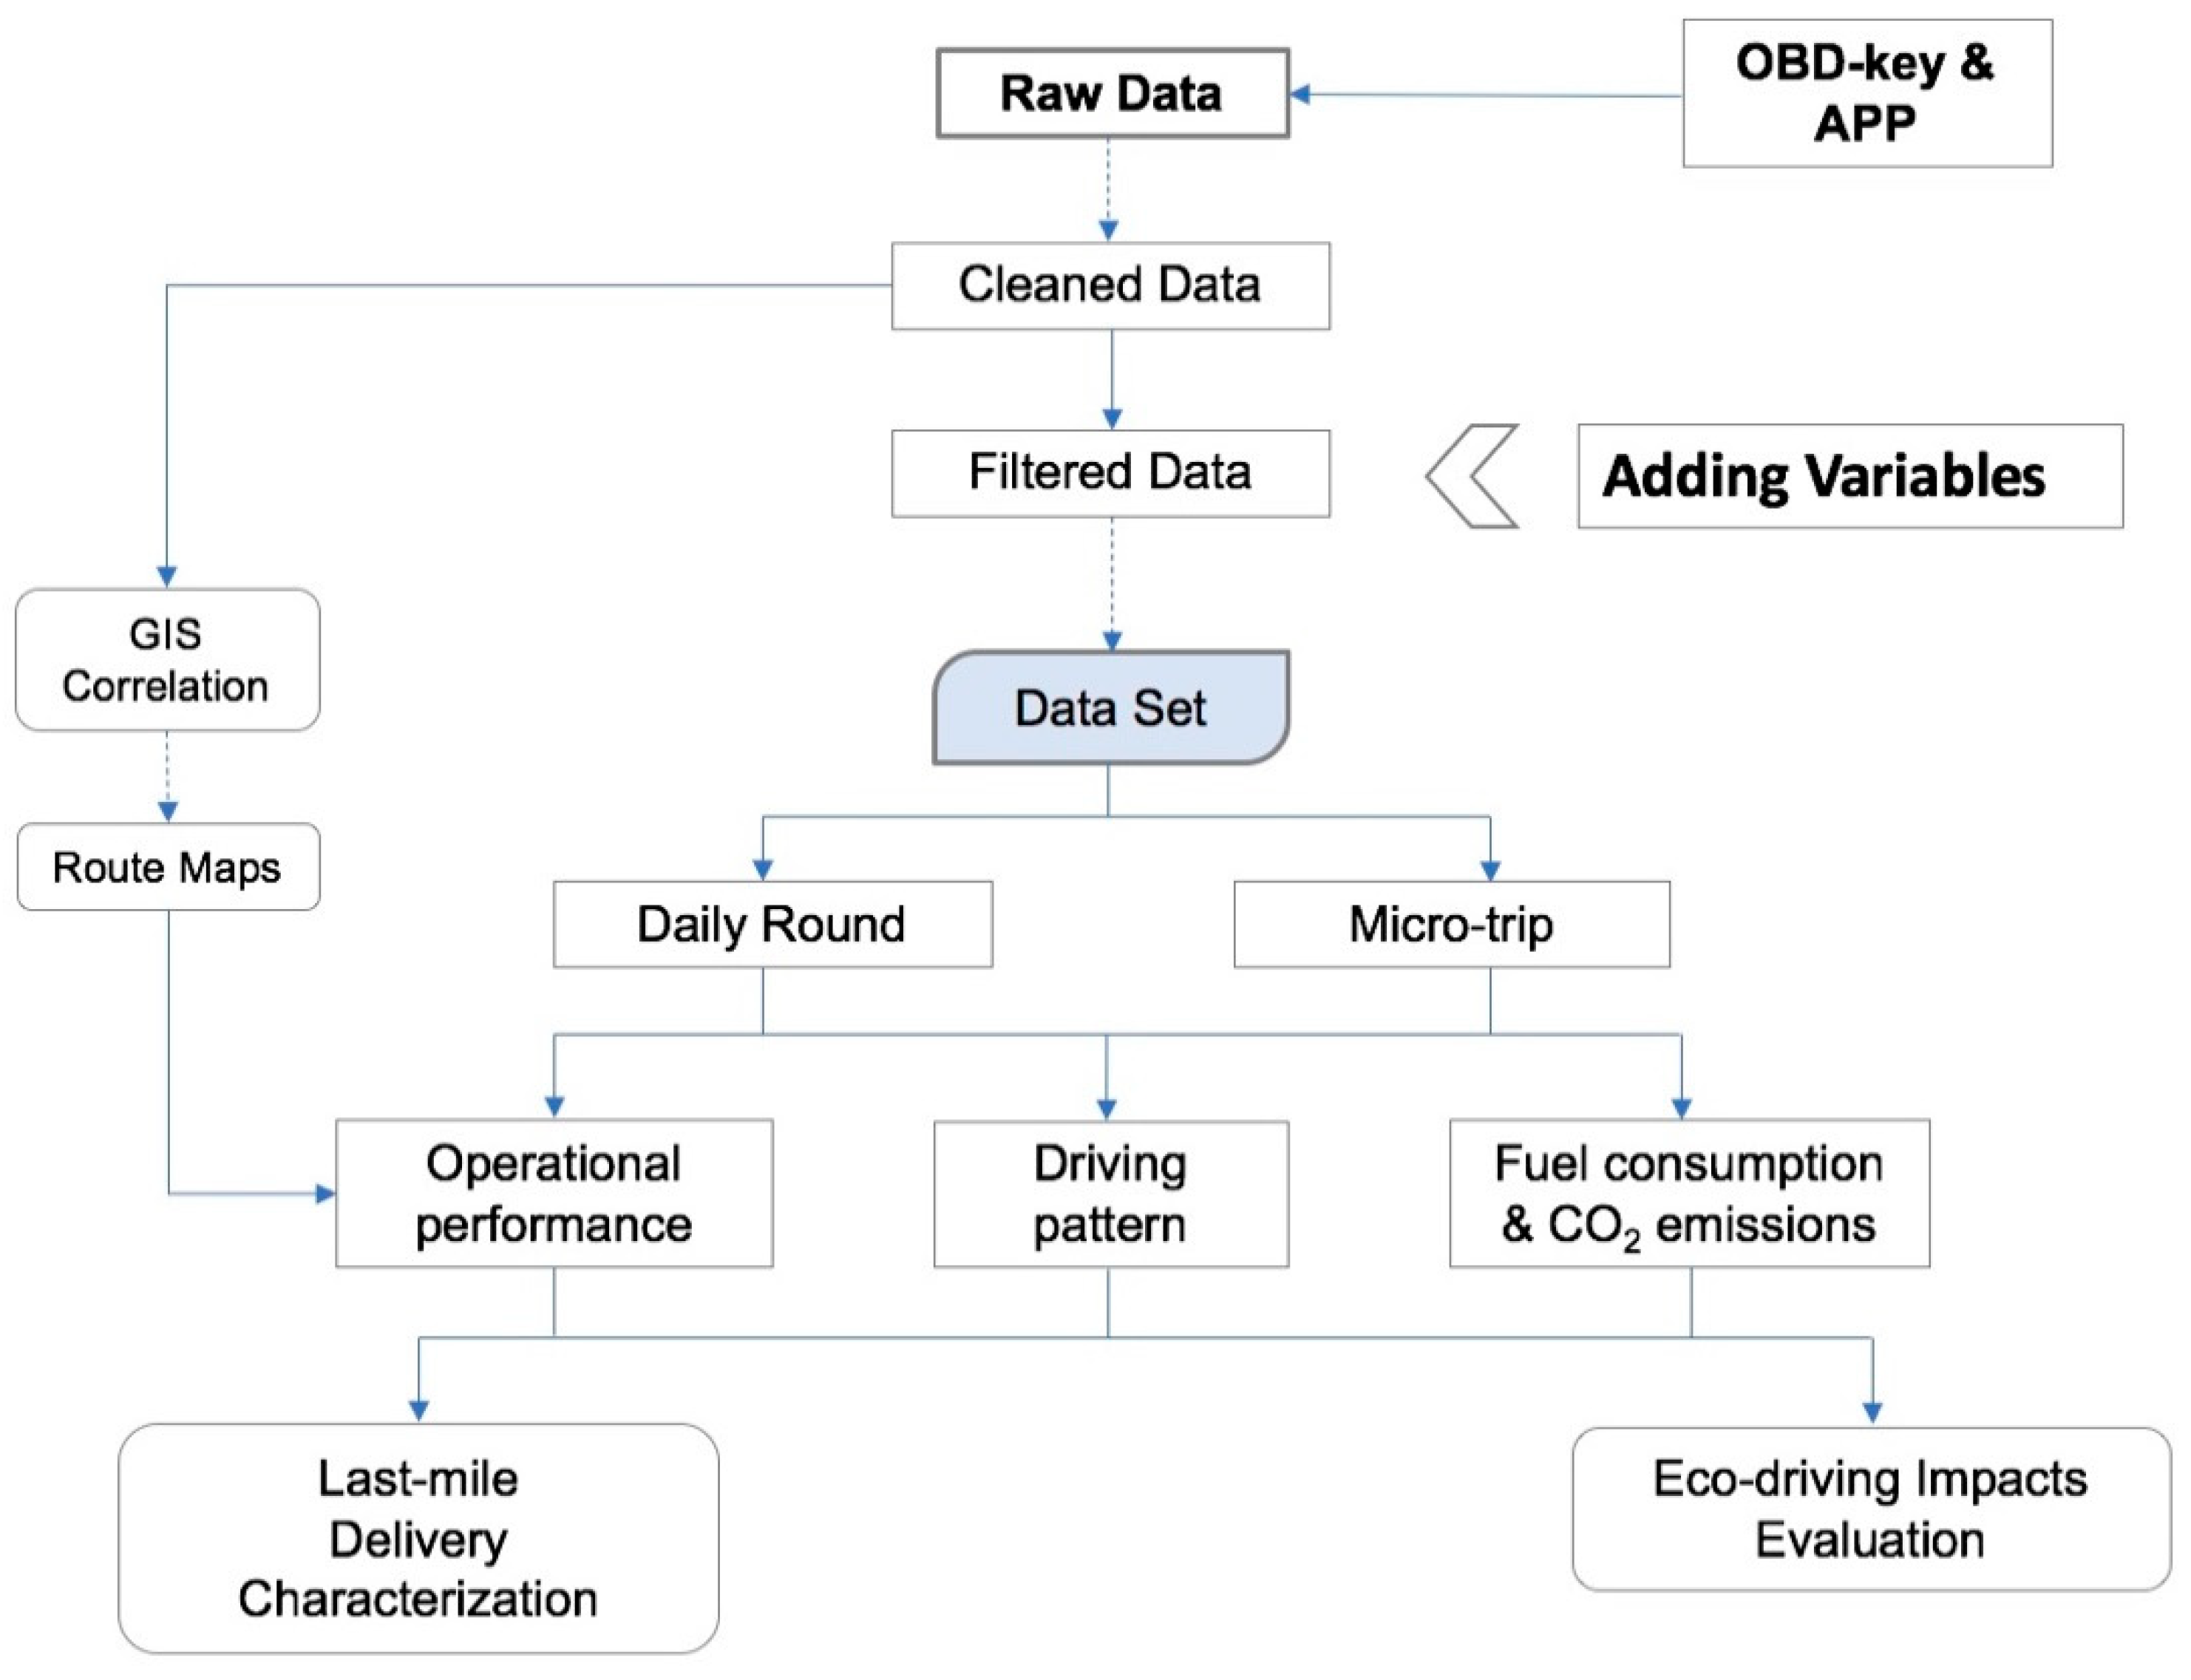
3. Materials and Methods
3.1. First Phase: Collecting Data on the Activity of Vehicles on the Road
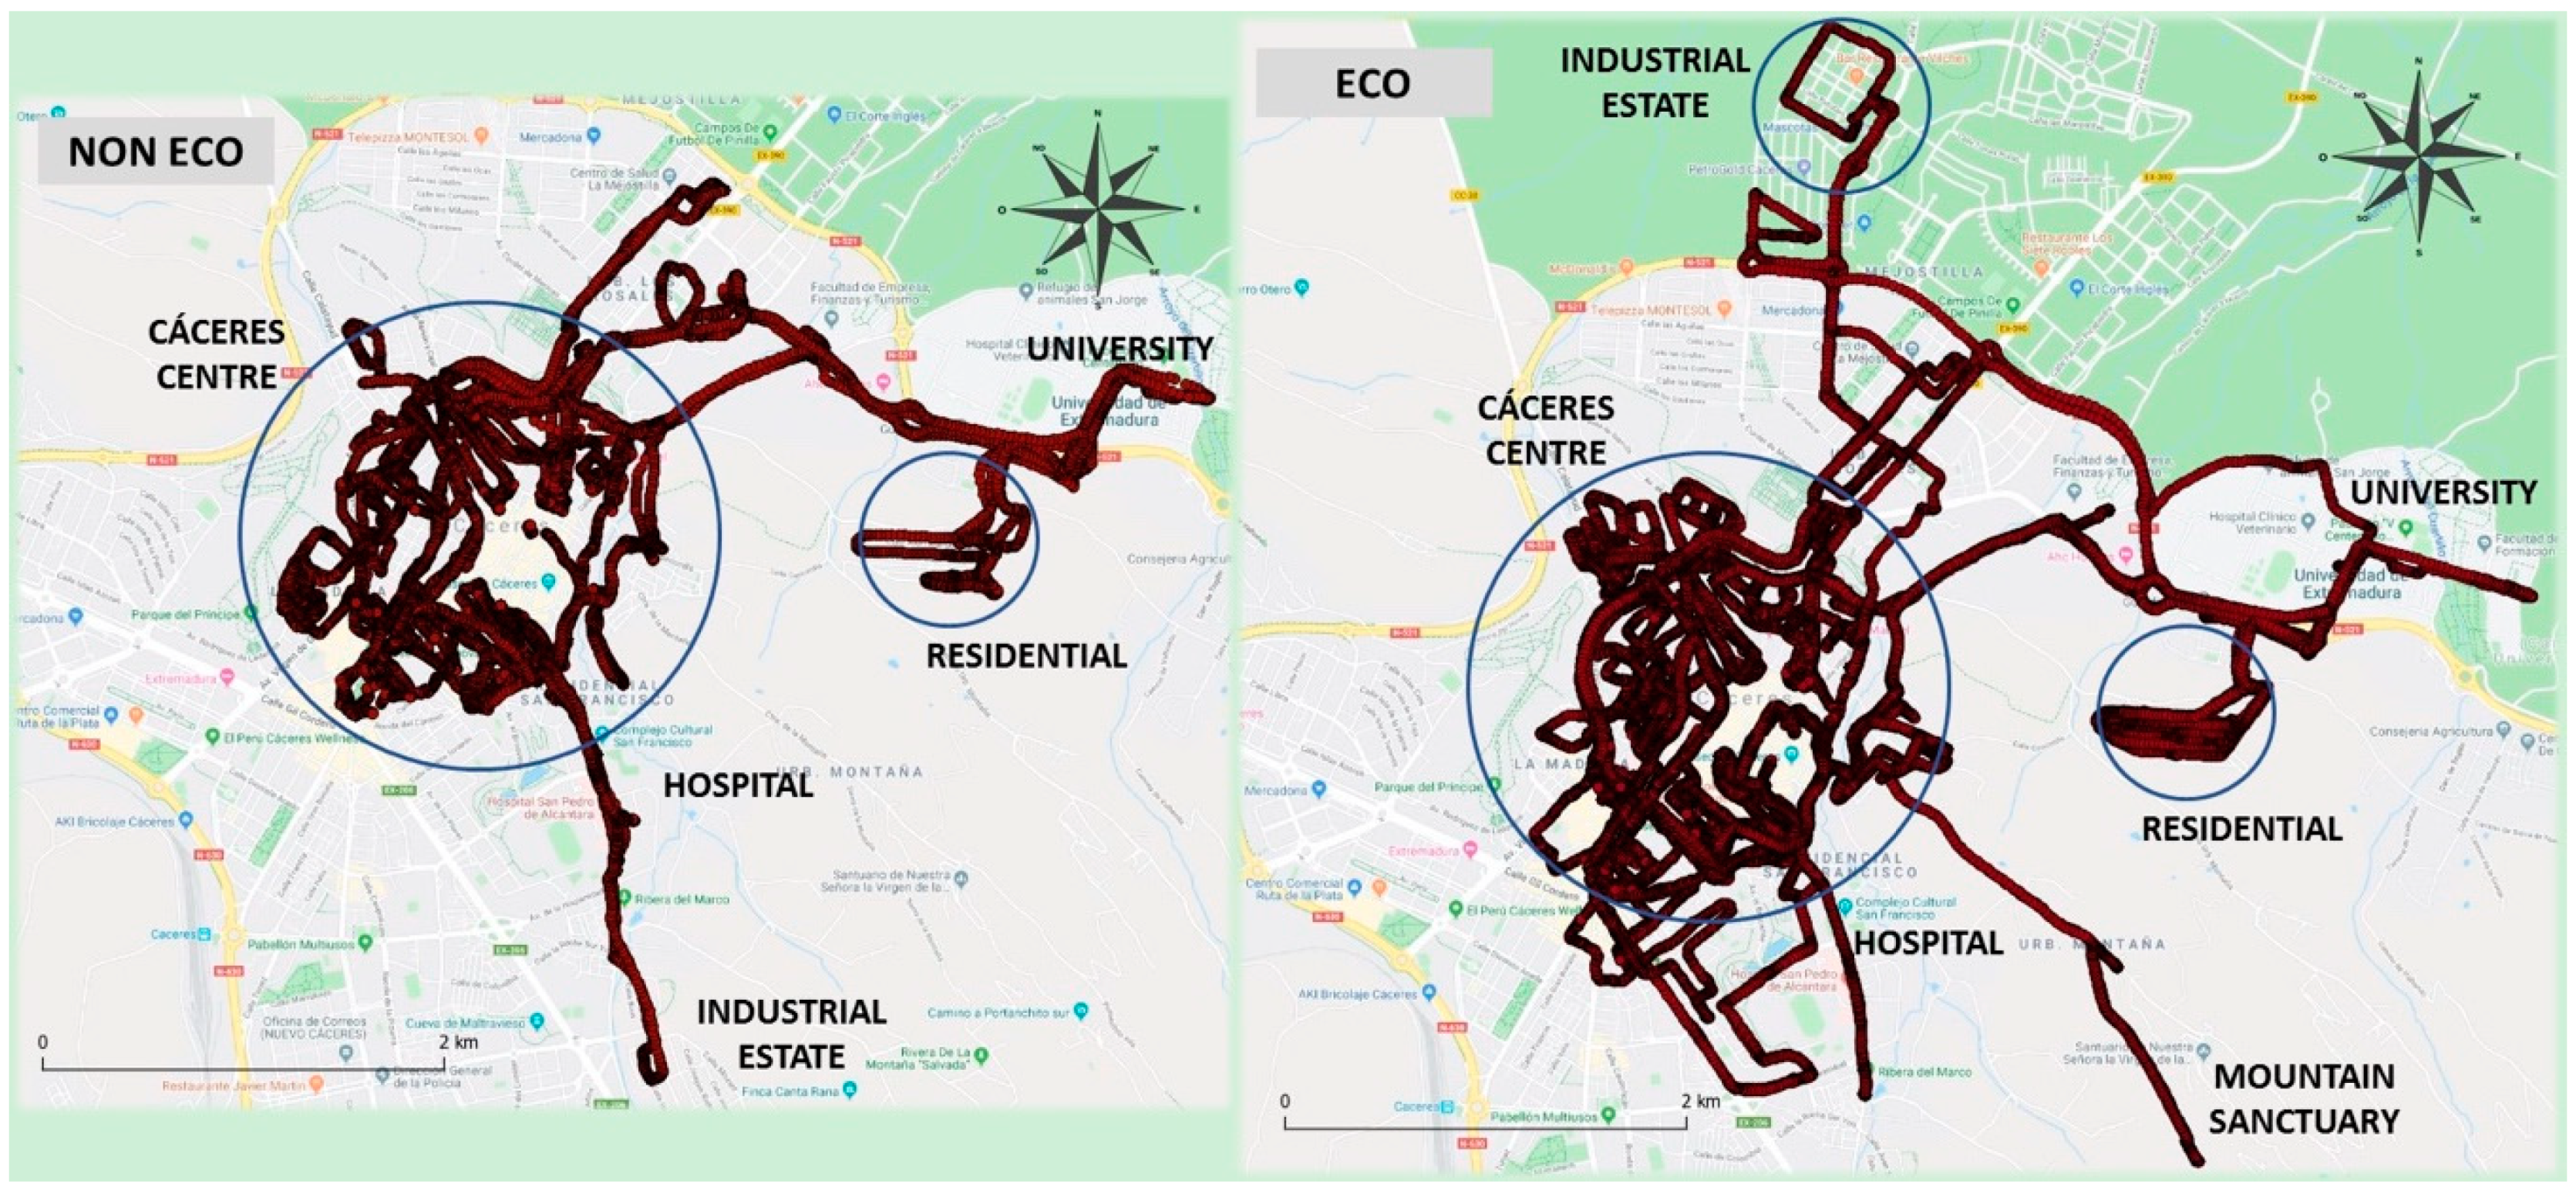
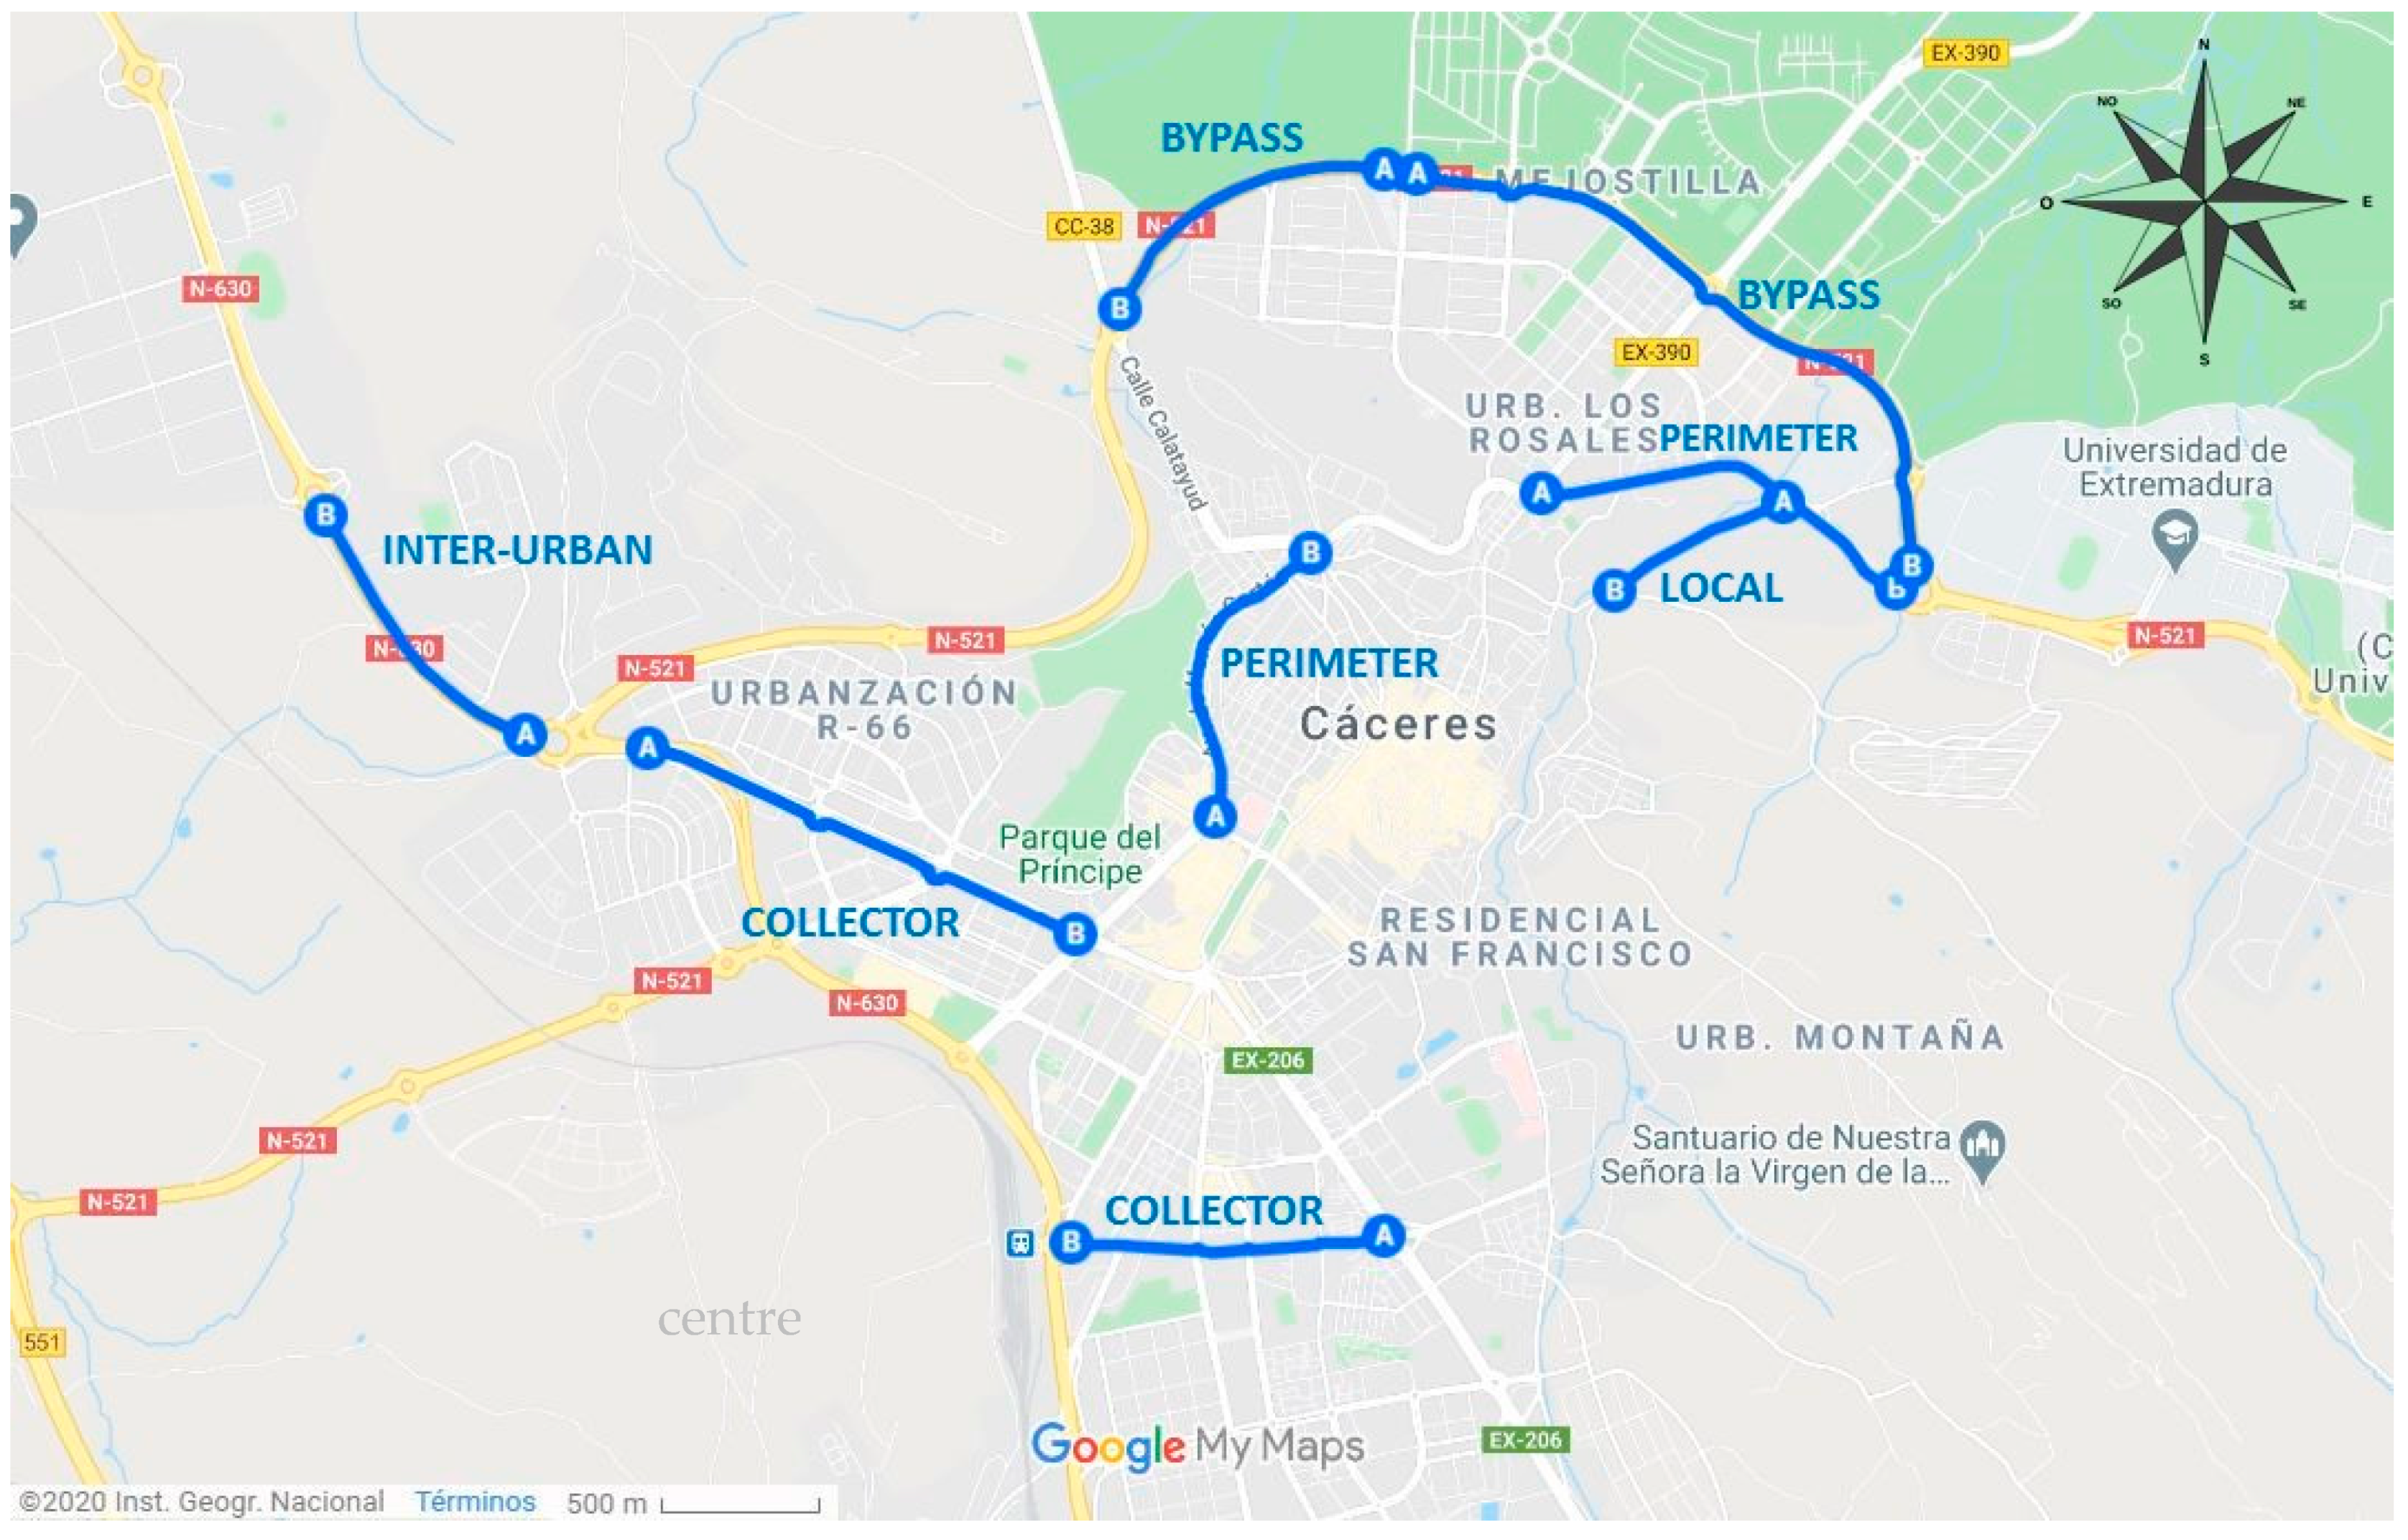
3.1.1. Case Study: City of Caceres, Spain
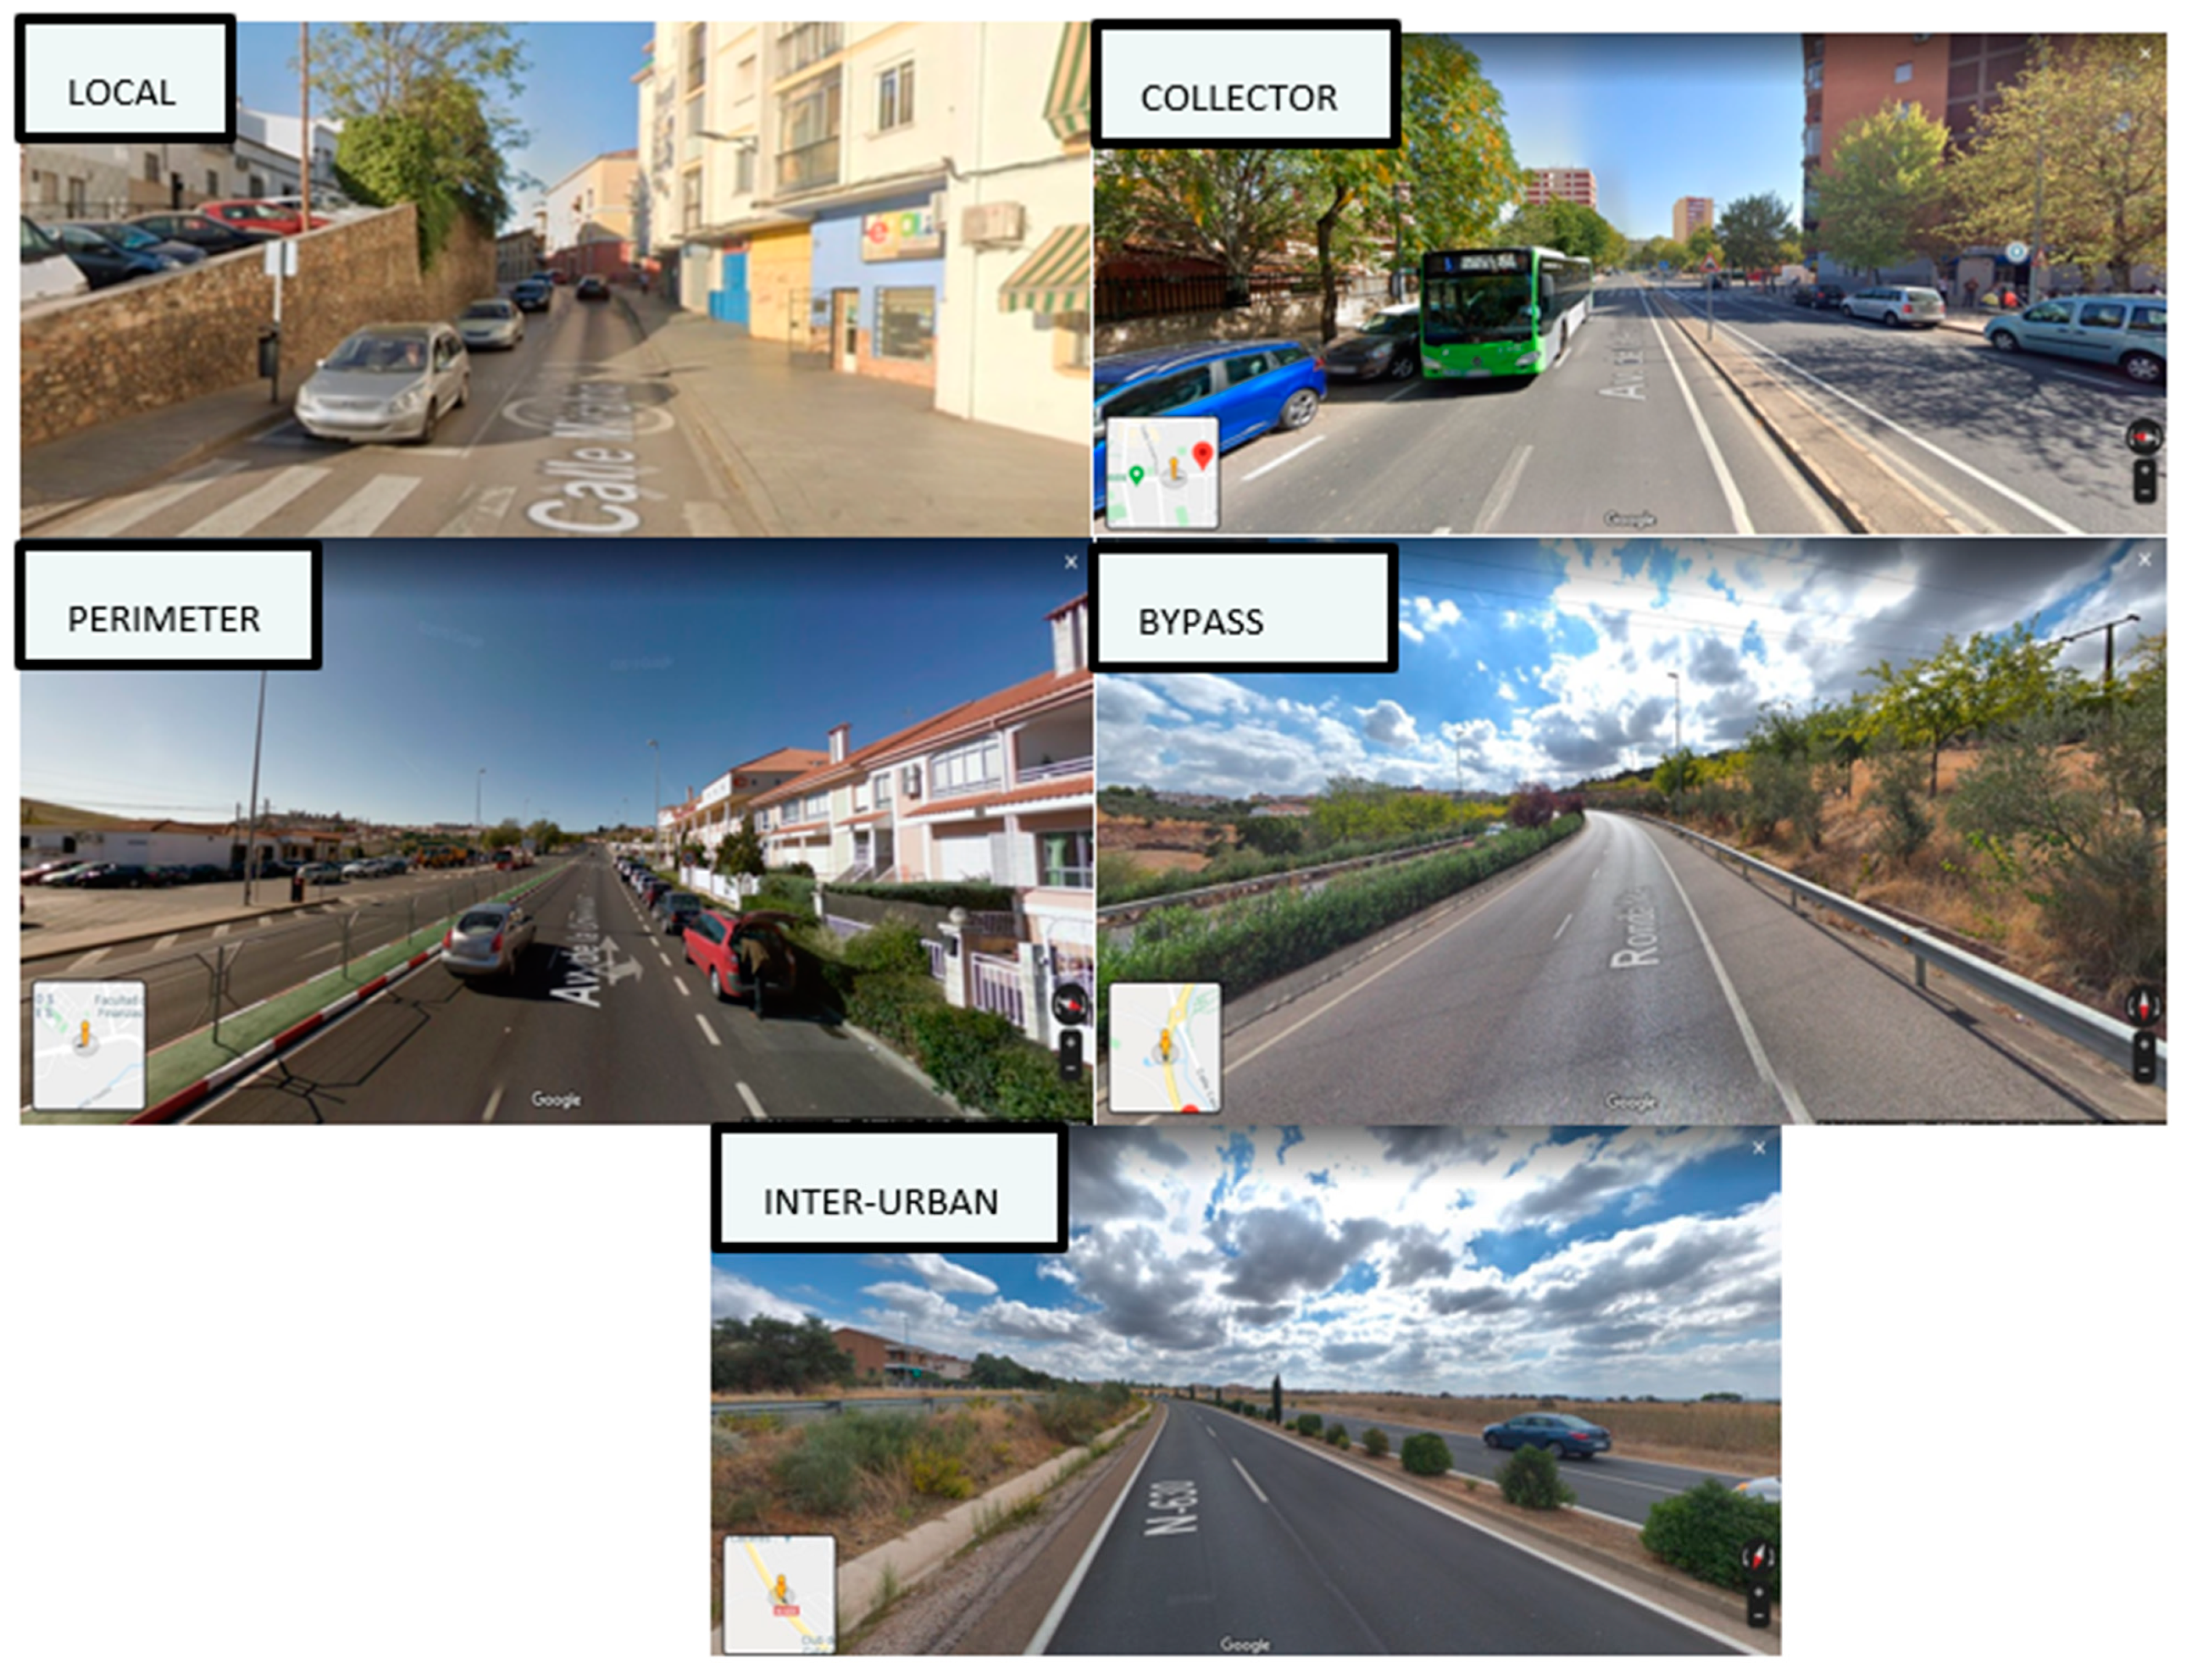
3.1.2. Routes and Traffic Conditions
- Local street: this type of urban road can be seen inside the city. The road has one lane per direction, with no median or parking spaces. The speed limit is 50 km/h and it is usually congested.
- Urban collector: a road that surrounds the center of the city and connects its hubs. It is made up of two lanes each way, a median, and with parking spaces on each side. The speed limit ranges between 30 km/h and 50 km/h and it is sometimes congested.
- Perimeter road: former city bypass now integrated into the urban network. It has a dual carriageway with two lanes in each direction separated by a double continuous line or median. The speed limit is 50 km/h, and there is hardly any traffic congestion.
- Bypass: an outer ring road surrounding the outskirts of the city. Intersections are arranged with roundabouts and pedestrian crossings are regulated through traffic lights. Speed limits are between 40 and 80 km/h. It is never congested.
- Interurban road: roads located outside the boundaries of the urban area that connect external points to it, whether they are smaller population centers, industrial centers or other national roads or highways. Speed limits vary between 50 and 90 km/h and traffic usually flows very well with no congestion.
3.1.3. Driver Selection, Eco-Driving Training and Dates
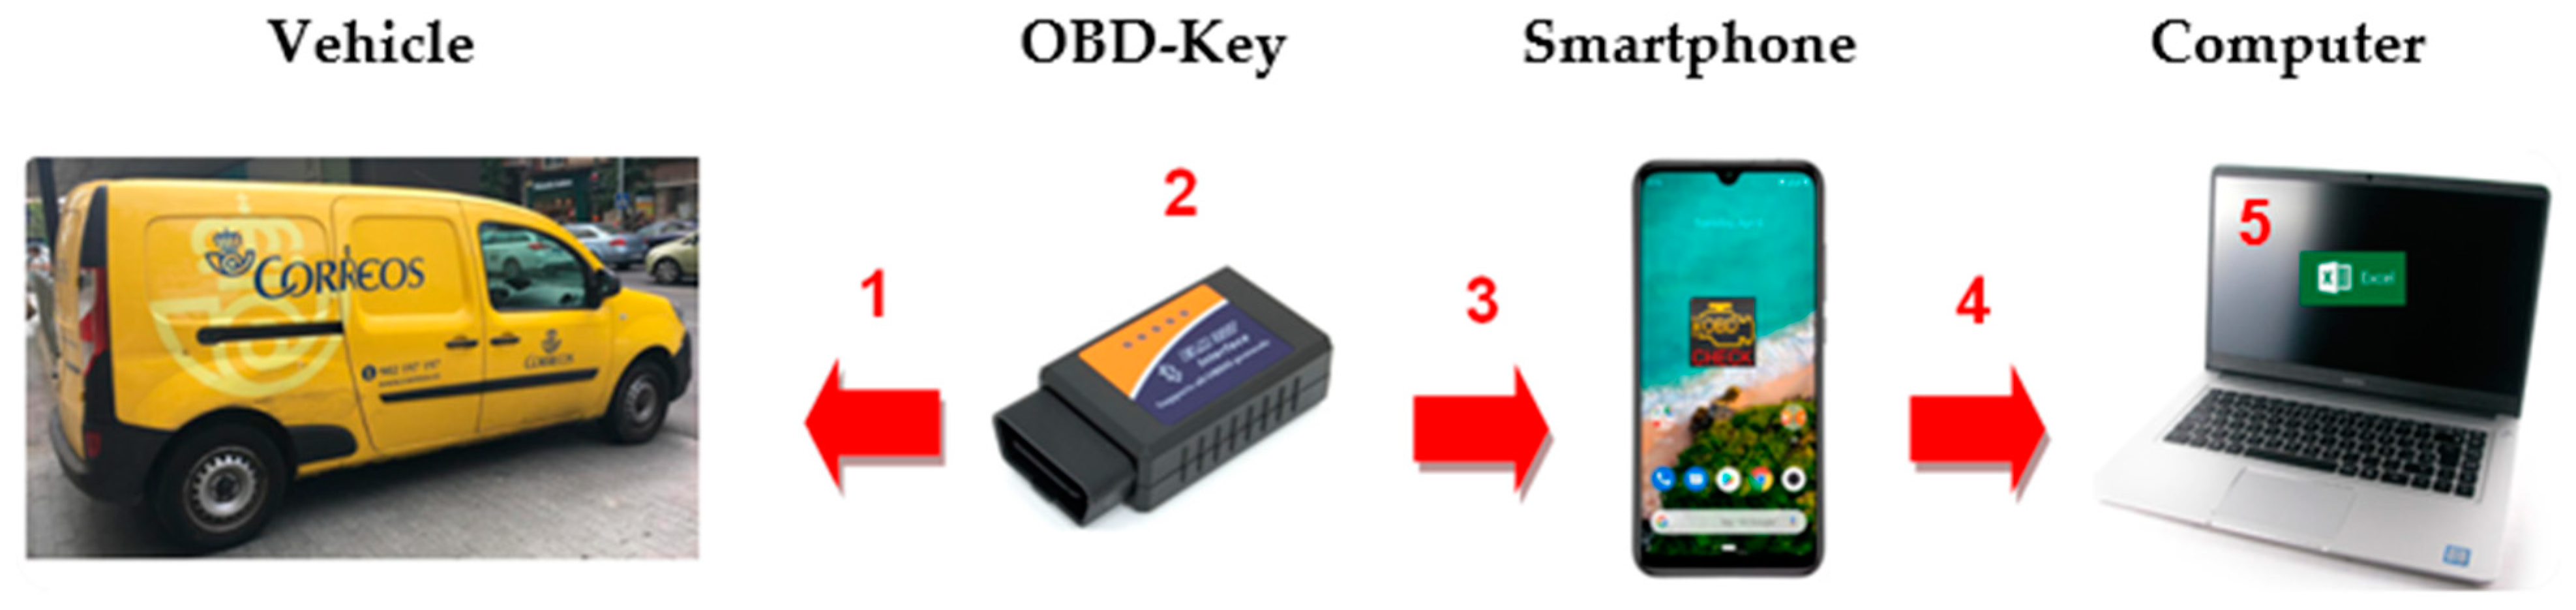
3.1.4. Collection of Experimental Data
3.1.5. Measurement of Variables
- GPS position (longitude and latitude) and distance travelled (km).
- Travel time (h) and V95 (km/h).
- Maximum and average speed (km/h).
- Maximum and average rpm.
- Maximum and average accelerations and decelerations (m/s2).
- Fuel consumption (L/100 km) and CO2 emissions (g/km).
3.2. Second Phase: Analysis and Study of the Collected Data
4. Results
4.1. Eco-Driving Test
4.1.1. Driving Parameters
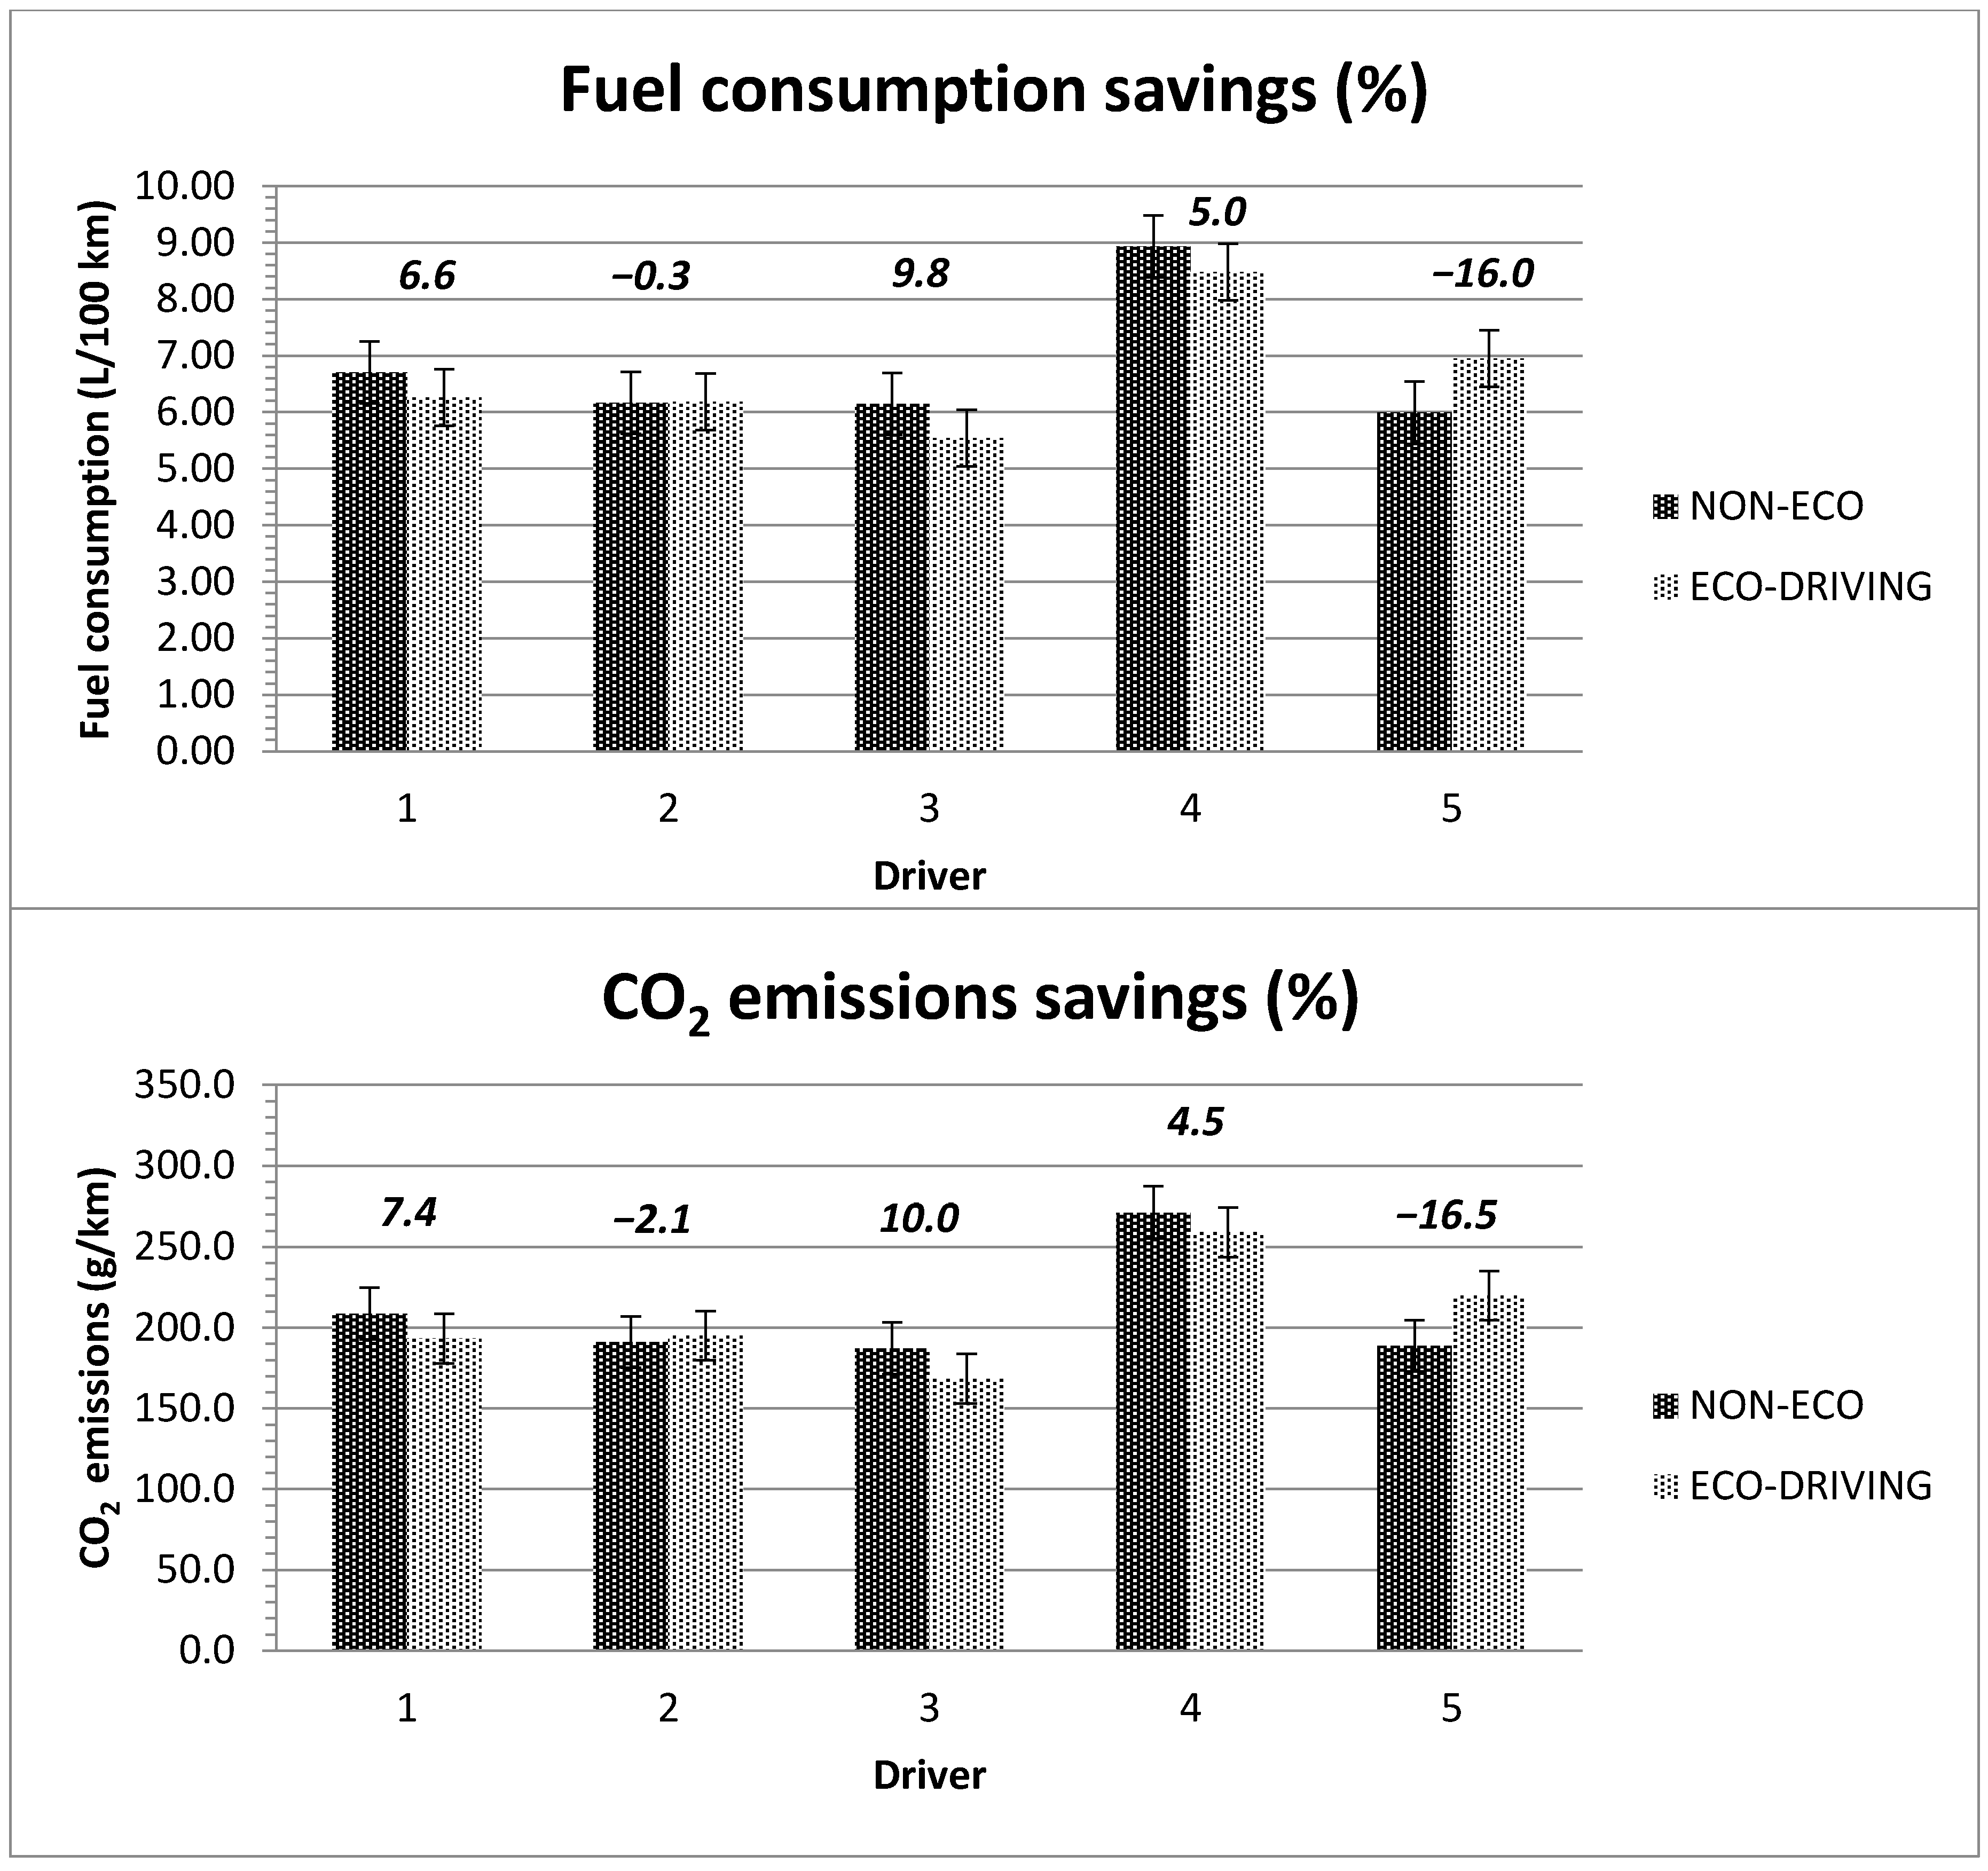
4.1.2. Consumption and Emissions
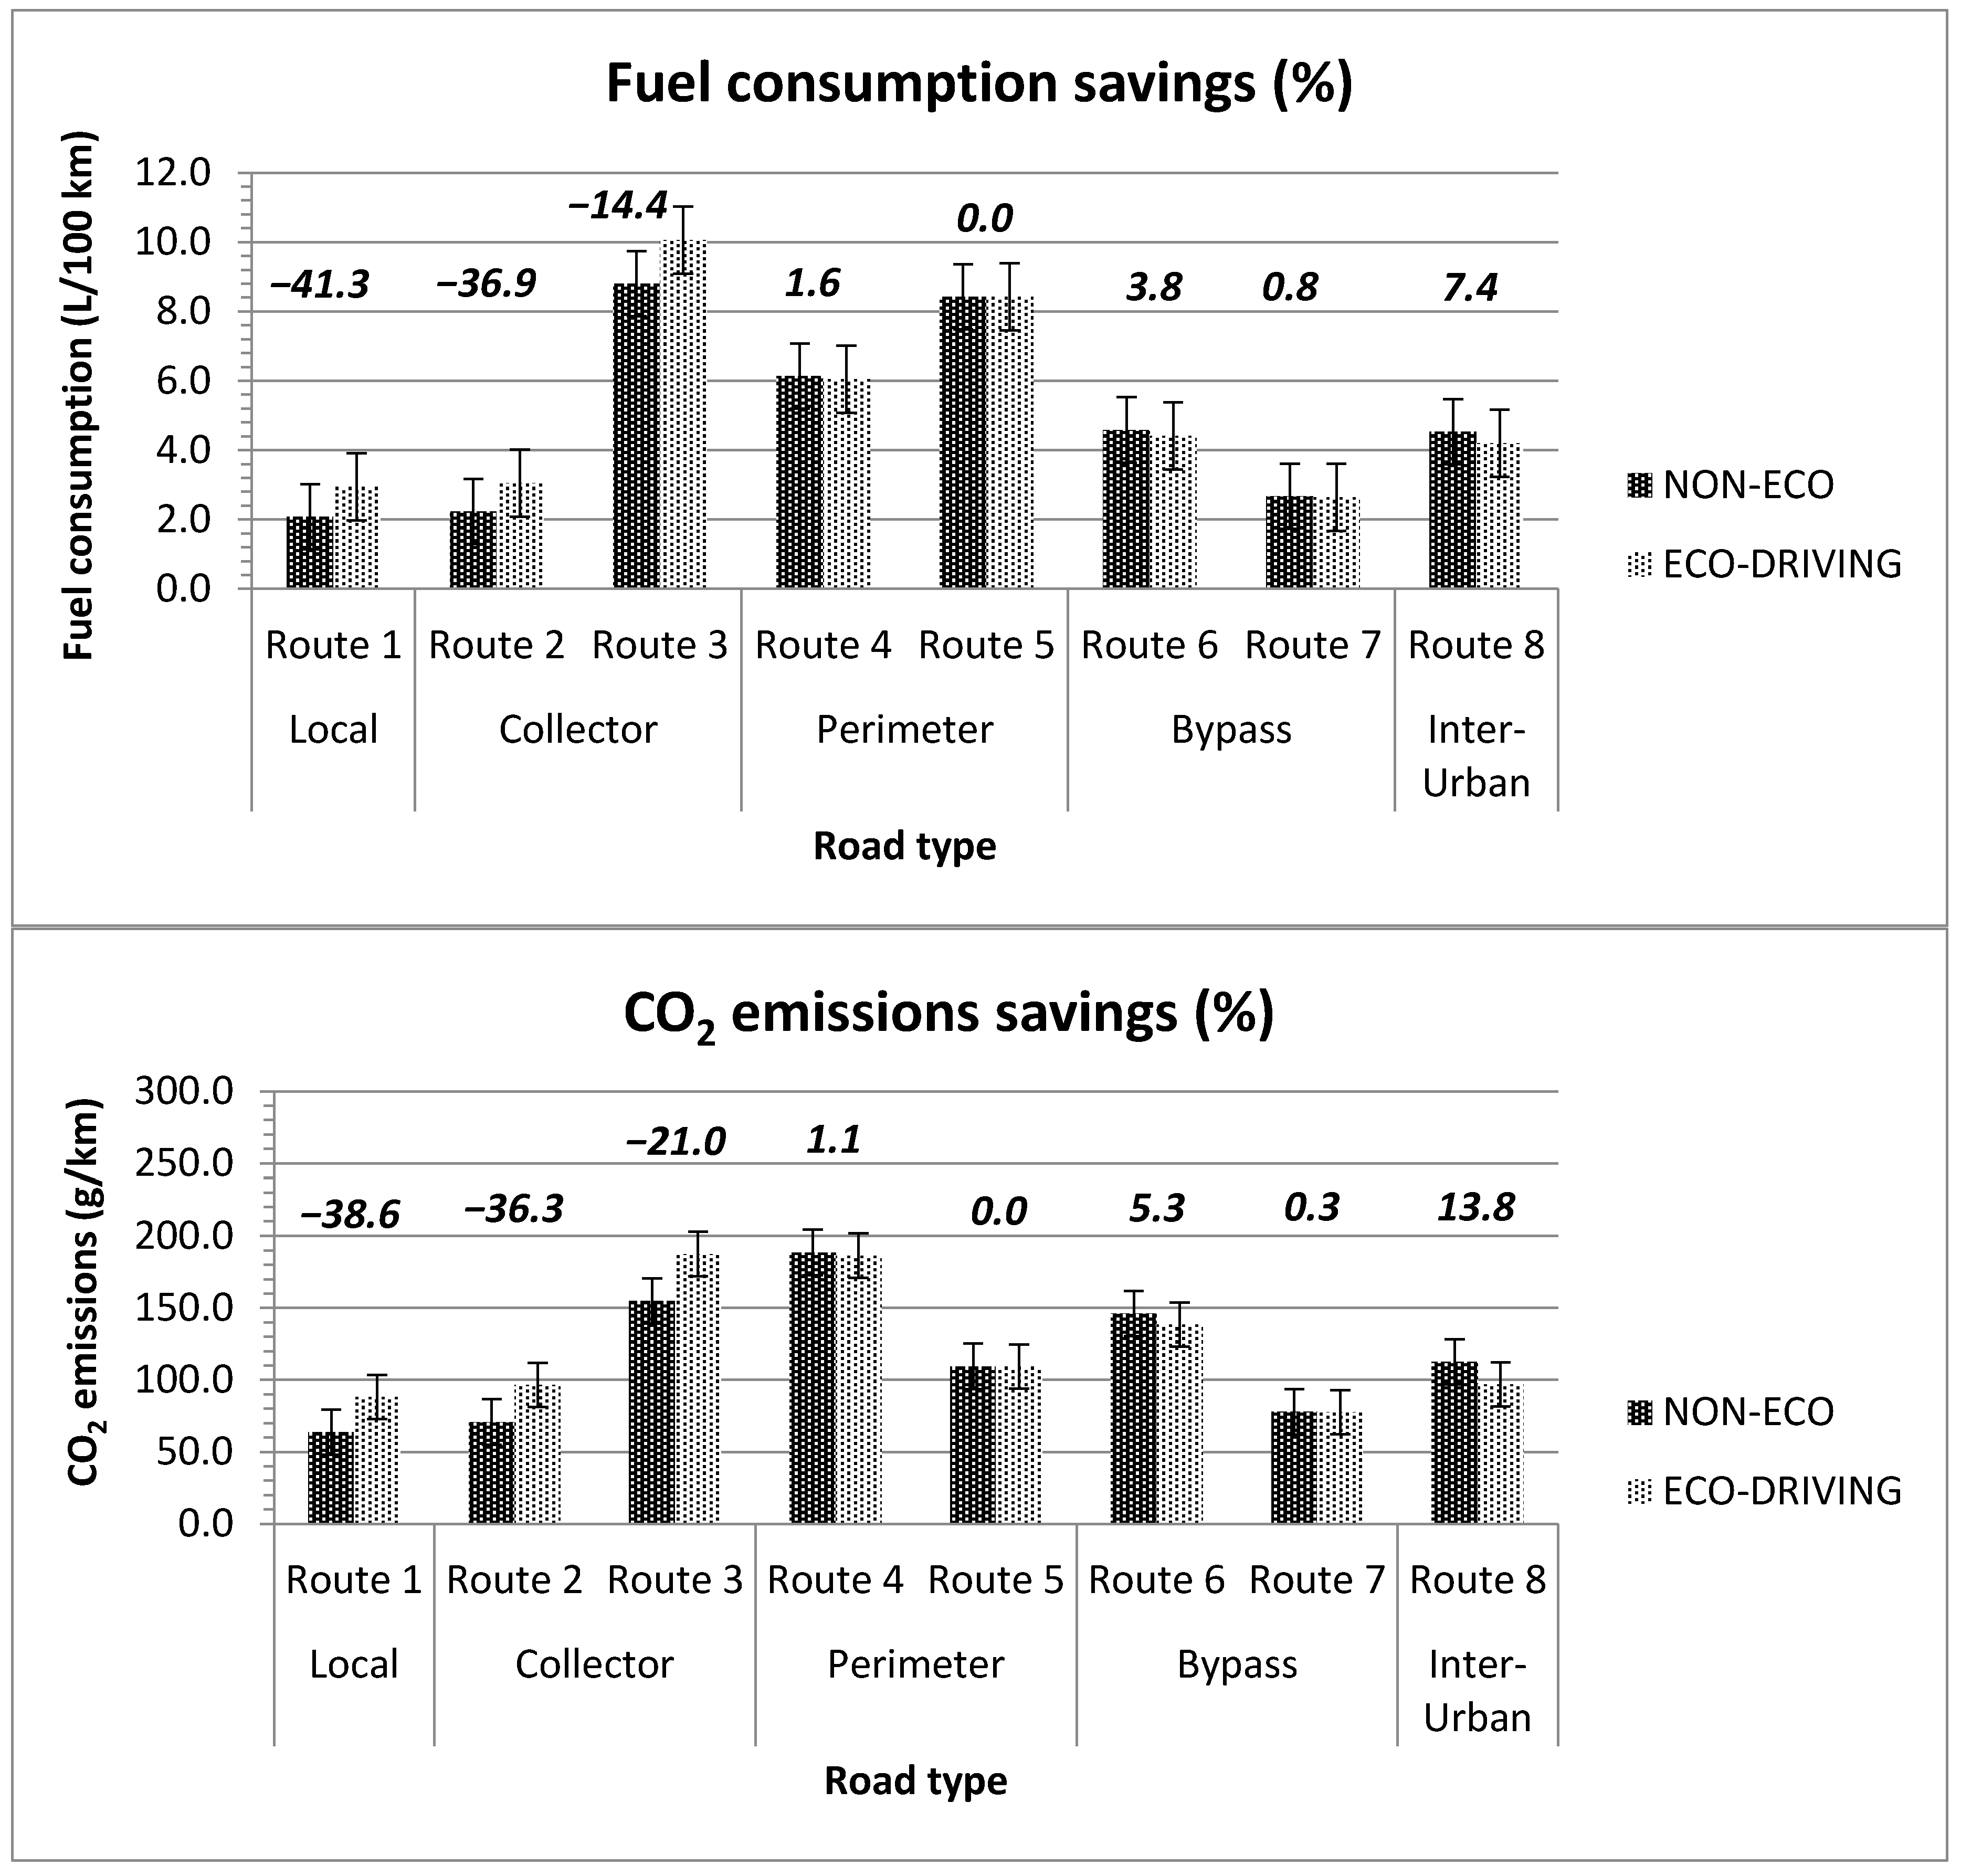
4.2. Efficiency of Eco-Driving in Micro-Trips
4.3. Surveys
5. Discussion
5.1. Research Limitations
5.2. Results Discussion
6. Conclusions and Future Research
Author Contributions
Funding
Data Availability Statement
Acknowledgments
Conflicts of Interest
Appendix A. Eco-Driving Course Content
- 1.
- Transportation and energy issues.
- 1.1.
- Energy consumption in Spain.
- 1.2.
- Problems generated by CO2 emissions.
- 2.
- Fundamentals of fuel consumption.
- 2.1.
- Fuel consumption in road transport.
- 2.2.
- Energy saving in transport.
- 3.
- Use of engine and its relationship with consumption.
- 3.1.
- Efficient driving concept (Eco-driving). Contributions of eco-driving.
- 3.2.
- The energy flow in the vehicle. Fuel consumption and power.
- 3.3.
- Idle effect.
- 3.4.
- Drag.
- 4.
- Explanation of eco-driving techniques. The driver’s attitude.
- 4.1.
- Prominence of the driver’s attitude.
- 4.2.
- Concepts associated with eco-driving and main rules.
- 4.3.
- Relationship between fuel consumption and speed.
- 4.4.
- Fuel savings in high gears.
- 5.
- Eco-driving from the vehicle point of view. Practical training.
- 5.1.
- Sections with slope positive or negative.
- 5.2.
- Curves.
- 5.3.
- Use of air conditioning, vehicle window, tire pressure, engine maintenance, vehicle load and accessories.
Appendix B. Survey Template

References
- European Environment Agency. EEA Greenhouse Gas-Data Viewer. 2019. Available online: https://www.eea.europa.eu/data-and-maps/data/data-viewers/greenhouse-gases-viewer (accessed on 28 October 2020).
- European Environment Agency. Transport CO2 Emissions in the EU. Emissions Breakdown by Transport Mode. 2016. Available online: https://www.europarl.europa.eu/news/en/headlines/society/20190313STO31218/co2-emissions-from-cars-facts-and-figures-infographics (accessed on 19 December 2020).
- United Nations. Climate Change Conference COP 21. 2015. Available online: https://ec.europa.eu/clima/policies/international/negotiations/paris_en (accessed on 28 October 2020).
- United Nations. Environment Programme. 2019. Available online: https://www.unenvironment.org/news-and-stories/press-release/cut-global-emissions-76-percent-every-year-next-decade-meet-15degc (accessed on 28 October 2020).
- United Nations. Climate Change Conference COP 25. 2019. Available online: https://unfccc.int/cop25 (accessed on 28 October 2020).
- Miteco. Ministerio para la Transición Ecológica y el Reto Demográfico. El Sector del Transporte. 2020. Available online: https://www.miteco.gob.es/es/cambio-climatico/temas/mitigacion-politicas-y-medidas/transporte.aspx (accessed on 28 October 2020).
- Pérez, P.Y.A.M.; Monzón, A. Informe Sobre Transporte y Medio Ambiente. Trama 2008; Centro de Publicaciones Secretaría General Técnica Ministerio de Medio Ambiente: Madrid, Spain, 2008; Volume 34. [Google Scholar]
- Miteco. Ministerio para la Transición Ecológica y el Reto Demográfico. Emisiones de Gases de Efecto Invernadero de los Sectores Difusos. 2020. Available online: https://www.miteco.gob.es/es/cambio-climatico/temas/mitigacion-politicas-y-medidas/definicion-difusos.aspx (accessed on 28 October 2020).
- Demir, E.; Bektaş, T.; Laporte, G. A review of recent research on green road freight transportation. Eur. J. Oper. Res. 2014, 237, 775–793. [Google Scholar] [CrossRef]
- Natural & Bio Gas Vehicle Association (NGVA) Europe. Greenhouse Gas Intensity of Natural Gas. 2017. Available online: https://gasnam.es/wp-content/uploads/2018/10/NGVA-thinkstep_GHG_Intensity_of_NG_Final_Report_v1.0.pdf (accessed on 28 October 2020).
- European Commission. COM (2017) 676. Proposal for a Regulation of The European Parliament and of The Council Setting Emission Performance Standards for New Passenger Cars and for New Light Commercial Vehicles as Part of the Union’s Integrated Approach to Reduce CO2 Emissions from Light-Duty Vehicles and Amending Regulation (EC) No 715/2007. 2017. Available online: https://eur-lex.europa.eu/legal-content/EN/ALL/?uri=CELEX%3A52017PC0676R%2801%29 (accessed on 28 October 2020).
- IDAE. Conducción Eficiente de Vehículos Industriales. 2011. Available online: https://www.idae.es/sites/default/files/publications/online/gce001/index.html (accessed on 28 October 2020).
- Ecowill Final Report. The Golden Rules of Eco-Driving. 2013. Available online: https://ec.europa.eu/energy/intelligent/projects/sites/iee-projects/files/projects/documents/ecowill_final_publishable_report_en.pdf (accessed on 26 October 2020).
- Sivak, M.; Schoettle, B. Eco-driving: Strategic, tactical, and operational decisions of the driver that influence vehicle fuel economy. Transport Policy 2012, 22, 96–99. [Google Scholar] [CrossRef]
- Alam, M.S.; McNabola, A. A critical review and assessment of Eco-Driving policy & technology: Benefits & limitations. Transport Policy 2014, 35, 42–49. [Google Scholar] [CrossRef]
- Kamal, M.A.S.; Mukai, M.; Murata, J.; Kawabe, T. Model predictive control of vehicles on urban roads for improved fuel economy. IEEE Trans. Control Syst. Technol. 2012, 21, 831–841. [Google Scholar] [CrossRef]
- Coloma, J.F.; Garcia, M.; Boggio-Marzet, A.; Monzon, A. Developing Eco-Driving Strategies considering City Characteristics. J. Adv. Transp. 2020, 2020, 1–13. [Google Scholar] [CrossRef]
- Ericsson, E.; Larsson, H.; Brundell-Freij, K. Optimizing route choice for lowest fuel consumption–potential effects of a new driver support tool. Transp. Res. Part C 2006, 14, 369–383. [Google Scholar] [CrossRef]
- Boriboonsomsin, K.; Dean, J.; Barth, M. Examination of attributes and value of ecologically friendly route choices. Transp. Res. Rec. 2014, 2427, 13–25. [Google Scholar] [CrossRef]
- Ko, B.; Cui, L.; Choi, S.; Park, B.B.; Ryu, S. Field Evaluation of vehicle to infrastructure communication-based eco-driving guidance and eco-signal system. Transp. Res. Rec. 2018, 2672, 123–138. [Google Scholar] [CrossRef]
- Ho, S.H.; Wong, Y.D.; Chang, V.W.C. What can eco-driving do for sustainable road transport? Perspectives from a city (Singapore) eco-driving programme. Sustain. Cities Soc. 2015, 14, 82–88. [Google Scholar] [CrossRef]
- Coloma, J.F.; Garcia, M.; Wang, Y.; Monzon, A. Environmental Strategies for Selecting Eco-Routing in a Small City. Atmosphere 2019, 10, 448. [Google Scholar] [CrossRef]
- Pandazis, J.C.; Winder, A. Study of Intelligent Transport Systems for reducing CO2 emissions for passenger cars. Eur. Road Transp. Telemat. Implement. Coord. Organ. 2015, 1, 49. Available online: https://erticonetwork.com/wp-content/uploads/2015/09/ITS4rCO2-Report-Final-2015-09-10-submitted.pdf (accessed on 26 October 2020).
- Zarkadoula, M.; Zoidis, G.; Tritopoulou, E. Training urban bus drivers to promote smart driving: A note on a Greek eco-driving pilot program. Transp Res. Part D Transport. Environ. 2007, 12, 449–451. [Google Scholar] [CrossRef]
- Thijssen, R.J.T.G.; Hofman, T.; Ham, J. Ecodriving acceptance: An experimental study on anticipation behavior of truck drivers. Transp. Res. Part F Traffic Psychol. Behav. 2014, 22, 249–260. [Google Scholar] [CrossRef]
- Strömberg, H.K.; Karlsson, I.M. Comparative effects of eco-driving initiatives aimed at urban bus drivers—Results from a field trial. Transp. Res. Part D Transport Environ. 2013, 22, 28–33. [Google Scholar] [CrossRef]
- Daun, T.J.; Braun, D.G.; Frank, C.; Haug, S.; Lienkamp, M. Evaluation of driving behavior and the efficacy of a predictive eco-driving assistance system for heavy commercial vehicles in a driving simulator experiment. In Proceedings of the 16th International IEEE Conference on Intelligent Transportation Systems, The Hague, The Netherlands, 6–9 October 2013; IEEE: Piscataway, NJ, USA, 2013; pp. 2379–2386. [Google Scholar] [CrossRef]
- Rutty, M.; Matthews, L.; Andrey, J.; Del Matto, T. Eco-driver training within the City of Calgary’s municipal fleet: Monitoring the impact. Transp. Res. Part D Transp. Environ. 2013, 24, 44–51. [Google Scholar] [CrossRef]
- Rionda, A.; Pañeda, X.G.; García, R.; Díaz, G.; Martínez, D.; Mitre, M.; Arbesú, A.; Marín, I. Blended learning system for efficient professional driving. Comput. Educ. 2014, 78, 124–139. [Google Scholar] [CrossRef]
- Sullman, M.J.; Dorn, L.; Niemi, P. Eco-driving training of professional bus drivers–Does it work? Transp. Res. Part C Emerg. Technol. 2015, 58, 749–759. [Google Scholar] [CrossRef]
- Rolim, C.; Baptista, P.; Duarte, G.; Farias, T.; Pereira, J. Real-time feedback impacts on eco-driving behavior and influential variables in fuel consumption in a lisbon urban bus operator. IEEE Trans. Intell. Transp. Syst. 2017, 18, 3061–3071. [Google Scholar] [CrossRef]
- Basarić, V.B.; Jambrović, M.; Miličić, M.B.; Savković, T.M.; Basarić, Đ.M.; Bogdanović, V.Z. Positive effects of eco-driving in public transport: A case study of the city Novi Sad. Therm. Sci. 2017, 21, 683–692. [Google Scholar] [CrossRef]
- Pozueco, L.; Tuero, A.G.; Pañeda, A.G.; Pañeda, X.G.; Melendi, D.; García, R.; Diaz Orueta, G.; Rionda, A. Analytic System to Evaluate Efficient Driving Programs in Professional Fleets. IEEE Trans. Intell. Transp. Syst. 2018, 20. [Google Scholar] [CrossRef]
- Yao, Y.; Zhao, X.; Ma, J.; Liu, C.; Rong, J. Driving Simulator Study: Eco-Driving Training System Based on Individual Characteristics. Transp. Res. Rec. 2019, 2673, 463–476. [Google Scholar] [CrossRef]
- Savković, T.; Gladović, P.; Miličić, M.; Pitka, P.; Ilić, S. Effects of eco-driving training: A pilot program in belgrade public transport. Teh. Vjesn. 2019, 26, 1031–1037. [Google Scholar] [CrossRef]
- Evin, E.; Aydin, M.B.; Kardas, G. Design and Implementation of a CANBus-Based Eco-Driving System for Public Transport Bus Services. IEEE Access 2020, 8, 8114–8128. [Google Scholar] [CrossRef]
- Vagg, C.; Brace, C.J.; Hari, D.; Akehurst, S.; Poxon, J.; Ash, L. Development and field trial of a driver assistance system to encourage eco-driving in light commercial vehicle fleets. IEEE Trans. Intell. Transp. Syst. 2013, 14, 796–805. [Google Scholar] [CrossRef]
- Schall, D.L.; Wolf, M.; Mohnen, A. Do effects of theoretical training and rewards for energy-efficient behavior persist over time and interact? A natural field experiment on eco-driving in a company fleet. Energy Policy 2016, 97, 291–300. [Google Scholar] [CrossRef]
- OBD-Key; KBM Systems Ltd.: London, UK, 2019; Available online: http://www.obdkey.com/ (accessed on 28 October 2020).
- Barth, M.; Boriboonsomsin, K. Energy and emissions impacts of a freeway-based dynamic eco-driving system. Transp. Res. Part. D 2009, 14, 400–410. [Google Scholar] [CrossRef]
- UNESCO (United Nations, Educational, Scientific and Cultural Organization). Ciudades Patrimonio de la Humidad. 2020. Available online: http://www.ciudadespatrimonio.org/ciudades/index.php?cd=3 (accessed on 26 October 2020).
- Ayuntamiento de Cáceres. Plan de Infraestructuras para la Movilidad Urbana Sostenible. 2014. Available online: http://zetaestaticos.com/comun/upload/0/580/580017.pdf (accessed on 26 October 2020).
- Ayuntamiento de Cáceres. Estudio de Tráfico y Movilidad. Revisión y Adaptación del Plan General Municipal de Cáceres. 2010. Available online: http://sig.caceres.es/PGM2010/TOMO_VI_EST_TRAFICO/ESTUDIO_DE_TRAFICO_REFUNDIDO.pdf (accessed on 26 October 2020).
- U.S. Department of Transportation. Highway Functional Classification: Concepts, Criteria and Procedure. 2013. Available online: https://www.fhwa.dot.gov/planning/processes/statewide/related/highway_functional_classifications/fcauab.pdf (accessed on 26 October 2020).
- Dirección General de Tráfico. Parque de Vehículos. 2019. Available online: http://www.dgt.es/es/seguridad-vial/estadisticas-e-indicadores/parque-vehiculos/tablas-estadisticas/ (accessed on 26 October 2020).
- Instituto para la Diversificación y Ahorro de la Energía (IDAE). Consumo de Carburante y Emisiones de CO2 en Coches Nuevos. 2017. Available online: http://coches.idae.es/base-datos/marca-y-modelo (accessed on 26 October 2020).
- Torque Pro and Lite; Ian J Hawkins: Buckinghamshire, UK, 2019; Available online: https://torque-bhp.com/ (accessed on 26 October 2020).
- Coloma, J.F.; García, M.; Wang, Y. Eco-driving effects depending on the travelled road. Correlation between fuel consumption parameters. Transp. Res. Procedia 2018, 33, 259–266. [Google Scholar] [CrossRef]
- Lois, D.; Wang, Y.; Boggio-Marzet, A.; Monzon, A. Multivariate analysis of fuel consumption related to eco-driving: Interaction of driving patterns and external factors. Transp Res. Part D Transport. Environ. 2019, 72, 232–242. [Google Scholar] [CrossRef]
- QGIS. 2020. Available online: https://www.qgis.org/es/site/ (accessed on 26 October 2020).
- Huang, Y.; Ng, E.C.Y.; Zhou, J.L.; Surawski, N.C.; Chan, E.F.; Hong, G. Eco-driving technology for sustainable road transport: A review. Renew. Sustain. Energy Rev. 2018, 93, 596–609. [Google Scholar] [CrossRef]
- Saito, A.; Ueki, S.; Nagatomi, Y.; Sawazu, N.; Takada, Y. Analysis of CO2 Reduction Mechanism by Eco-Driving with Light Duty Diesel Freight Vehicle in Real Traffic Conditions; SAE Technical Paper No. 2008-01-1304; SAE International: Warrendale, PA, USA, 2008. [Google Scholar] [CrossRef]
- Beusen, B.; Broekx, S.; Denys, T.; Beckx, C.; Degraeuwe, B.; Gijsbers, M.; Scheepers, K.; Govaerts, L.; Torfs, R.; Panis, L.I. Using on-board logging devices to study the longer-term impact of an eco-driving course. Transp. Res. Part. D Transp. Environ. 2009, 14, 514–520. [Google Scholar] [CrossRef]
- Garcia-Castro, A.; Monzon, A. Using floating car data to analyse the effects of its measures and eco-driving. Sensors 2014, 14, 21358–21374. [Google Scholar] [CrossRef] [PubMed]
- Muslim, N.H.; Keyyanfar, A.; Shafaghat, A.; Abdullahi, M.M.; Khorami, M. Green driver: Travel behaviors revisited on fuel saving and less emission. Sustainability 2018, 10, 325. [Google Scholar] [CrossRef]
- Keyvanfar, A.; Shafaghat, A.; Muhammad, N.Z.; Ferwati, M.S. Driving behaviour and sustainable mobility-policies and approaches revisited. Sustainability 2018, 10, 1152. [Google Scholar] [CrossRef]
- Dhaou, I.B. Fuel estimation model for ECO-driving and ECO-routing. In Proceedings of the IEEE Intelligent Vehicles Symposium (IV), Baden-Baden, Germany, 5–9 June 2011; IEEE: Piscataway, NJ, USA, 2011; pp. 37–42. Available online: https://ieeexplore.ieee.org/iel5/5930385/5940387/05940399.pdf?casa_token=KG5tg6SKWwEAAAAA:uVGZHoqK_AMm6TLQZzbdY322J_qkNS6cRLey3R4b9Hjr0XJvl2Jk5alOm3L_vqbSgZCxN-Ztjdo (accessed on 29 October 2020).
- Andrieu, C.; Saint Pierre, G. Comparing effects of eco-driving training and simple advices on driving behavior. Procedia Soc. Behav. Sci. 2012, 54, 211–220. [Google Scholar] [CrossRef]
- Cui, L.; Park, B. Assessing eco-driving behaviors using driving simulator. In Proceedings of the 96th Annual Meeting of the Transportation Research Board, Washington, DC, USA, 7–11 January 2017; Available online: https://www.researchgate.net/profile/Lian_Cui2/publication/326106819_Assessing_Eco-Driving_Behaviors_Using_Driving_Simulator/links/5d8b037692851c33e938bda9/Assessing-Eco-Driving-Behaviors-Using-Driving-Simulator.pdf (accessed on 5 January 2021).
- Coloma, J.F.; García, M.; Wang, Y.; Monzón, A. Green Eco-driving effects in non-congested cities. Sustainability 2018, 10, 28. [Google Scholar] [CrossRef]
- Wang, Y.; Boggio-Marzet, A. Evaluation of Eco-Driving Training for Fuel Efficiency and Emissions Reduction According to Road Type. Sustainability 2018, 10, 3891. [Google Scholar] [CrossRef]
- Perez-Prada, F.; Monzon, A. Ex-post environmental and traffic assessment of a speed reduction strategy in Madrid’s inner ring-road. J. Transp. Geogr. 2017, 58, 256–268. [Google Scholar] [CrossRef]
- García, M.; Coloma, J.F.; Wang, Y. Eco-Driving In Small Cities. Driving Performance In Relation To Driver’s Profile. Transp. Res. Procedia 2018, 33, 267–274. [Google Scholar] [CrossRef]
- Strömberg, H.; Karlsson, I.M.; Rexfelt, O. Eco-driving: Drivers’ understanding of the concept and implications for future interventions. Transport Policy 2015, 39, 48–54. [Google Scholar] [CrossRef]
- Schall, D.L.; Mohnen, A. Incentives for energy-efficient behavior at the workplace: A natural field experiment on eco-driving in a company fleet. Energy Procedia 2015, 75, 2626–2634. [Google Scholar] [CrossRef]
- Seedam, A.; Satiennam, T.; Radpukdee, T.; Satiennam, W.; Ratanavaraha, V. Motorcycle on-road driving parameters influencing fuel consumption and emissions on congested signalized urban corridor. J. Adv. Transp. 2017, 5859789. [Google Scholar] [CrossRef]
- Pitanuwat, S.; Aoki, H.; Iizuka, S.; Morikawa, T. Development of Hybrid-Vehicle Energy-Consumption Model for Transportation Applications—Part I: Driving-Power Equation Development and Coefficient Calibration. Energies 2020, 13, 476. [Google Scholar] [CrossRef]


| Reference Number | Year of Publication | Research Type | Fuel Consumption Reduction (%) |
|---|---|---|---|
| [24] | 2007 | Urban bus drivers in Greece. 15 km route designed for training purposes | 10–15% |
| [25] | 2013 | Truck drivers in Germany | 9.5% |
| [26] | 2013 | Drivers on one bus line. Swedish public transport operator. 54 drivers, 16 km route | 6.8% |
| [27] | 2013 | Commercial vehicles in driving simulator experiment in Germany | 6.0% |
| [28] | 2013 | Municipal drivers in City of Calgary (Canada). Fifteen drivers from the Development & Building Approvals Business Unit | 4–10% |
| [29] | 2014 | 34 professional drivers of the Urban Bus Company (EMTUSA) in the City of Gijon (Spain). Period of 12 months. | 7% |
| [30] | 2015 | 29 bus drivers with a simulator driver in Helsinki (Finland) | 11.6% |
| [31] | 2017 | Lisbon urban bus transport operator (Portugal) | 0.3–2% |
| [32] | 2017 | Public bus transport company. 3 drivers, 7.7 km in Novi Sad (Serbia) | 11.71% |
| [33] | 2019 | 16 bus companies. 880 professional drivers in Spain | 10% |
| [34] | 2019 | Driving simulator. 8 taxi drivers in China | 8.4% |
| [35] | 2019 | 30 bus drivers in Belgrade (Serbia). Route length of 14 km | 8.61% |
| [36] | 2020 | Public metrobus systems used by 250,000 passengers every day in Turkey. 15 months evaluation period | 5% |
| Features | Peugeot | Renault |
|---|---|---|
| Full name | PARTNER 1.6 HDi 75 | KANGOO 1.5 DCi 70 |
| Gear shift type | Manual (5) | Manual (5) |
| Maximum authorized mass | 1960 | 2956 |
| HP power | 75 | 70 |
| Dimensions (L × W × H) (mm) | 4380 × 2890 × 1801 | 4213 × 2133 × 1799 |
| Seats | 2–5 | 2–5 |
| Emissions (g de CO2/km) | 143 | 147 |
| Classification by relative consumption | C | D |
| Driver | Driving Mode | Distance Travelled (km) | Driving Time (h) | Deliveries No. |
|---|---|---|---|---|
| 1 | Non-eco | 115.1 | 35.6 | 223 |
| Eco-driving | 131.4 | 26.8 | 221 | |
| 2 | Non-eco | 80.1 | 11.4 | 156 |
| Eco-driving | 215.2 | 41.3 | 363 | |
| 3 | Non-eco | 123.1 | 33.1 | 266 |
| Eco-driving | 167.3 | 34.5 | 340 | |
| 4 | Non-eco | 96.8 | 31.7 | 328 |
| Eco-driving | 45.8 | 11.2 | 133 | |
| 5 | Non-eco | 176.8 | 24.8 | 245 |
| Eco-driving | 139.2 | 23.4 | 277 | |
| Partial | Non-eco | 591.9 | 136.6 | 1218 |
| Sum | Eco-driving | 698.9 | 137.2 | 1334 |
| Total | Non-eco + eco | 1290.8 | 273.8 | 2552 |
| Parameter | Driving Mode | Driver | ||||
|---|---|---|---|---|---|---|
| 1 | 2 | 3 | 4 | 5 | ||
| Maximum speed (km/h) | Non-eco | 41.7 | 38.8 | 47.1 | 31.7 | 61.1 |
| Eco-driving | 48.5 | 51.1 | 51.8 | 30.0 | 49.2 | |
| V95 (km/h) | Non-eco | 38.2 | 35.6 | 42.5 | 28.9 | 55.6 |
| Eco-driving | 44.6 | 44.5 | 47.0 | 28.3 | 44.7 | |
| Average speed (km/h) | Non-eco | 16.8 | 17.3 | 19.9 | 15.3 | 30.3 |
| Eco-driving | 19.5 | 18.9 | 23.7 | 15.4 | 25.8 | |
| Average rpm | Non-eco | 1164 | 1619 | 1225 | 1209 | 1745 |
| Eco-driving | 1279 | 1563 | 1267 | 1286 | 1412 | |
| Maximum rpm | Non-eco | 2144 | 3172 | 2849 | 1956 | 3004 |
| Eco-driving | 2348 | 3096 | 2620 | 2012 | 2366 | |
| Average positive acceleration (m/s2) | Non-eco | 0.6 | 0.4 | 0.7 | 0.4 | 0.9 |
| Eco-driving | 0.6 | 0.6 | 0.7 | 0.4 | 0.8 | |
| Average negative acceleration (m/s2) | Non-eco | −0.6 | −0.4 | −0.7 | −0.4 | −0.9 |
| Eco-driving | −0.6 | −0.7 | −0.7 | −0.4 | −0.8 | |
| Maximum positive acceleration (m/s2) | Non-eco | 2.1 | 1.9 | 2.9 | 1.5 | 4.1 |
| Eco-driving | 2.2 | 2.9 | 2.9 | 1.3 | 3.2 | |
| Maximum negative acceleration (m/s2) | Non-eco | −2.0 | −1.8 | −2.5 | −1.6 | −4.0 |
| Eco-driving | −2.3 | −2.8 | −2.6 | −1.4 | −3.5 | |
| Parameter | Driving Mode | Driver | ||||
|---|---|---|---|---|---|---|
| 1 | 2 | 3 | 4 | 5 | ||
| Consumption (L/100 km) | Non-eco | 6.71 | 6.16 | 6.15 | 8.93 | 5.99 |
| Eco-driving | 6.26 | 6.18 | 5.54 | 8.48 | 6.95 | |
| CO2 emissions (g/km) | Non-eco | 208.7 | 191.0 | 187.2 | 271.2 | 188.8 |
| Eco-driving | 193.3 | 195.1 | 168.4 | 259.2 | 219.9 | |
| Road Type. | Route No. | Description | Section Length | Speed Limit |
|---|---|---|---|---|
| Local | 1 | One lane for each direction | 550 m | 50 km/h |
| Collector | 2 | Two lanes each way separated by median. Parking on both sides | 600 m | 30–50 km/h |
| 3 | Two lanes each way separated by median | 900 m | 30–50 km/h | |
| Perimeter | 4 | Two lanes each way separated by median. Parking on both sides | 950 m | 50 km/h |
| 5 | Two lanes each way separated by median. Parking on both sides | 1200 m | 50 km/h | |
| Bypass | 6 | Two lanes each way separated by median | 1000 m | 50–80 km/h |
| 7 | Two lanes each way separated by median | 2200 m | 50–80 km/h | |
| Inter-urban | 8 | Two lanes each way separated by median | 950 m | 80 km/h |
| Driving Mode | Local | Collector | Perimeter | Bypass | Inter-Urban | ||||
|---|---|---|---|---|---|---|---|---|---|
| Route 1 | Route 2 | Route 3 | Route 4 | Route 5 | Route 6 | Route 7 | Route 8 | ||
| Maximum speed (km/h) | Non-eco | 51.4 | 39.9 | 65.9 | 56.5 | 76.9 | 86.8 | 69.5 | 88 |
| Eco-driving | 67.8 | 45.3 | 41.7 | 62.8 | 70.6 | 80.1 | 63.5 | 51.4 | |
| V95 (km/h) | Non-eco | 50.5 | 37.5 | 63.6 | 52.1 | 75.4 | 84.8 | 66.2 | 86.8 |
| Eco-driving | 66.4 | 43.8 | 41.1 | 60.6 | 69.4 | 79.0 | 62.9 | 51 | |
| Average speed (km/h) | Non-eco | 39.6 | 24.3 | 37.2 | 34.6 | 57 | 59.1 | 50.9 | 73.6 |
| Eco-driving | 44.9 | 26.0 | 26.9 | 40.4 | 42.8 | 64.7 | 46.4 | 45.5 | |
| Maximum rpm | Non-eco | 2520 | 2309 | 2296 | 2890 | 2373 | 3135 | 2885 | 2859 |
| Eco-driving | 3205 | 2633 | 2160 | 2447 | 2427 | 2592 | 2656 | 2235 | |
| Average rpm | Non-eco | 1870 | 1168 | 1523 | 1800 | 1746 | 2062 | 2081 | 2154 |
| Eco-driving | 2428 | 1337 | 1424 | 1713 | 1480 | 1882 | 2089 | 1834 | |
| Maximum positive acceleration (m/s2) | Non-eco | 1.7 | 2.0 | 2.4 | 3.0 | 1.9 | 1.8 | 2.9 | 1.8 |
| Eco-driving | 2.2 | 3.0 | 1.1 | 2.3 | 1.9 | 1.6 | 2 | 0.8 | |
| Maximum negative acceleration (m/s2) | Non-eco | −1.2 | −1.5 | −2.7 | −3.4 | −2.7 | −3.2 | −2.7 | −2.7 |
| Eco-driving | −1.8 | −2.2 | −1.5 | −3.7 | −2.4 | −1.7 | −3.6 | −1.3 | |
| Average positive acceleration (m/s2) | Non-eco | 0.6 | 0.6 | 0.6 | 0.9 | 0.7 | 0.6 | 1 | 0.6 |
| Eco-driving | 0.7 | 0.7 | 0.3 | 0.8 | 0.7 | 0.6 | 0.8 | 0.3 | |
| Average negative acceleration (m/s2) | Non-eco | −0.5 | −0.5 | −0.7 | −0.8 | −0.8 | −0.8 | −0.8 | −0.8 |
| Eco-driving | −0.6 | −0.6 | −0.3 | −0.8 | −0.7 | −0.6 | −1 | −0.3 | |
| Driving Mode | Local | Collector | Perimeter | Bypass | Inter-Urban | ||||
|---|---|---|---|---|---|---|---|---|---|
| Route 1 | Route 2 | Route 3 | Route 4 | Route 5 | Route 6 | Route 7 | Route 8 | ||
| Consumption (L/100 km) | Non-eco | 2.1 | 2.2 | 8.8 | 6.1 | 8.4 | 4.6 | 2.7 | 4.5 |
| Eco-driving | 2.9 | 3.1 | 10.1 | 6.0 | 8.4 | 4.4 | 2.6 | 4.2 | |
| CO2 emissions (g/km) | Non-eco | 63.6 | 70.7 | 154.8 | 188.5 | 109.4 | 146.1 | 77.8 | 112.5 |
| Eco-driving | 88.2 | 96.4 | 187.4 | 186.3 | 109.3 | 138.5 | 77.6 | 97.0 | |
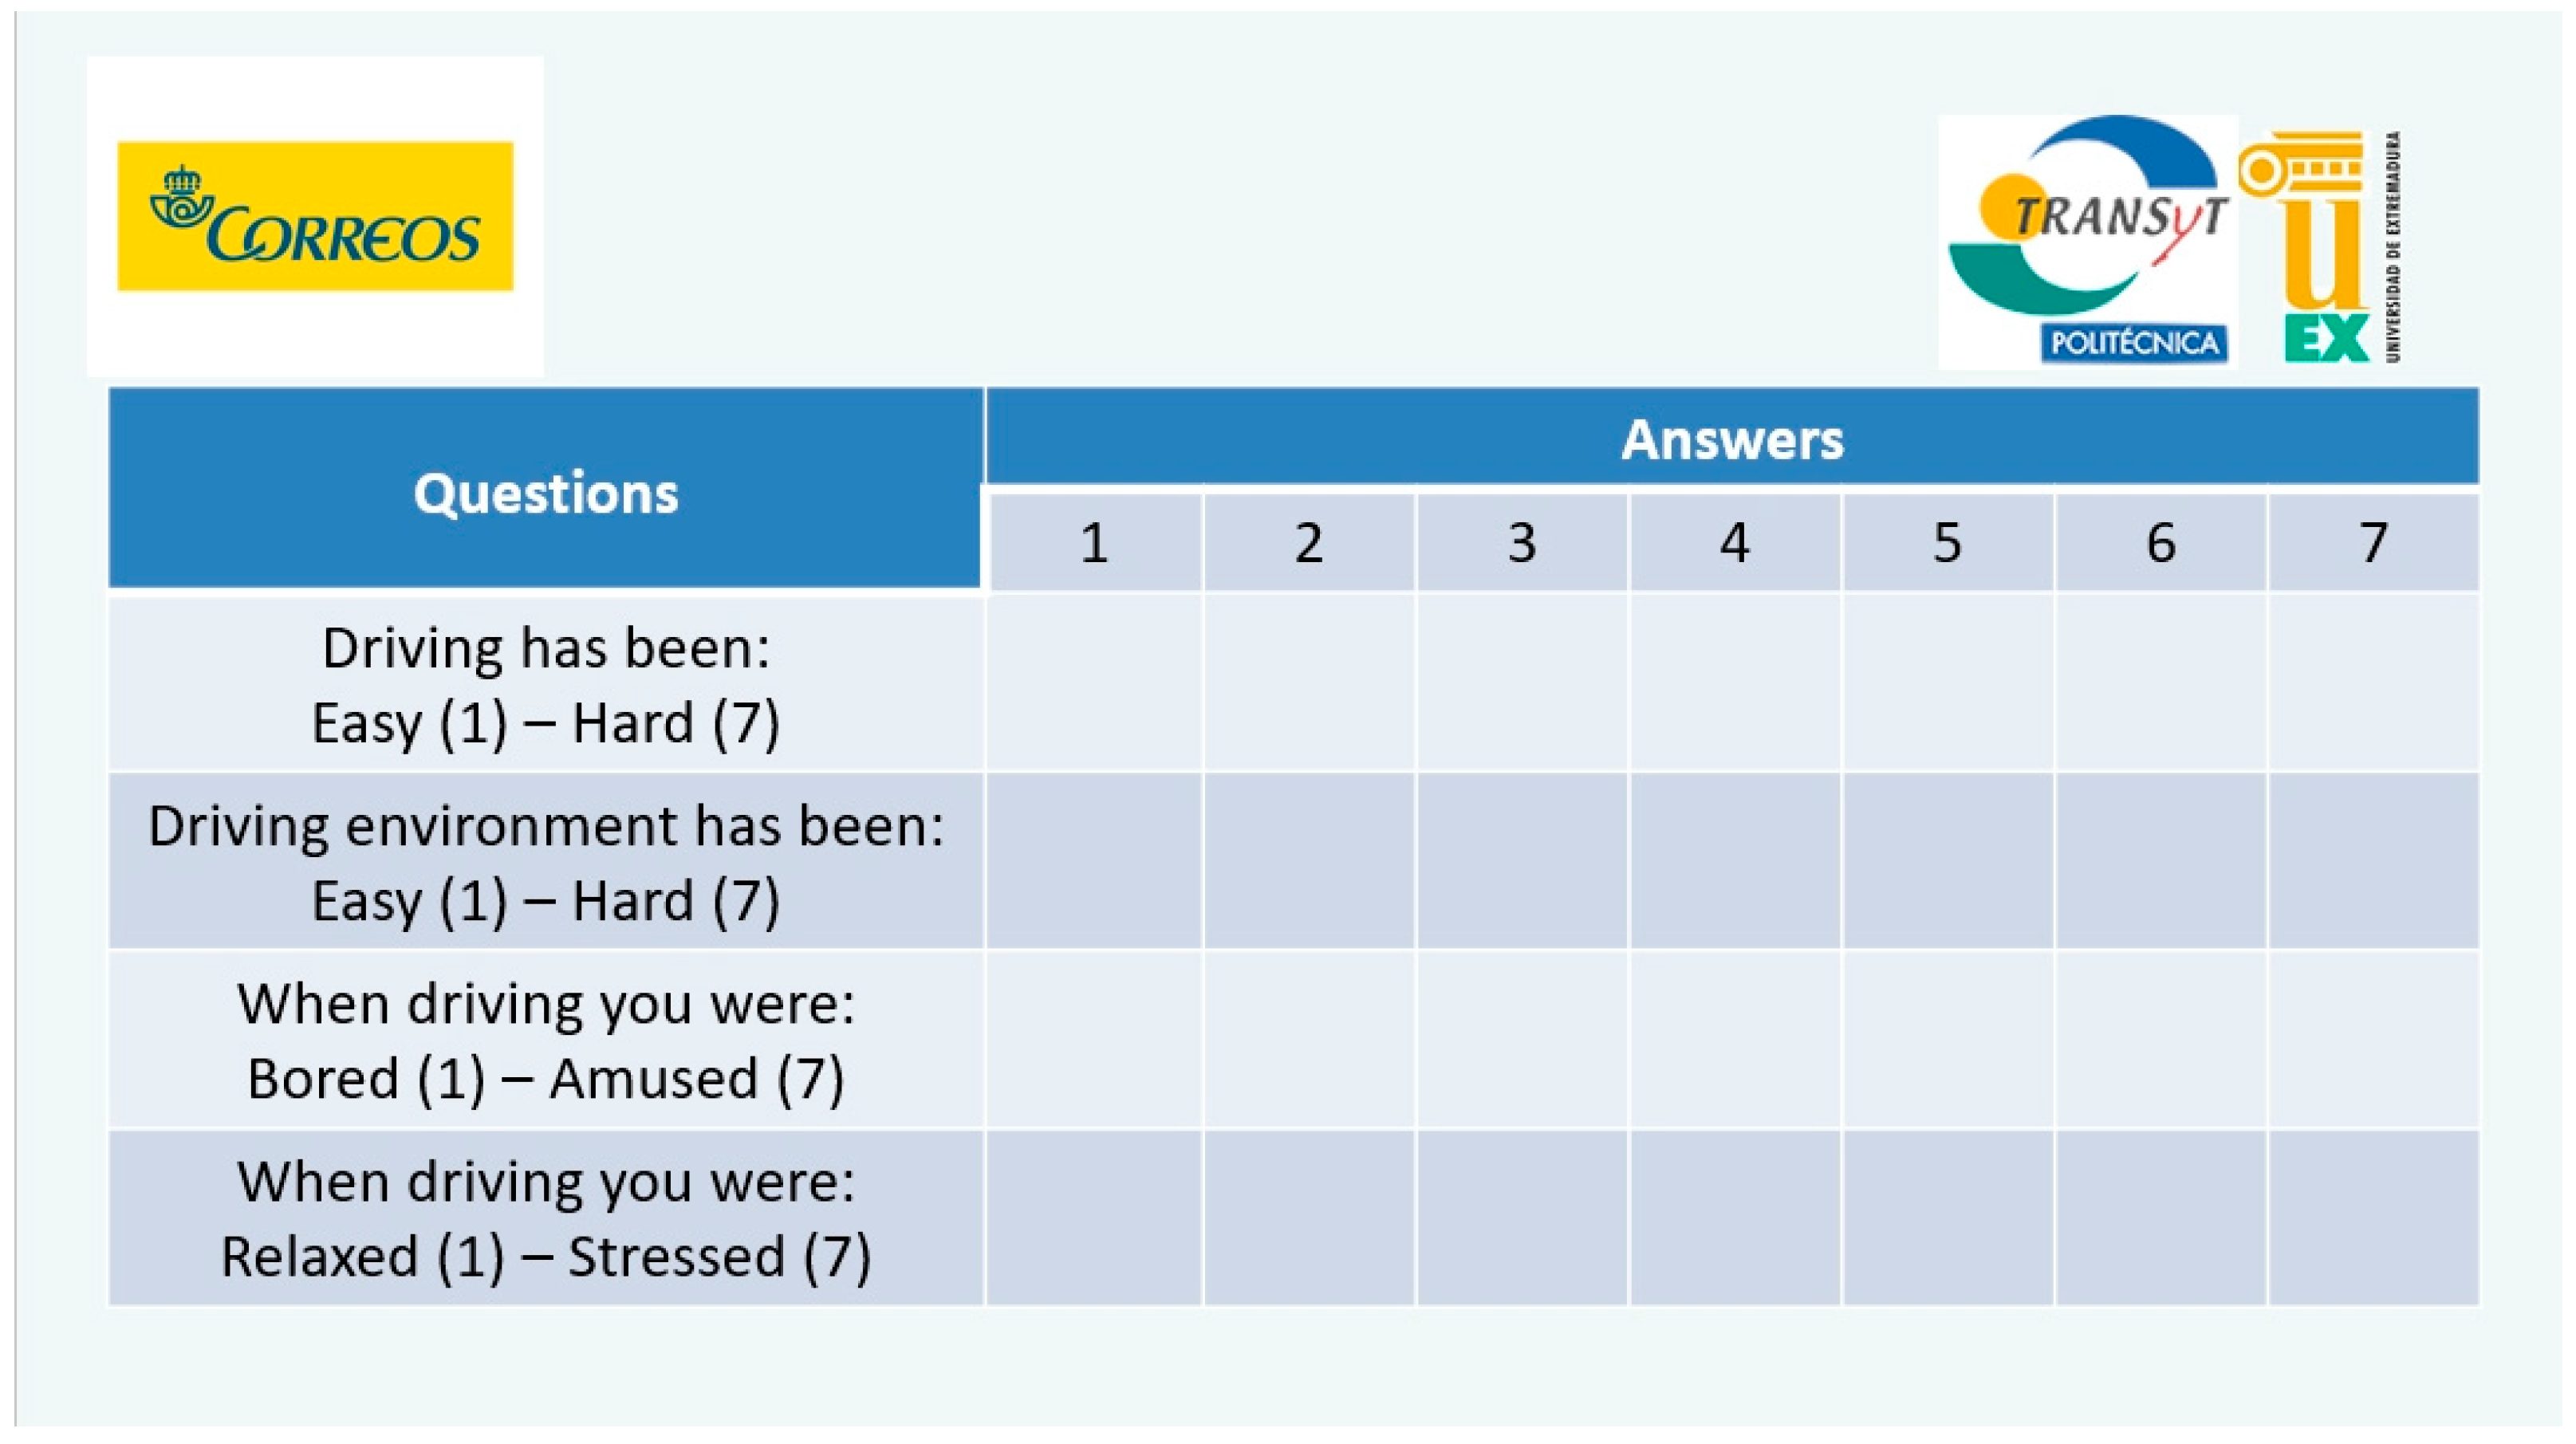
| Questions | Driving Mode | Surveys No. | Answers | ||||||
|---|---|---|---|---|---|---|---|---|---|
| 1 | 2 | 3 | 4 | 5 | 6 | 7 | |||
| Driving has been: Easy (1)–Hard (7) | Non-eco | 18 | 15 | 1 | 1 | 1 | 0 | 0 | 0 |
| Eco-driving | 15 | 15 | 0 | 0 | 0 | 0 | 0 | 0 | |
| Driving environment has been: Easy (1)–Hard (7) | Non-eco | 18 | 12 | 2 | 3 | 1 | 0 | 0 | 0 |
| Eco-driving | 15 | 10 | 4 | 1 | 0 | 0 | 0 | 0 | |
| When driving you were: Bored (1)–Amused (7) | Non-eco | 18 | 3 | 1 | 1 | 1 | 2 | 8 | 2 |
| Eco-driving | 15 | 3 | 0 | 1 | 0 | 0 | 6 | 5 | |
| When driving you were: Relaxed (1) –Stressed (7) | Non-eco | 18 | 5 | 8 | 1 | 3 | 1 | 0 | 0 |
| Eco-driving | 15 | 6 | 5 | 1 | 0 | 0 | 1 | 2 | |
Publisher’s Note: MDPI stays neutral with regard to jurisdictional claims in published maps and institutional affiliations. |
© 2021 by the authors. Licensee MDPI, Basel, Switzerland. This article is an open access article distributed under the terms and conditions of the Creative Commons Attribution (CC BY) license (http://creativecommons.org/licenses/by/4.0/).
Share and Cite
Coloma, J.F.; García, M.; Fernández, G.; Monzón, A. Environmental Effects of Eco-Driving on Courier Delivery. Sustainability 2021, 13, 1415. https://doi.org/10.3390/su13031415
Coloma JF, García M, Fernández G, Monzón A. Environmental Effects of Eco-Driving on Courier Delivery. Sustainability. 2021; 13(3):1415. https://doi.org/10.3390/su13031415
Chicago/Turabian StyleColoma, Juan Francisco, Marta García, Gonzalo Fernández, and Andrés Monzón. 2021. "Environmental Effects of Eco-Driving on Courier Delivery" Sustainability 13, no. 3: 1415. https://doi.org/10.3390/su13031415
APA StyleColoma, J. F., García, M., Fernández, G., & Monzón, A. (2021). Environmental Effects of Eco-Driving on Courier Delivery. Sustainability, 13(3), 1415. https://doi.org/10.3390/su13031415