Article

Remote Sensing for Cultural Heritage Assessment and Monitoring: The Case Study of Alba Iulia

by
Cristian Moise
1,*,
Iulia Dana Negula
2,
Cristina Elena Mihalache
1,
Andi Mihai Lazar
2,
Andreea Luminita Dedulescu
2,
Gabriel Tiberiu Rustoiu
3,
Ioan Constantin Inel
3 and
Alexandru Badea
2
1
Department of Mathematics, Physics and Land Measurements, Faculty of Land Reclamation and Environment Engineering, University of Agronomic Sciences and Veterinary Medicine of Bucharest, 011464 Bucharest, Romania
2
Romanian Space Agency, 010362 Bucharest, Romania
3
National Museum of Unification Alba Iulia, 510010 Alba Iulia, Romania
*
Author to whom correspondence should be addressed.
Sustainability 2021, 13(3), 1406; https://doi.org/10.3390/su13031406
Submission received: 15 December 2020 / Revised: 25 January 2021 / Accepted: 25 January 2021 / Published: 29 January 2021
(This article belongs to the Special Issue Cultural Heritage and Natural Disasters)

Abstract

:
In recent times, satellite-based remote sensing has a growing role in archaeology and inherently in the cultural heritage management process. This paper demonstrates the potential and usefulness of satellite imagery for the documentation, mapping, monitoring, and in-depth analysis of cultural heritage and the archaeological sites located in urban landscapes. The study focuses on the assessment and monitoring of Alba Iulia, which is one of the Romanian cities with the richest historical past. Multitemporal analysis was performed to identify the land use/land cover changes that might contribute to an increased cultural heritage vulnerability to natural disasters. A special emphasis was dedicated to the assessment of the built-up area growth and consequently of the urbanization trend over a large time interval (30 years). Next, the urbanization and urban area expansion impact was further analyzed by concentrating on the urban heat island within Alba Iulia city and Alba Iulia Fortress (located in the center of the city). As temperature change represents a key element of climate change, the temperature trend within the same temporal framework and its impact on cultural heritage were determined. In the end, with regard to the cultural heritage condition assessment, the research was complemented with an assessment of the urban ground and individual building stability, using persistent scatterer interferometry. The results contribute to the detailed depiction of the cultural heritage site in such a manner that the site is monitored over an extensive timeframe, its current state of conservation is accurately determined, and the future trends can be identified. In conclusion, the present study offers reliable results regarding the main factors that might endanger the cultural heritage site as a basis for future preservation measures.

1. Introduction

The increasing contribution of remote sensing to the archaeology and cultural heritage domain is favored by the variety of satellite sensors, data policies that enable free and open access to satellite imagery, and the use of combined techniques in order to maximize the spectrum of complementary information that can be generated through the exploitation of satellite data for a more accurate and extensive analysis of the archaeological sites and their surroundings [1].
Using very high resolution (VHR) multispectral satellite imagery, Megarry et al. [2] promoted the use of automatic methods (i.e., machine-learning and classification techniques) that strengthen the archaeological prospection process. Likewise, using VHR Synthetic Aperture Radar (SAR), Balz et al. [3] determined that remote sensing imagery represents a useful tool for the analysis of the archaeological landscape. Steward et al. [4] used both VHR SAR and multispectral satellite data and assessed their suitability for archaeological prospection and monitoring. The capabilities of satellite remote sensing beyond site detection were proven by Borie et al. [5] in a study that focused on the analysis of specific environmental resources. Malinverni et al. [6] demonstrated the advantage of using remote sensing for the documentation of an archaeological complex that further served as support for perseveration and enhancement efforts. Satellite remote sensing plays a crucial role also in the condition assessment [7] and detection of threats to heritage sites [8,9]. An overview of the innovative products that can be generated using remote sensing data and techniques was presented by Bassier et al. [10].
In this context, the present study expands the knowledge related to the use of satellite remote sensing for archaeological research by focusing on a cultural heritage site located in an urban environment. Satellite imagery enables a better understanding of the environmental changes, thus contributing to the development of enhanced urban management methodologies [11]. Related to the very challenging characteristics of the urban environment, Gamba et al. [12] demonstrated the importance of the combination of different types of data with regard to spatial resolution or diverse polarizations, multi-resolution, multi-scale, and multi-temporal techniques, whereas Wellmann et al. [11] identified that the classification of satellite imagery is one of the most used remote sensing techniques for urban area analysis. The study has three main pillars, namely, (1) the analysis of the land use/land cover (LULC) changes within the administrative boundary that contains the cultural heritage site, with a special emphasis on urbanization and urban growth from 1988 to 2018; (2) the evaluation of the temperature trend in correlation with the urbanization process as well as of the urban heat island (UHI) effect between 1988 and 2019; and (3) the assessment of the ground and individual building stability in order to have a more profound insight into the cultural heritage site condition from 2018 to 2020. Hence, the main goal of the research is represented by the assessment and long-term monitoring of cultural heritage as well as the analysis of cultural heritage vulnerability to natural disasters, for sustainable management measures. The research integrates multitemporal analysis and supervised classification using the maximum likelihood algorithm, based on Landsat and Sentinel-2 images; in addition, Copernicus land cover data sets (i.e., CORINE Land Cover, Urban Atlas) complement the study. The land surface temperature (LST), brightness temperature at sensor, and UHI analysis for thermal stress estimation encompass Landsat data and ground-truth temperature measurements for the validation of the results. Finally, the ground and building stability analysis was performed based on a large series of Sentinel-1 images and using the persistent scatterer interferometry technique (PS-InSAR).
Regarding the specific methods and techniques that are exploited in this study, the scientific literature contains plentiful relevant publications focused on cultural heritage sites, for example: the identification and surveying of land-cover changes [13], the analysis of the spatiotemporal land use/land cover evolution based on Landsat imagery [14], the use of supervised classification for the generation of land cover products based on multispectral satellite images with different spatial resolution [15], the impact of urbanization [16], the use of a CORINE Land Cover (CLC) dataset for the analysis of the urban sprawl [17], and the application of PS-InSAR as a standalone technique or in combination with other remote sensing approaches for the investigation of ground and structural stability [18,19,20,21,22]. The “Copernicus services in support to Cultural Heritage” report, published by the European Commission (EC), refers to LST and the Urban Atlas (the core service products provided by the Copernicus Land Monitoring Service—CLMS) as data useful for cultural heritage management [23]. According to the report, LST enables the detection of thermal anomalies, whereas the Urban Atlas contributes to the mapping of surrounding infrastructure in cultural heritage sites. Some of the research results obtained in this study (e.g., the UHI output) might represent examples of additional products suitable for cultural heritage applications.
The study concentrates on the monitoring and condition assessment of the Alba Iulia Fortress (Figure 1), located in the heart of Alba Iulia city in Romania. For a comprehensive analysis, the research includes the monitoring of the Alba Iulia administrative territory, which has an area of about 102 km2 (Figure 2).
Amongst the factors that might affect a heritage site are urban high rise/urban sprawl, changes to skyline, commercial and industrial development, the use of transport infrastructure, air pollution, environmental or biological factors (e.g., wind, humidity, temperature, dust, water, micro-organisms), climate change (e.g. temperature rise), natural disasters (e.g., floods, earthquakes, landslides), and human activities [24].
Some of these factors have an impact on the Alba Iulia cultural heritage site, hence their early identification and assessment strengthen the cultural heritage safeguarding and conservation measures. For example, the assessment of the urban development trend and its consequences (e.g., increased vehicle traffic, elevated air pollution levels) on the cultural heritage is of high importance for the management authorities since both the authorized and the illegal urban expansion might endanger the ancient Roman city. An accurate temperature trend estimation and delineation of the urban heat islands is a critical parameter for the management authorities, considering that for the optimal preservation of the cultural heritage a lower temperature is preferred. In Alba Iulia, a higher temperature correlated with higher humidity was observed in numerous archaeological sites within the fortress, thus affecting the buried and the ground structures. In addition, taking into account that some of the Alba Iulia’s cultural heritage buildings have visible displacements, a remote sensing analysis of the buildings’ stability provides the local authorities an accurate overview that might represent the basis for further detailed investigations. At present, the natural disaster risk is minor in the Alba Iulia administrative territorial unit. Catastrophic floods occurred in 1851, 1857, 1870, 1887, 1893, 1970, and 1975 until embankment works were performed on the Mureș River. However, a prevailing problem is that the eastern and southern parts of Alba Iulia city are still affected by high groundwater levels [25]. In order to address the aforementioned aspects, the study was built on three main pillars, each of them capitalizing on different remote sensing technologies and methods, as described in Section 2.3. Methodology.

2. Materials and Methods

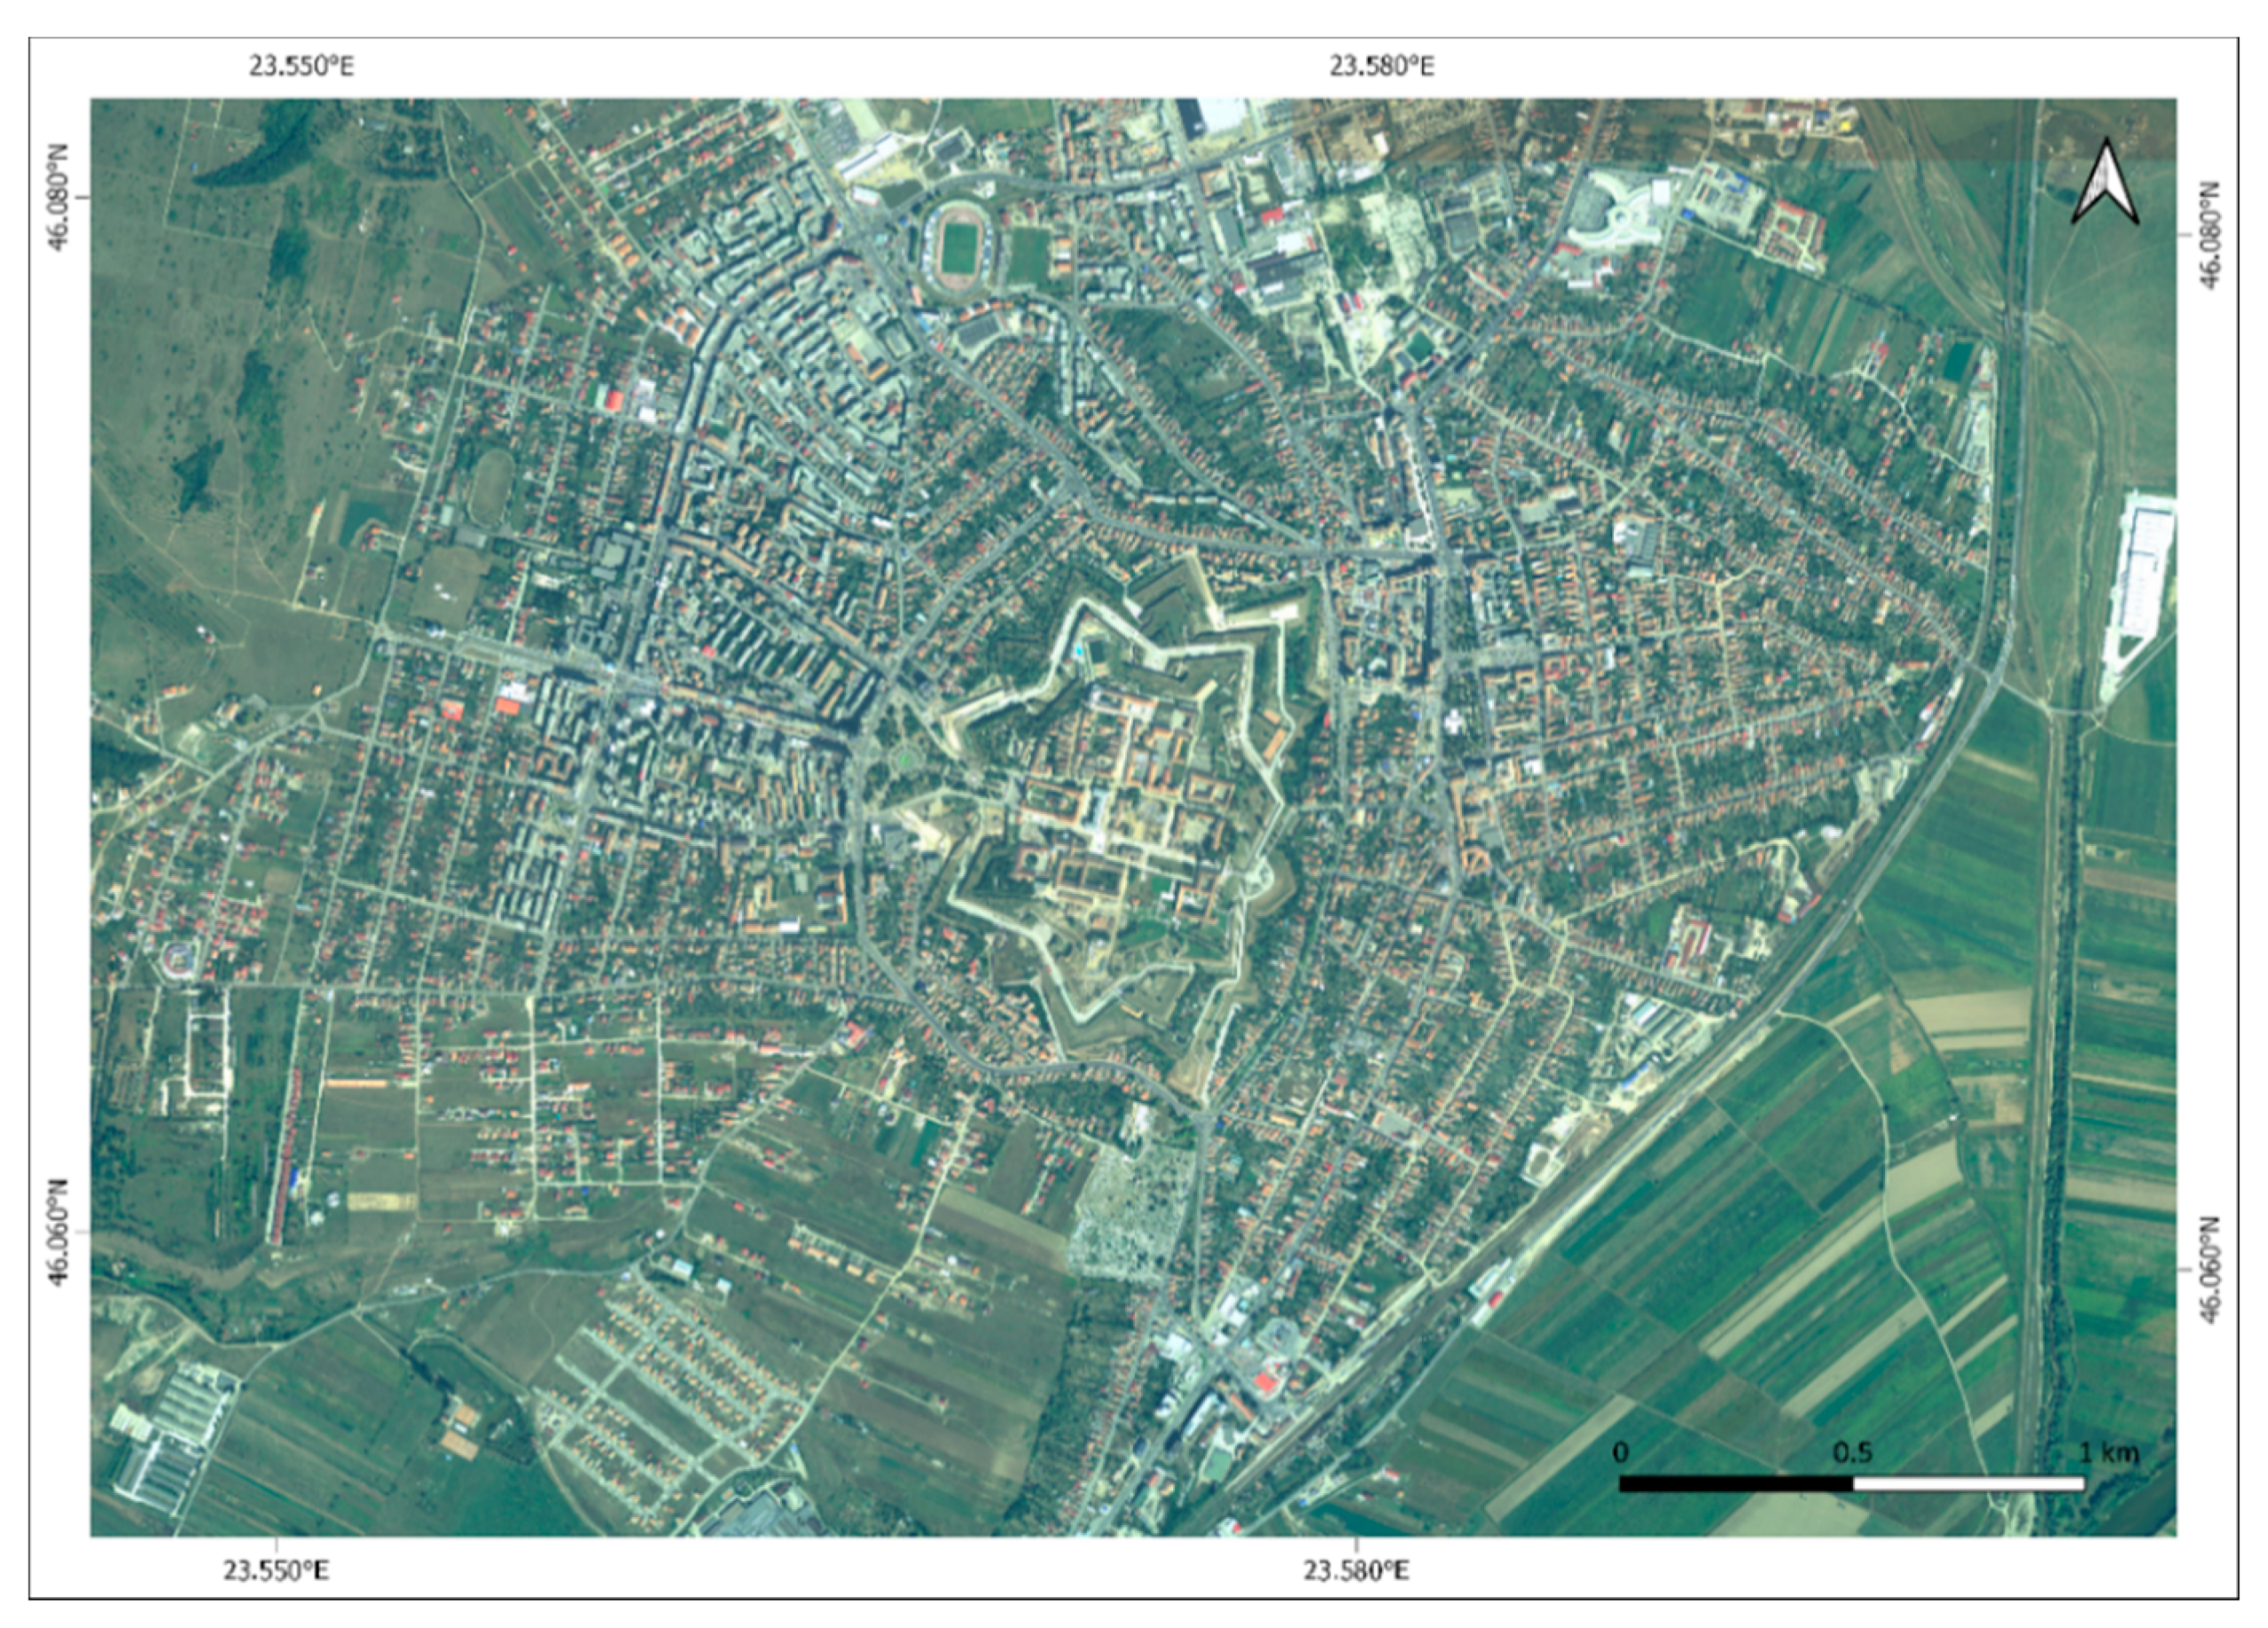
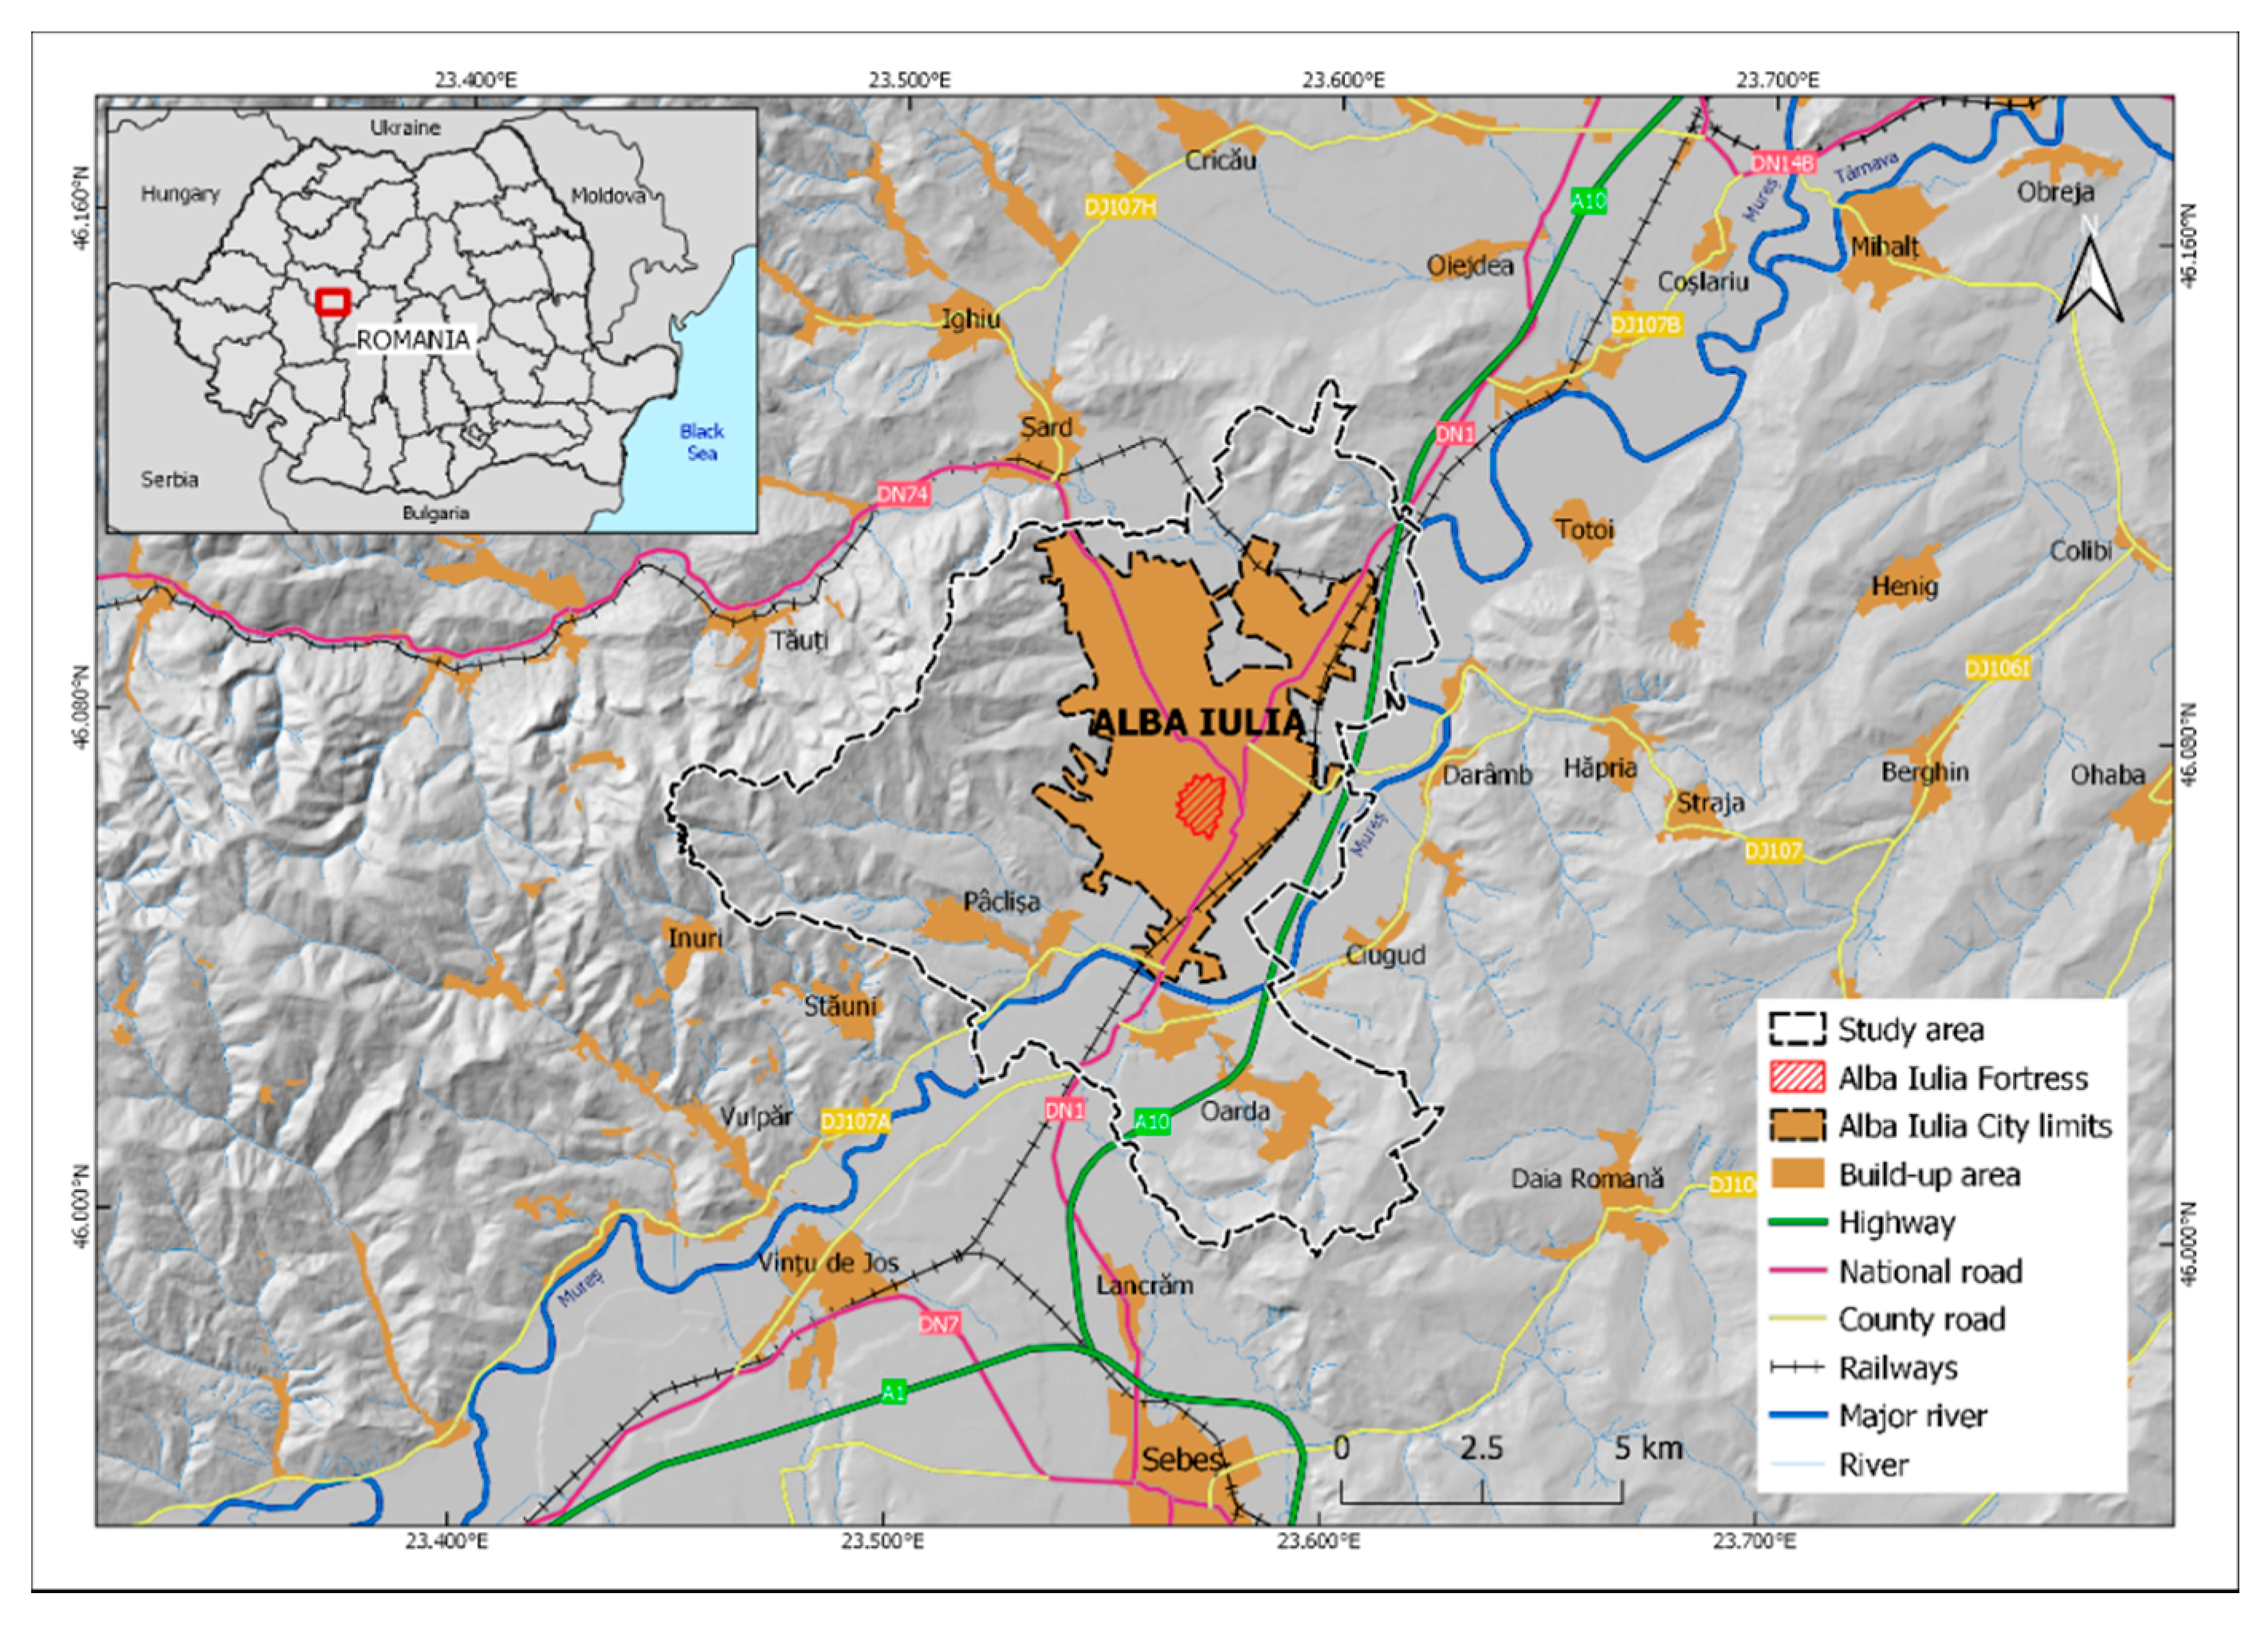
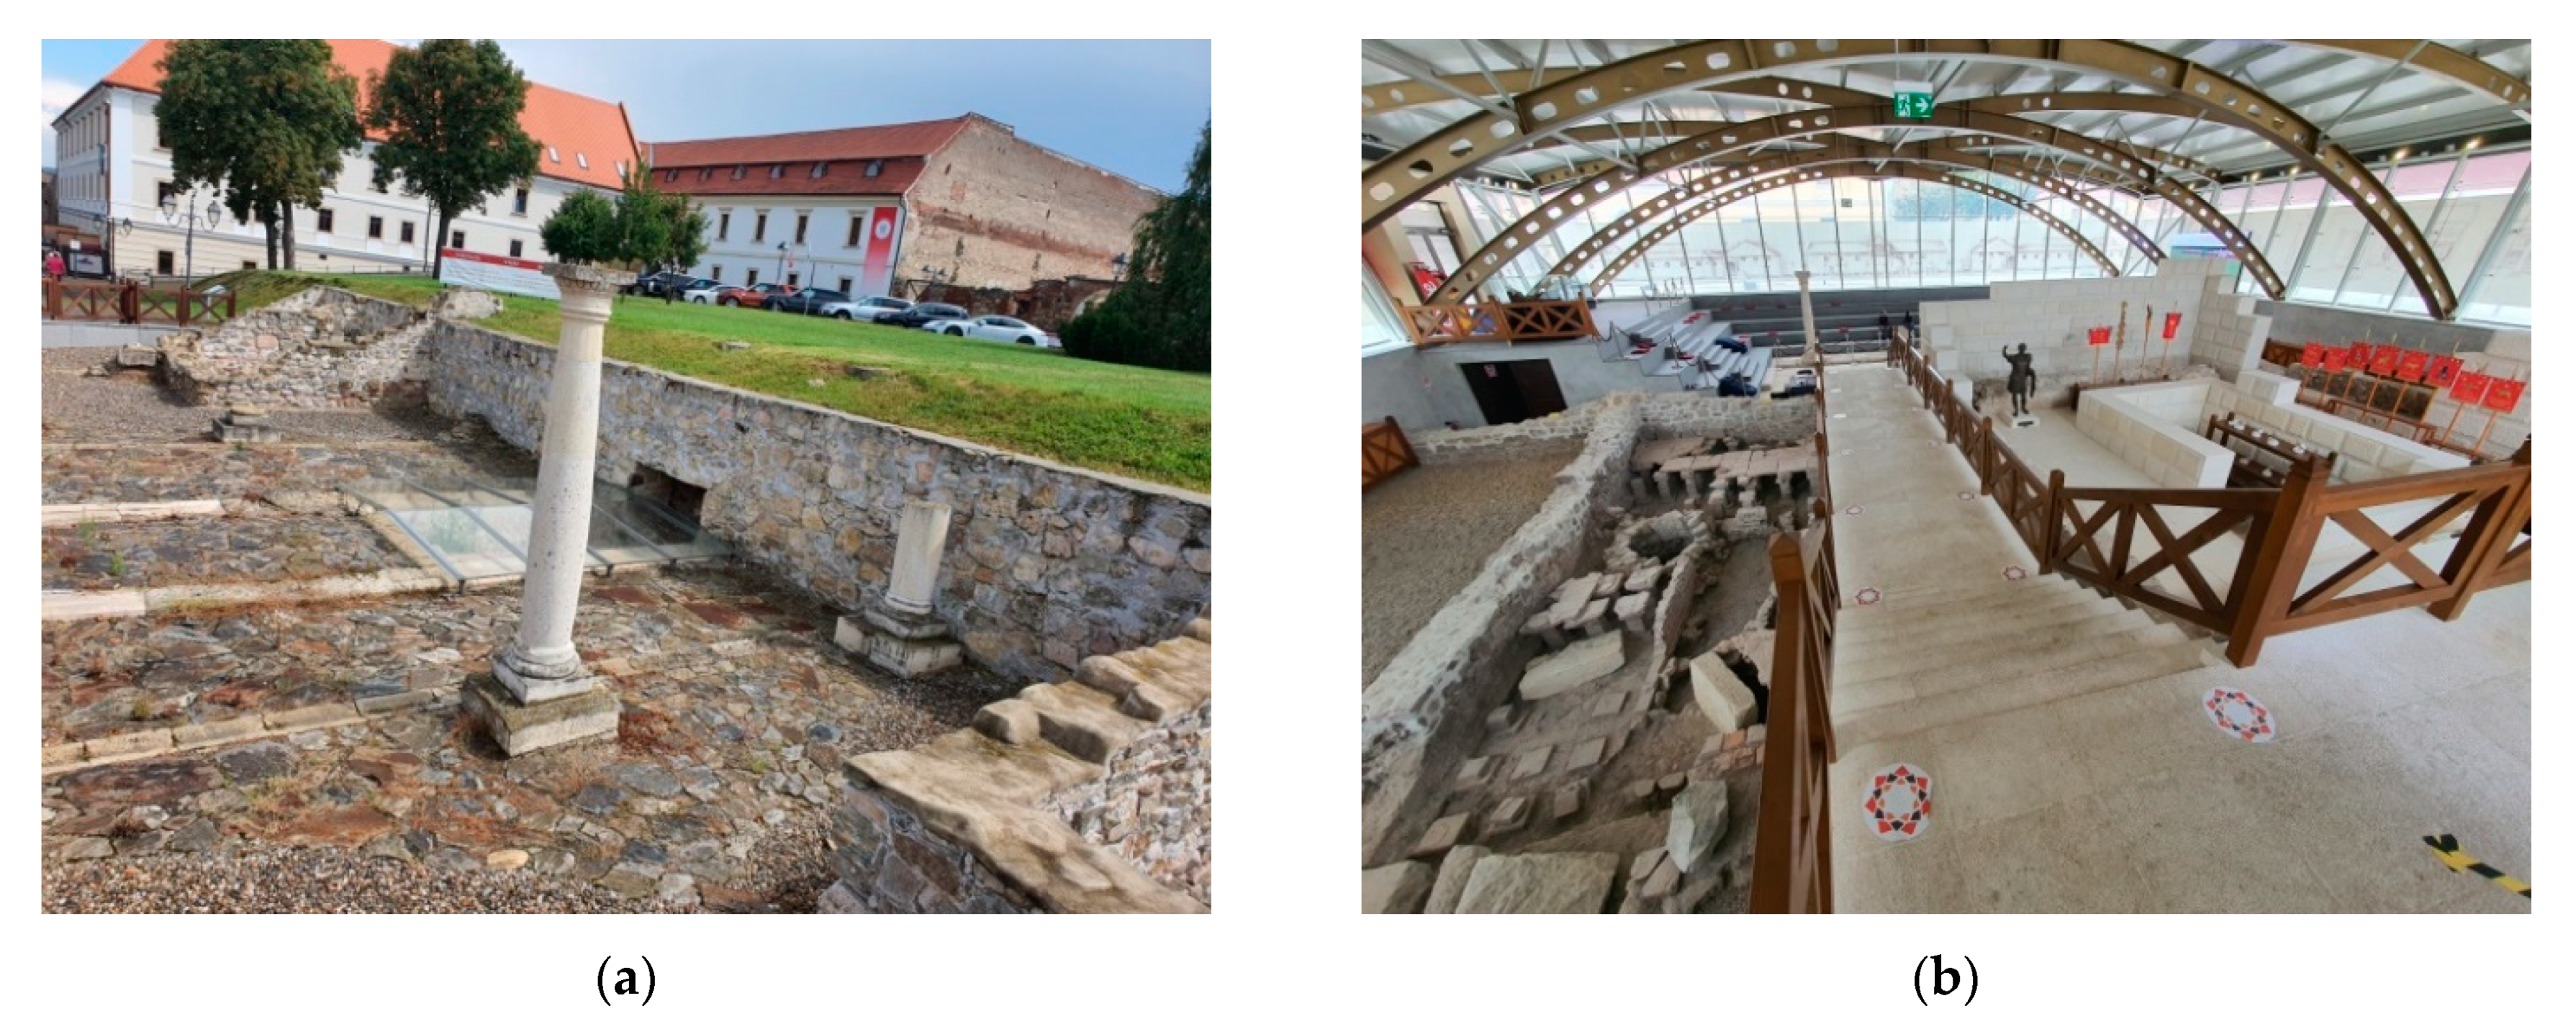
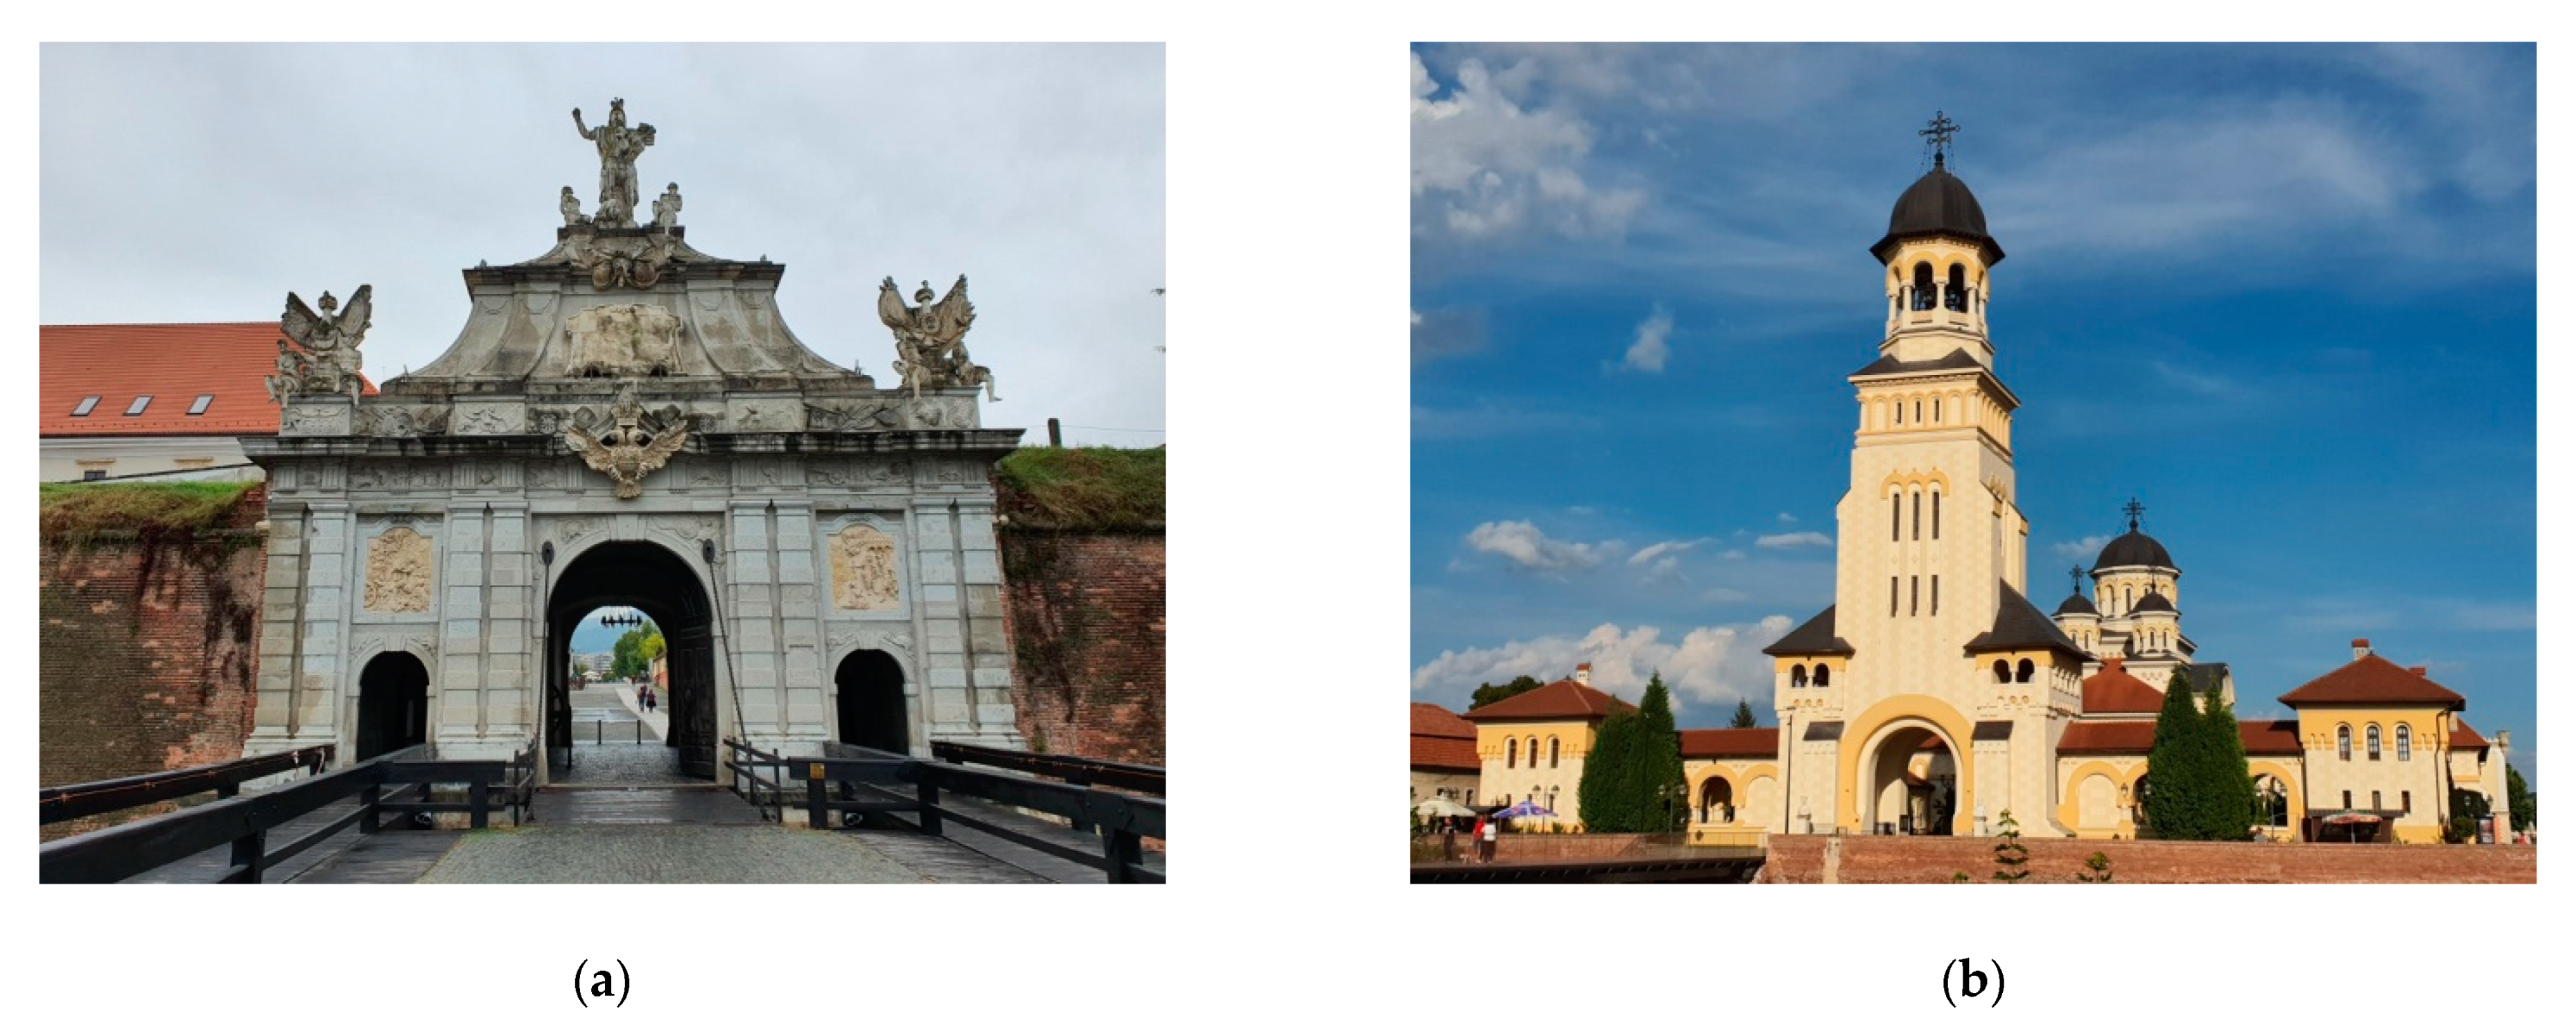
2.1. Description of the Test Site: Alba Iulia (Ancient Apulum)

The earliest traces of human presence on Alba Iulia’s territory are dated to the Neolithic [26], and the most representative site of this period also gives its name to the “Lumea Nouă” culture [27]. Alba Iulia had several major administrative roles throughout history: Apulum (the ancient name of Alba Iulia) was the capital of Roman Dacia [28], later the city was for a short period the capital of the Voivodeship of Transylvania [29,30], then the capital of the Principality of Transylvania [31], the capital of all Romanian medieval states in 1600 [32], the bastion of Austrian rule in Transylvania, the capital of the Great Unification from 1 December, 1918 (which became the national day of Romania), and the coronation capital [33]. All of these administrative functions had an impact on the architectural heritage that is largely preserved today.
In Roman times, Alba Iulia was the place of a legionary fort [34], and also of two cities with the same name that were granted colonial status (the highest a city from Roman Dacia could get); this was a unique situation in the province of Dacia, being also rarely encountered in the entire Roman Empire [28]. Several elements of the former fort of the Legio XIII Gemina are still preserved and can be visited: parts of the enclosure walls [34], the gate (porta) principalis dextra [35], the via principalis, and some of the principia.
The Roman fort was most probably built sometime between AD 107 and 108. The structure has a typical rectangular shape and the dimensions of 480 × 440 m, based on the measurements made during the investigations from 2011 [36].
Archaeological investigations conducted in 2011–2012 partially unearthed the via principalis and principia (Figure 3). A sector of via principalis with A length of 7.20 m and A width of 7.30 m was identified on that occasion. The road consisted of gravel bedding, which was probably covered with sandstone slabs. A drain made of bricks, with a depth of 0.30 m, was set under the slabs. The central lane of via principalis was reserved for carts, being delimited by two parallel rows of limestone slabs, and the side lanes were used by pedestrians.
The fort’s principia was partially investigated, allowing the identification of its main components, while the unexcavated ones were graphically reconstructed. Archaeological excavations identified parts of the atrium, armamentarium, basilica, and tabularium. The entire principia most likely measured 65 × 100/110 m, whereas the investigated area of the inner courtyard—the atrium—measured 50.85 × 38.34 m, though the reconstructed total dimensions were 50 × 50 m [36]. The atrium was initially covered with a layer of sand and was paved later with stone stabs. The basilica, measuring 65 × 30 m, was identified on the western side of the principia, alongside the aedes, a central room paved with bricks, which measured 11.22 × 9 m [36]. The aedes and its nearby rooms were delimited by the portico. The armamentarium was partially unearthed on the southern side of the principia, one of the rooms having a hypocaust. The entrance to the praetorium was on the eastern side, where four bases built of stones and bricks were identified [36].
Following the conquest of Transylvania by the Habsburg Empire and the peace of Karlovitz, Alba Iulia lost its political role but benefited from the construction of the bastion fortress of the Vauban type [37], which is still preserved almost completely today. The bastion fortress has the shape of a star with seven corners, defined by the presence of seven bastions. Aside from them, the fortress also includes a central fort, the former Roman fort, and the medieval fortress, ravelins, banquettes, counterguards, tenailles, and two rows of concentric moats with counterscarps [37]. The structure was primarily built between 1715 and 1738 to serve as the main bastion of the Austrian rule in Transylvania. However, the fortress lost its military importance during construction due to the evolution of European politics, so it was invested with a mainly administrative function that allowed the inclusion of many architectural elements of Baroque origin: four of the six gates (Figure 4a) and the bastions [38], which gave it a particular character among the other bastion fortresses of the Vauban type from Europe. The fortress (the part preserved today) was built largely following the plans of the Italian architect Giovanni Morando Visconti. The Austrian Empire left its mark on the fortress area by building a number of civilian and military institutions and public monuments, one of the most representative being the Military Club—now the Union Hall. It was built between 1898 and 1900 for the local officers. Its ballroom was the place where representatives of the Romanians from Transylvania, Banat, and Partium decided on the unification with Romania on 1 December, 1918 [39]. Another representative monument from the fortress at Alba Iulia is the Coronation Cathedral (Figure 4b) which was built for the coronation of King Ferdinand I and Queen Maria as sovereigns of Greater Romania on 15 October, 1922 [40]. The cathedral was built in 1921–1922 in the Neo-Brâncoveanu style [41]. The plan has the shape of an inscribed Greek cross measuring 53 × 18 m, with a height of 45 m [42]. The church is set into a pavilion enclosure whose western entrance is defined by a bell tower with a height of 58 m [43].
From the urban planning perspective, Alba Iulia had two distinct areas, namely, a fortified area that included the bastion fortress of the Vauban type and an open urban area that was developed in Roman times within two different locations that evolved into two attested settlements, specifically, Colonia Aurelia Apulensis and Colonia Nova Apulensis. The open urban area was developed mainly around the fortress, on the western, southern, and northern sides, almost entirely at approximately 20 m above the floodplain of the Mureș River [44]. Starting in the 18th century, the draining works performed on the eastern side of the fortress enabled the reconfiguration of the open urban area. Consequently, during the 18th and 19th centuries, the open urban area was relocated mainly to the eastern, southeastern, and northern sides of the fortress [45]. Except for the buildings located in the protected area corresponding to the fortress, the rest of the Alba Iulia buildings were built starting in the middle of the 18th century and predominantly between the end of the 19th century and the beginning of the 20th century [45]. Nowadays, the eastern and southern parts of the city are affected by the high groundwater levels that are caused by the initial marshland area that was drained [25].

2.2. Satellite Imagery and Additional Data Used in the Study

The case studies exploited satellite data acquired by different missions (i.e., Landsat, Sentinel-1, and Sentinel-2), Copernicus land cover datasets (i.e., CLC, Urban Atlas, and Urban Atlas Change), and ground-truth measurements (i.e., temperature at meteorological ground stations). The Landsat and Sentinel-1/-2 images were obtained free of charge from Earth Explorer data portal [46] and the Copernicus Data Access Hub [47], respectively.
In the first case study (i.e., the multitemporal analysis of the land cover changes), 8 Landsat (30 m spatial resolution) and Sentinel-2 (10 m spatial resolution) images acquired between 1988 and 2018 were used. These spatial resolutions were adequate for the identification of the patterns and the evaluation of the land use/land cover at a regional scale [48].
For the second case study (i.e., the thermal stress and UHI analysis), 31 Landsat images collected between 1988 and 2019 were analyzed (one image was selected for each year of the investigated time interval). The climatic conditions of Romania, which is located in the eastern part of Central Europe, between 43° and 48° northern latitude and 20° and 29° eastern longitude, cause August to be the hottest month of the year. For the years when cloud cover was present in the images from August, images from July and September were used in order to fill the gaps. The thermal band 6 of Landsat 5/7 and band 10 of Landsat 8 were used within the study. During the Level 1C processing step, all the thermal bands were resampled to 30 m, thus facilitating the processing of long-term time series.
Within the third case study (i.e., the ground and structural stability analysis), 37 Sentinel-1A (S1A) and 37 Sentinel-1B (S1B) C-band SAR images collected from 2018 to 2020 were exploited. The data were acquired using the Interferometric Wide Swath (IW) mode, in Single Look Complex (SLC) format with VV polarization and a repeat cycle of 12 days, from descending (S1A) and ascending (S1B) orbits.
Additional land cover datasets provided by CLMS [49] were correlated with the multitemporal analysis, thus strengthening the results’ validation. CLC provides consistent and thematically detailed information on land cover and land cover changes across Europe [50,51]. The Urban Atlas provides reliable, inter-comparable, high-resolution land use and land cover data for European urban areas [52]. In this study, CLC datasets corresponding to the years 2000, 2006, 2012, and 2018 and Urban Atlas Change datasets covering the intervals of 2006–2012 and 2012–2018 were used.
For the validation of the thermal stress study and UHI analysis, temperature data recorded by the meteorological ground station located in the center of Alba Iulia were employed, courtesy of the National Meteorological Administration.

2.3. Methodology

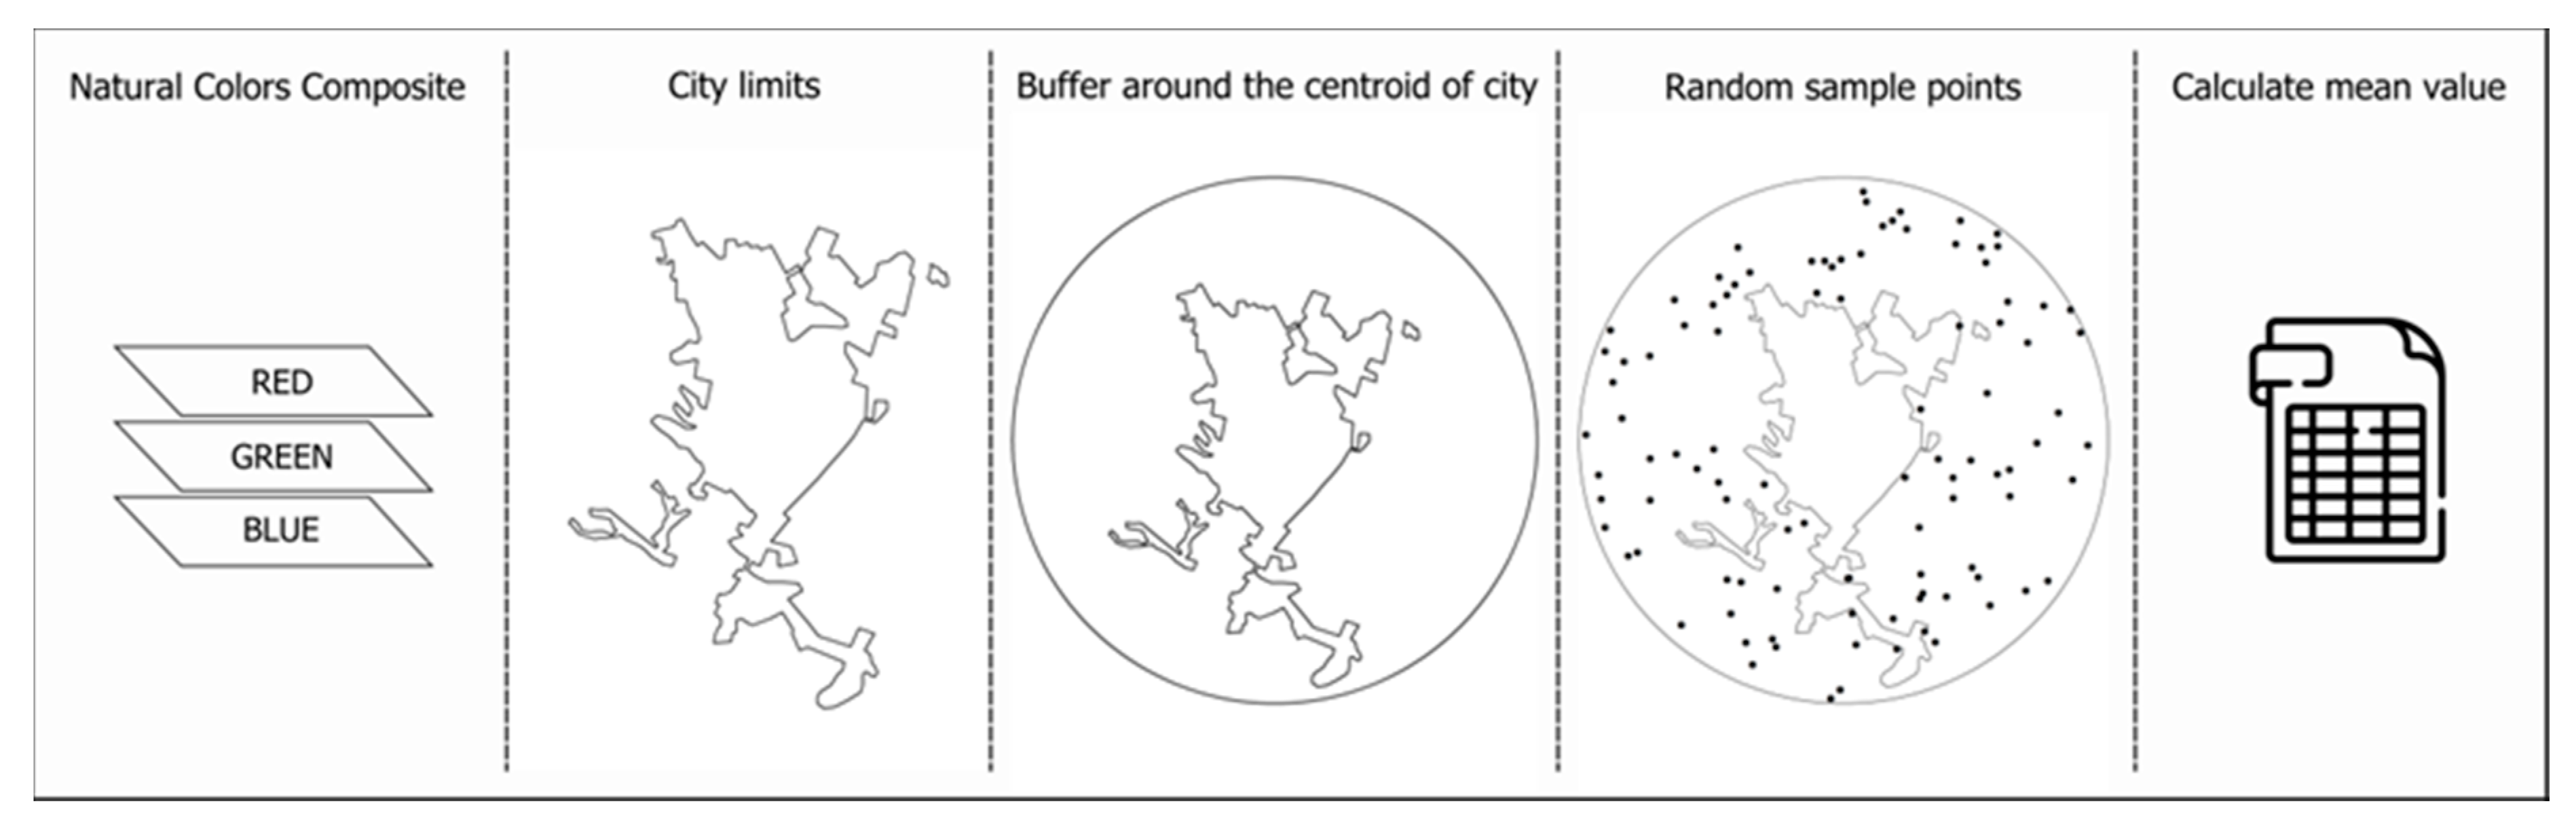
2.3.1. Multitemporal Analysis of the Land Cover Changes through Supervised Classification

The dynamic modifications of the land cover can be identified and monitored using satellite imagery [14]. This analysis aims to identify the risk factors of land cover changes that can affect the cultural heritage site. Based on multitemporal satellite data, the case study presents the evolution of the land cover within the study area over a time frame of 30 years. For a comprehensive analysis of a cultural heritage site, Bai et al. [14] demonstrated that the monitoring of its surrounding area is essential. Therefore, the study area was represented by the Alba Iulia territorial administrative unit, which includes the following component localities: Alba Iulia, Bărăbanț, Micești, Oarda, and Pâclișa.
Supervised classification of the multitemporal images was performed for the identification of the land cover changes, as this approach is suitable for the monitoring and management of the built-up areas [53]. The processing of the Landsat and Sentinel-2 images was performed using the ArcGIS Software. Considering the human activities and the development of functional areas, five main classes were defined and analyzed, namely: Arable land, Grassland, Forest, Built-up area, and Water course. The land cover maps were obtained through the supervised classification of the time series composed of the 8 satellite images, using the maximum likelihood method. The main steps of the supervised classification include the subset of the area of interest, the definition of the training samples, and the generation of the classification results.
The maximum likelihood algorithm represents the most common technique used in the supervised classification process [54,55], which involves the spectral information of each pixel to generate the land cover map. Maximum likelihood is a parametric statistical method that uses training zones defined by the analyst for the classification of the entire scene. The distribution of the training data within each class sample in the multidimensional space is assumed to be normal (Gaussian). Using probability density functions, each pixel of the image is allocated to the class to which it has the highest probability of being a member [56].
The accuracy assessment of the supervised classification represents a significant step in the classification process. A confusion matrix to determine the overall accuracy of the classification was employed. This calculates the accuracy of the classification by comparing the pixels of a reference image considered the ground truth with the classified pixels [57]. The pixels corresponding to all possible correlations between ground truth and the classified results are in the cells of the tables. The columns represent the true classes, whereas the rows correspond to the predicted classes. The correctly identified pixels are distributed on the major diagonal of the matrix and the non-diagonal cells represent classification error values. The overall accuracy was calculated for each image using the following formula:
Overall   accuracy = the   sum   of   the   correctly   identified   pixels   the   total   number   of   pixels × 100
Next, the land use/land cover changes were analyzed (also including the supplementary land cover datasets), with a special emphasis on the evolution of the urban extension, as the process might affect the cultural heritage site and cause significant changes in temperature values as well [14].

2.3.2. Evaluation of the Thermal Stress Using UHI Analysis

Urbanization creates modifications in the local low atmosphere because of the changes in energy exchange rates. UHI is described as the difference in temperature between the impervious areas and the surrounding rural areas. Urban development creates large areas with low albedo values that store thermal radiation. The phenomena can be most clearly noticed at nighttime when the temperatures in the impervious areas remain higher than in the surrounding areas [58]. Increasing temperatures can have a negative impact on the well-being of citizens, especially in areas where heat waves are frequent. UHI can increase the negative impacts of heat waves, threatening citizens with health issues. The goal of this case study was to check whether in the past decades urban growth combined with global climate change contributed to UHI temperature rise and to identify the areas of Alba Iulia that are subject to the most significant changes.
It is predicted that global climate change will increase the frequency and extension of heat waves around the globe [59]. Combined with the rapid expansion of urban areas, the effects will be more intense than ever before. Living in such conditions will require more resources in order to maintain regular day-to-day activities, mainly to keep indoor habitation spaces at normal temperatures.
UHI can be determined using the thermal infrared band of optical remote sensing satellites [60]. Compared to the in-situ measurements, in which case a limited number of areas can be monitored, satellite remote sensing gives the possibility of obtaining precise measurements over large areas with minimum costs. The availability of the Landsat archive enables the long-term identification of the temperature trend.
After calculating the brightness temperature at sensor, the next step in the assessment of UHI is represented by the delineation of the city limits using Landsat Natural Color Composite images for the years that recorded the biggest changes in the urban footprint. After analyzing the satellite images for the entire investigated period, five representative years were selected: 1994, 2000, 2006, 2010, and 2018. The urban footprints were extracted in vector format (polygon type) using ArcGIS.
For the city limit corresponding to the year 2018, a centroid was created and used as the base for generating a buffer of 7.5 km that enclosed the city (Figure 5). The dimension of the buffer was chosen to be 7.5 km in order for the resulting vector to be larger than the extremities of the city. After the buffer creation, a total of 100 random sample points were created inside the clipped buffer, but outside the city limits. The resulting points were used to calculate the mean temperature outside the city limits for each of the 31 Landsat satellite images exploited in this study. In order to calculate the UHI, the values previously calculated were subtracted from the land surface temperature product.
The goal of the approach was to verify whether there was a correspondence between the expansion of the city limits and its UHI, and temperatures inside the historically important Alba Iulia Fortress. In order to check this hypothesis, another mask was created inside the Alba Iulia city limits to delineate Alba Iulia Fortress. In order to extract and compare the mean values of the temperatures corresponding both to Alba Iulia city and Alba Iulia Fortress, the Zonal Statistics function from the ArcGIS 10.4 software was used. The Pearson correlation coefficient was computed for the statistical analysis of the results. Next, the validation step was performed using in situ temperature data provided by the National Meteorological Administration.

2.3.3. Assessment of the Ground and Structural Stability Based on PS-InSAR

In this case study, PS-InSAR was considered the most suitable technique for the monitoring of Alba Iulia, based on multitemporal SAR data. PS-InSAR enables the estimation of the displacement velocity at the millimeter level and yields the best results when applied to built-up areas.
The interferometric processing of the SAR images was accomplished using the SARscape tool of the ENVI software. The PS-InSAR technique implies the identification of single coherent pixels [61], named Persistent Scatterers (PSs), for the calculation of their displacement velocity within a large series of SAR data. The free access to Sentinel-1 imagery was the key element of this case study. For a higher accuracy of the displacement estimation and lower atmospheric effects, the stack of SAR images was subject to intensive computation steps that are described hereunder.
Firstly, the Sentinel-1 SLC images were imported and the satellite positions were corrected using the Precise Orbit Determination (POD)—Precise Orbit Ephemerides provided by European Space Agency (ESA). Next, the area of interest was delimitated (i.e., the Alba Iulia administrative boundary) and the satellite images were cropped accordingly. Afterward, an analysis of the spatial and temporal baselines was carried out for the identification of the pairs that exceeded the thresholds and of the most suitable pairs that had the lowest baselines [62].
The displacement in the Line of Sight (LOS) of the satellite could be measured using the phase difference of two SAR acquisitions. The phase difference is affected by various factors that contribute to the phase noise, namely, the geometric decorrelation, the temporal decorrelation, and the atmospheric disturbance [63]. To reduce the phase noise, the SAR images were co-registered into interferograms and multilooked, thus obtaining a better radiometric resolution [63].
The software estimates the displacement velocity in two mandatory steps called the first and second inversion. The first step inversion achieves the residual height and displacement velocity [64]. The radar signal characterized by high coherence was identified in order to analyze its phase history. The selected PS candidates had stable temporal behavior [65]. In the second step inversion, the noise due to the atmospheric component is calculated and subtracted from the phase [63].
The last step is represented by the georeferencing process. The output is a file containing the PSs symbolized as points. In this step, a coherence threshold of 0.65 was applied, considering that coherence ranges from 0 to 1, starting from low data quality to high quality [66]. The LOS and the vertical displacements were generated and projected into the WGS84 cartographic system. Due to the looking angle, the satellite observes and measures the vertical displacements more accurately than the horizontal ones [62]. If the PSs are moving towards the satellite, the displacement values are positive, and if the movement is away from the satellite the values are negative.
The LOS measurements were transformed into the vertical displacements using the following equation [67]:
Δ s = Δ R c o s   θ ( i n c )
where Δs is the surface displacement in the vertical direction, ΔR is the LOS displacement, and θ(inc) is the incidence angle.
The great advantage of using satellite remote sensing data in general and the PS-InSAR technique in particular is that investigations can be conducted over large areas, the temporal sampling is suitable for many applications, and accurate results can be immediately obtained. In comparison, the ground techniques that can be used to obtain the same outcomes as those resulting from the PS-InSAR require a more considerable amount of time and effort. The PS-InSAR technique allows for the identification of the potential vulnerable areas and proved to be a crucial tool for a more effective cultural heritage management.

3. Results

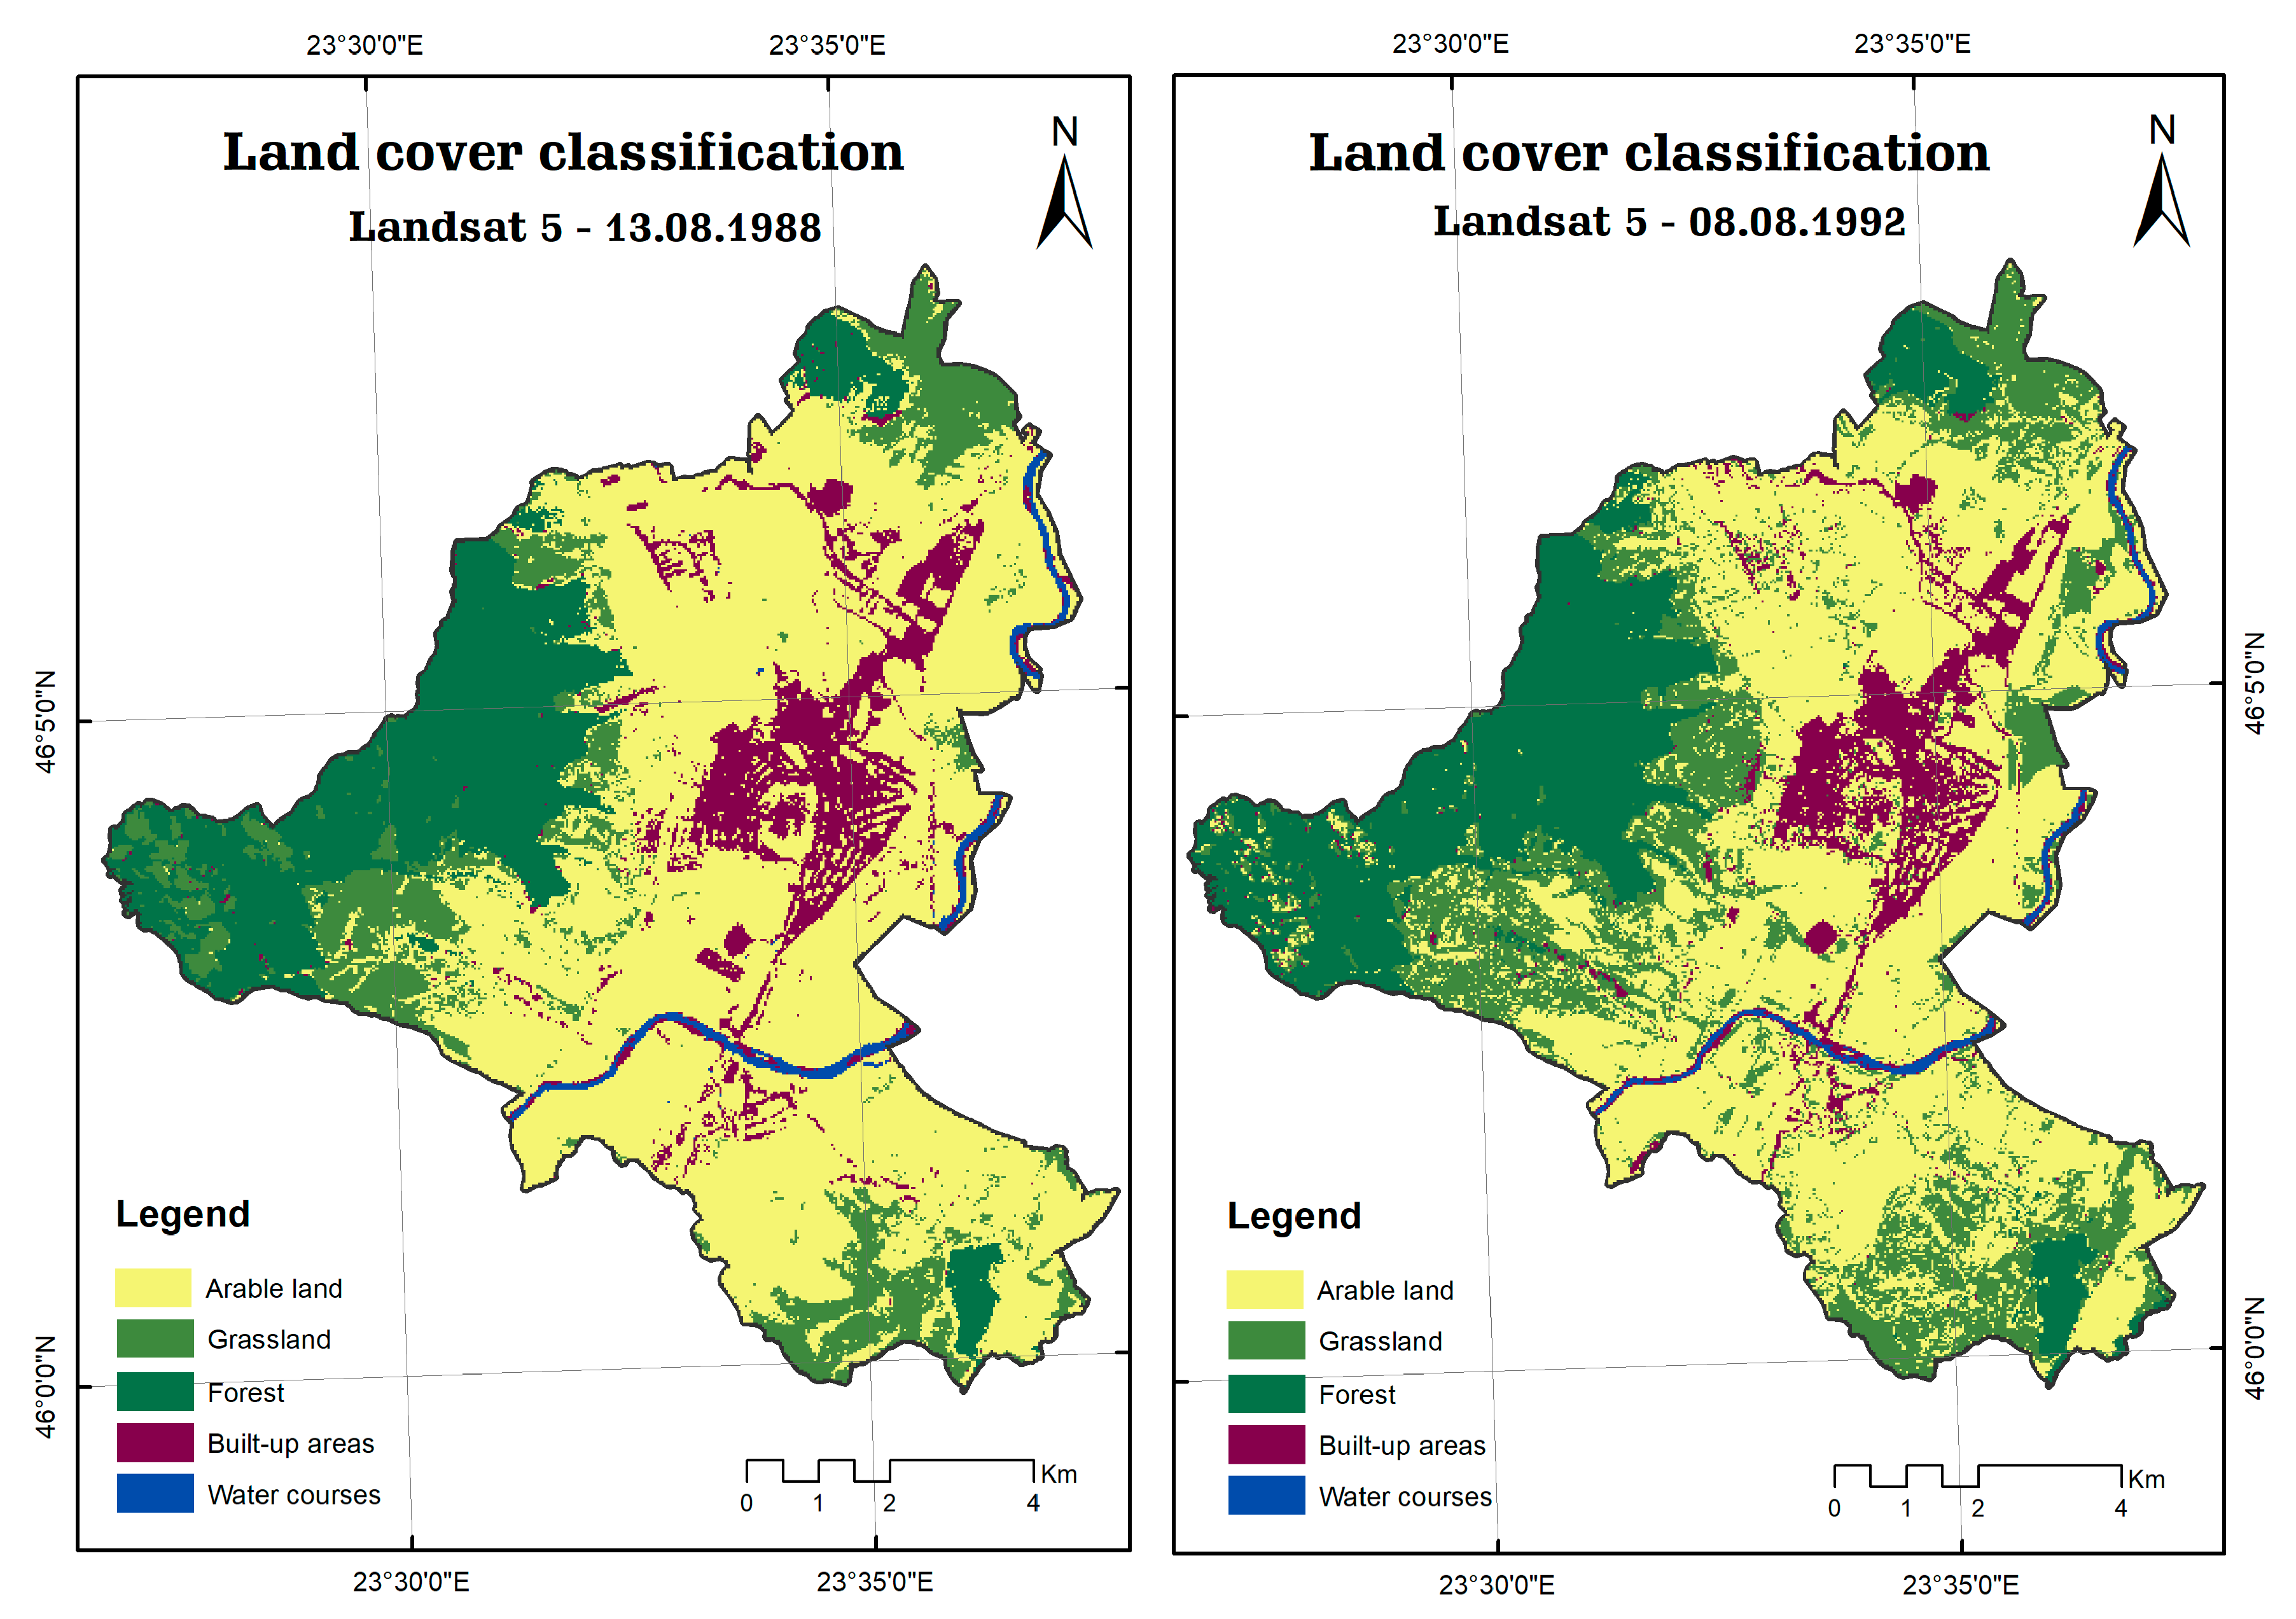
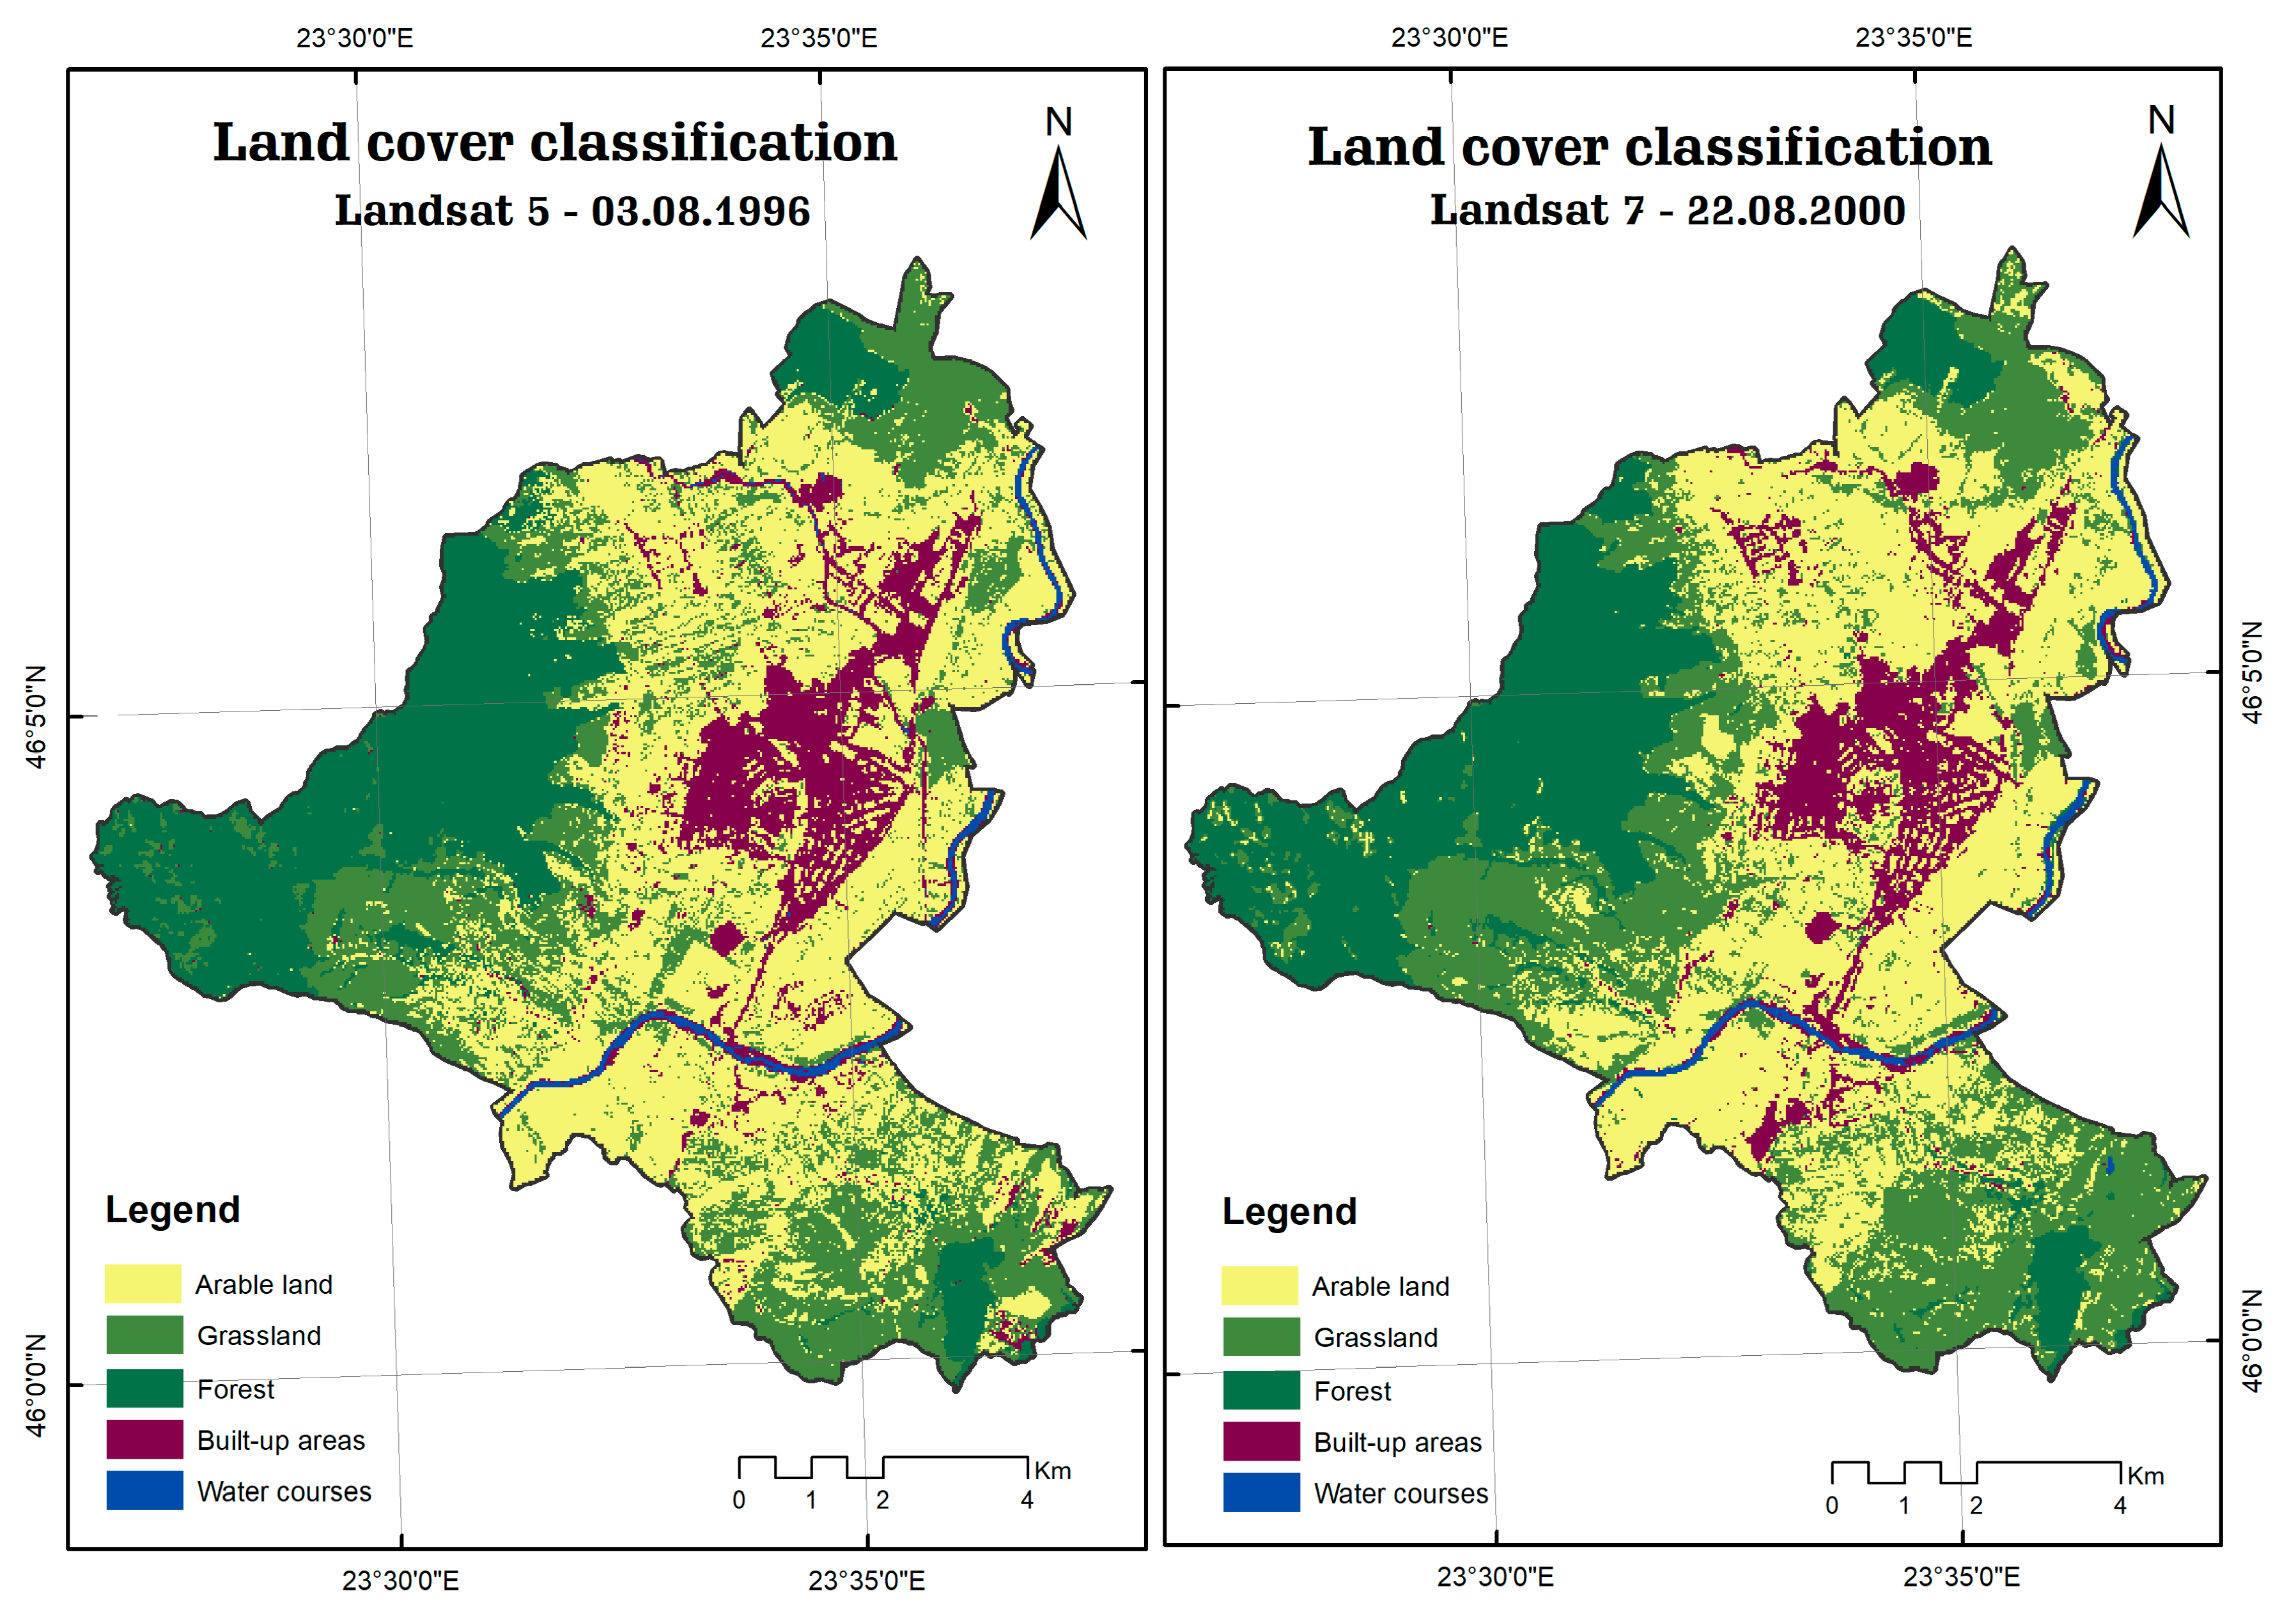
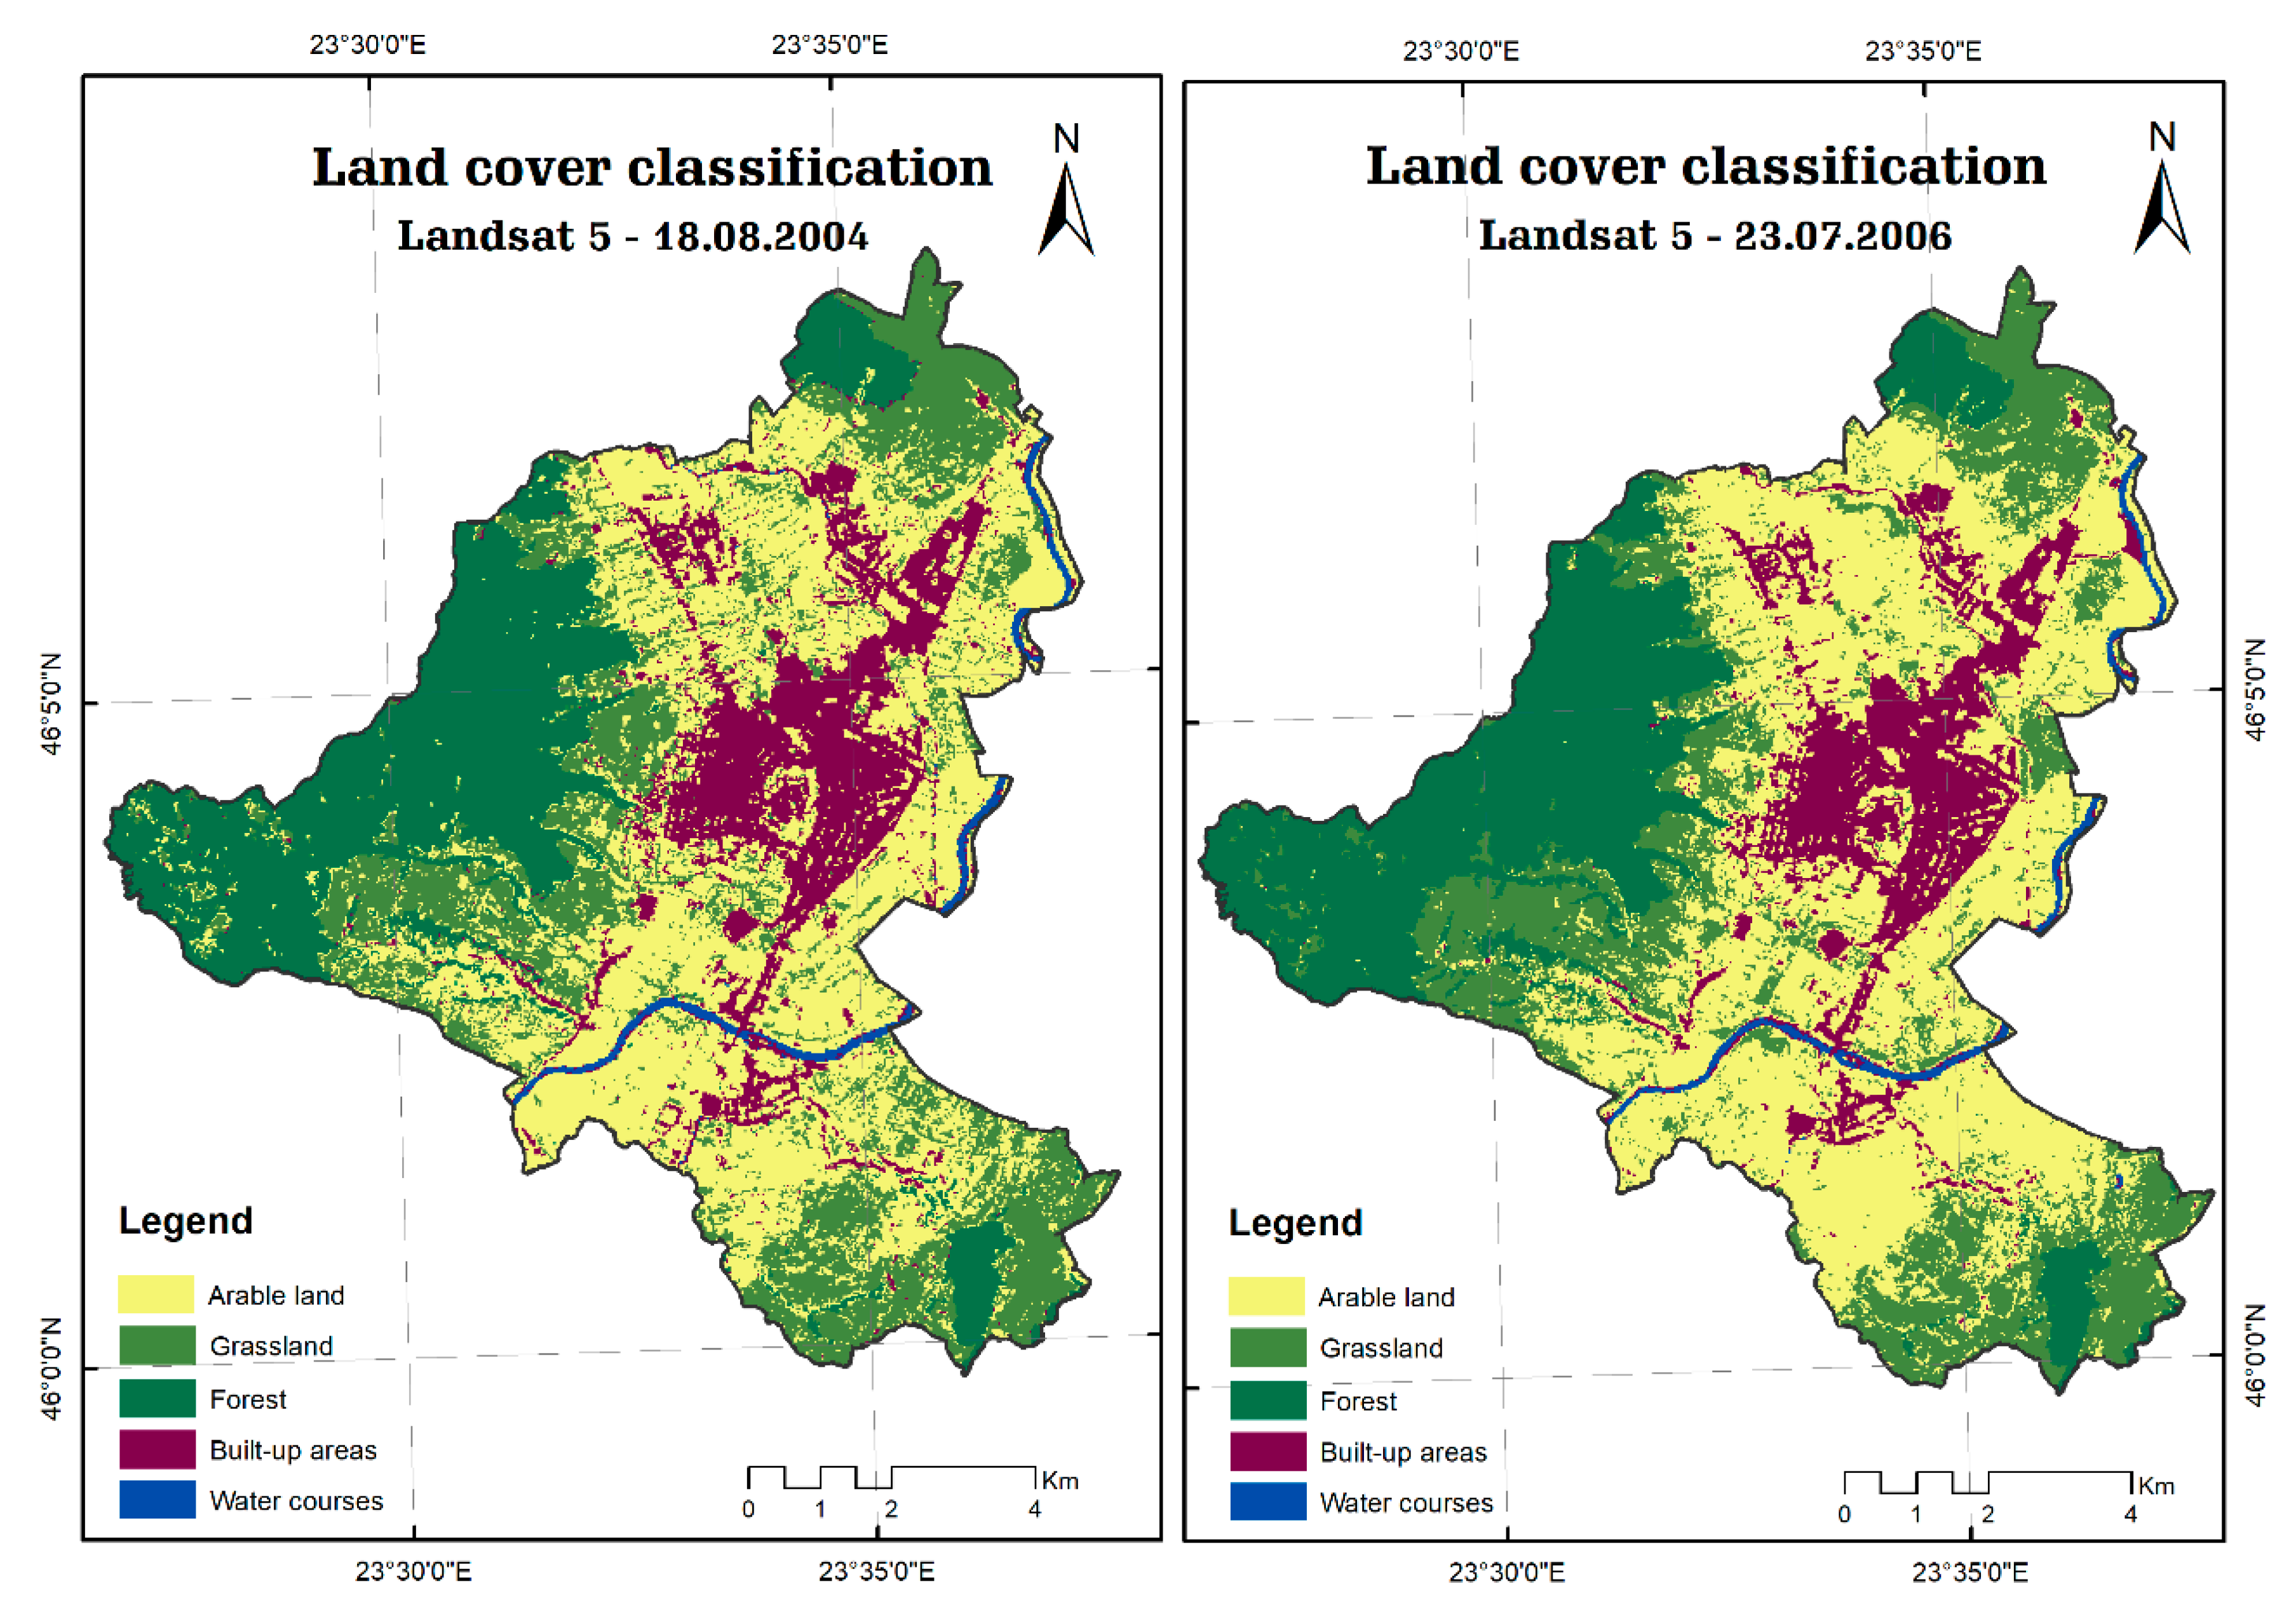
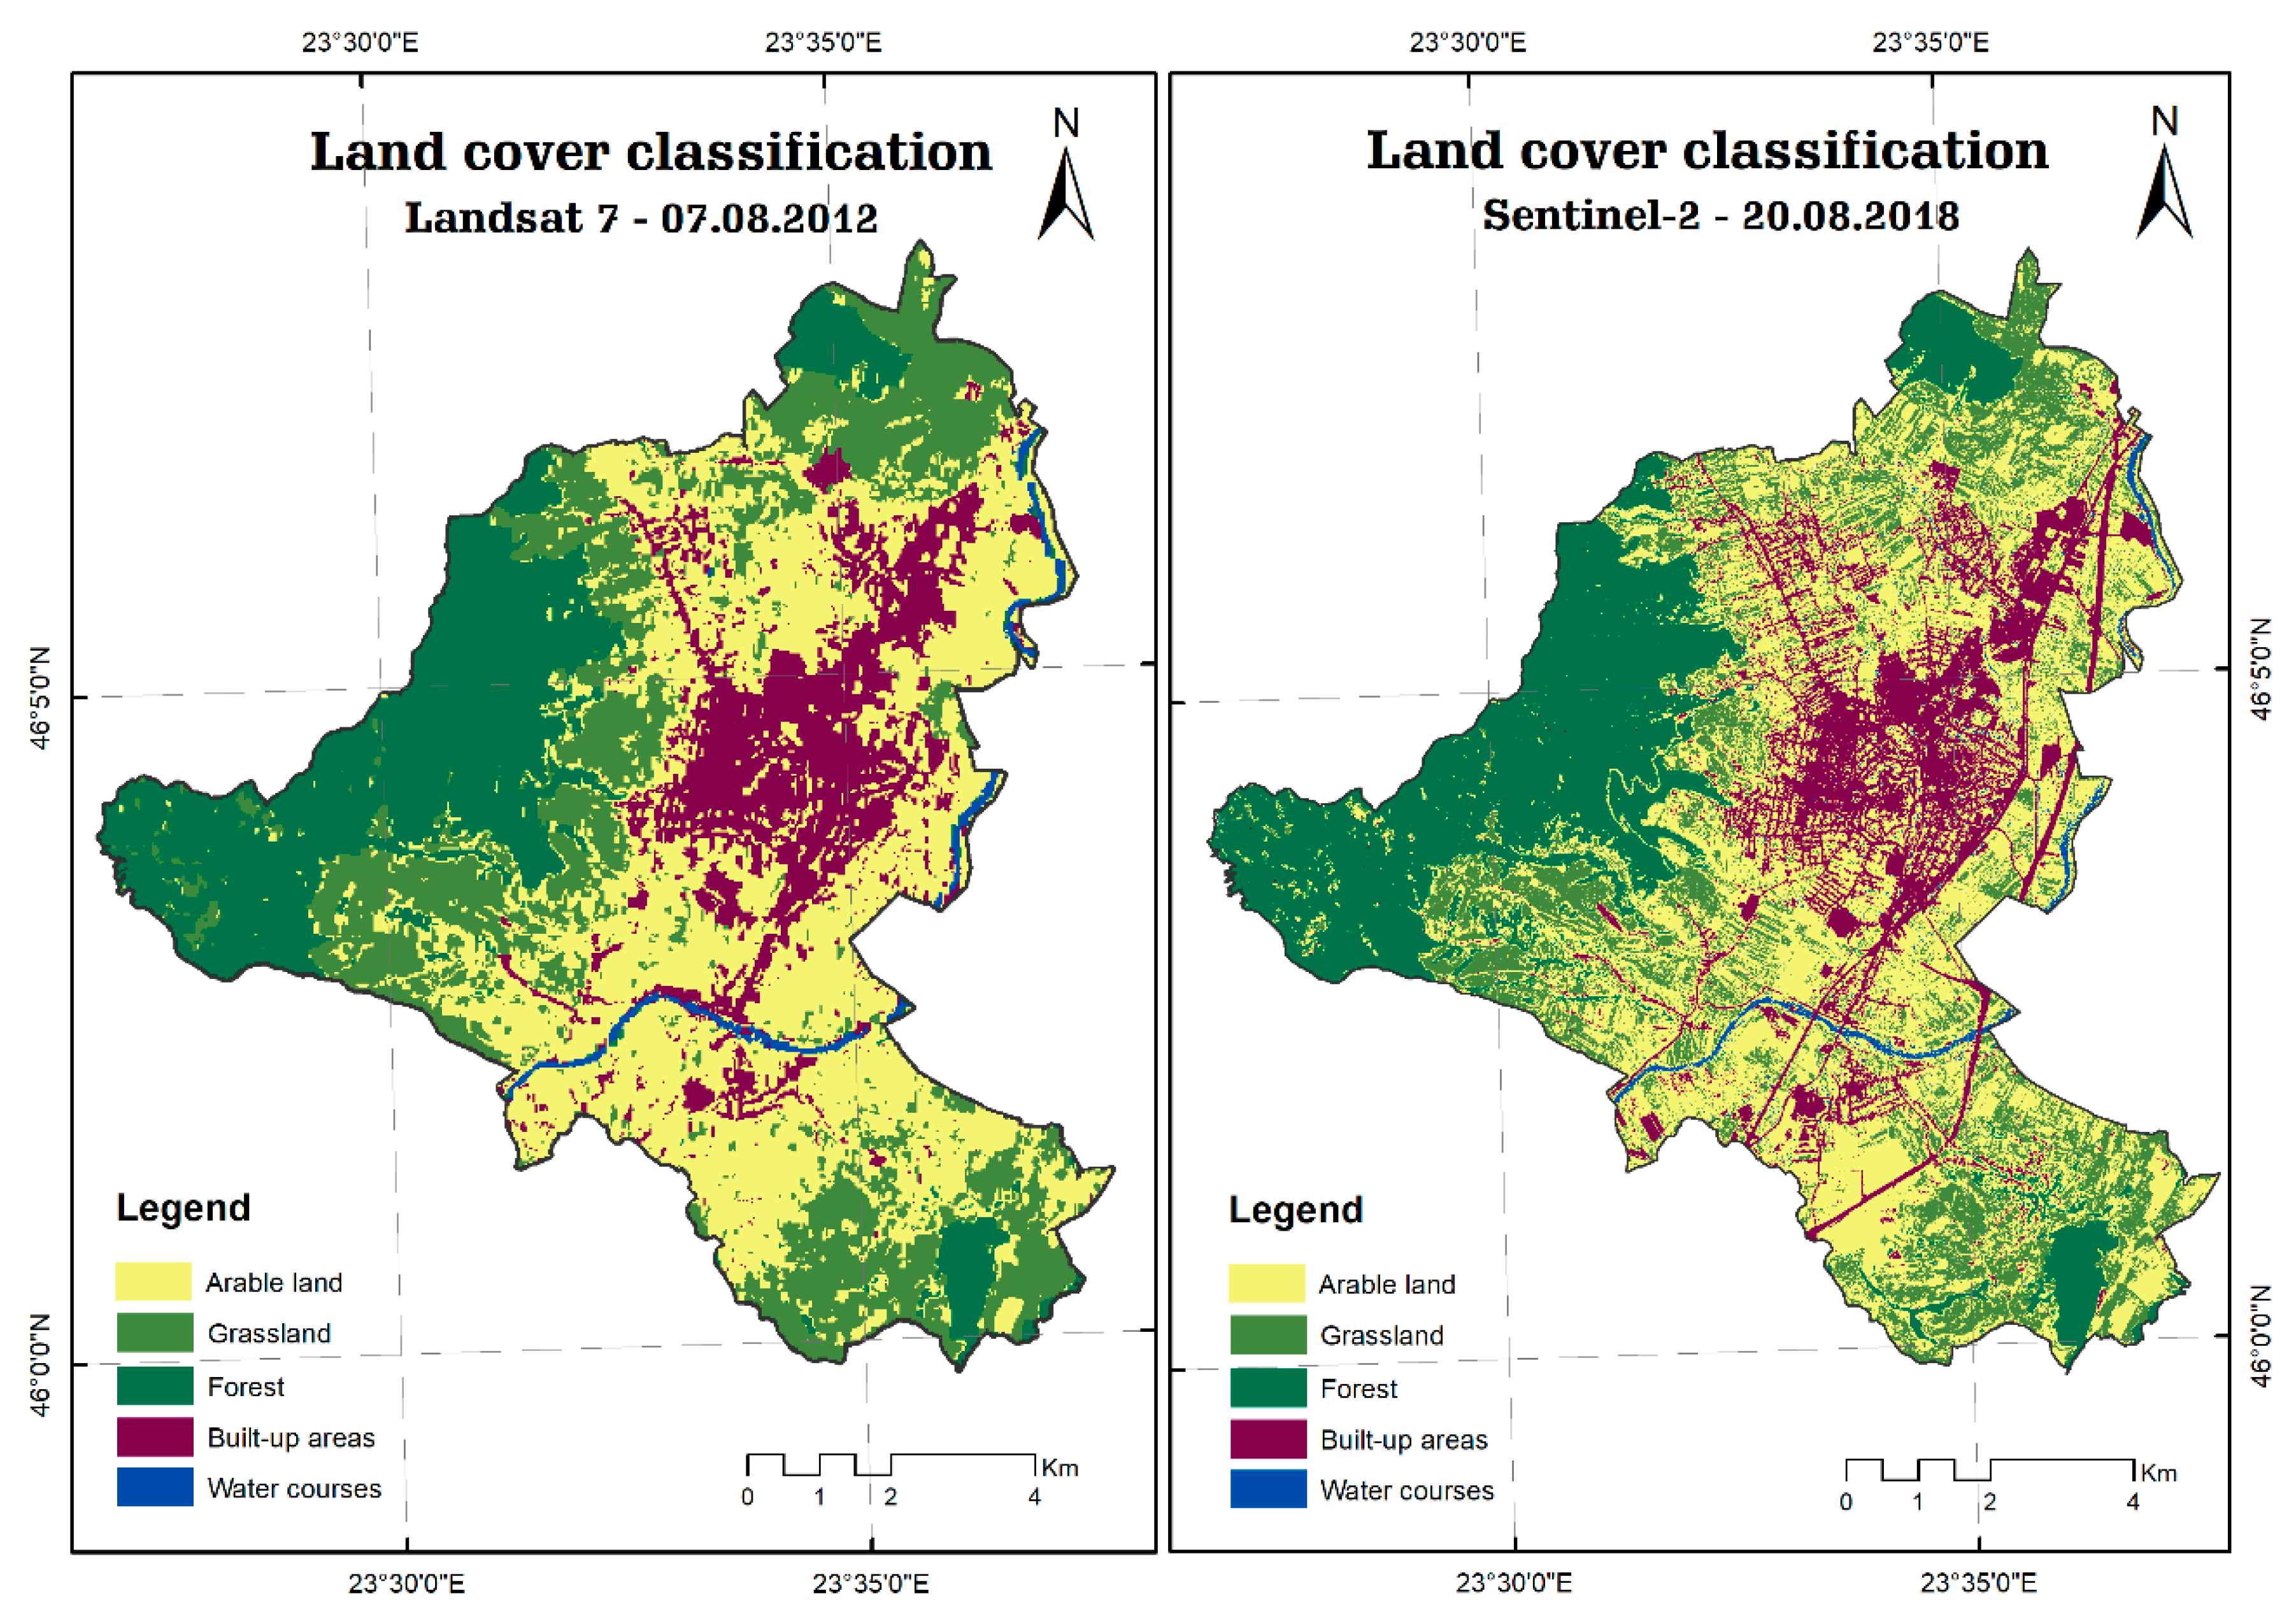
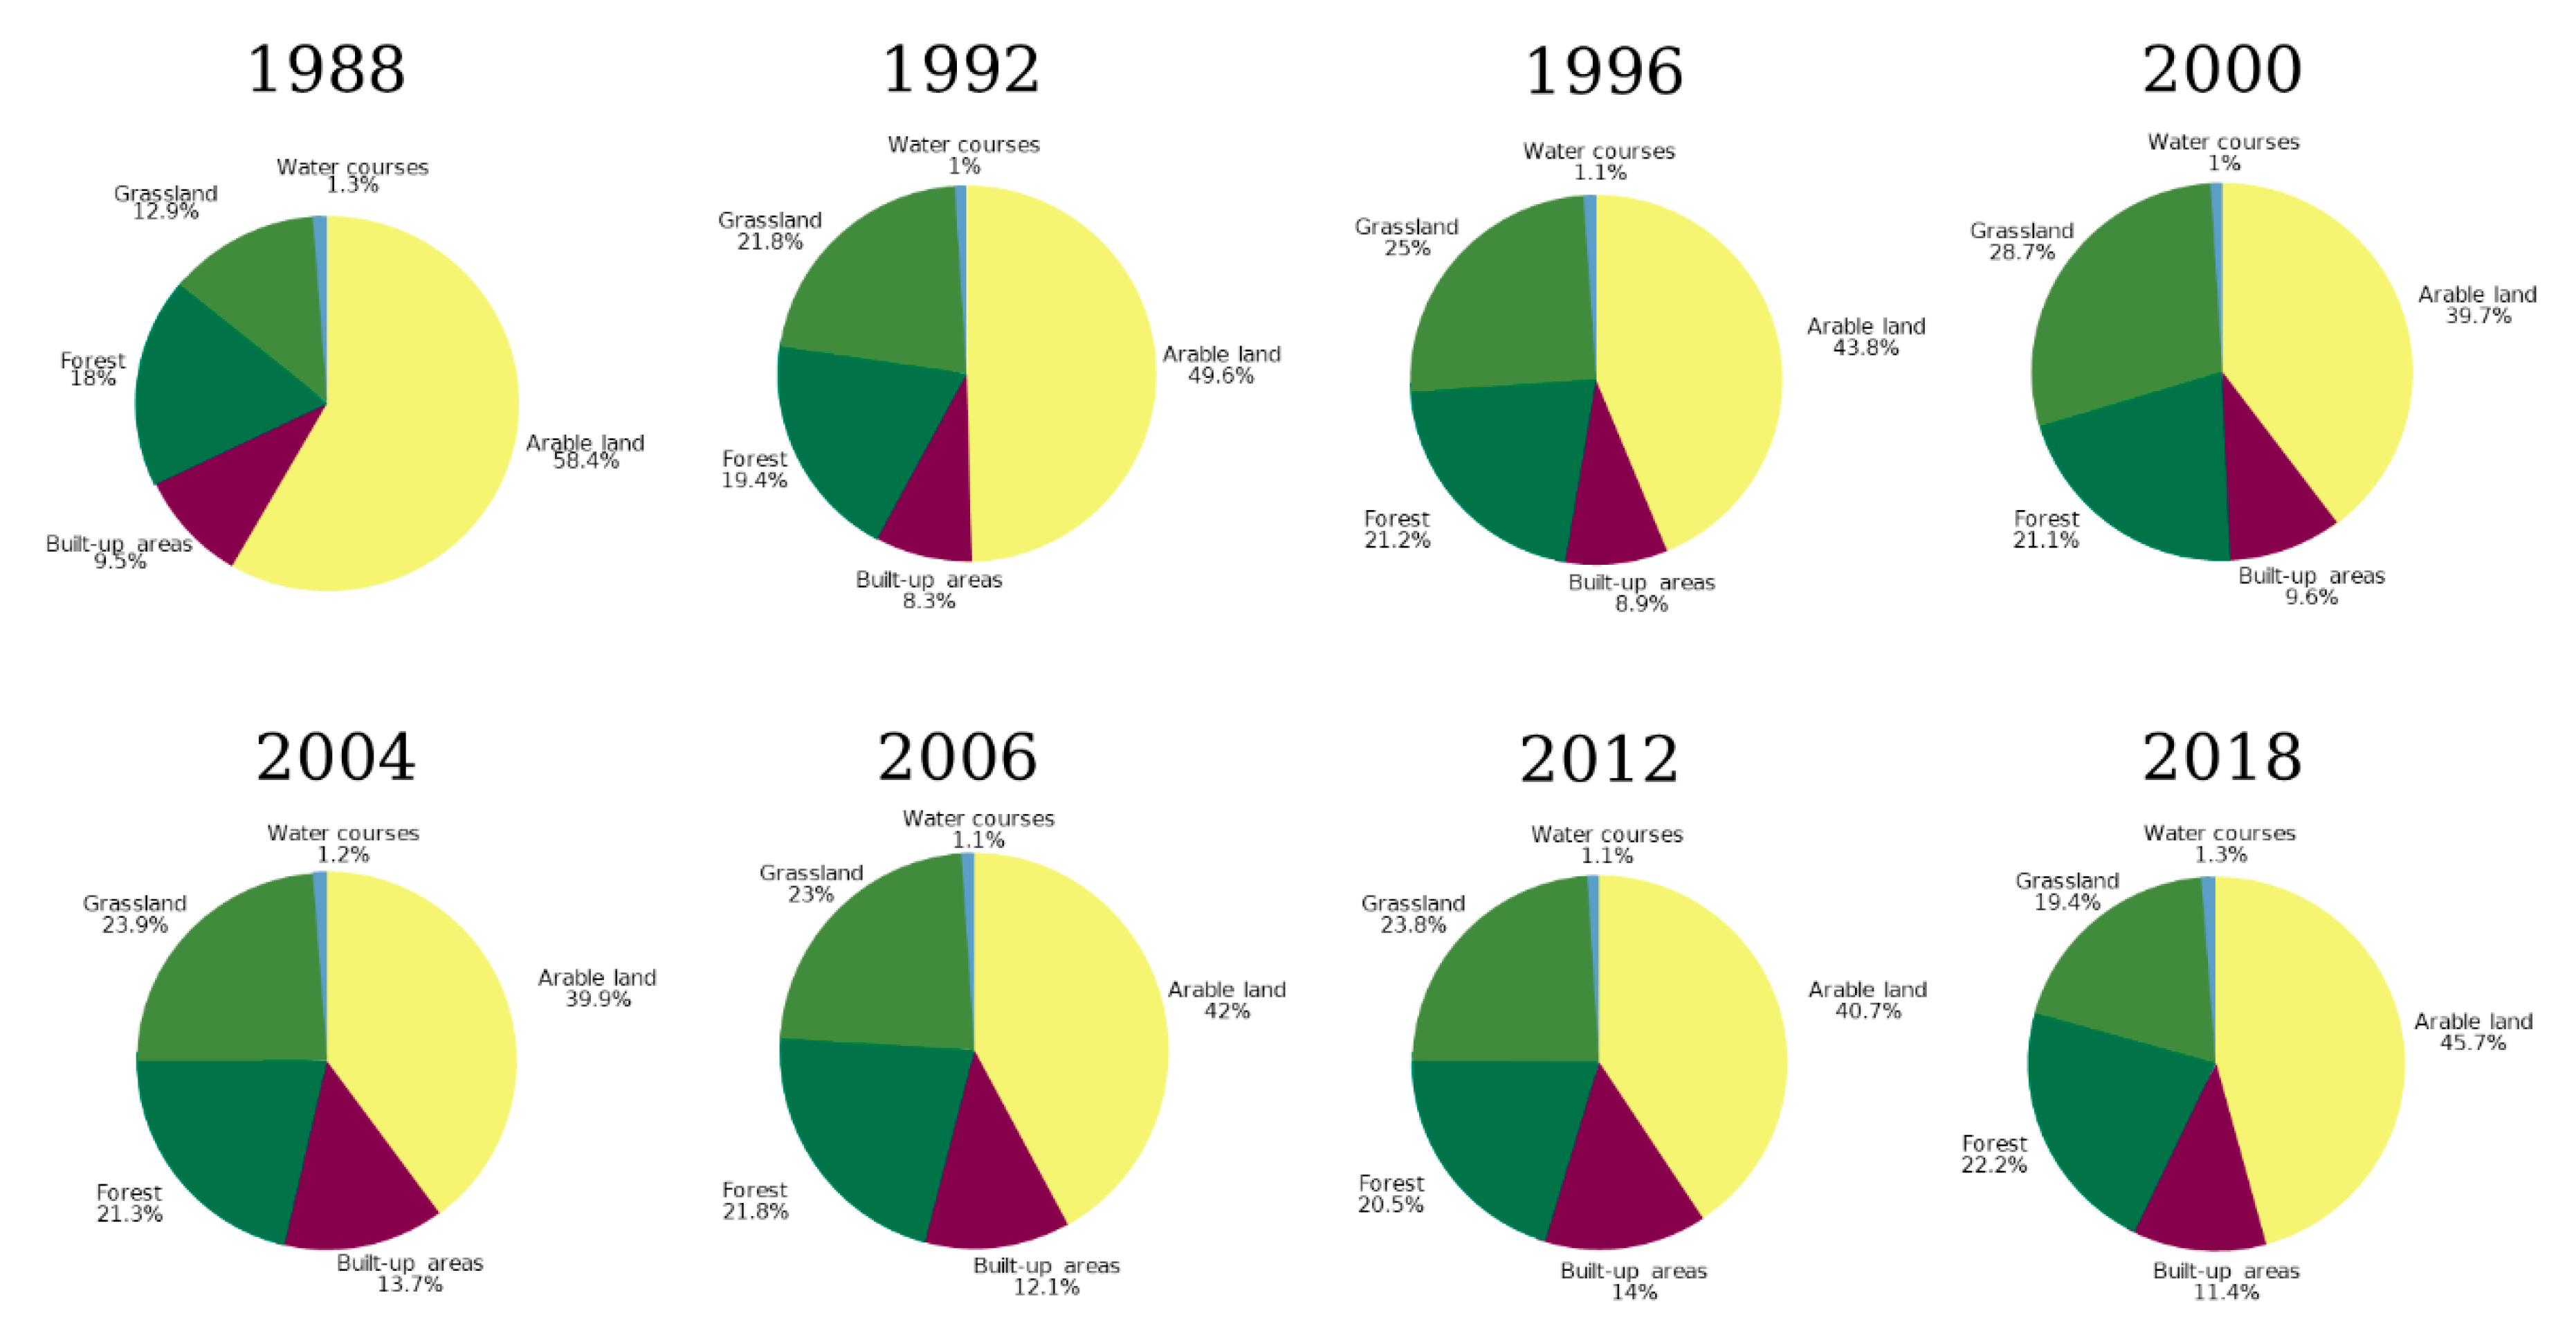
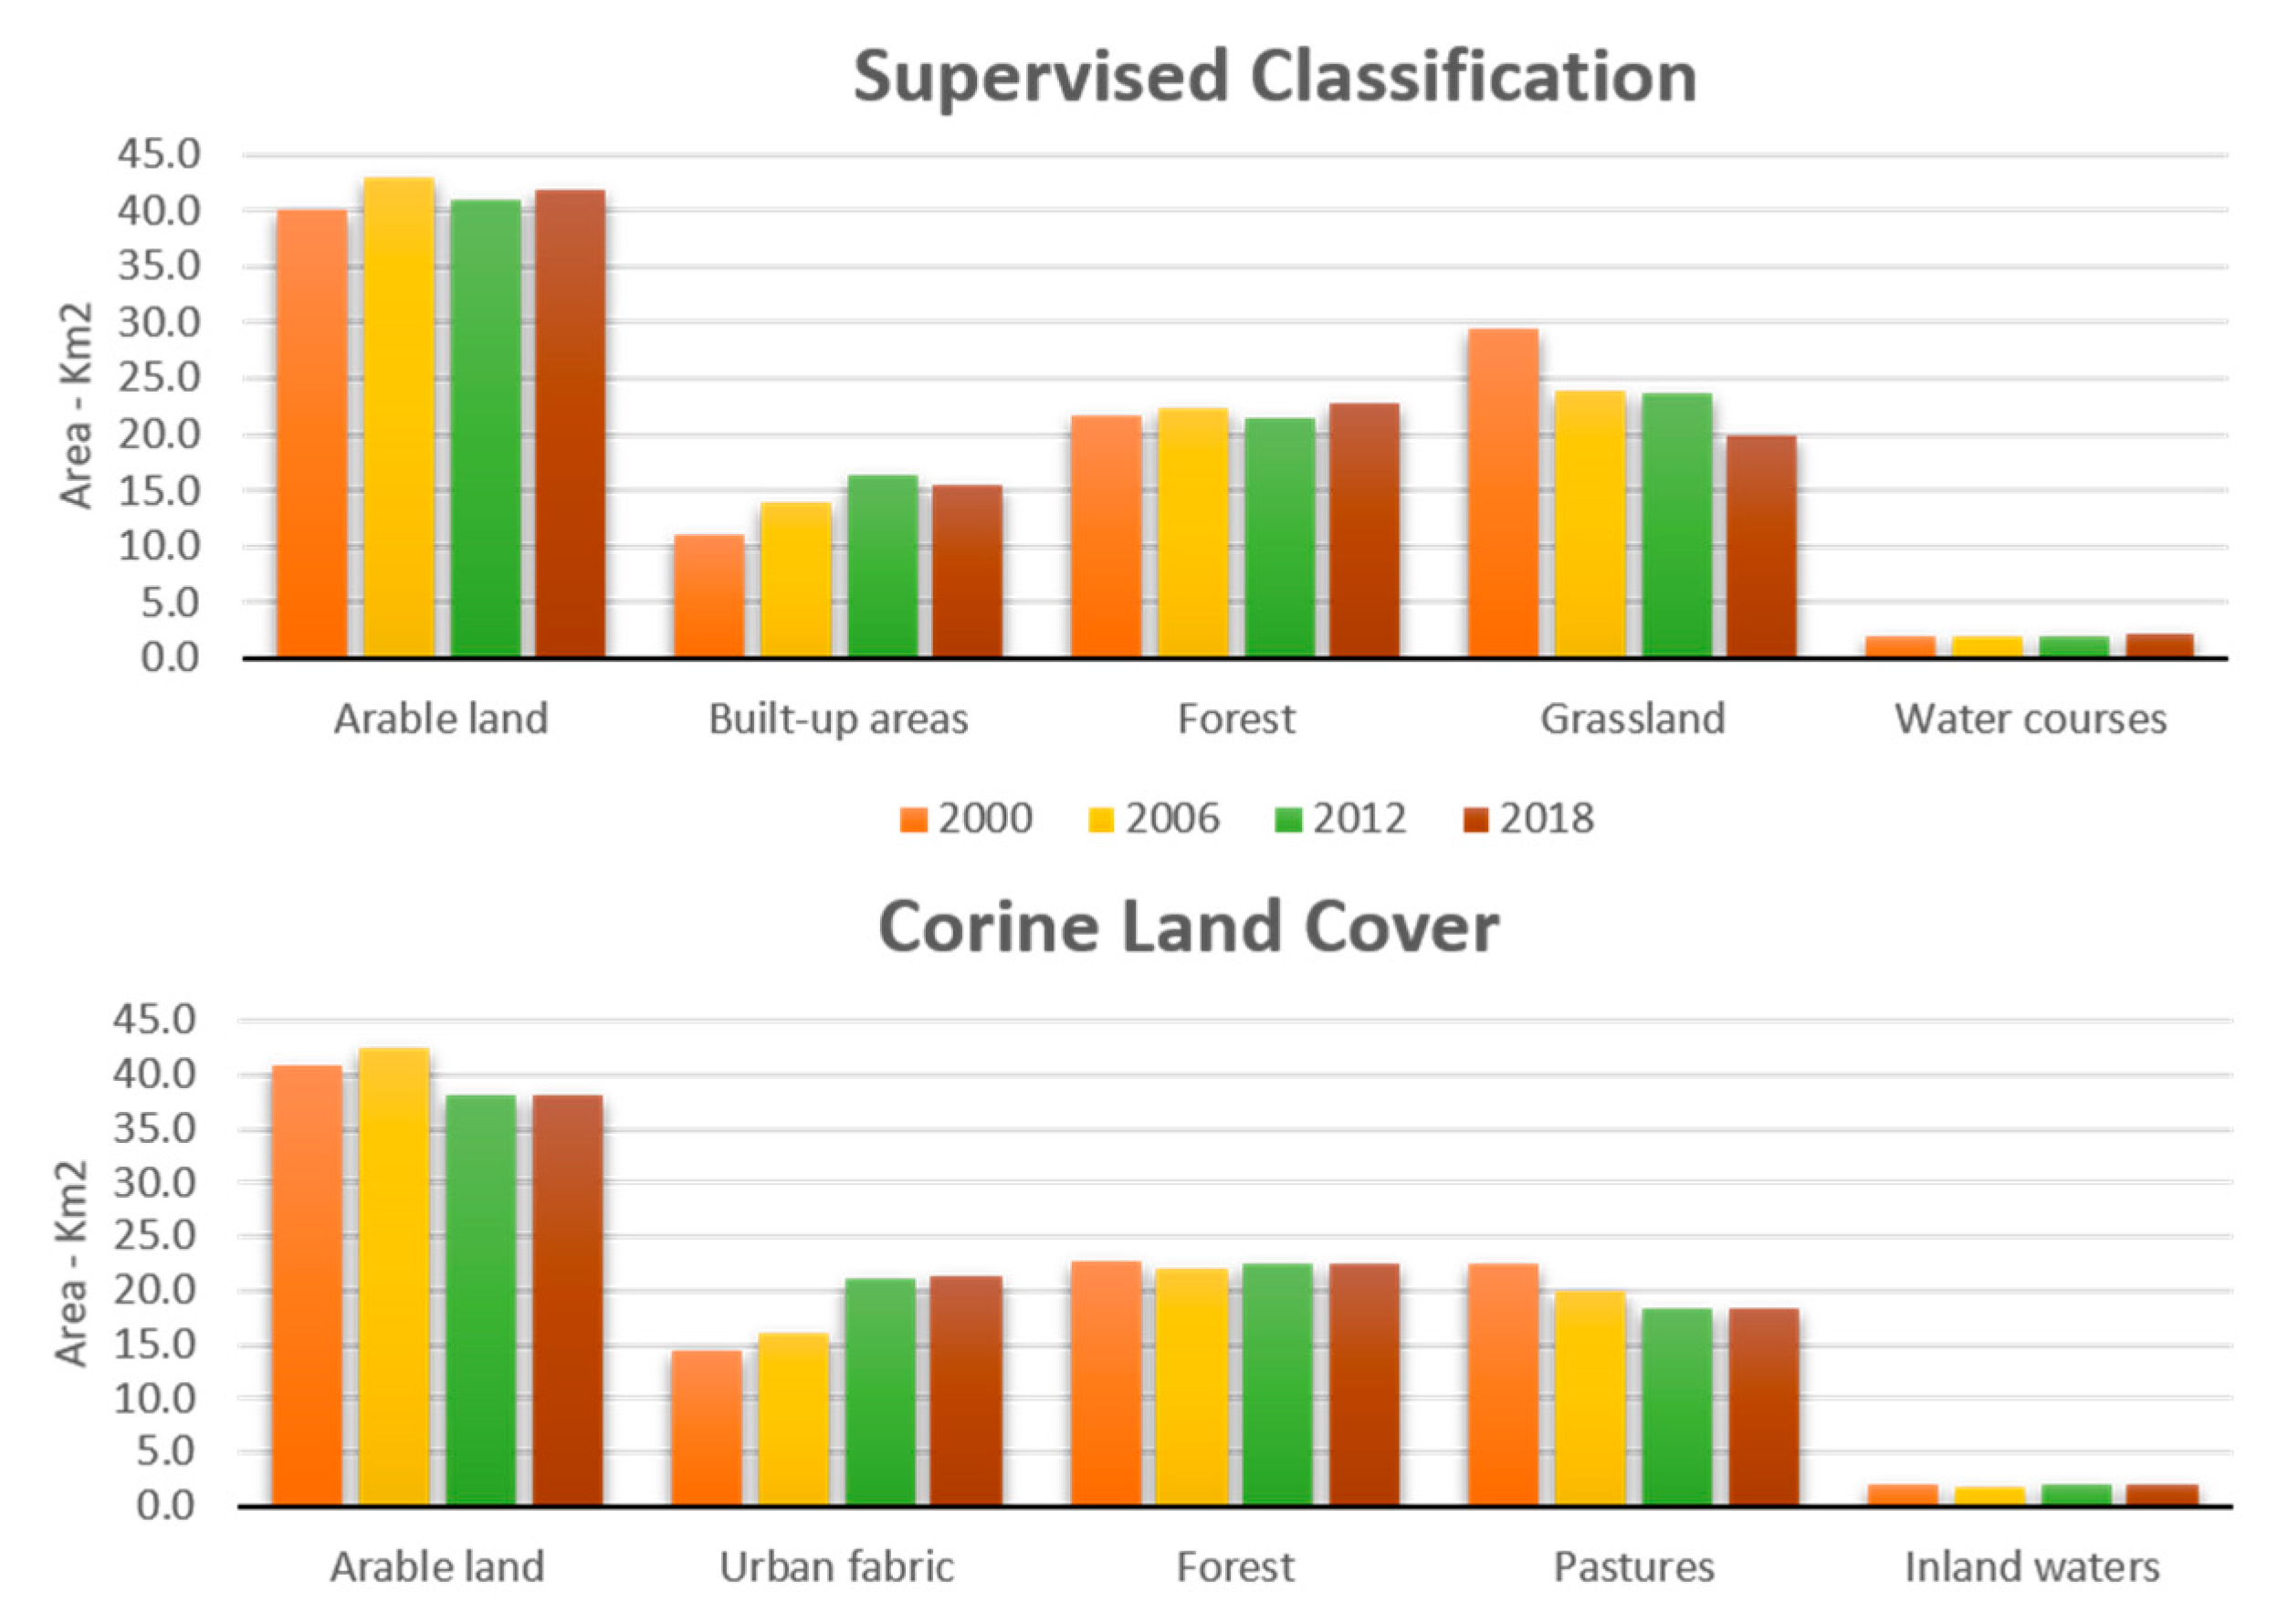
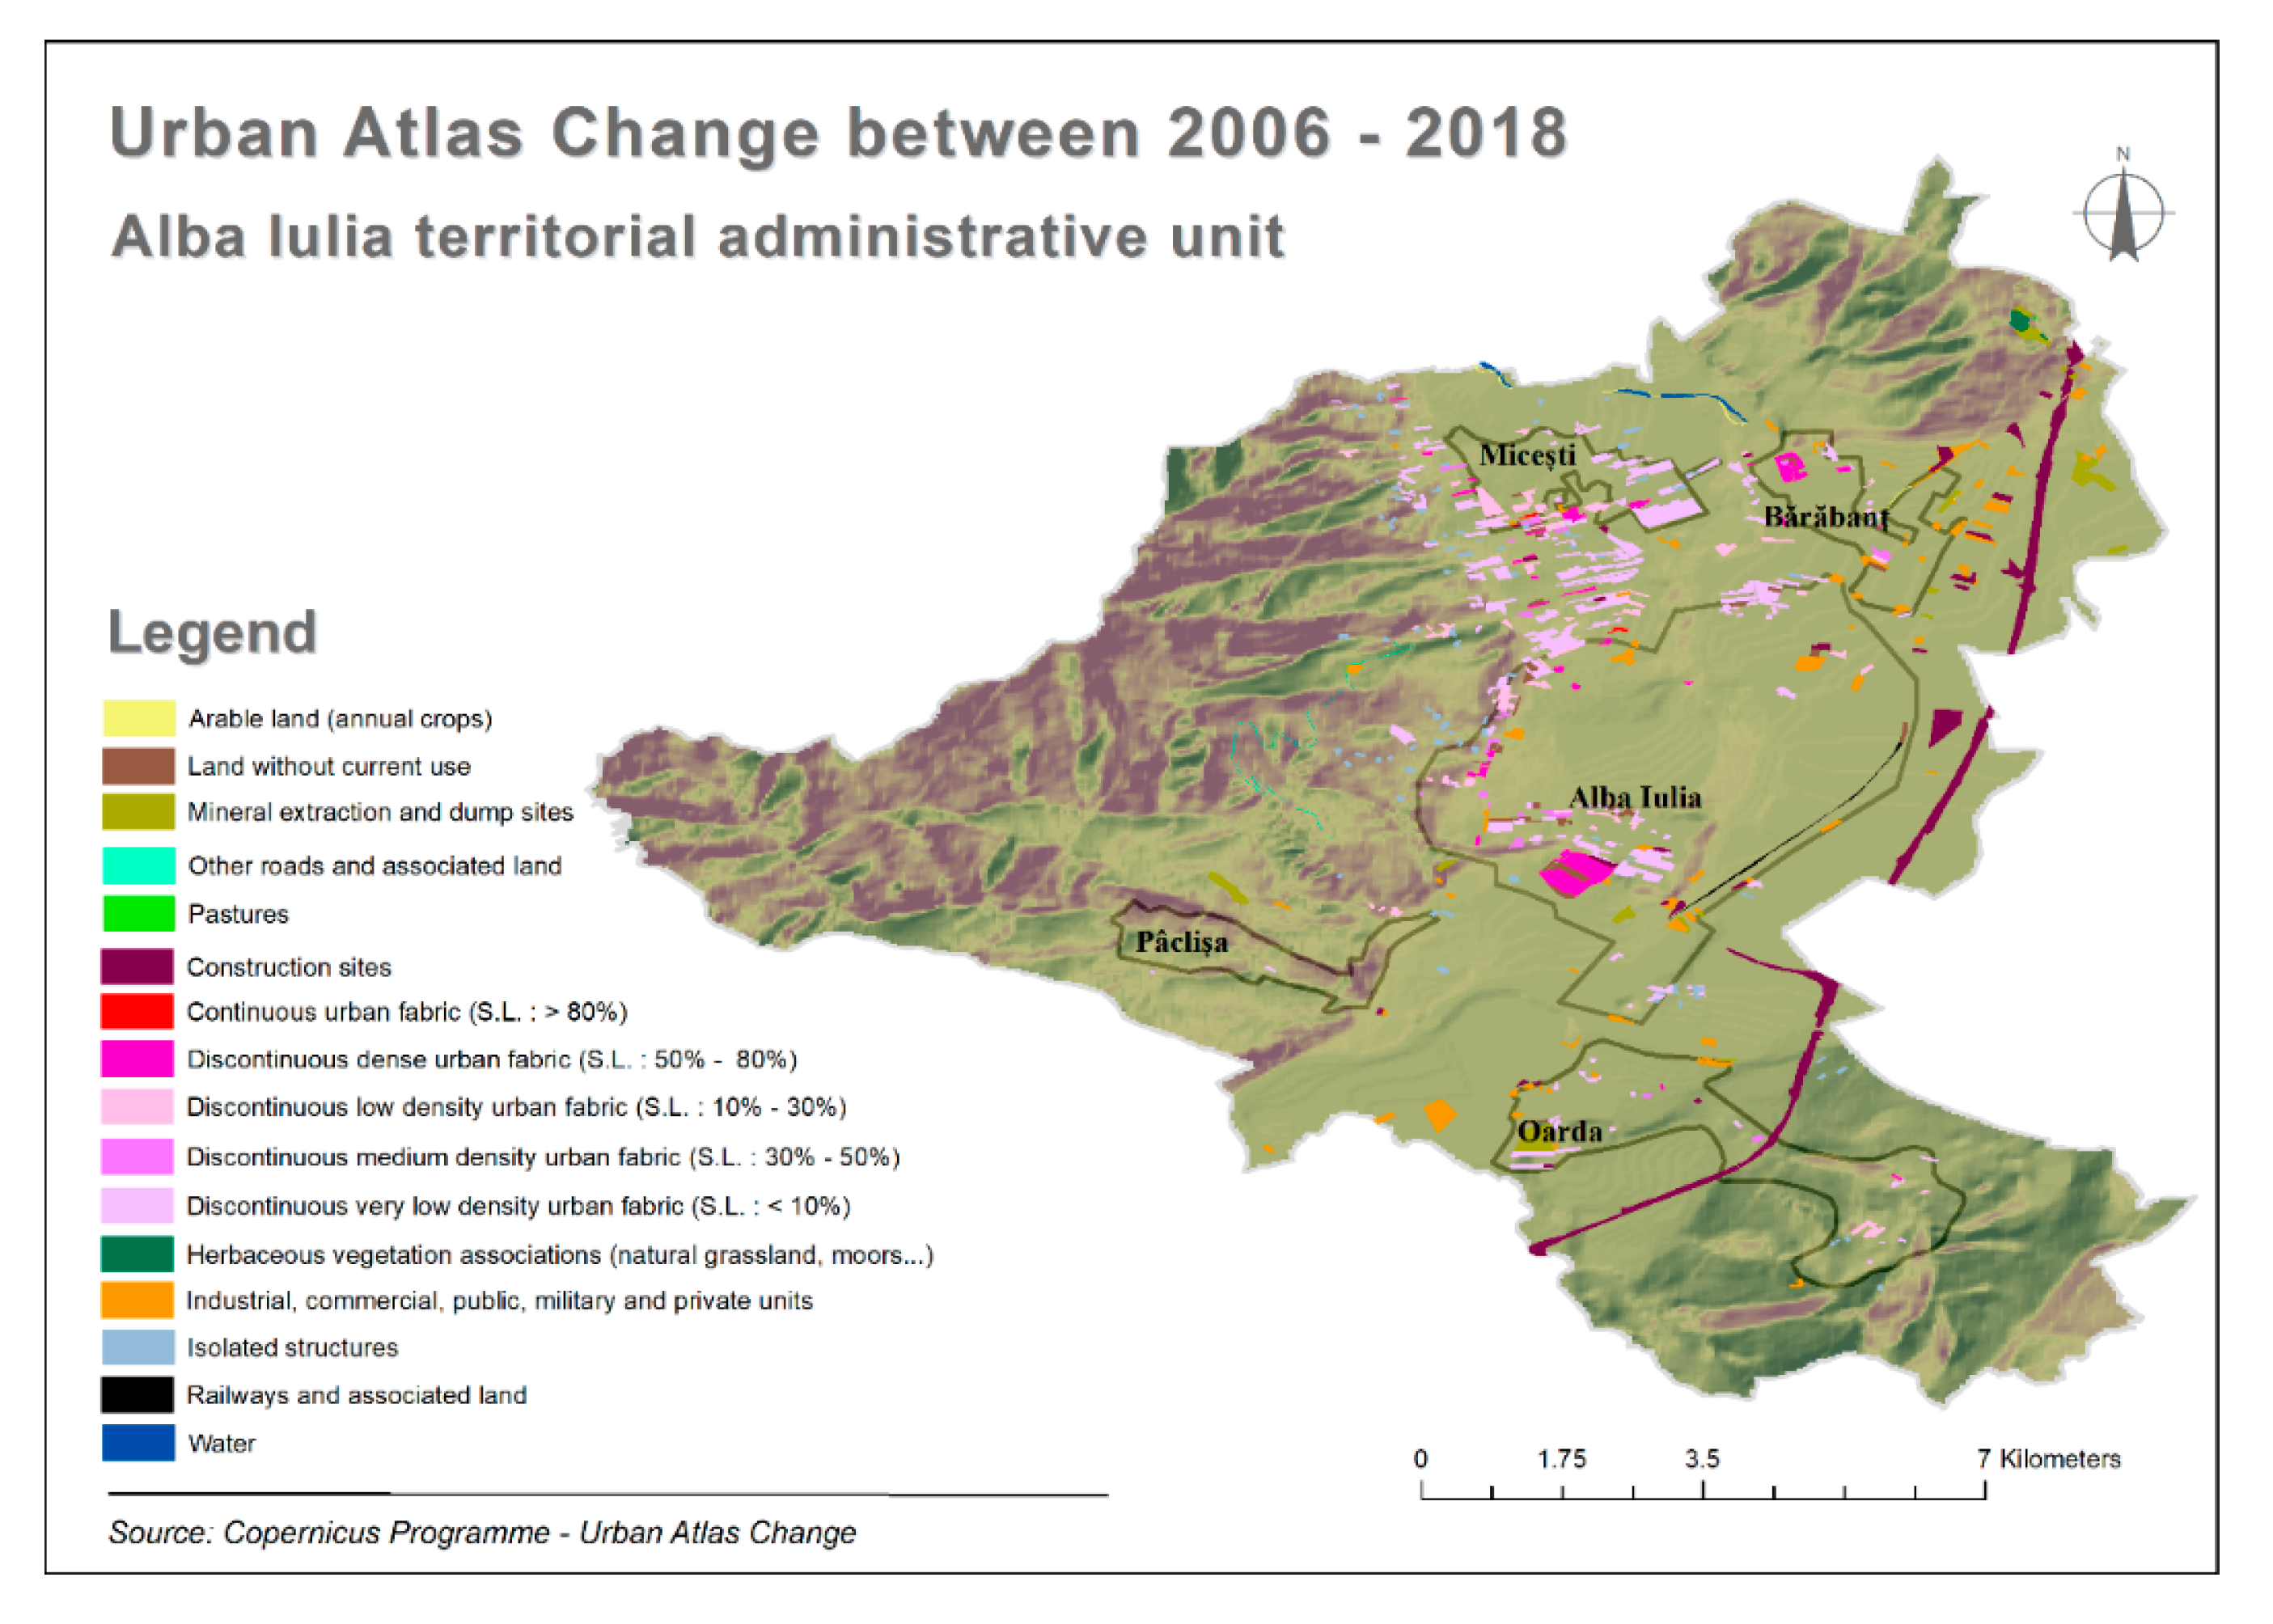
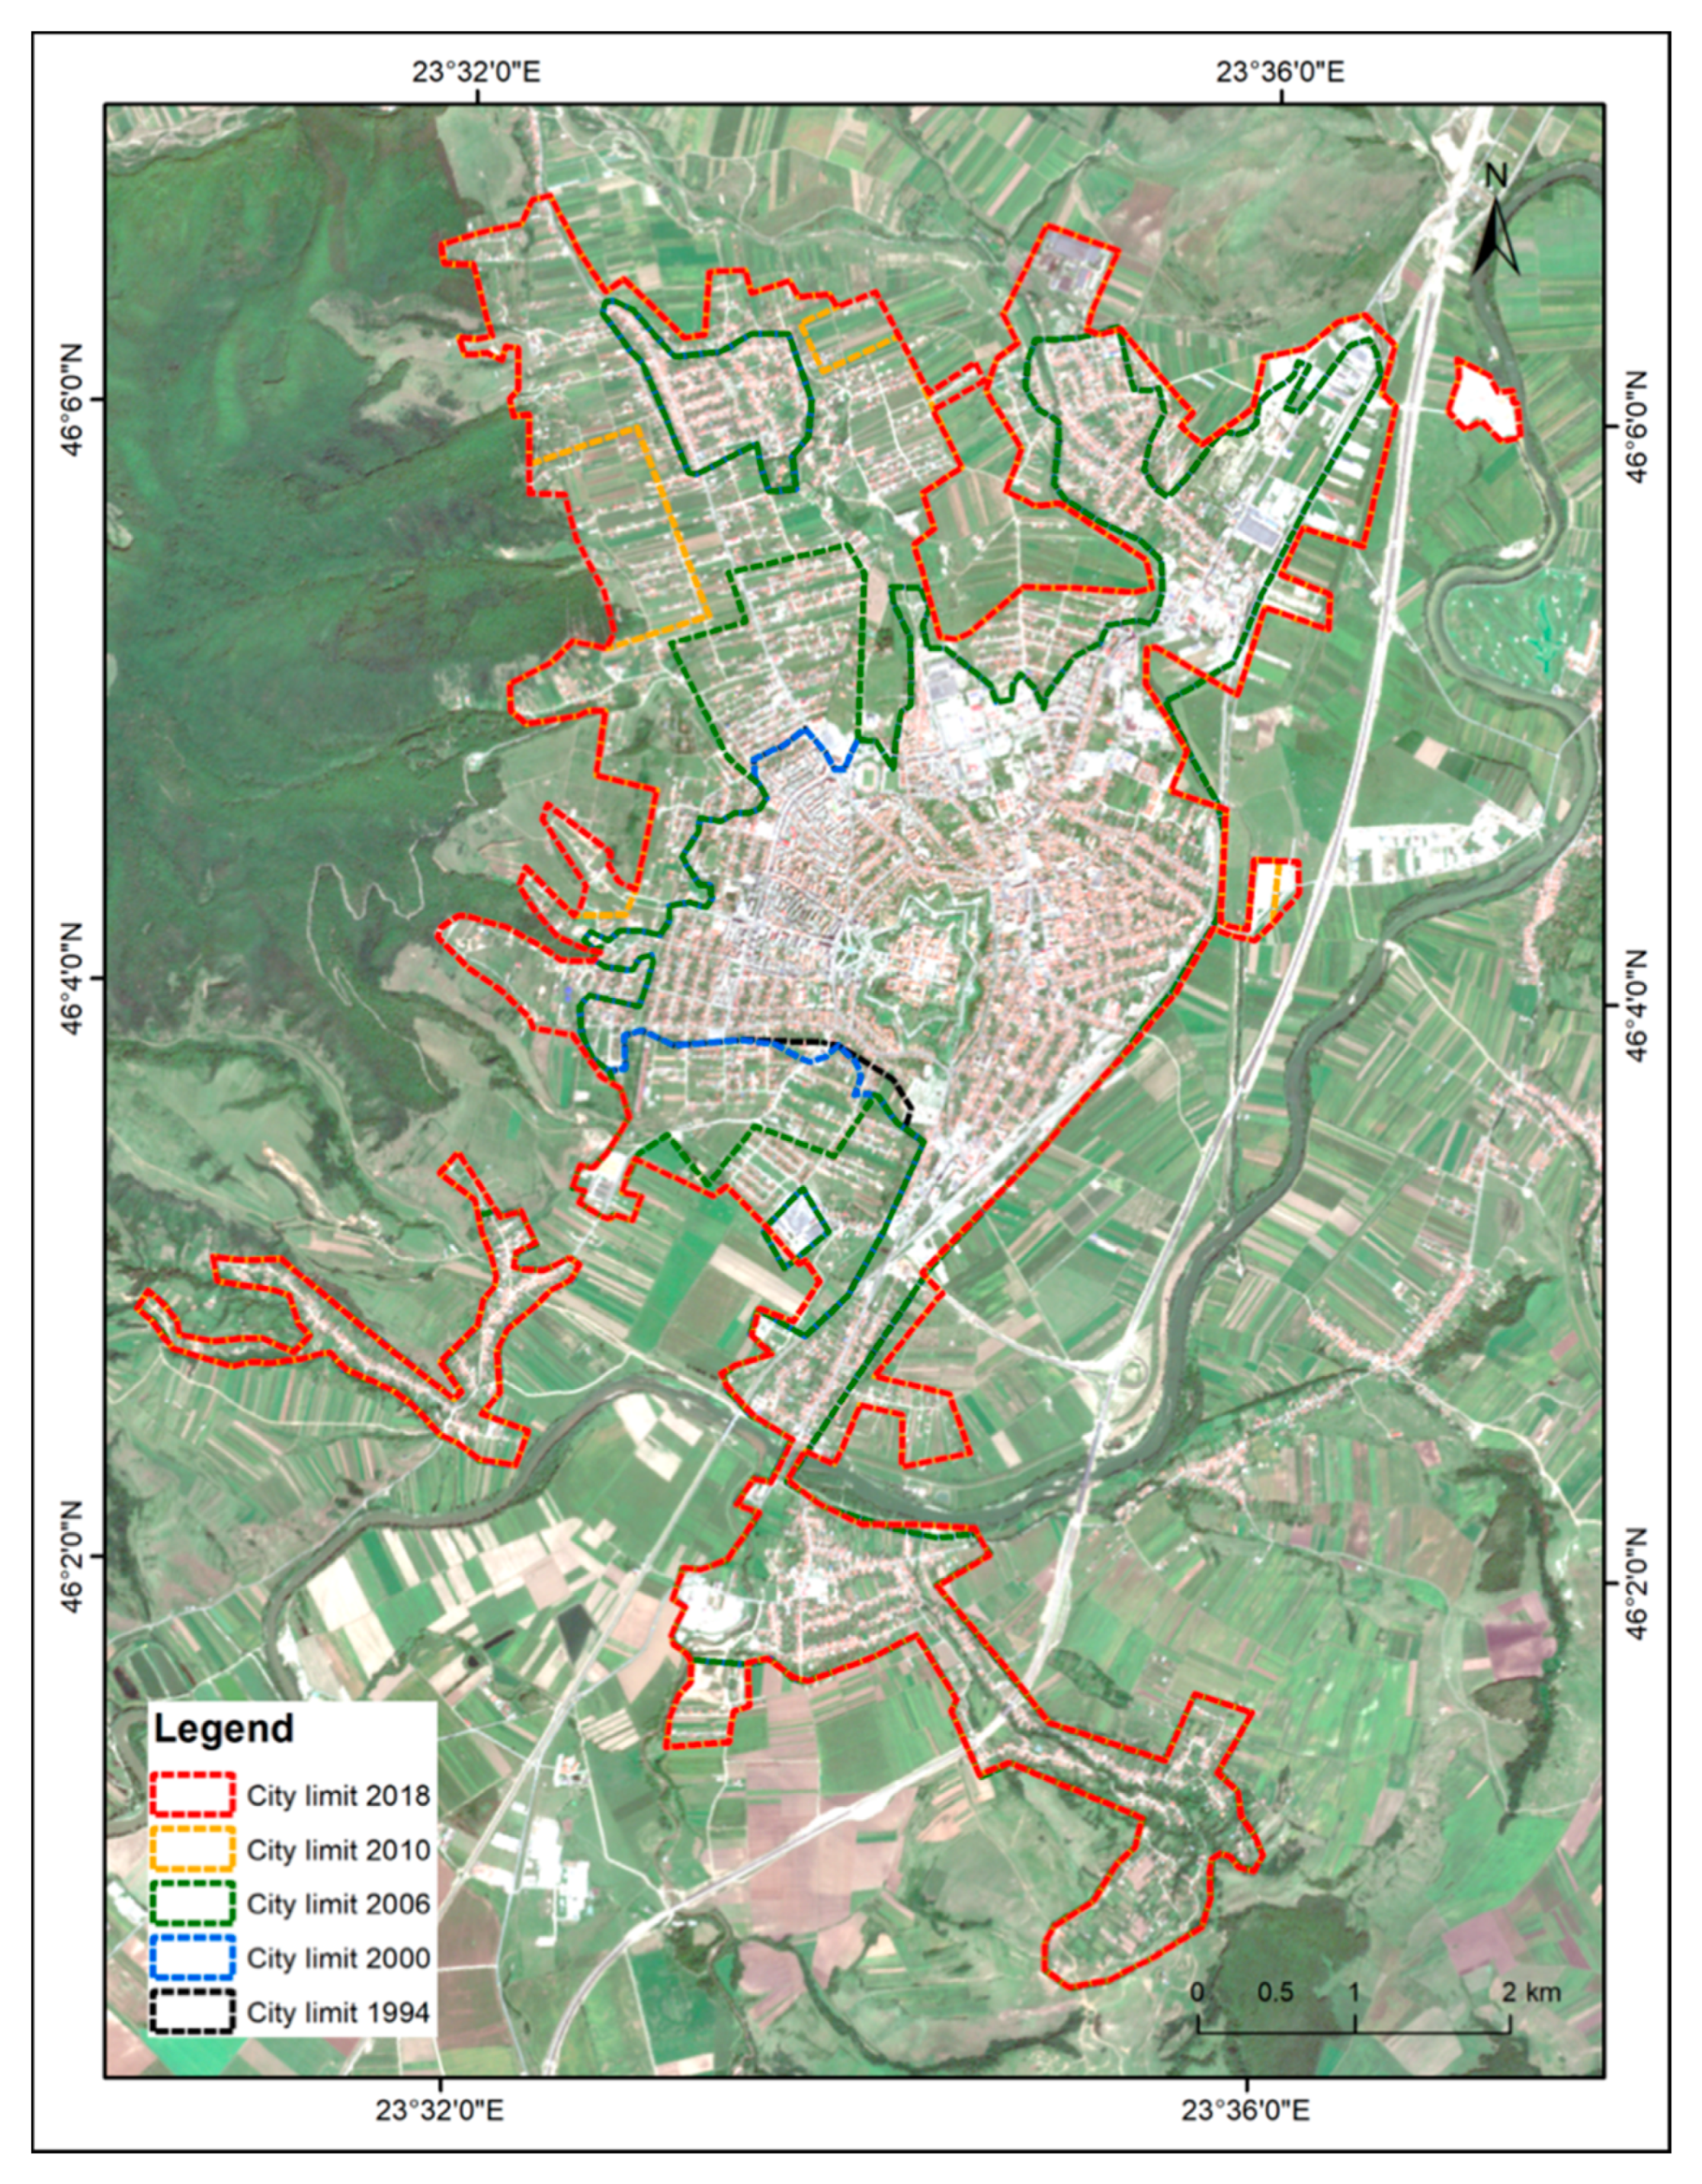
3.1. Case Study (1): Multitemporal Analysis of the Land Cover Changes through Supervised Classification

The overall accuracy results are represented as a percentage in Table 1, where 100% represents an impeccable classification. The accuracy assessment indicates an overall classification accuracy of 94.59%, which represents a high correspondence between the supervised classification results and the reference image.
The time series supervised classification facilitates the identification of significant urbanization expansion (Figure 6, Figure 7, Figure 8 and Figure 9), a process that was presented as a threat to the cultural heritage by Agapiou et al. [16] and Drahor [68]. Over the years, Alba Iulia had an impressive evolution of both the industrial sector from 1970–1990 and the development of residential areas after 1990 and especially after 2000, in the northwest of the city and in the area of Pâclișa to the southwest [69].
For the investigated period, the main differences were identified in the class of the built-up area that recorded an increase from 9.7 square kilometers in 1988 to 11.7 square kilometers in 2018. When comparing the first four years of analysis (1988, 1992, 1996, and 2000), the changes in built-up areas were not very visible. The high urban expansion started with the year of 2000, especially in the peri-urban area where residential districts were developed. In close connection with the increase of the residential area, service spaces and commercial, production, or storage areas were also developed [69]. The most remarkable increased percentage value from the Built-up area class was recorded between 2000 and 2004, with 4.1% (Figure 10).
To quantify the built-up growth, the area covered by each class was calculated after the transformation of the raster resulting from the supervised classification into polygons. Overall, the built-up area had an ascending trend. These trends were confirmed by the values of CLC data, shown in Figure 11. CLC vector data acquired at Level 3 from the Copernicus Land Monitoring Service was reclassified according to the CLC nomenclature to Level 2 in the following classes: Arable land, Urban fabric, Forest, Pastures, and Inland waters. An overall change map of the area was created based on the Urban Atlas Change data (Figure 12).
The environmental changes in the Alba Iulia territorial administrative unit were directly related to human activities. The risk represented by human pressure can be monitored and managed for safeguarding the cultural heritage area. Remote sensing data are indispensable in this dynamic process of urbanization because an early update of information enables the continuous and comprehensive monitoring and control of urban expansion [70].
The information related to land cover changes and their evolution is essential for a sustainable management of the cultural heritage area and its surroundings. In addition, it represents the basis for the anticipation of human actions and consequently the reduction of the risk that can affect the cultural heritage area.
The results of the multitemporal analysis represent relevant information for the Alba Iulia territorial administrative unit over a long period of time. The General Urban Plan of Alba Iulia encompasses not only the fortress or the city, but also the surrounding areas. Consequently, the corresponding archaeological area has a greater extent. As mentioned before, the monitoring of the surrounding areas and the identification of the land cover changes provide information about the factors that may affect the cultural heritage site in the future. Specifically, urban expansion also causes increased archaeological intervention risks to the terrains that are subject to a change in land use. These outcomes may be used in the forthcoming development of management strategies in order to protect and conserve Alba Iulia Fortress and the valuable archaeological sites.
It could be argued that the results do not have the required level of detail for the scale of the cultural heritage site (i.e., Alba Iulia Fortress). Indeed, the limitation of this use case is represented by the fact that the small-sized archaeological features could not be monitored given the spatial resolution of the satellite images used in this study. In addition, the spatial resolution hindered the identification of the illegal constructions erected within the cultural heritage protected area. This information is of critical importance since these structures destroy the cultural heritage site. However, the study focuses on and proves that the monitoring of the surroundings is essential, as the expansion of Alba Iulia city has an undisputable impact on the fortress located right in its center. The results are satisfactory and represent pieces of relevant information that reach their full potential in a broader context, together with other elements that are important to the process of cultural heritage management.

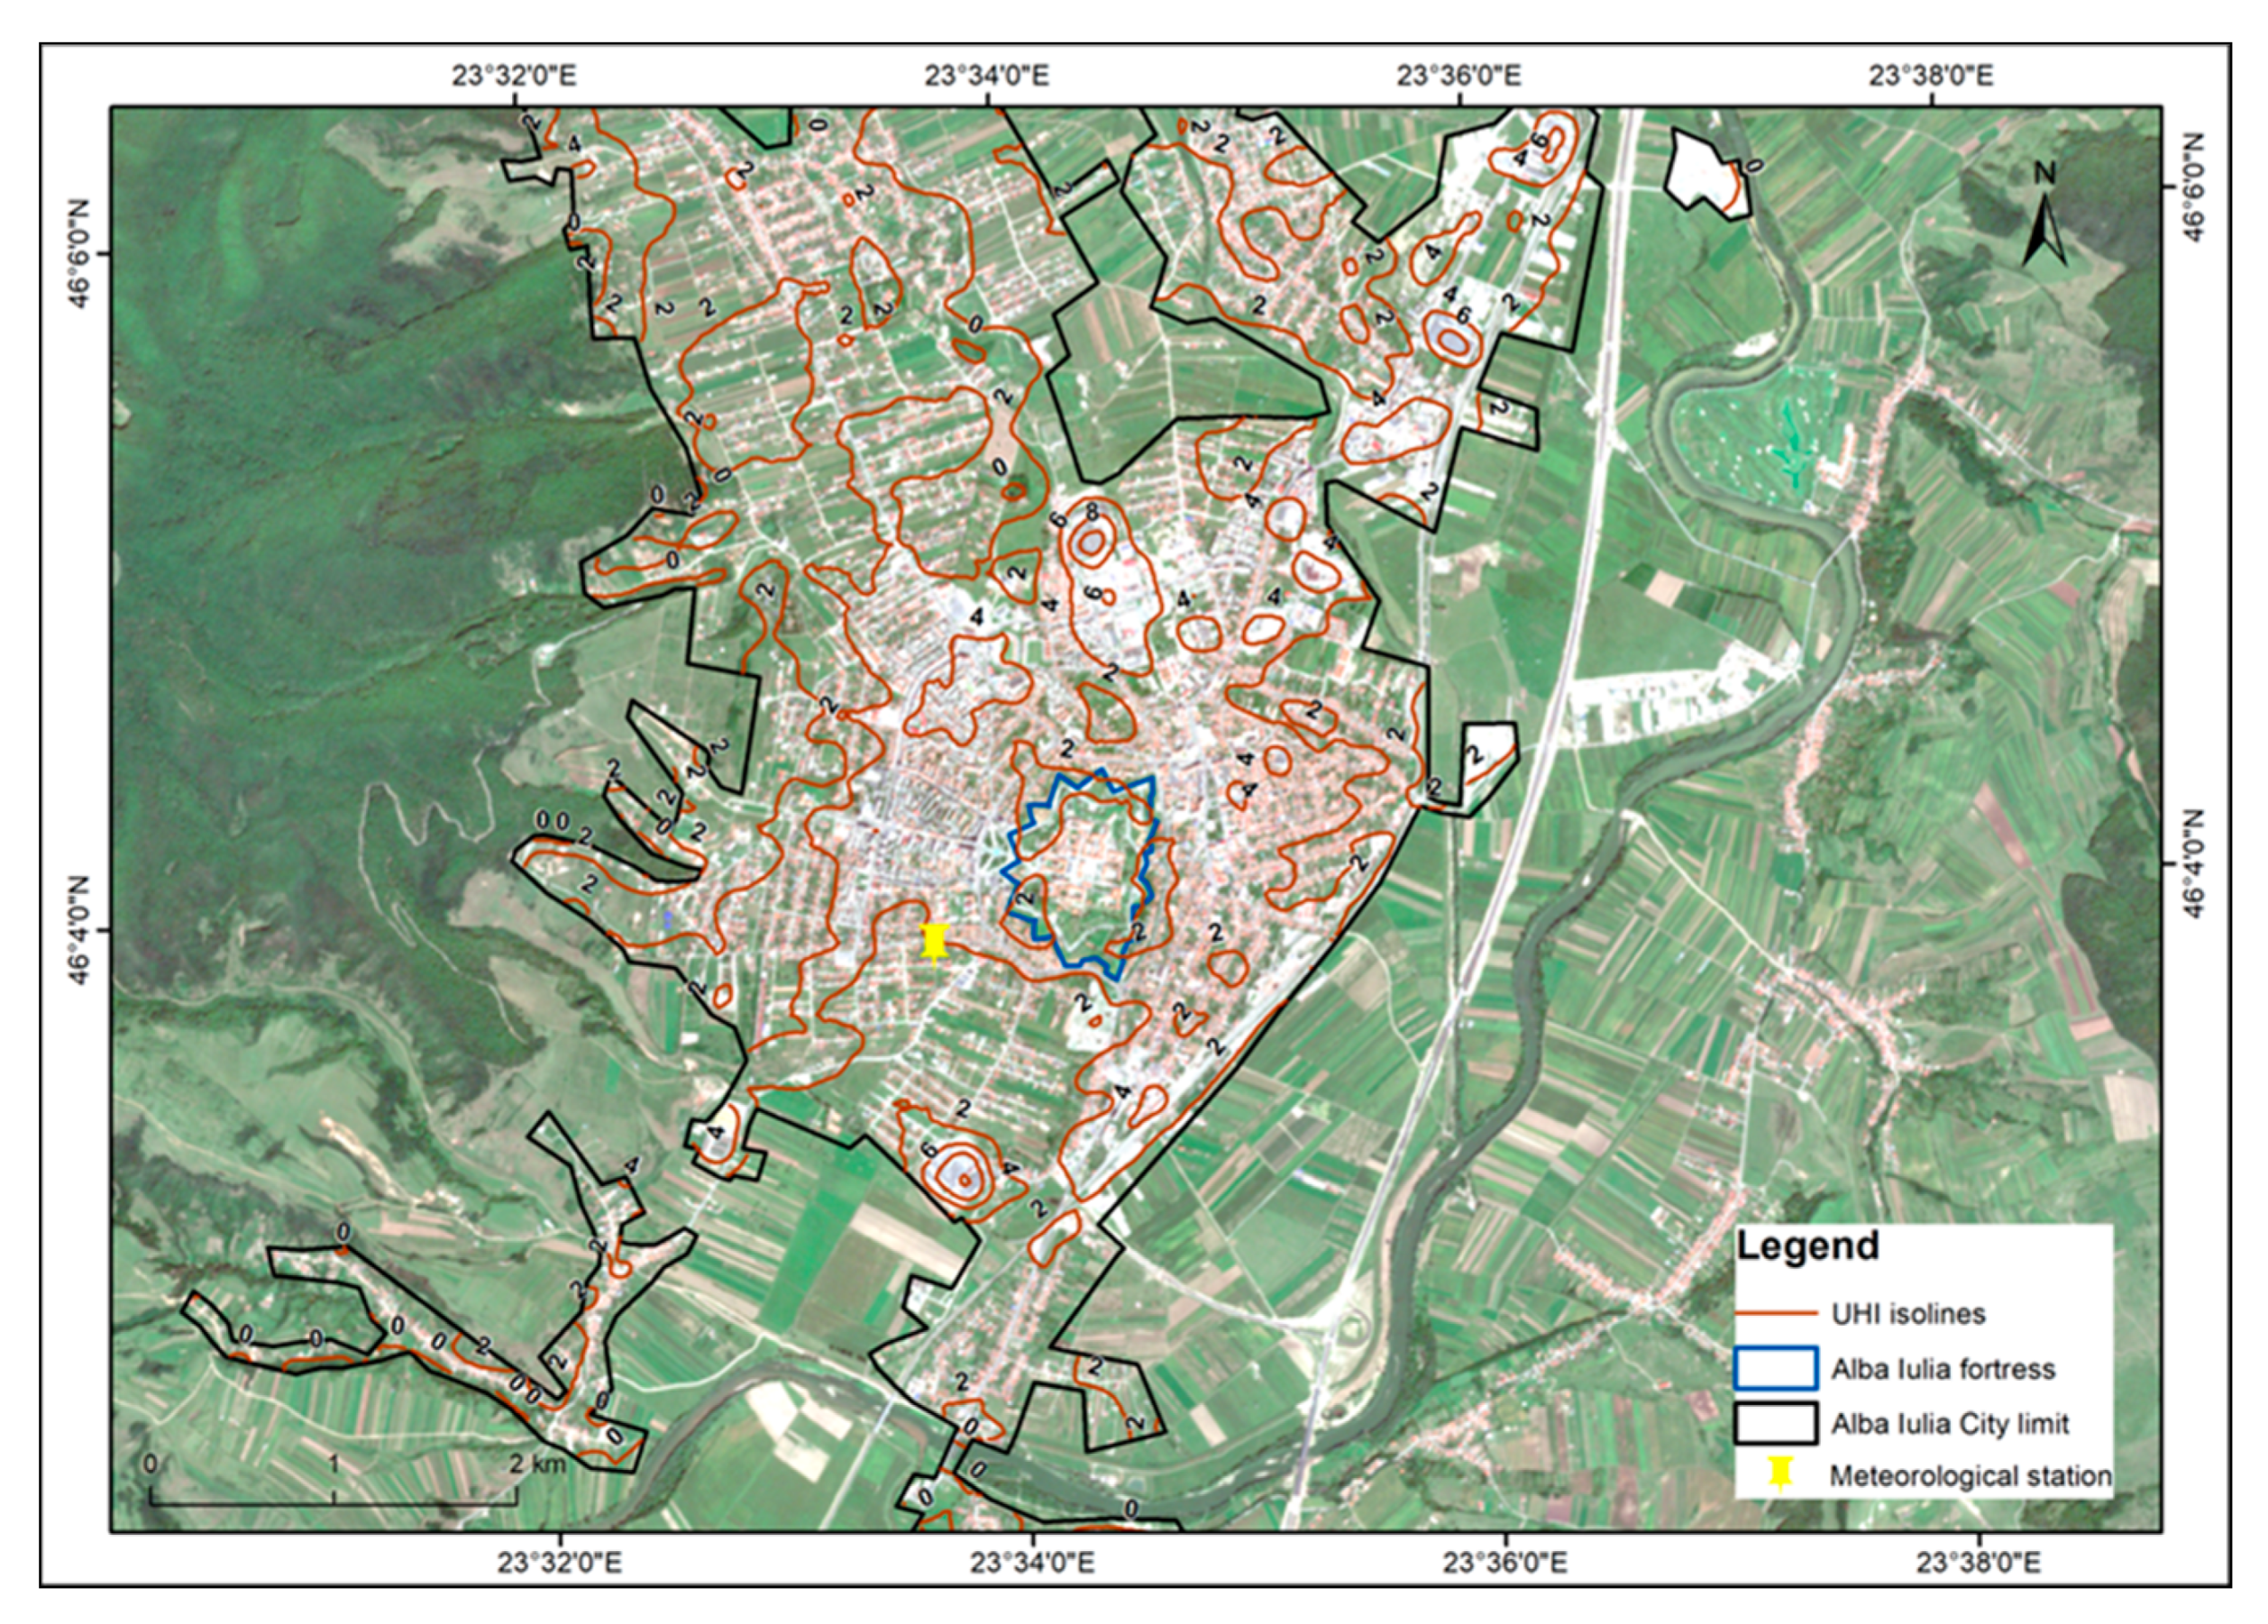
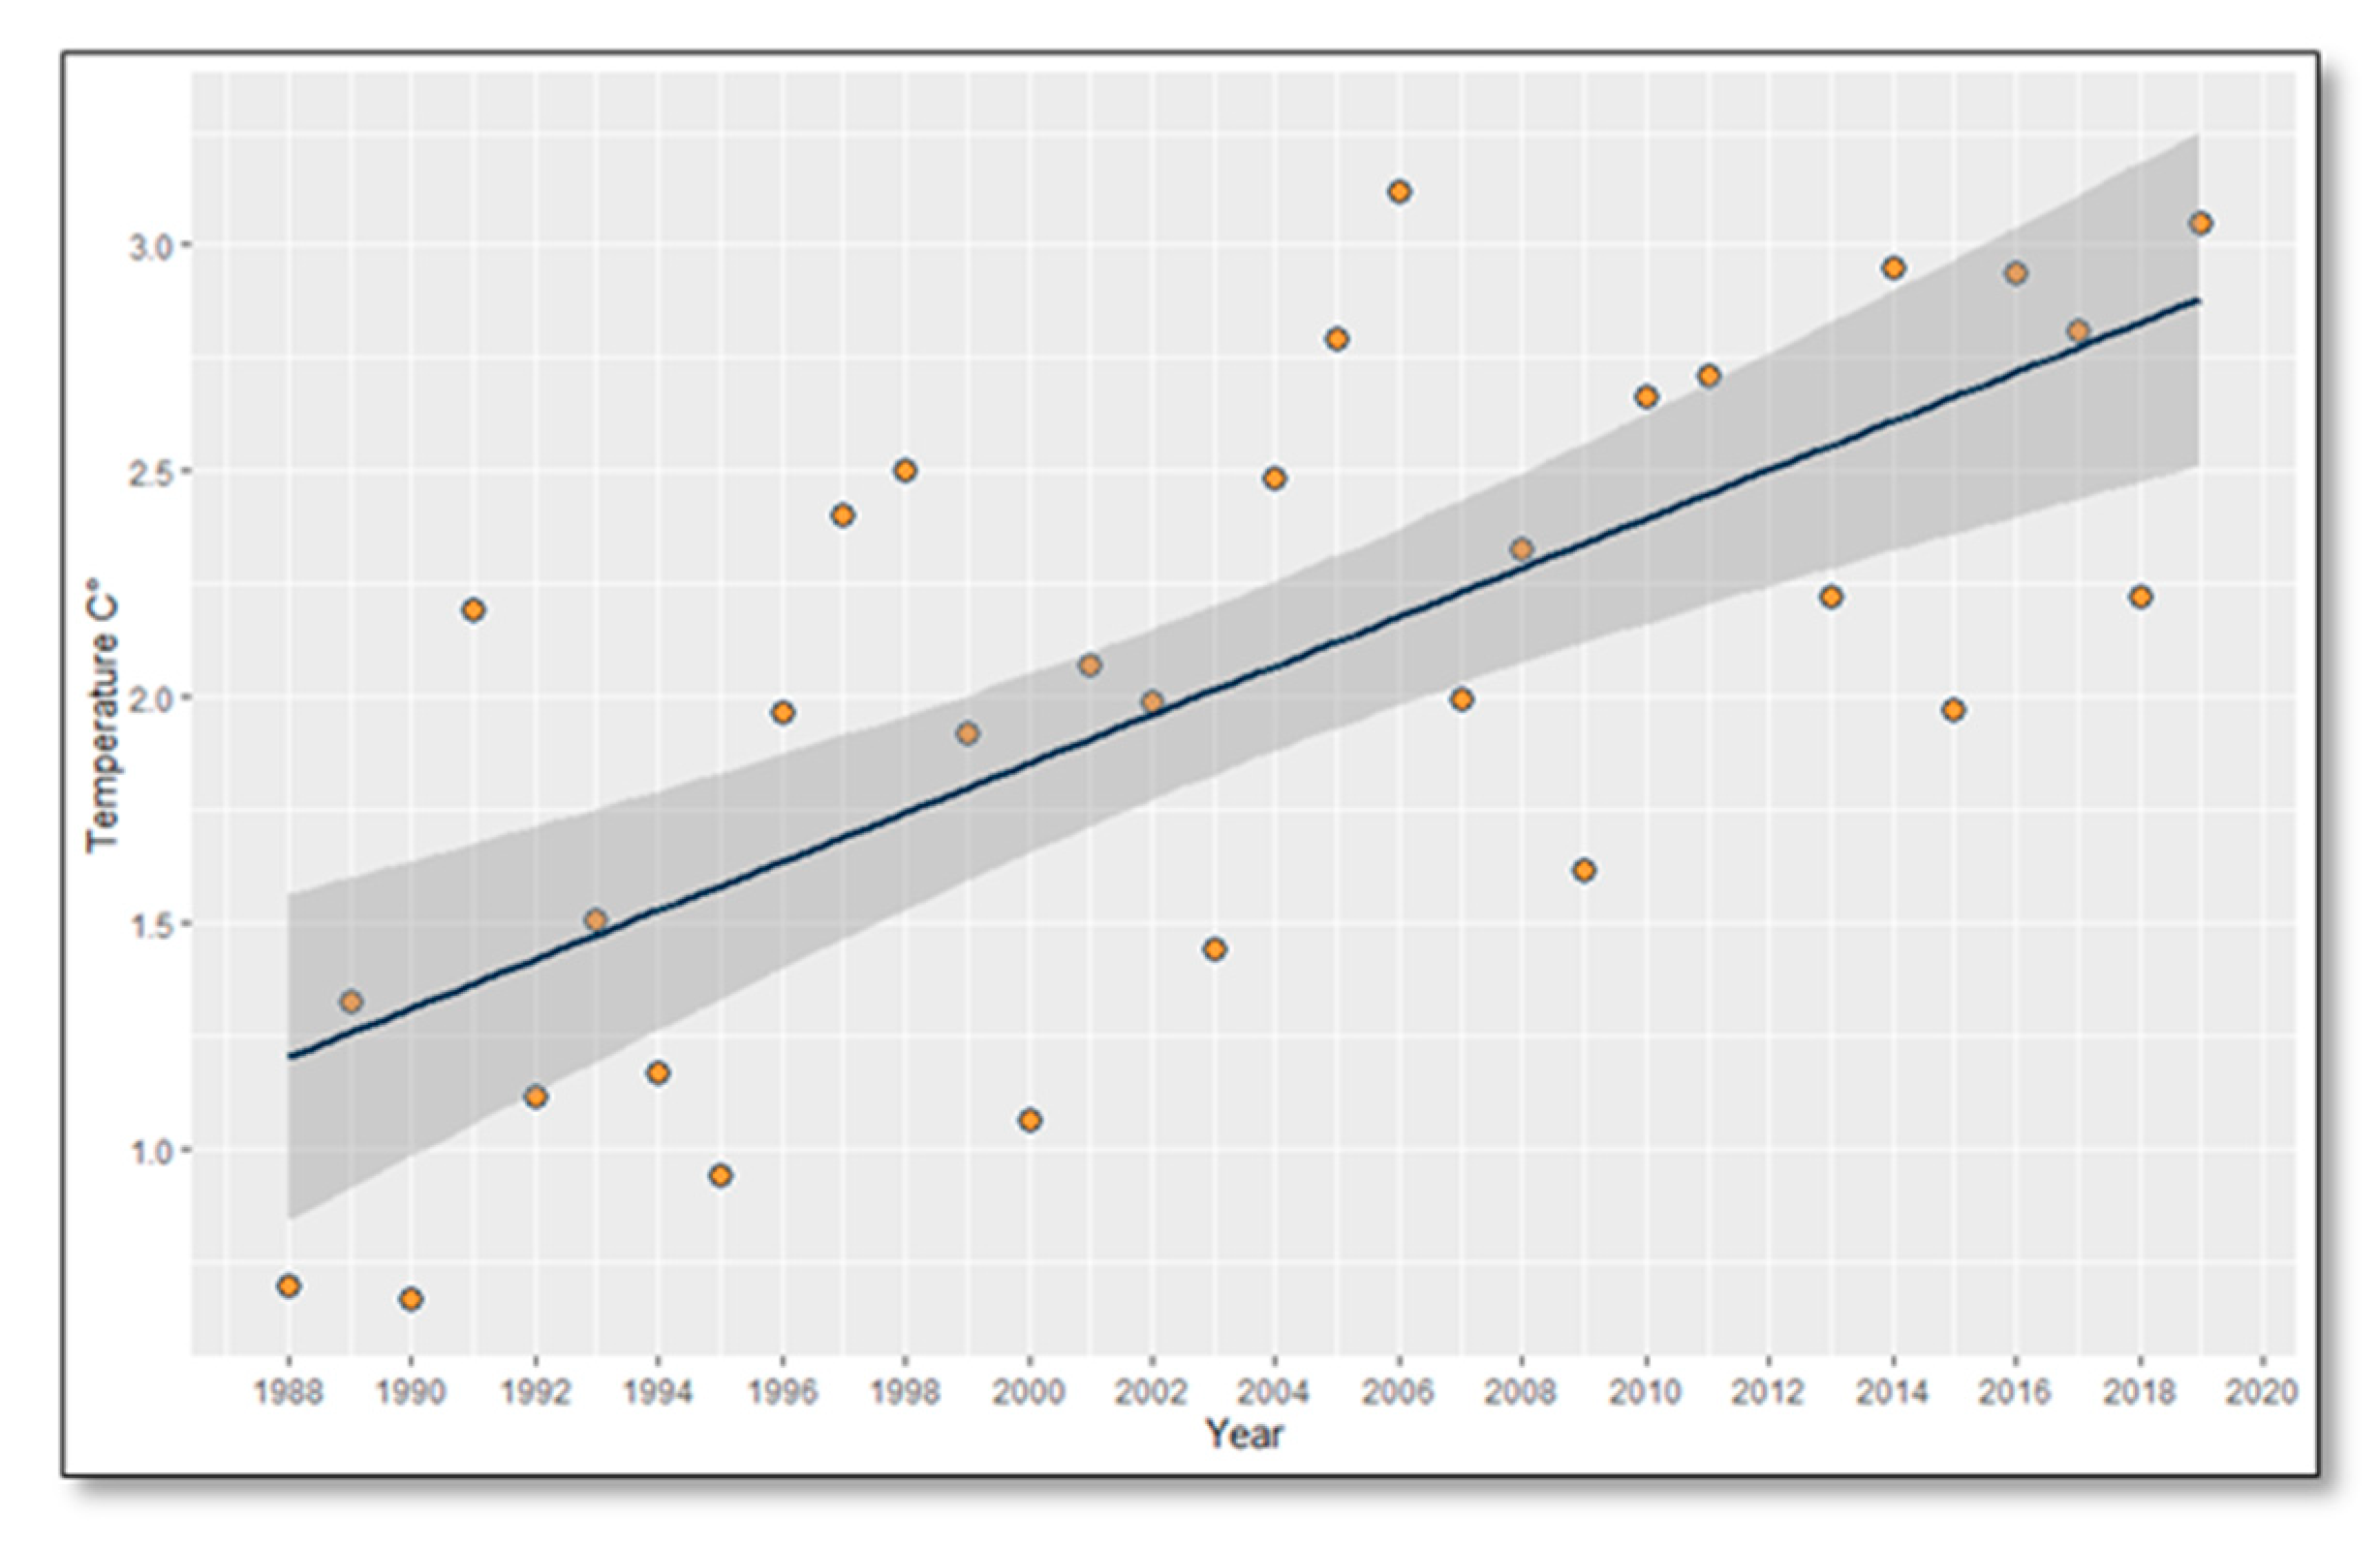
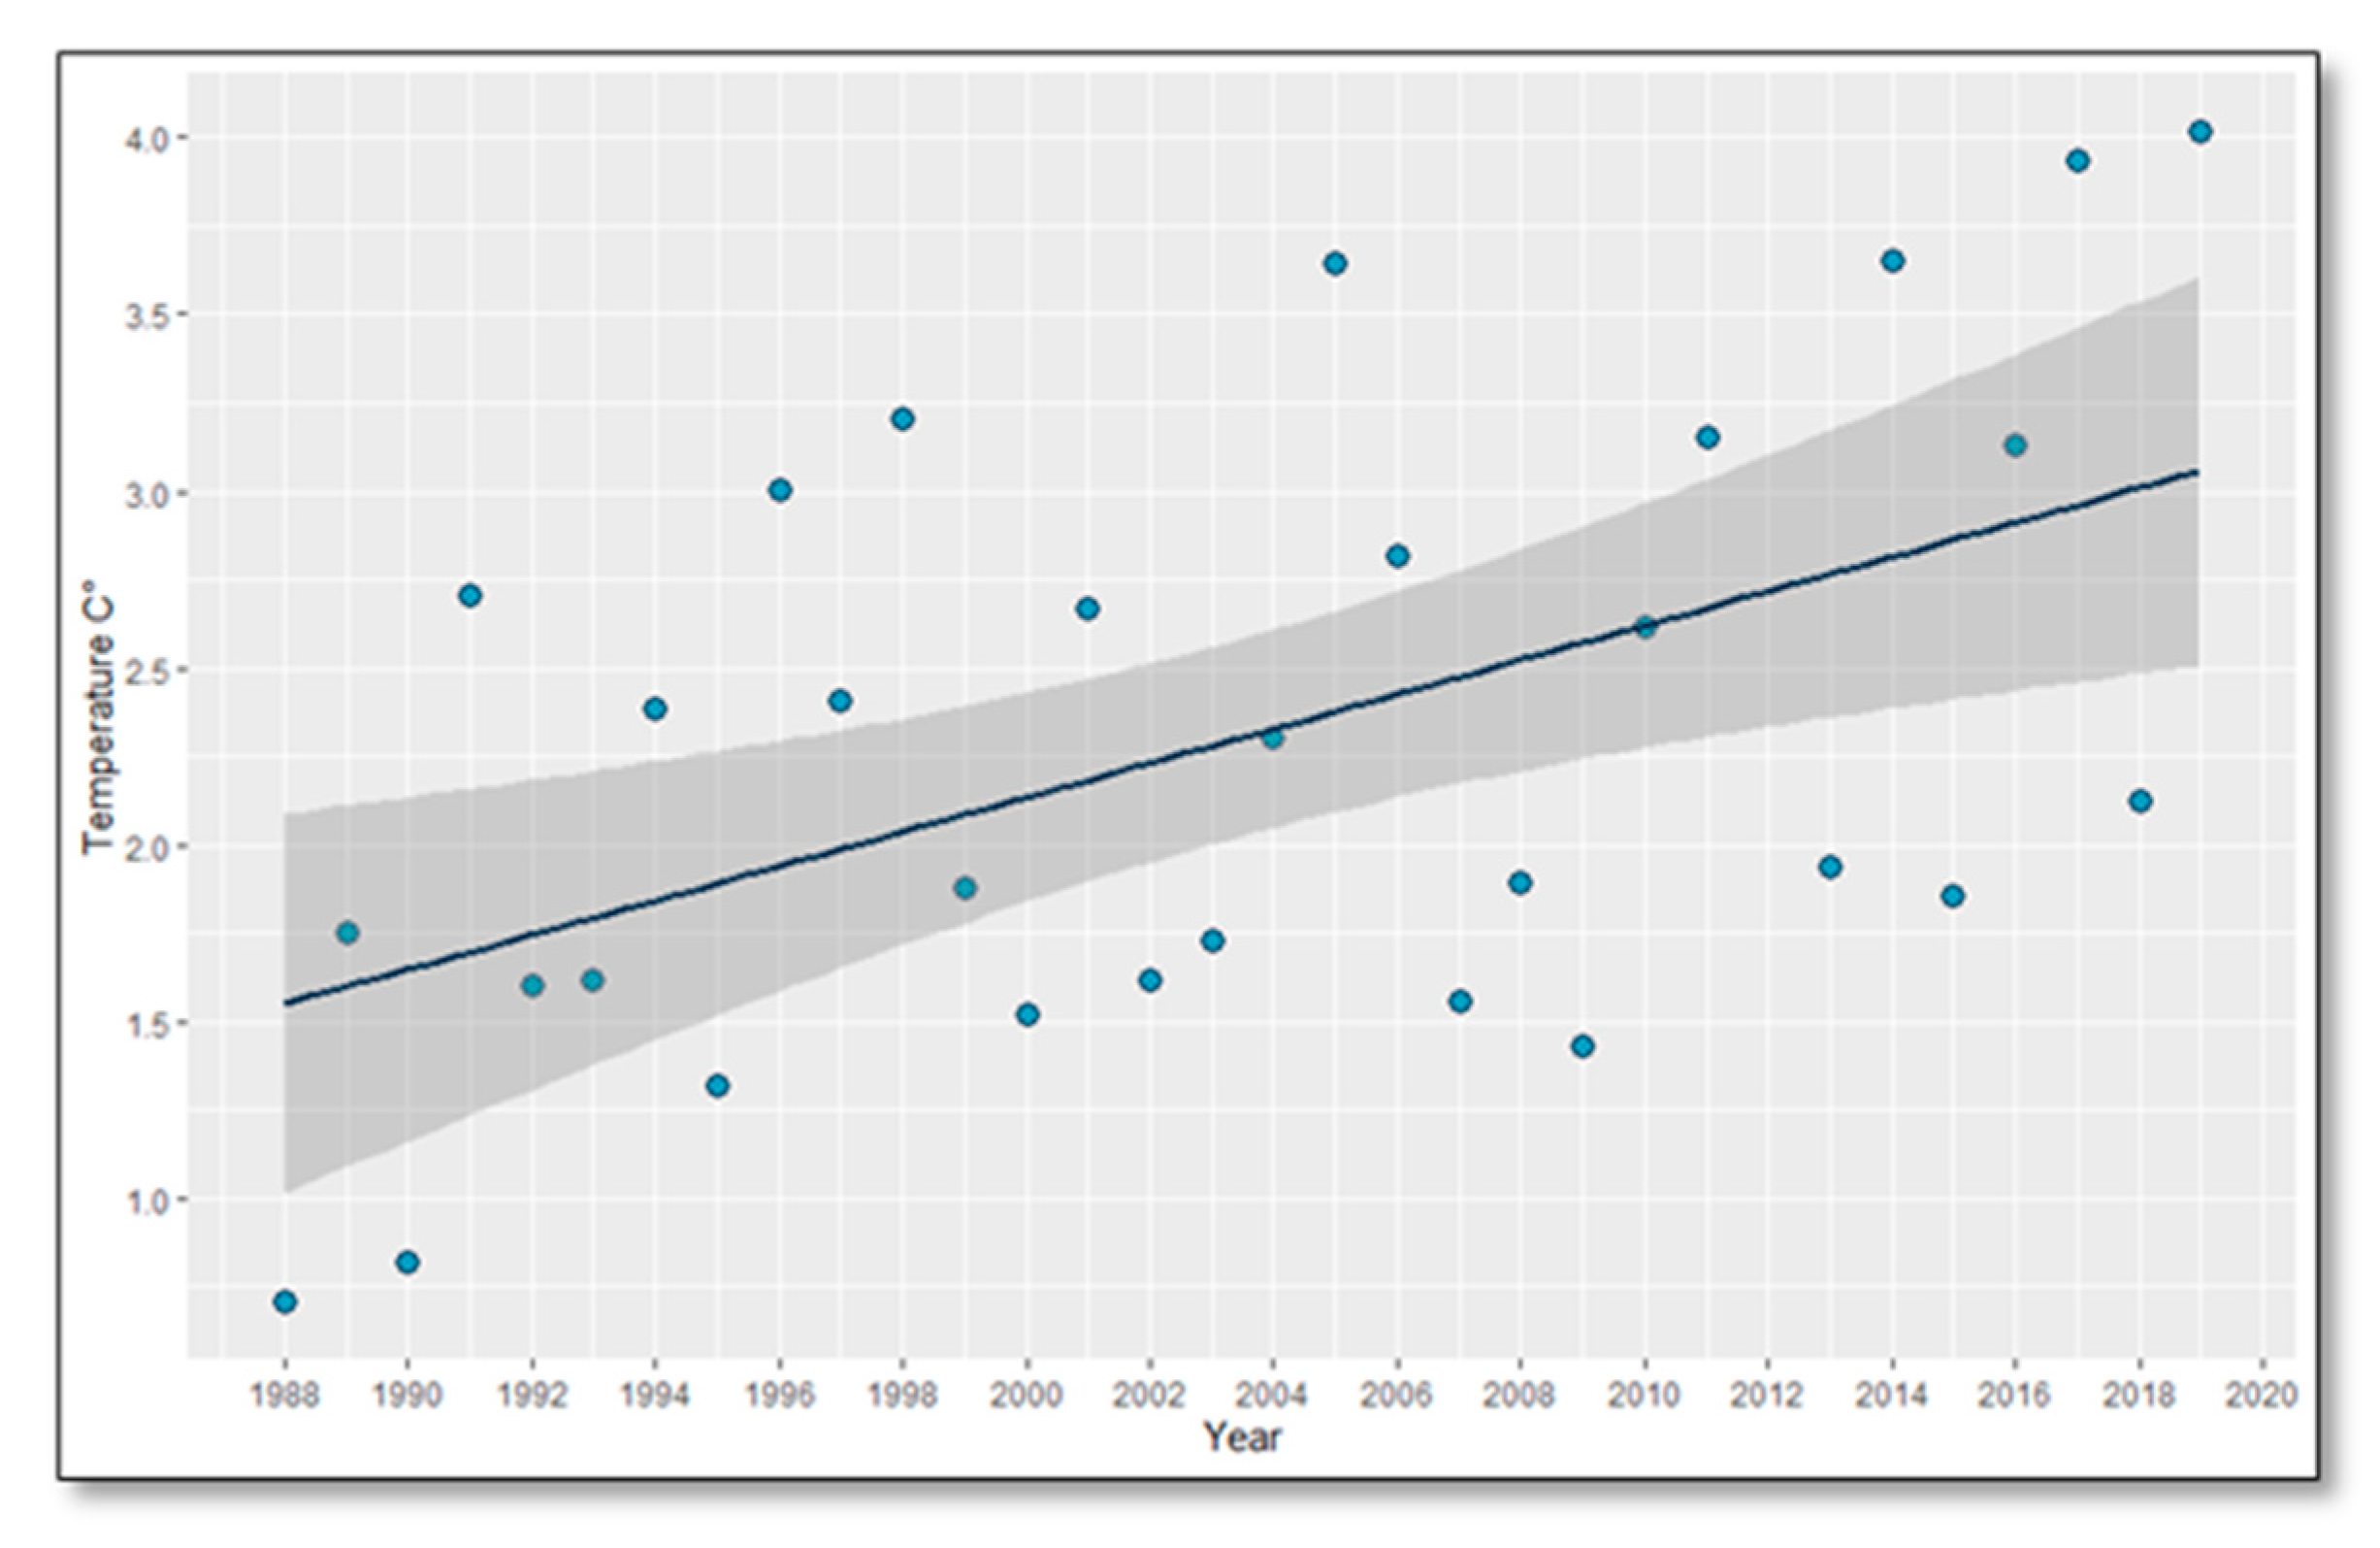
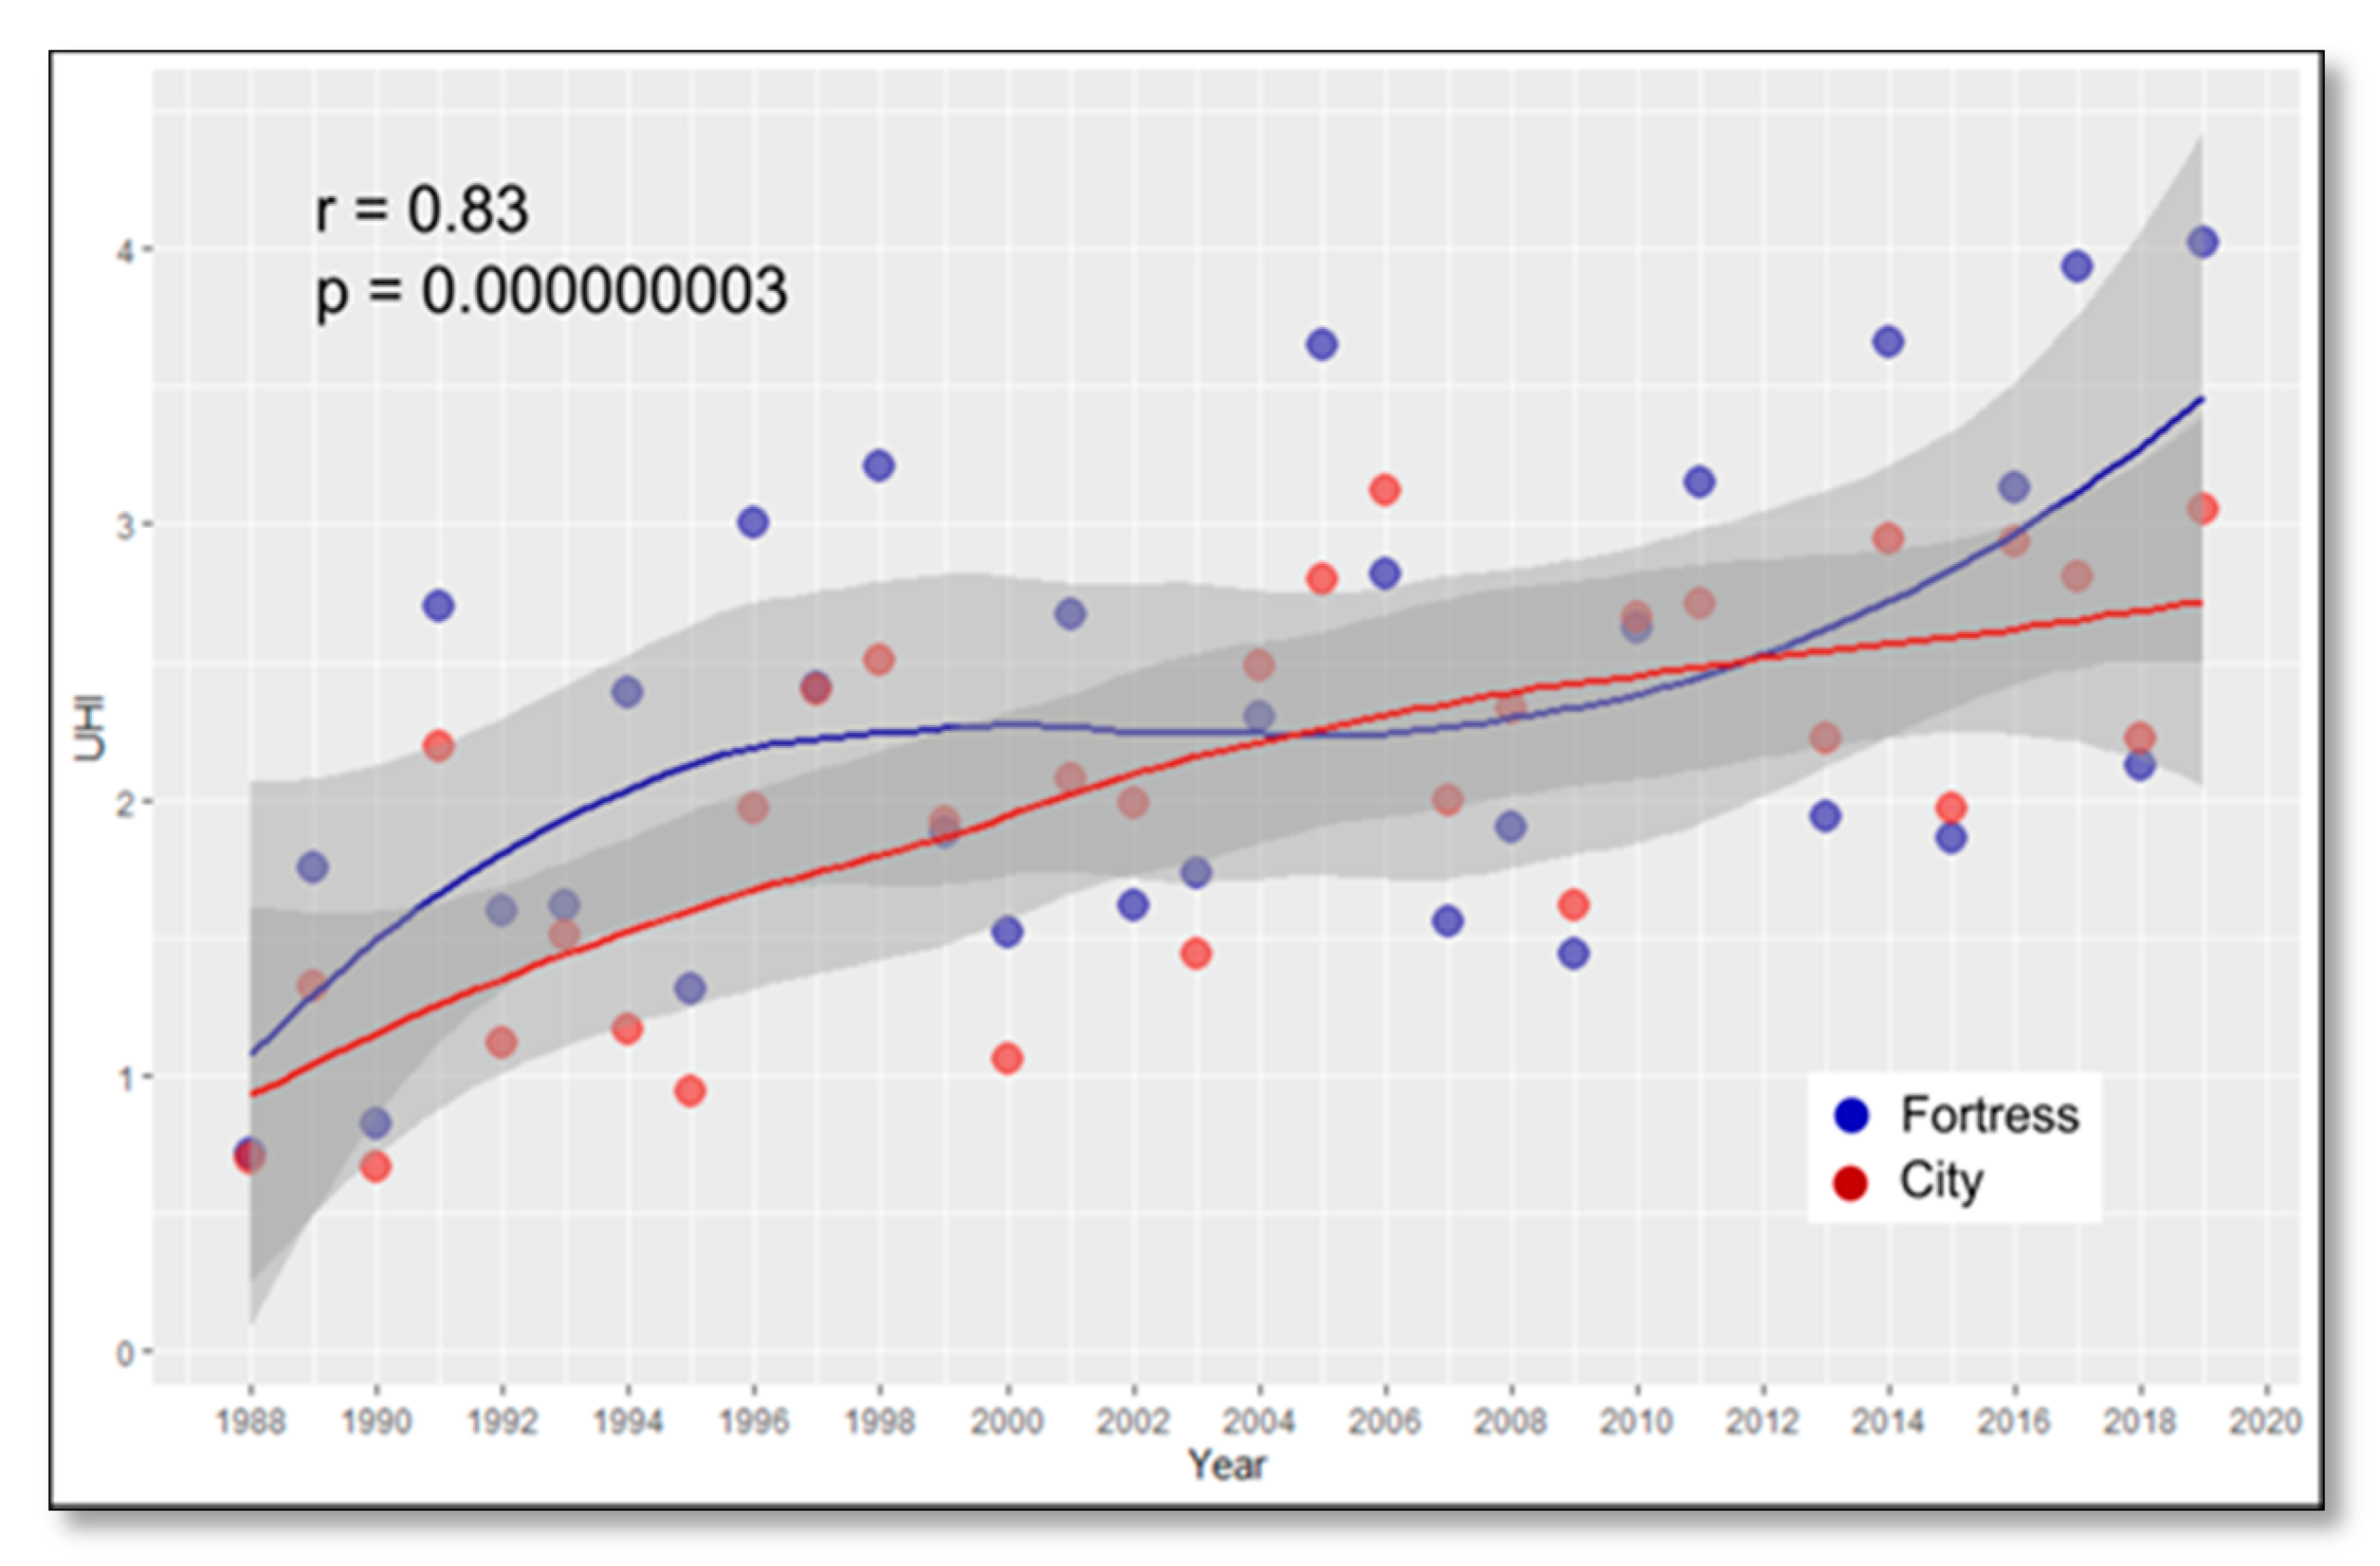
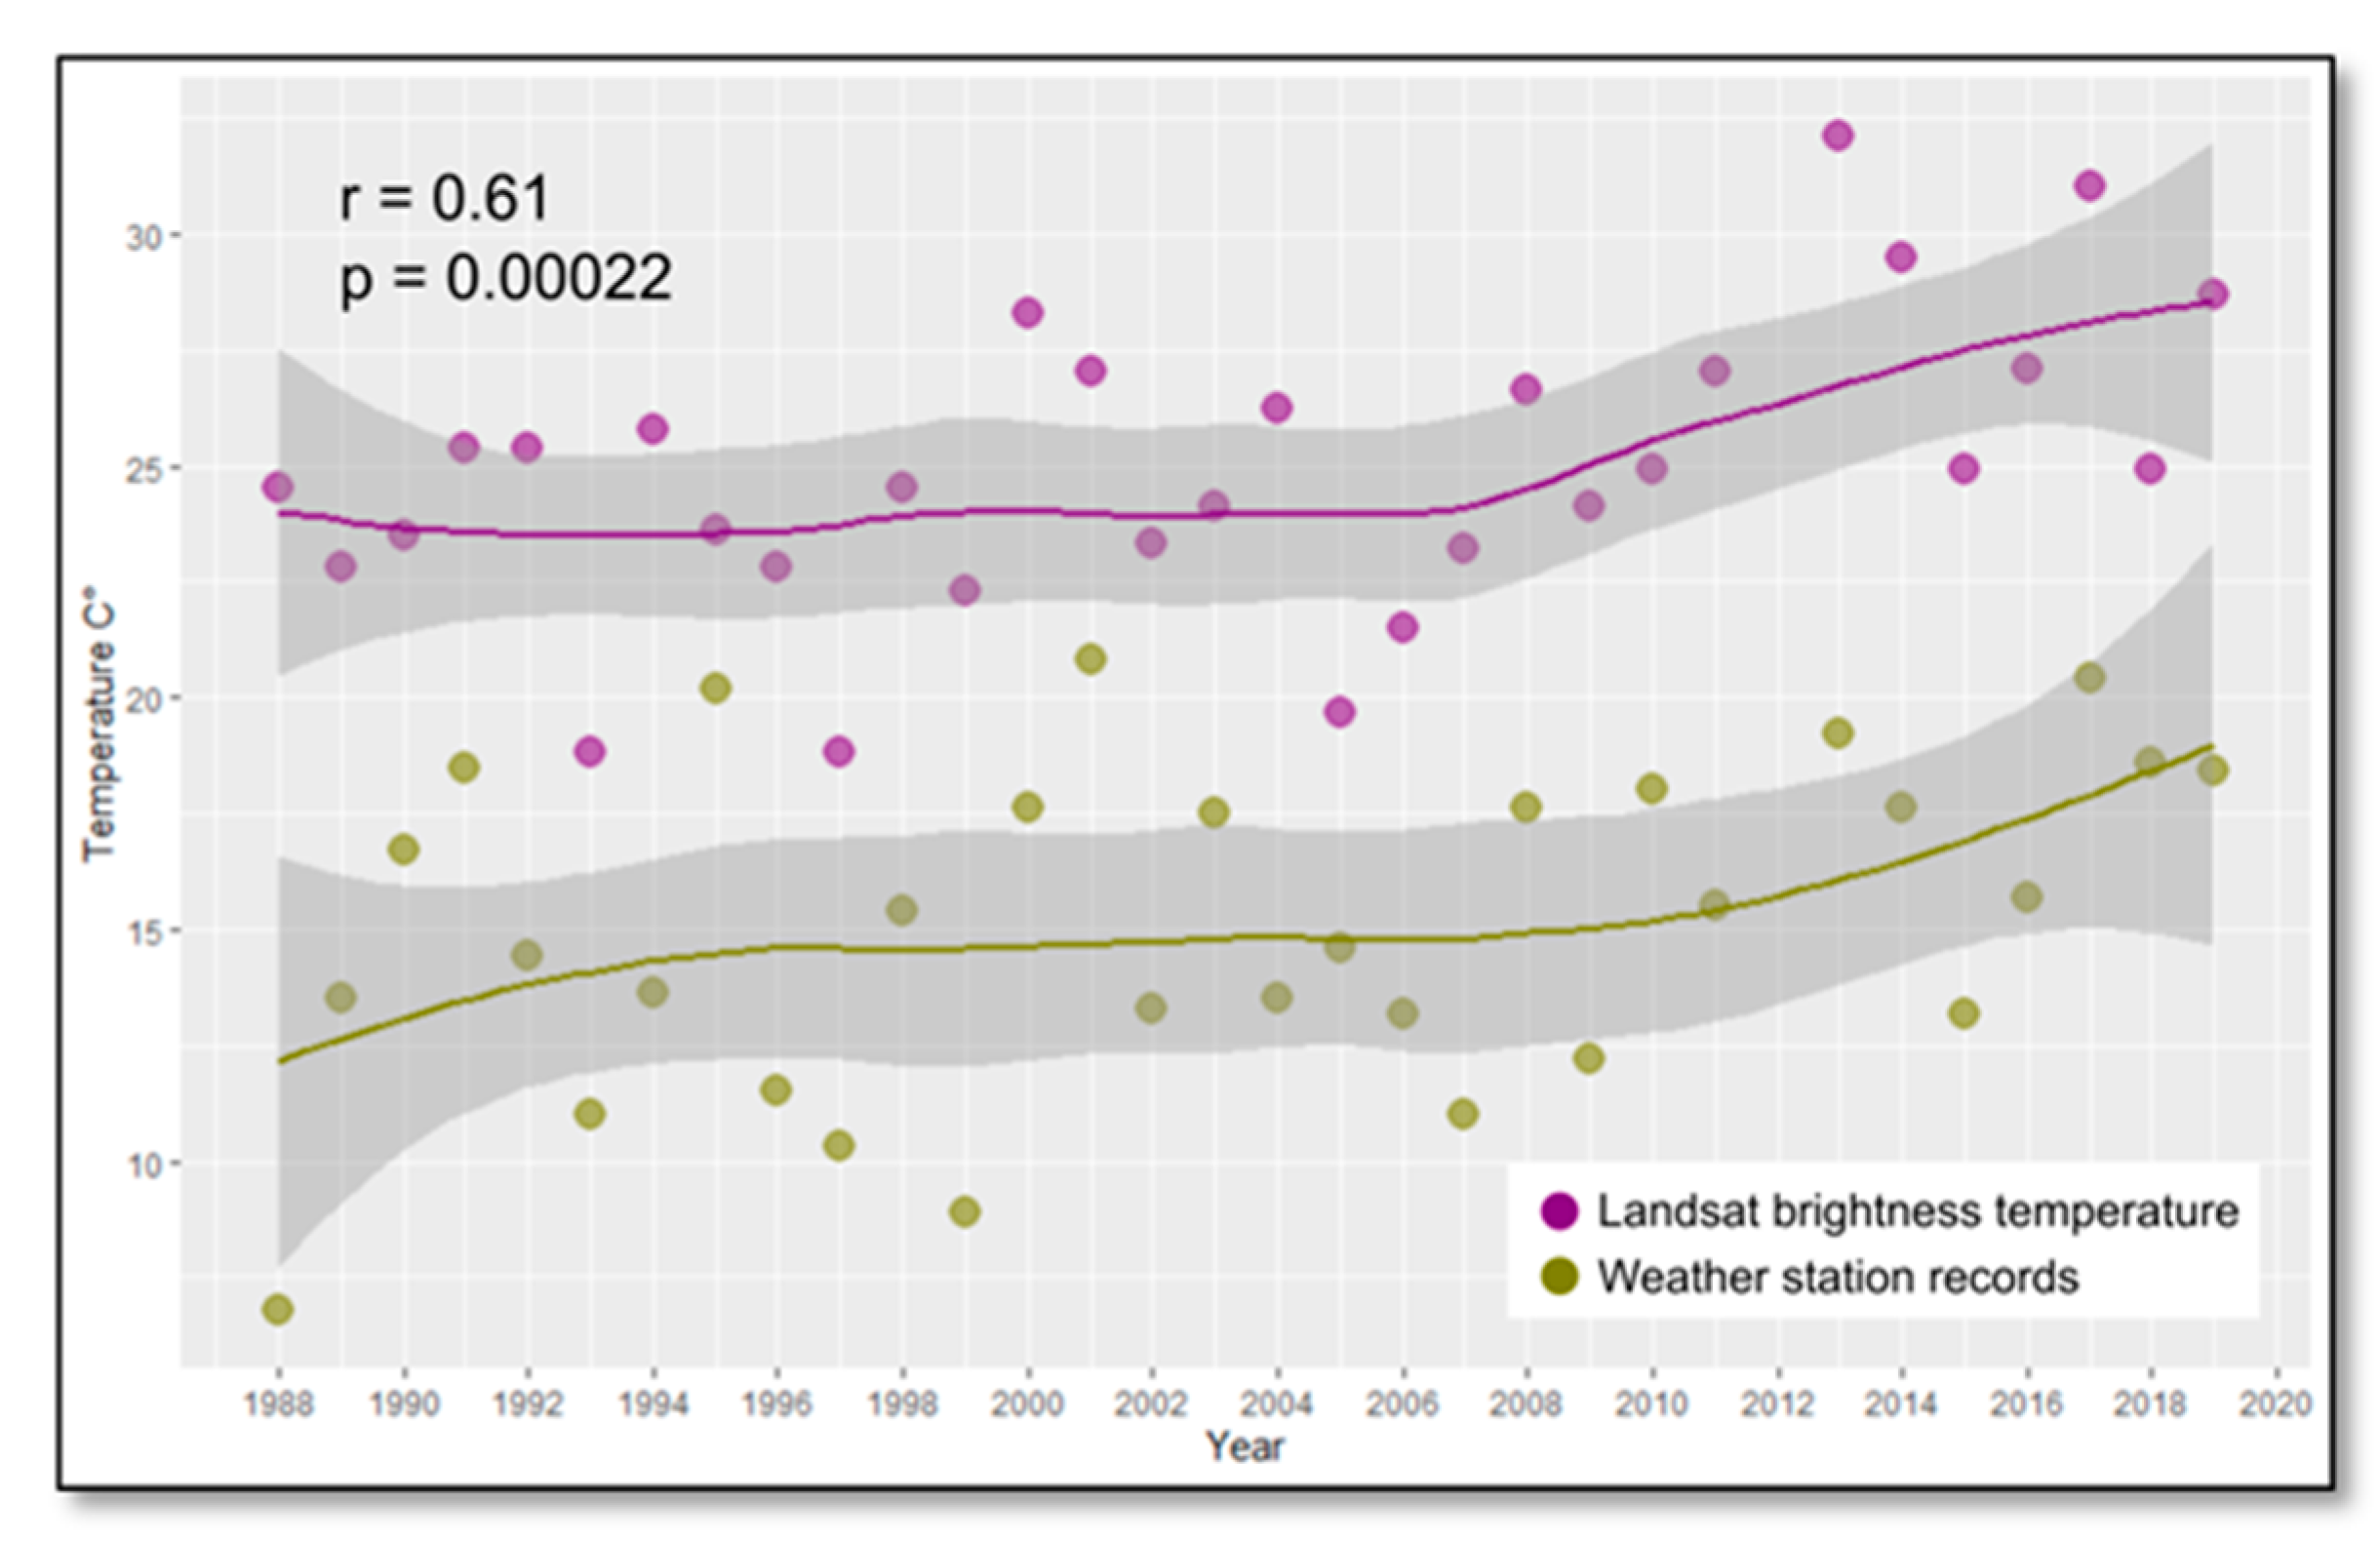
3.2. Case Study (2): Evaluation of the Thermal Stress Using UHI Analysis

The delineation of the city limits corresponding to the years 1994, 2000, 2006, 2010, and 2018 is presented in Figure 13.
During the investigated years, the area of Alba Iulia city doubled in size. In consequence, the UHI footprint expanded accordingly.
The spatial distribution of the UHI over Alba Iulia city and Alba Iulia Fortress during the study period is illustrated in Figure 14. The results were obtained by calculating the average value of every UHI product generated for the study period. Variations could be observed within the limits of the city, with peaks in areas corresponding to industrial and commercial districts with values as much as 8 °C higher than the surrounding areas. In the case of Alba Iulia Fortress, the fortification walls acted as a barrier, especially due to the covering vegetation layer. The temperatures measured in the area of the fortification walls averaged 1 °C lower than the surrounding areas. Two hotspots caused by the presence of large commercial and residential areas with tall apartment blocks were present to the north of the fortress. The data also shows that, in terms of habitation, the areas less affected by thermal discomfort were the outskirts, with the exception of the northeastern area, which is highly industrialized.
The mean temperature values generated from the processing of the Landsat time series are presented in Figure 15 for Alba Iulia city and Figure 16 for Alba Iulia Fortress. By examining the two charts representing the temperatures both for Alba Iulia city and Alba Iulia Fortress, it can be observed that the temperatures had a rising trend within the study period (about +2 °C for the city and +1.5 °C for the fortress).
The two resulting data series representing the evolution of temperatures in the study area were statistically analyzed using R programming language with the help of RStudio, an easy-to-use, open-source, integrated development environment (IDE) software. For this statistical validation, the Pearson linear correlation coefficient was calculated in order to investigate whether there was a correlation between the rise of temperatures in the city and in the fortress. By adding the two Excel files with the temperatures for the city and for the fortress, a graph representing the two data series was plotted. Simultaneously, the “r” coefficient was calculated. The results showed a high positive correlation [71] between the two data series, with a value of 0.83 for the Pearson “r” coefficient (Figure 17).
The validation of the results was performed by correlating the satellite remote sensing outputs with the temperature data measured by the meteorological ground station located in the center of Alba Iulia city, southeast of Alba Iulia Fortress. Practically, the correlation between the temperature data recorded by the National Meteorological Administration’s station and the temperature values of each pixel of the satellite image time series that overlapped with the position of the ground station was statistically analyzed (Figure 18). The results were satisfactory, showing a moderate positive correlation [71] between the two data sets with a Pearson “r” coefficient of 0.61.
It could be argued that since the results of the study represent the LST brightness temperature at sensor and not the actual temperature of the land surface, validating them based on the in-situ temperature data is unfeasible. However, the study aimed to identify the temperature trend over the years when the city expanded considerably and corroborate it with the trend of the temperatures recorded by the local weather station over the same time interval.
The UHI analysis has major relevance for preservation measures [72]. It is well known that vegetation induces lower temperatures that are beneficial for a better preservation of cultural heritage by “avoiding overheating on surfaces, reducing thermal stress and also damage due to rising damp and saline efflorescence” [73]. Higher temperatures affect underground and aboveground structures. In addition, higher temperatures lead to higher humidity, as was noticed in numerous archaeological sites within Alba Iulia Fortress. For Alba Iulia’s cultural heritage, the optimal temperature is a maximum value of 22 °C and the optimal humidity is in the range of 40–60%. In the principia the humidity could reach 90%, thus causing the decomposition of the structures. The UHI analysis provides a detailed overview of the heat islands and this information can be directly used by the cultural management authorities to apply corrective actions. For example, the vegetation areas that cover the fortification walls can be extended in order to maintain lower temperatures. Likewise, the areas that are affected by higher temperatures require the planting of vegetation or the extension of the protection areas. In correlation with the degree of physical structure degradation, the planted vegetation should be grass or other types of vegetation that would not further deteriorate the cultural heritage (for example, the roots of trees alter the structures, causing disintegration).

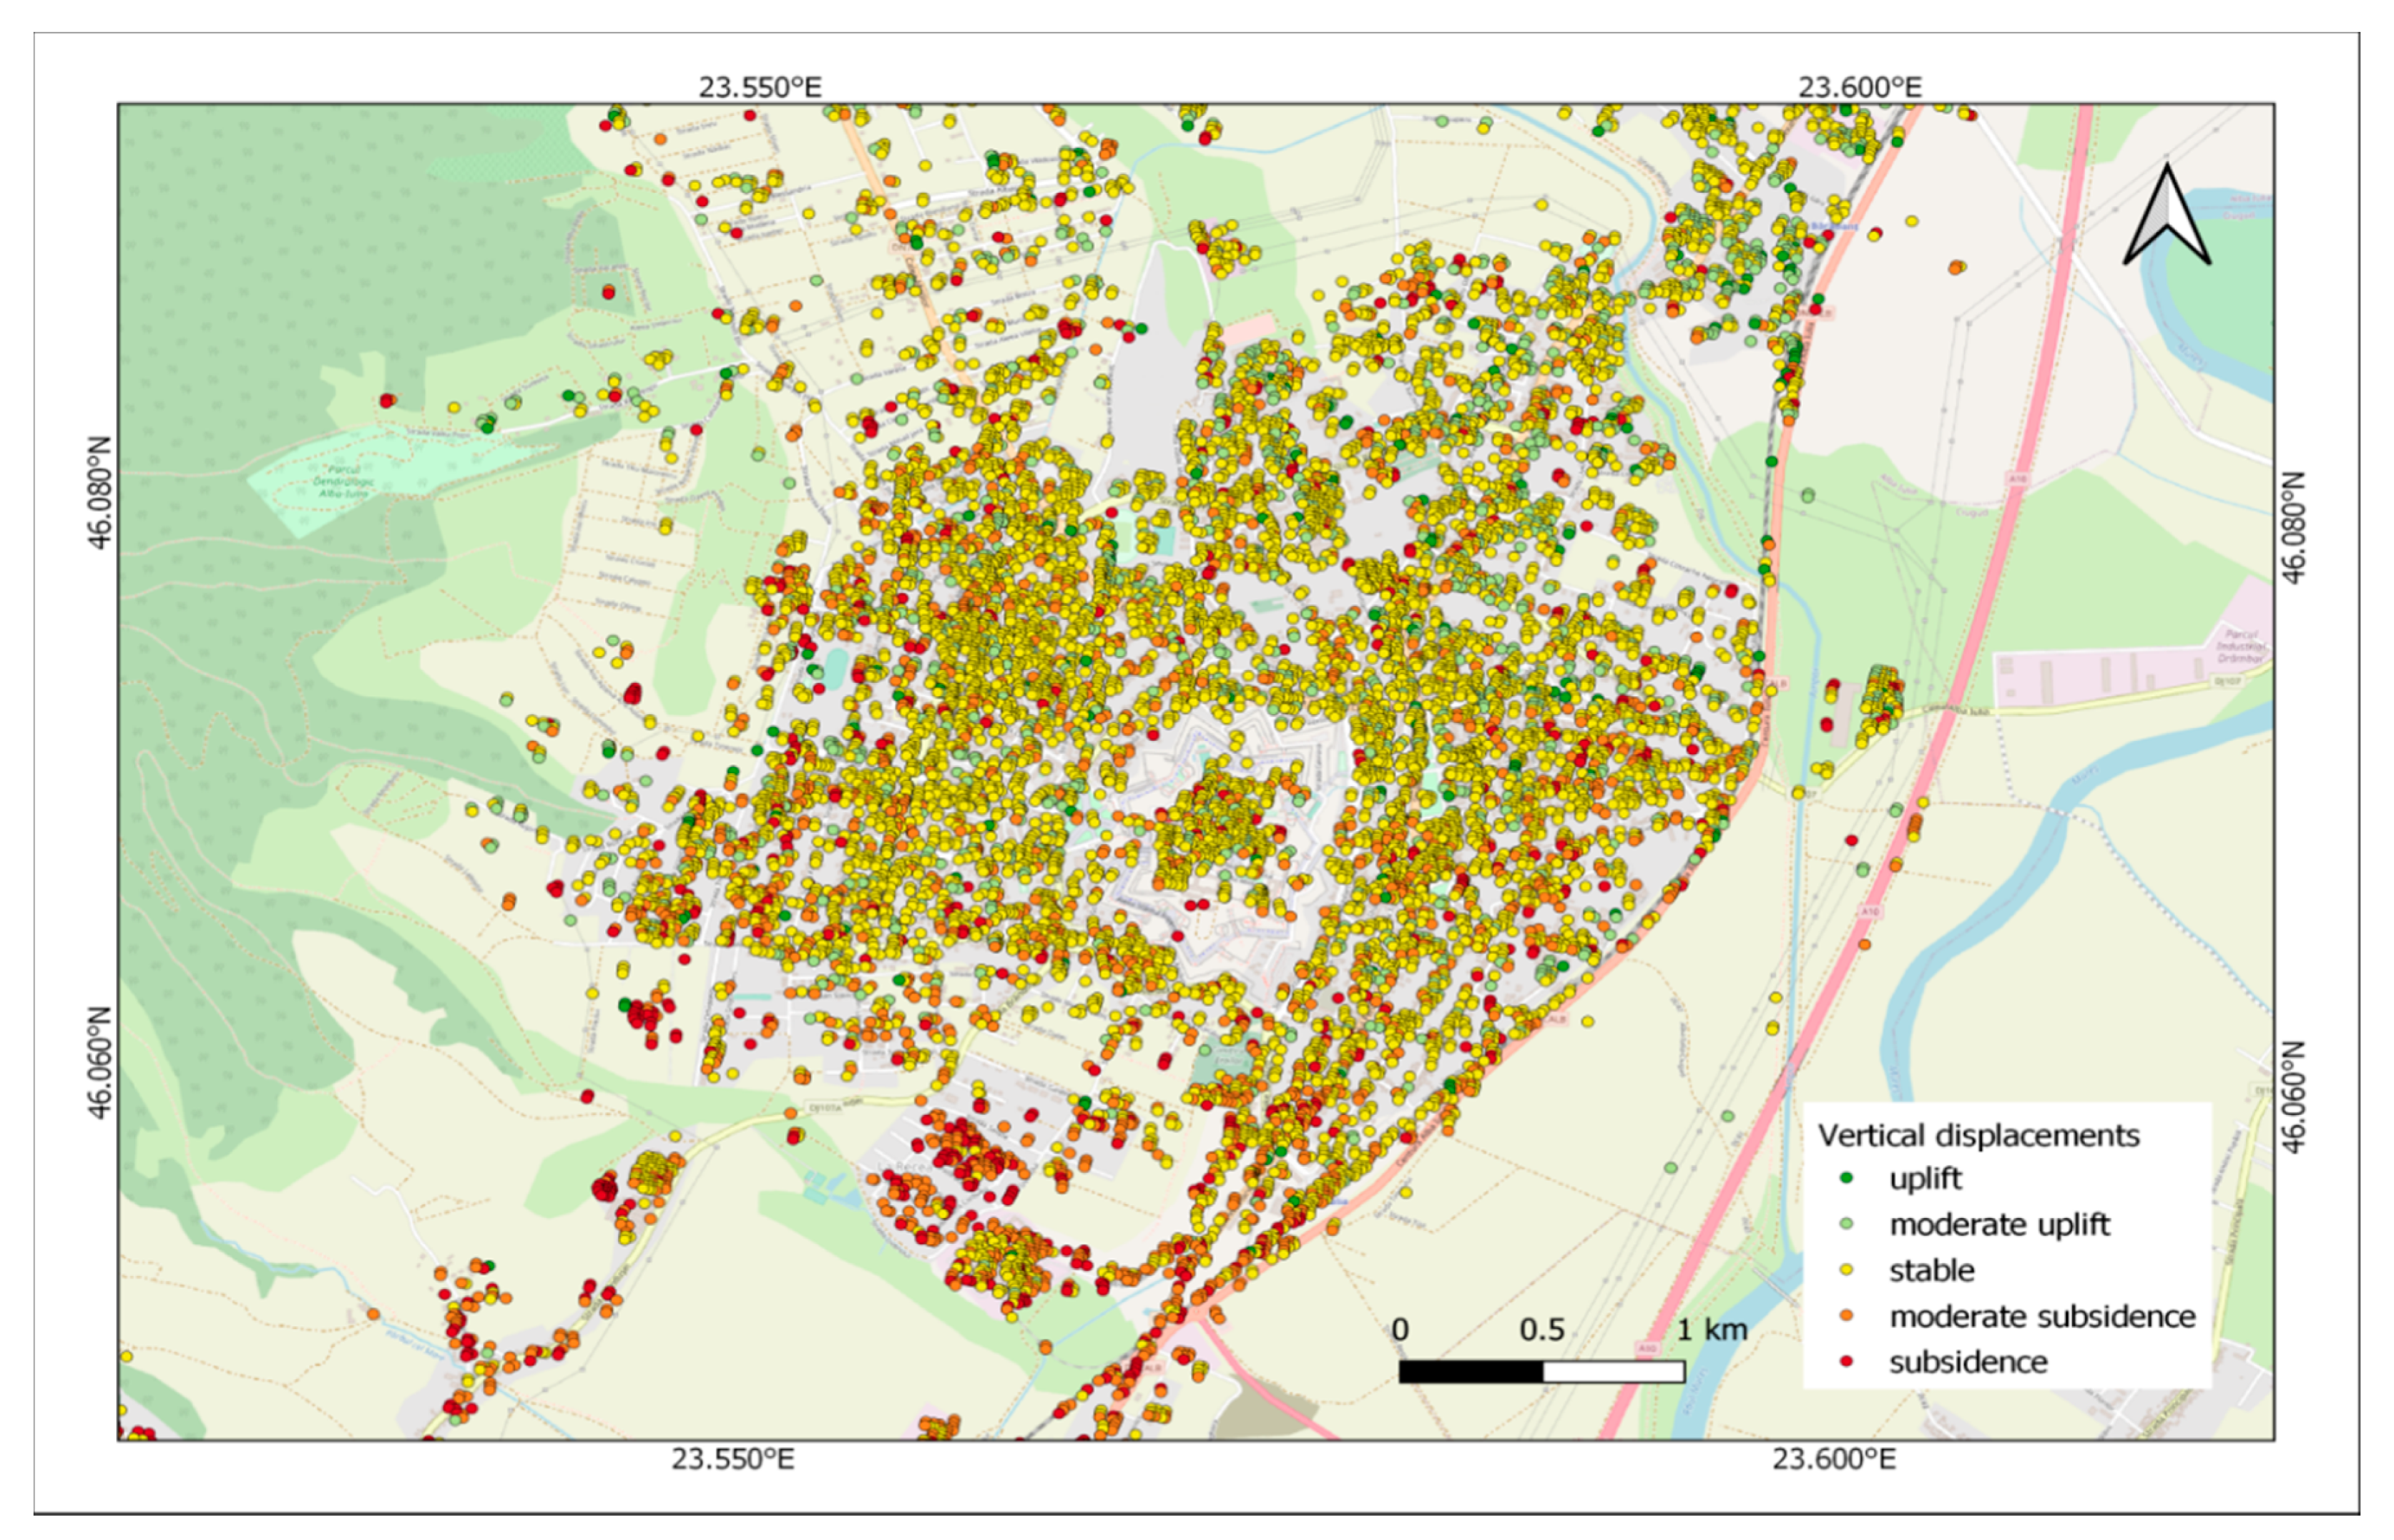
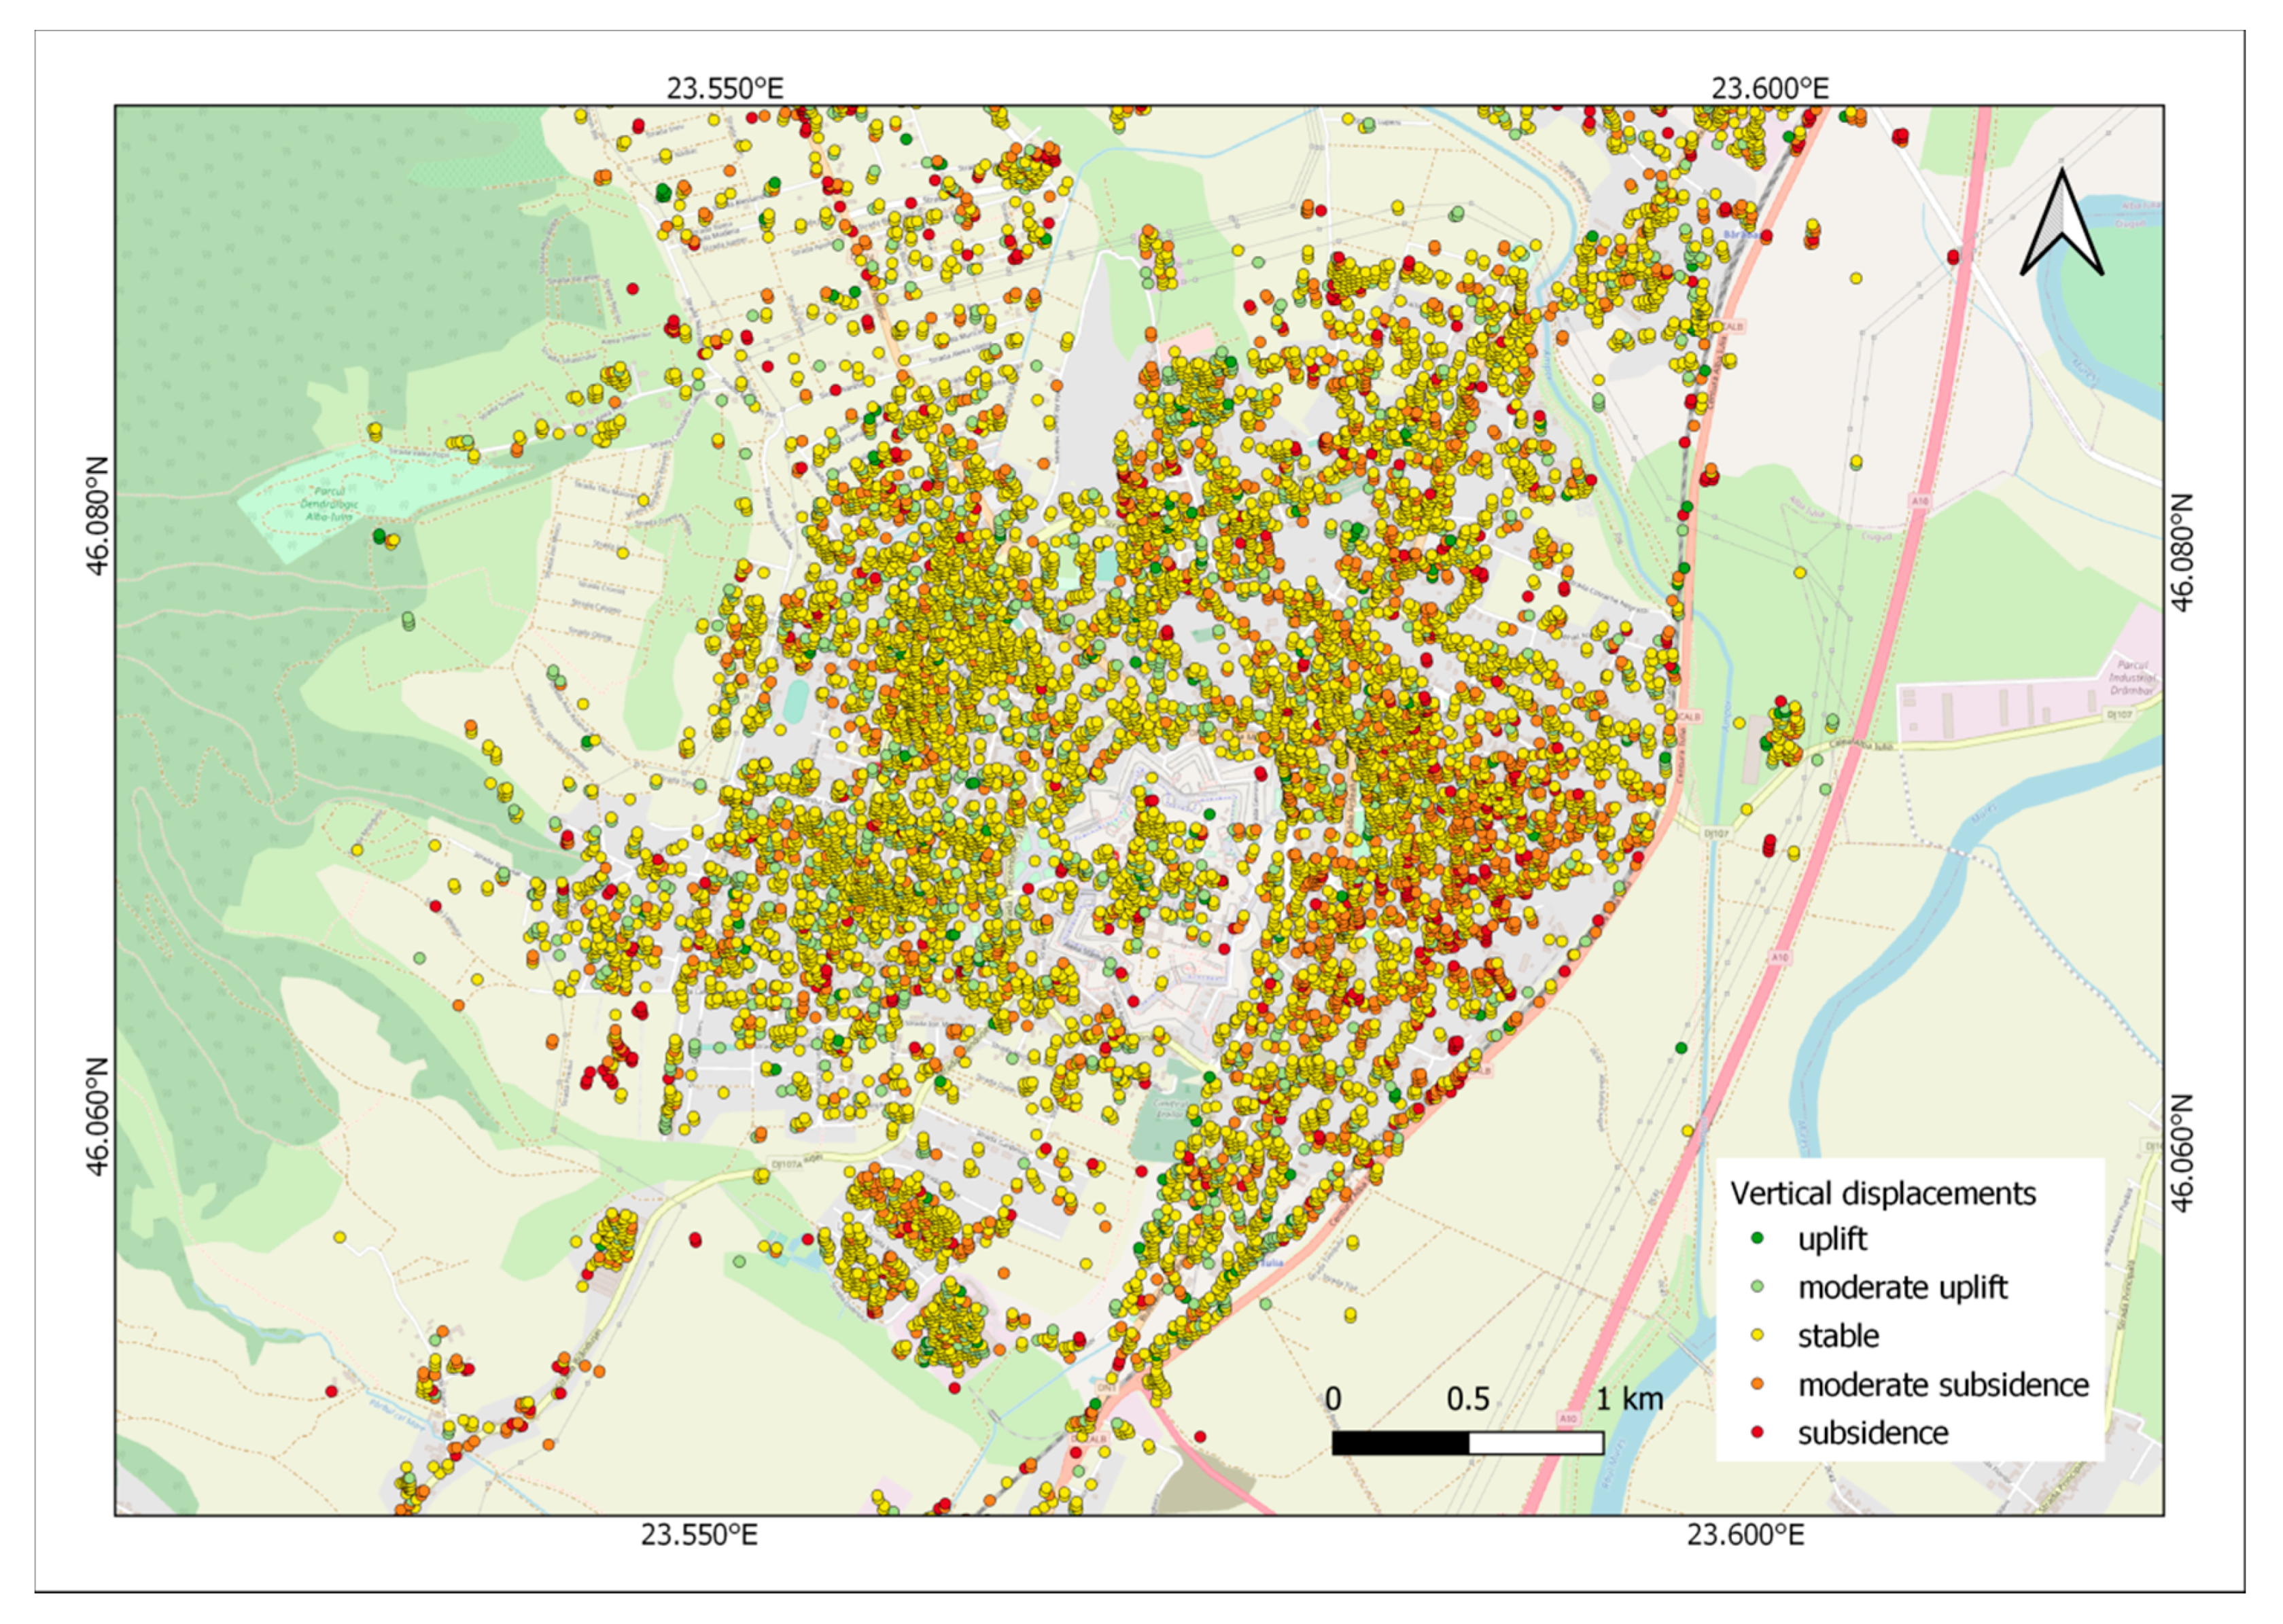
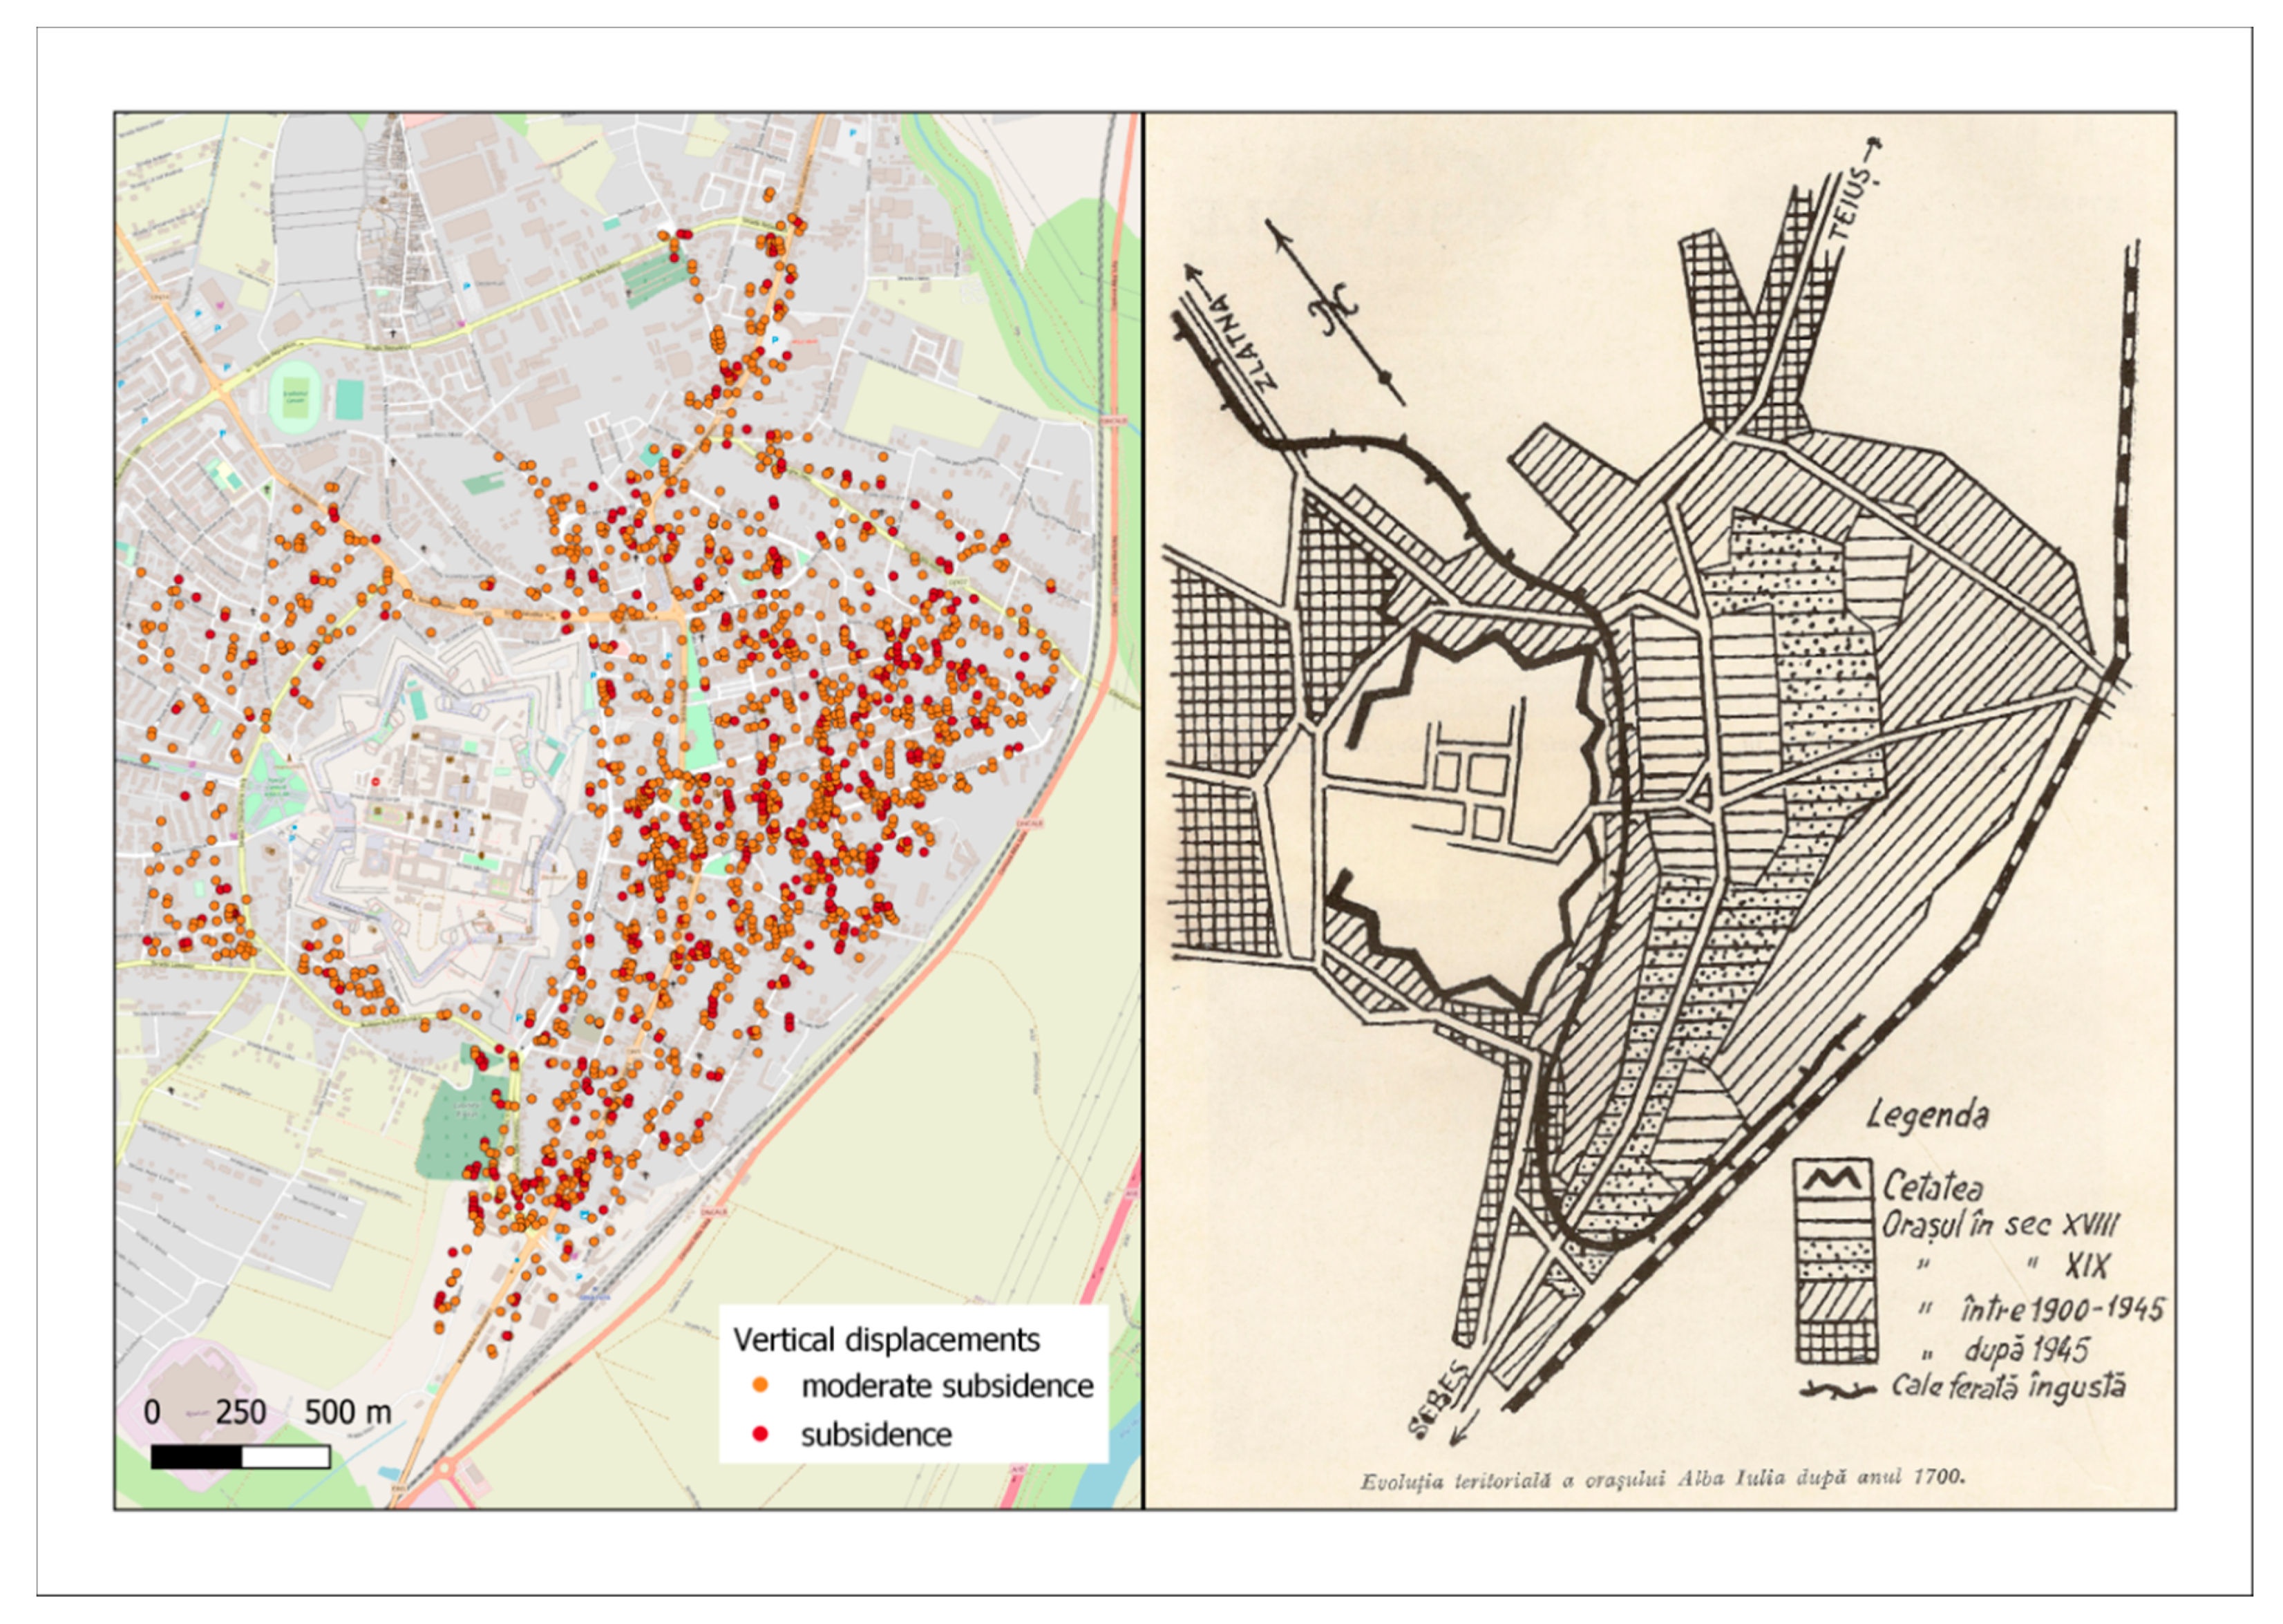
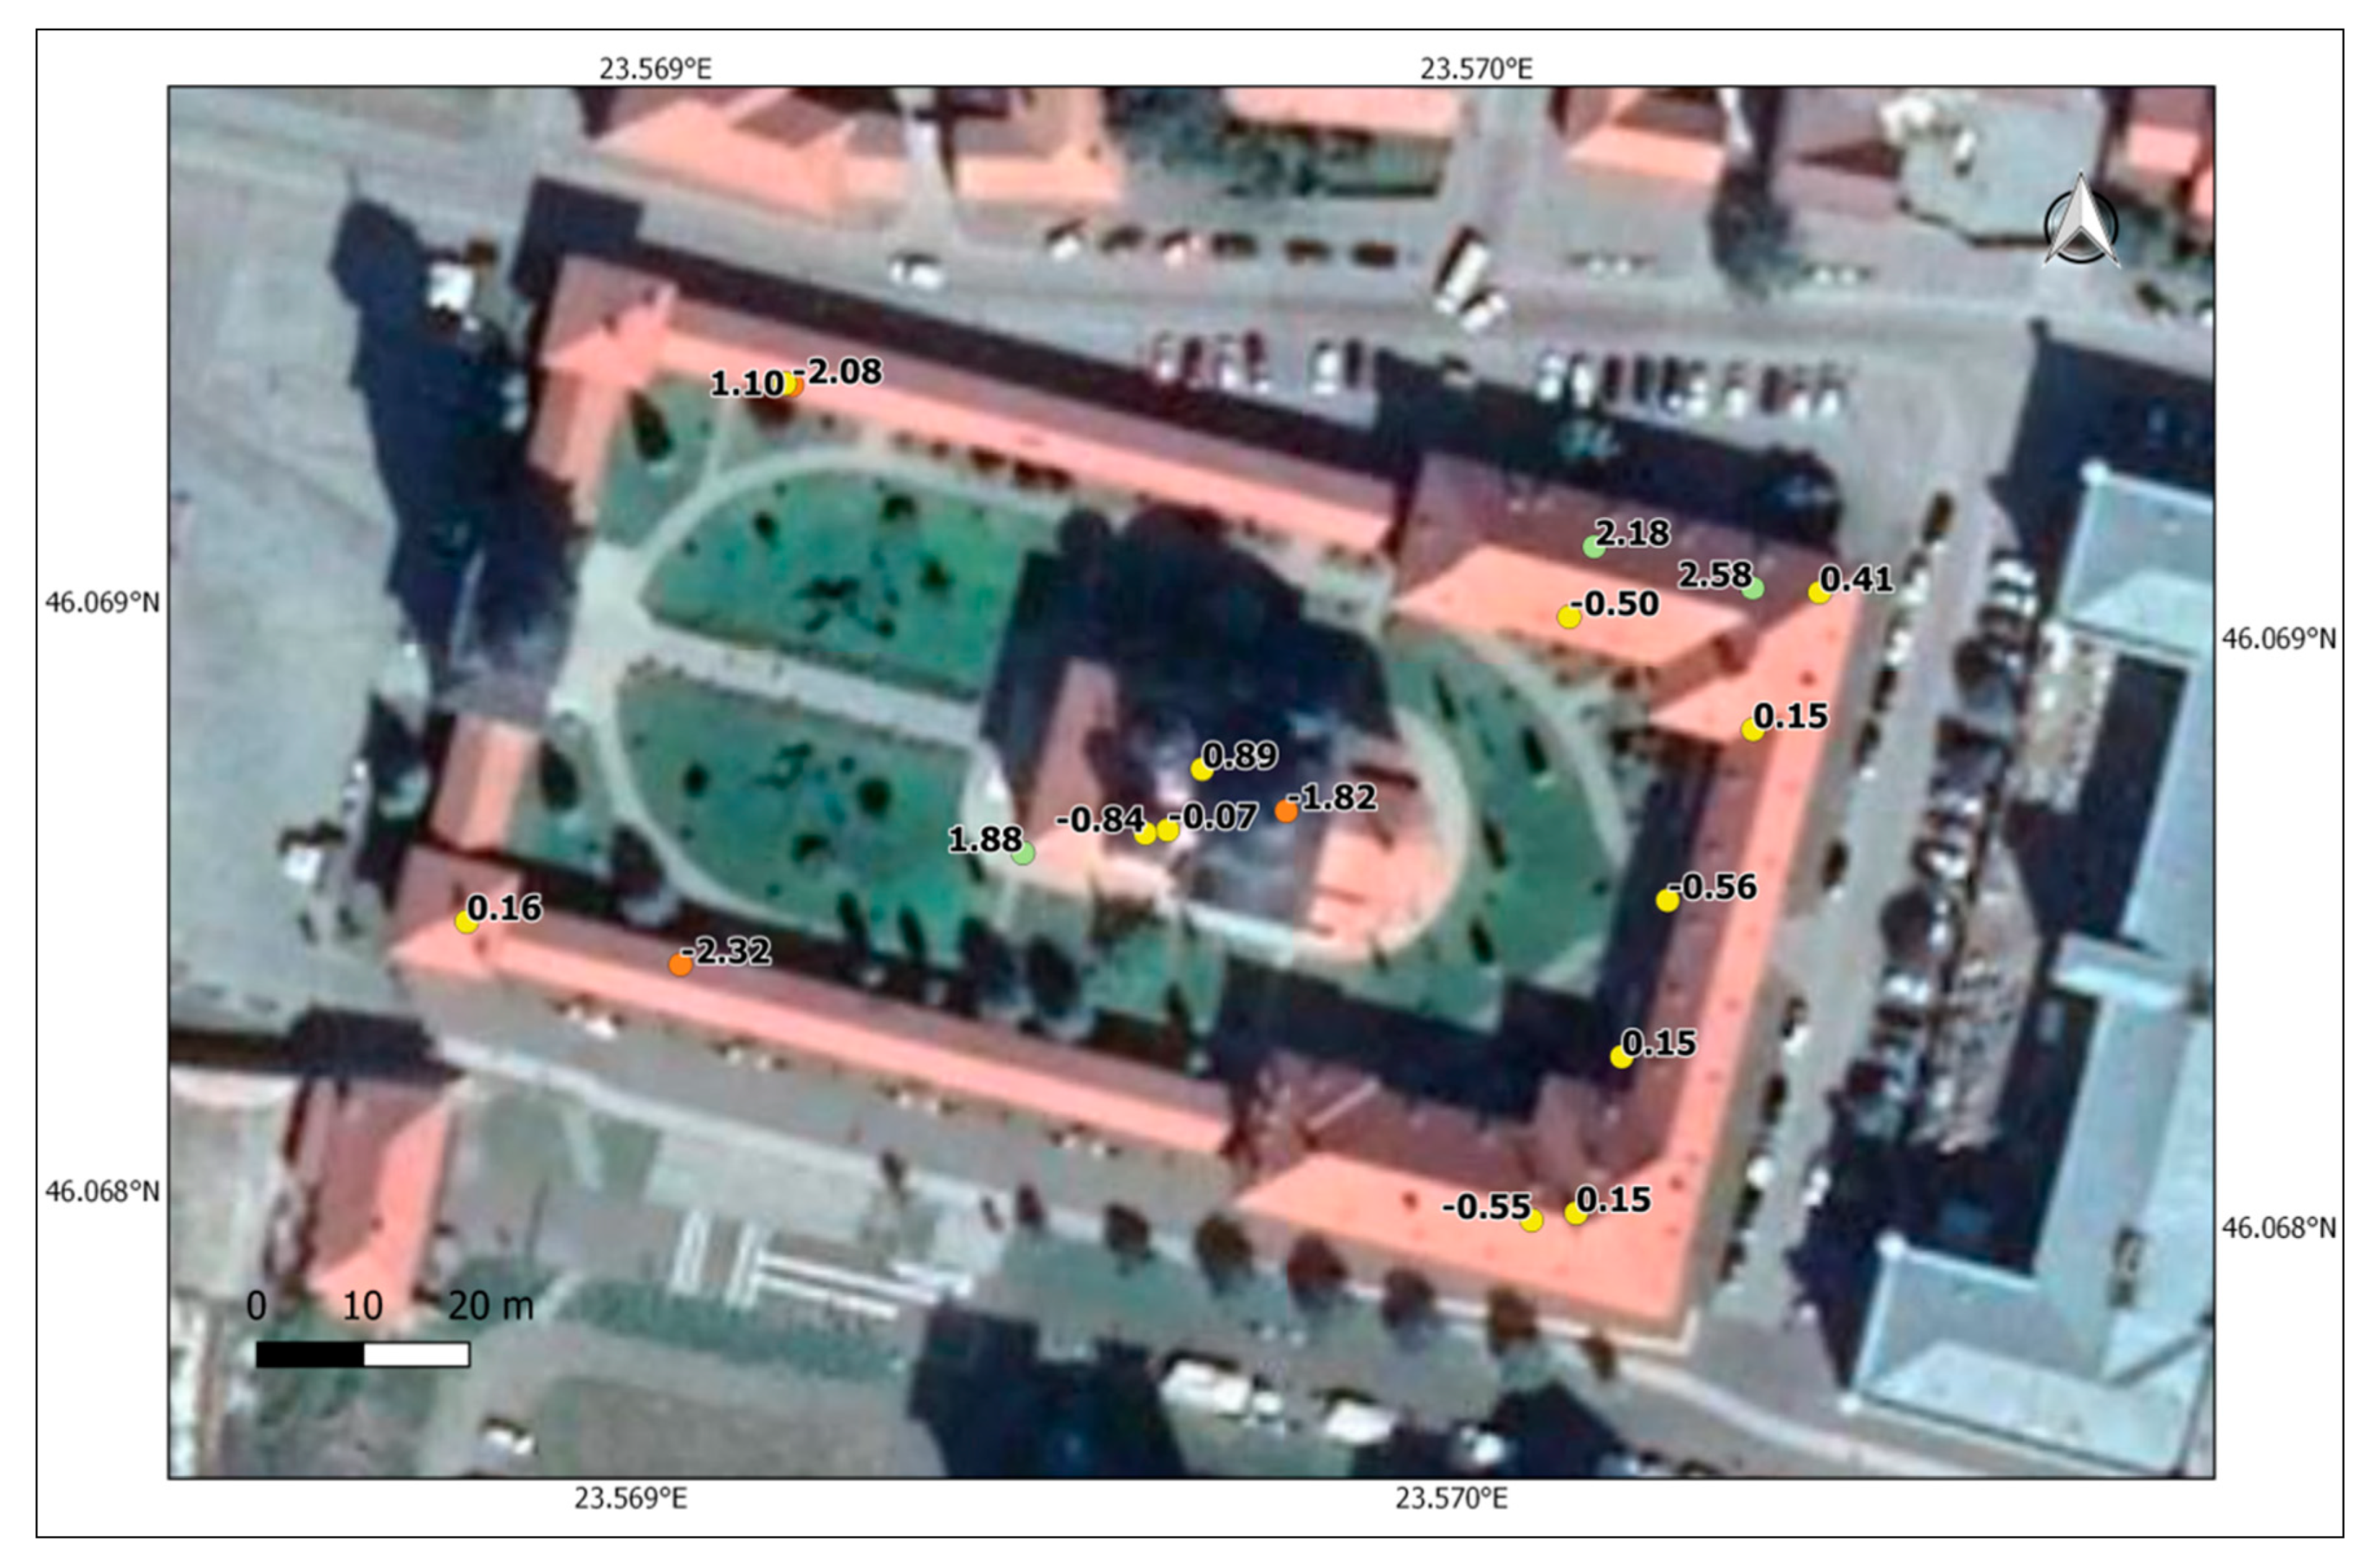
3.3. Case Study (3): Assessment of the Ground and Structural Stability Based on PS-InSAR

The PS-InSAR results consisted of the displacements in the LOS and the vertical direction. As the test site was represented by an urban area, the PS-InSAR technique was optimal for the assessment of the building displacements and consequently of the cultural heritage condition. Five intervals were defined for the representation of the results, namely, vertical displacement velocity values higher than +3.50 mm/year were identified as the uplifting process, the values between +1.50 ÷ +3.50 mm/year were attributed to moderate uplifting, the values between +1.50 ÷ −1.50 mm/year were considered to indicate stability, the values from the −3.50 ÷ −1.50 mm/year interval were attributed to moderate subsidence, and the values lower than −3.50 mm/year were associated with subsidence.
It can be observed that subsidence in Figure 19 is concentrated mainly in the south of Alba Iulia city, whereas in Figure 20 it is located in the east part. The explanation resides in the fact that the data acquired from descending orbits is more sensitive to the deformation that occurs in the west, northwest, and southwest directions, and the data from ascending orbits is more sensitive to deformation along the east, northeast, and southeast directions, as mentioned in [65].
The PS-InSAR results revealed that subsidence was encountered mainly in the districts that were developed on the former marshland areas and that are currently affected by high groundwater levels that flood the foundations of the buildings when heavy rains occur. The use of SAR data acquired from different Sentinel-1 orbits (i.e., descending and ascending) enabled the identification of both areas of concern. Figure 21 illustrates a detailed view of the vertical displacements of the buildings located on the eastern side of the fortress and the evolution of Alba Iulia city starting in the 18th century. The displacement map (Figure 21a) contains the PSs generated from the processing of the Sentinel-1A/B datasets corresponding to this particular area of interest and with a vertical displacement velocity value lower than −1.50 mm/year in order to better emphasize the subsidence areas. The urban planning of Alba Iulia city (Figure 21b) depicts different stages of development, namely, the areas elevated in the 18th century, 19th century, between 1900 and 1945, and after 1945.
An analysis of the vertical displacements within Alba Iulia Fortress revealed that overall the area is stable. Some of the PSs indicated the presence of subsidence and require further investigation using either a larger Sentinel-1 time series (with a shorter revisiting time for the acquisition of the images and also by adding new data in order to observe whether the trend remains unchanged) or multitemporal SAR imagery acquired by other satellite missions (e.g., TerraSAR-X, COSMOSkyMed) over the same time frame.
Figure 22 illustrates the results of the PS-InSAR processing for an emblematic building of Alba Iulia Fortress, namely Coronation Cathedral.
The values on the map represent the vertical displacement velocities derived from the processing of the two Sentinel-1 datasets. Although the values were mainly within the stability interval (as defined above), the results indicate a slight subsidence trend (on the northern and southern sides, to the west) as well as a slight uplift trend (on the northern side, to the east) for the perimeter buildings. The previous ground examinations revealed that the cathedral presented deformations caused by subsidence.
It could be argued that the results are not completely reliable and their interpretation is difficult to some extent. However, the results are valuable and accurate, as the displacements were measured at the individual building level. The PS-InSAR technique signaled the potential susceptible areas that require further analysis using satellite data or ground investigations (e.g., terrestrial measurements, visual inspections, field surveys). From this perspective, PS-InSAR is excellent for the early detection of the potential threats to the cultural heritage sites. In addition, the results’ level of detail is adequate also for archaeological research. From the cultural heritage management perspective, the early detection of building instability (e.g., inclination, displacement, deformation) is extremely important. For example, an inclination of more than 2 degrees suggests an ongoing deterioration process. In addition, horizontal displacements of 1–2 cm signify structural instability or subsidence. These types of processes cannot be observed during a visual inspection, as they are imperceptible to the human eye. Hence, PS-InSAR provides essential information for cultural heritage management, as timely specific intervention actions could be undertaken to safeguard the buildings. It is also important to find the underlying cause of these processes. For example, if the inclination is caused by vibrations, then the cultural heritage building requires reparation work using filling materials. If the inclination is caused by displacements, then major intervention work must be performed at the foundation of the affected building. In these cases, a detailed analysis regarding the building integrity is also performed locally by construction experts. As the displacements of cultural heritage are critical and require high restoration costs, early identification leads to diminished risks and lower intervention costs.

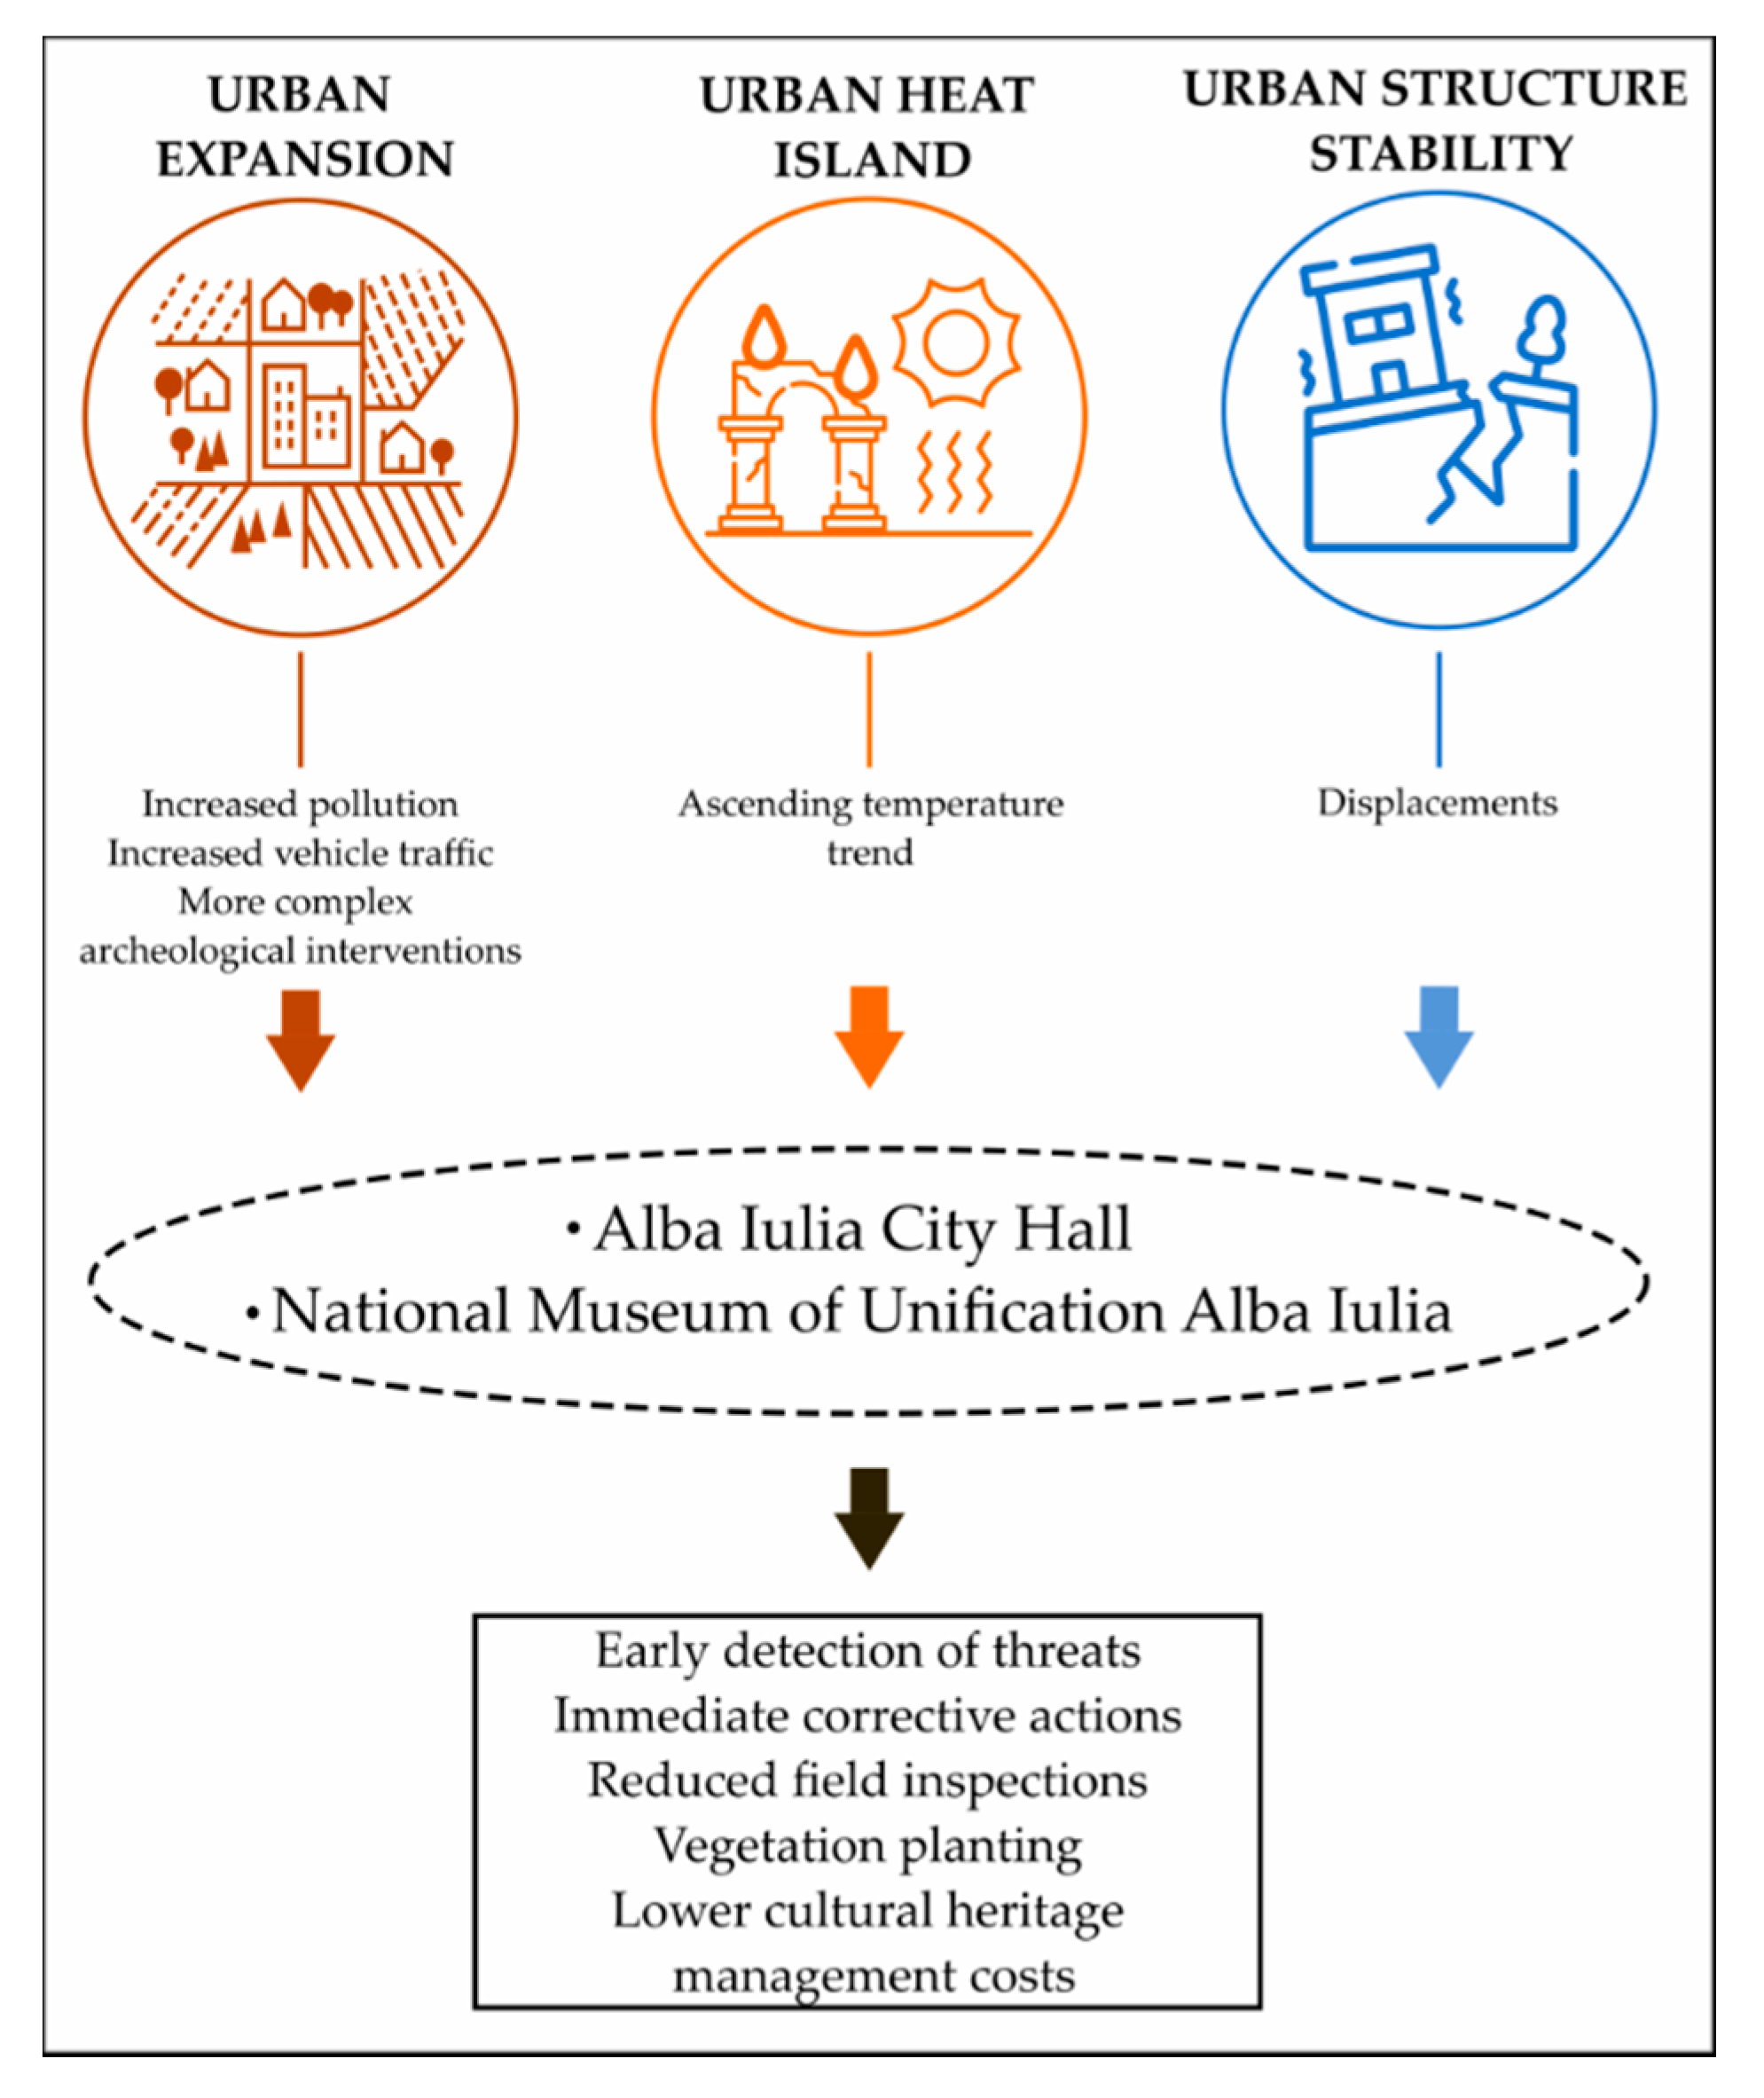
3.4. Relevance of the Results for Cultural Heritage Management

The results obtained within the three cases studies strengthen cultural heritage management by supporting the prioritization of intervention actions. In addition, the results contribute to the elaboration of the site intervention documentation and to the assessment of cultural heritage’s structural integrity. In Alba Iulia, the cultural heritage management plan is elaborated both at the level of the territorial administrative unit and individualized for each area. Hence, each cultural heritage site has a distinct management plan. The satellite-derived results are pertinent to the revision of the management plans.
Accordingly, the users of these results are the authorities in charge of the conservation and protection of the cultural heritage sites. Alba Iulia City Hall, in collaboration with the National Museum of Unification Alba Iulia, manages the local cultural heritage sites. A new department will be established within City Hall with the aim of enabling an improved management of cultural heritage by using an integrated approach. At national level, the National Heritage Institute and the Ministry of Culture represent potential users of the results.
A diagram showing the overall concept of the research and the relevance and usefulness of the results in the context of cultural heritage management is presented in Figure 23. Summing up, the results of the Alba Iulia study consist of an analysis of the urban expansion that consequently might lead to increased pollution and more demanding archaeological interventions within the areas with changed land use, an investigation regarding the ascending temperature trend that represents a key element of climate change that directly affects the conservation of the cultural heritage, and an evaluation of the ground and structural integrity, which have a clear value for preservation measures. Without exception, the results of the study can be exploited for improved individual management plans for cultural heritage sites.

4. Discussion and Conclusions

The main objective of the present research was to demonstrate and promote the use of satellite remote sensing as a convenient approach for the generation of sustainable results in the process of cultural heritage stewardship, preservation, and management.
The study contributes to a better understanding of the extent and impact of the primary and secondary factors that affect Alba Iulia’s cultural heritage sites. Urban expansion is associated with increased residential areas and commercial and industrial development. Consequently, these factors generate an increased use of transport infrastructure, air pollution, temperature rise, and altered environmental or biological factors such as humidity and dust. Additionally, climate change also contributes to local temperature rise and increased hazard risks. Moreover, other human activities such as illegal construction threaten the integrity of cultural heritage. In general, all the related urban development factors are recognized as having a major impact on heritage sites [74]. In this context, sustainable urban development should be strongly linked to the protection of cultural heritage [75], and thus information regarding the current state of conservation and the challenges faced by urban heritage is essential [76]. The urban analysis performed in this study based on multitemporal satellite imagery generated significant results that can be further exploited by the responsible authorities (i.e., Alba Iulia City Hall) to adapt the individual management plans for cultural heritage sites.
Specifically, the study enabled a detailed analysis of the temporal and spatial evolution of the Alba Iulia territorial administrative unit’s urban growth. Besides an accurate quantification of the magnitude of urban expansion, the study identified the specific time frame in which the most significant changes occurred. Furthermore, the study provided evidence that upholds the analysis and monitoring of the vicinities of the investigated cultural heritage site, as these areas usually offer essential information that should be taken into consideration by cultural heritage site managers when revising protection and conservation strategies. Therefore, the accurate assessment of the urbanization trend obtained based on the LULC analysis expands the knowledge related to the risk factors that can irreparably destroy cultural heritage. The upward trend in built-up land can contribute to an upward trend in pollution caused either by intensified vehicle traffic or newly developed industrial areas. Over time, pollution represented a key factor in the degradation of the surfaces of historical buildings and monuments. Pollutants emitted into the atmosphere can have a major and sometimes irreversible impact on the objectives of cultural heritage, through phenomena of corrosion caused by chemicals or soiling caused by particles [48]. The early identification and anticipation of this threat contribute to the development of strategies and the adoption of techniques for safeguarding cultural heritage. In the past, the third gate of the fortress was affected by pollution due to various atmospheric agents that produced the physical disintegration of the cultural monument, for which restoration work was required. Thus, the early identification of these threats contributes to risk mitigation and implicitly lowers intervention costs.
The urban heat islands that were delineated inside the study area represent useful information for cultural heritage authorities. In this way, the intervention measures that can be undertaken (e.g., establishment of new vegetation areas, extension of the existing ones) would be more effective when using the information related to the location of the heat islands.
The remote sensing analysis also exposed the potential vulnerable areas within the study area. Currently, PS-InSAR represents the most advantageous tool for the accurate and rapid identification and assessment of ground and structural displacements. PS-InSAR results flag the buildings that might require further on-ground investigations and, in this manner, strengthen the preventive measures within the cultural heritage management process.
Overall, the results obtained in the three case studies contribute to a better characterization of the Alba Iulia territorial administrative unit that encloses the Alba Iulia Fortress cultural heritage site. Remote sensing enables the analysis and monitoring of cultural heritage sites over impressive time spans. In addition, due to the recent Earth Observation data policies that allow the free use of data, studies have become more complex and the integration of different approaches has enriched the variety of the results and enhanced their join interpretation. The outcomes of the study strengthen archaeological research and integrate a wider spectrum of information that is fundamental for advanced cultural heritage management decisions and actions.
Considering the impact of air pollution on cultural heritage conservation, future work will focus on the quantification and monitoring of air pollution levels based on satellite data. The recently launched Sentinel-5P satellite mission is dedicated to air quality monitoring and enables the identification of trace gases and pollutants [77]. Using an interdisciplinary approach, the study will target the identification of the pollutants and particles with a high impact on cultural heritage, as well as the improvement of conservation and risk mitigation solutions.
Furthermore, future work involves the use of very high-resolution optical remote sensing data for the identification and monitoring of the urban changes at a very detailed scale. Such an analysis would enable the detection of individual buildings that are constructed within the boundaries of the protected cultural heritage site. For example, the early identification of illegal constructions based on satellite imagery can prevent the deterioration of the cultural heritage site by adopting counteractive measures. In addition, in some cases, ground inspections cannot be performed due to various reasons; accordingly, satellite monitoring would represent a feasible source of accurate information. Not only can illegal constructions affect cultural heritage sites, but also the buildings that receive formal approval for construction within the protected area of the archaeological sites. For example, changes to the skyline can have a major impact on the historic landscape, consequently affecting the value of the cultural heritage site. Therefore, the continued monitoring of cultural heritage sites using very high-resolution satellite imagery would provide essential information for management authorities to change the General Urban Plan. For more accurate results, processing very high-resolution satellite data will be performed based on modern classification algorithms such as Support Vector Machine (SVM) or object-based image analysis (OBIA).
Likewise, future work involves the application of PS-InSAR based on very high-resolution SAR imagery (e.g., TerraSAR-X, COSMOSkyMed). The purpose of this approach targets multiple aspects, such as the generation of more PSs for an improved examination of cultural heritage buildings, and the cross-validation of the displacement trends obtained from the exploitation of the Sentinel-1 data. In addition, in order to continue and complement the analysis of the multitemporal SAR series, the processing of newly acquired Sentinel-1 data is foreseen. A special emphasis will be placed on the validation of the SAR interferometric processing results based on in situ observations (e.g., geodetic measurements performed in reference test sites, integration of data collected by the Global Navigation Satellite Systems (GNSS) permanent stations).
Lastly, the study demonstrated in all respects the potential of Earth Observation data to provide meaningful information for cultural heritage management, especially for the assessment of the conservation state, the early detection and impact estimation of different threats/factors, and the planning of intervention actions. In addition, multitemporal and multisensor remote sensing analysis indirectly contributes to target 11.4, “Strengthen efforts to protect and safeguard the world’s cultural and natural heritage” [78], of the United Nations Sustainable Development Goals (UN SDGs).

Author Contributions

Conceptualization, C.M., I.D.N., C.E.M., A.M.L. and A.L.D.; methodology, C.E.M., A.M.L. and A.L.D.; writing—original draft preparation, C.M., I.D.N., C.E.M., A.M.L., A.L.D., G.T.R. and I.C.I.; writing—review and editing, C.M., I.D.N. and A.B.; supervision, A.B. All authors have read and agreed to the published version of the manuscript.

Funding

This work was supported by a grant from the Romanian Ministry of Research and Innovation, CCCDI—UEFISCDI, project number PN-III-P1-1.2-PCCDI-2017-0413/contract number 50PCCDI/2018, within PNCDI III.

Institutional Review Board Statement

Not applicable.

Informed Consent Statement

Not applicable.

Data Availability Statement

The data presented in this study are available on request from the corresponding author. The data are not publicly available due to ongoing researches in this field.

Conflicts of Interest

The authors declare no conflict of interest.

References

  1. Tapete, D. Remote Sensing and Geosciences for Archaeology. Geosciences 2018, 8, 41. [Google Scholar] [CrossRef] [Green Version]
  2. Megarry, W.P.; Cooney, G.; Comer, D.C.; Priebe, C.E. Posterior Probability Modeling and Image Classification for Archaeological Site Prospection: Building a Survey Efficacy Model for Identifying Neolithic Felsite Workshops in the Shetland Islands. Remote Sens. 2016, 8, 529. [Google Scholar] [CrossRef] [Green Version]
  3. Balz, T.; Caspari, G.; Fu, B.; Liao, M. Discernibility of Burial Mounds in High-Resolution X-Band SAR Images for Archaeological Prospections in the Altai Mountains. Remote Sens. 2016, 8, 817. [Google Scholar] [CrossRef] [Green Version]
  4. Stewart, C.; Oren, E.D.; Cohen-Sasson, E. Satellite Remote Sensing Analysis of the Qasrawet Archaeological Site in North Sinai. Remote Sens. 2018, 10, 1090. [Google Scholar] [CrossRef] [Green Version]
  5. Borie, C.; Parcero-Oubiña, C.; Kwon, Y.; Salazar, D.; Flores, C.; Olguín, L.; Andrade, P. Beyond Site Detection: The Role of Satellite Remote Sensing in Analysing Archaeological Problems. A Case Study in Lithic Resource Procurement in the Atacama Desert, Northern Chile. Remote Sens. 2019, 11, 869. [Google Scholar] [CrossRef] [Green Version]
  6. Malinverni, E.S.; Pierdicca, R.; Bozzi, C.A.; Colosi, F.; Orazi, R. Analysis and Processing of Nadir and Stereo VHR Pleiadés Images for 3D Mapping and Planning the Land of Nineveh, Iraqi Kurdistan. Geosciences 2017, 7, 80. [Google Scholar] [CrossRef] [Green Version]
  7. Tapete, D.; Cigna, F. Appraisal of Opportunities and Perspectives for the Systematic Condition Assessment of Heritage Sites with Copernicus Sentinel-2 High-Resolution Multispectral Imagery. Remote Sens. 2018, 10, 561. [Google Scholar] [CrossRef] [Green Version]
  8. Chyla, J.M. How Can Remote Sensing Help in Detecting the Threats to Archaeological Sites in Upper Egypt? Geosciences 2017, 7, 97. [Google Scholar] [CrossRef] [Green Version]
  9. Dana Negula, I.; Moise, C.; Lazăr, A.M.; Rișcuța, N.C.; Cristescu, C.; Dedulescu, A.L.; Mihalache, C.E.; Badea, A. Satellite Remote Sensing for the Analysis of the Micia and Germisara Archaeological Sites. Remote Sens. 2020, 12, 2003. [Google Scholar] [CrossRef]
  10. Bassier, M.; Vincke, S.; De Lima Hernandez, R.; Vergauwen, M. An Overview of Innovative Heritage Deliverables Based on Remote Sensing Techniques. Remote Sens. 2018, 10, 1607. [Google Scholar] [CrossRef] [Green Version]
  11. Wellmann, T.; Lausch, A.; Andersson, E.; Knapp, S.; Cortinovis, C.; Jache, J.; Scheuer, S.; Kremer, P.; Mascarenhas, A.; Kraemer, R.; et al. Remote sensing in urban planning: Contributions towards ecologically sound policies? Landsc. Urban Plan. 2020, 204, 103921. [Google Scholar] [CrossRef]
  12. Gamba, P.; Dell’Acqua, F.; Dasarathy, B.V. Urban remote sensing using multiple data sets: Past, present, and future. Inf. Fusion 2005, 6, 319–326. [Google Scholar] [CrossRef]
  13. Hadjimitsis, D.; Themistocleous, K.; Ioannides, M. The Use of Satellite Remote Sensing for the Management of Cultural Heritage Sites in Cyprus. In Proceedings of the CIPA 2005 XX International Symposium: International Cooperation to Save the World’s Heritage, Torino, Italy, 26 September–1 October 2005. [Google Scholar]
  14. Bai, X.; Du, P.; Guo, S.; Zhang, P.; Lin, C.; Tang, P.; Zhang, C. Monitoring Land Cover Change and Disturbance of the Mount Wutai World Cultural Landscape Heritage Protected Area, Based on Remote Sensing Time-Series Images from 1987 to 2018. Remote Sens. 2019, 11, 1332. [Google Scholar] [CrossRef] [Green Version]
  15. Elfadaly, A.; Shamseldein, A.; Lasaponara, R. Cultural Heritage Management Using Remote Sensing Data and GIS Techniques around the Archaeological Area of Ancient Jeddah in Jeddah City, Saudi Arabia. Sustainability 2020, 12, 240. [Google Scholar] [CrossRef] [Green Version]
  16. Agapiou, A.; Alexakis, D.; Lysandrou, V.; Sarris, A.; Cuca, B.; Themistocleous, K.; Hadjimitsis, D. Impact of urban sprawl to cultural heritage monuments: The case study of Paphos area in Cyprus. J. Cult. Herit. 2015, 16, 671–680. [Google Scholar] [CrossRef]
  17. Cieślak, I.; Biłozor, A.; Szuniewicz, K. The Use of the CORINE Land Cover (CLC) Database for Analyzing Urban Sprawl. Remote Sens. 2020, 12, 282. [Google Scholar] [CrossRef] [Green Version]
  18. Tang, P.; Chen, F.; Zhu, X.; Zhou, W. Monitoring Cultural Heritage Sites with Advanced Multi-Temporal InSAR Technique: The Case Study of the Summer Palace. Remote Sens. 2016, 8, 432. [Google Scholar] [CrossRef] [Green Version]
  19. Zhou, W.; Chen, F.; Guo, H. Differential Radar Interferometry for Structural and Ground Deformation Monitoring: A New Tool for the Conservation and Sustainability of Cultural Heritage Sites. Sustainability 2015, 7, 1712–1729. [Google Scholar] [CrossRef] [Green Version]
  20. Nolesini, T.; Frodella, W.; Bianchini, S.; Casagli, N. Detecting Slope and Urban Potential Unstable Areas by Means of Multi-Platform Remote Sensing Techniques: The Volterra (Italy) Case Study. Remote Sens. 2016, 8, 746. [Google Scholar] [CrossRef] [Green Version]
  21. Cigna, F.; Lasaponara, R.; Masini, N.; Milillo, P.; Tapete, D. Persistent Scatterer Interferometry Processing of COSMO-SkyMed StripMap HIMAGE Time Series to Depict Deformation of the Historic Centre of Rome, Italy. Remote Sens. 2014, 6, 12593–12618. [Google Scholar] [CrossRef] [Green Version]
  22. Tapete, D.; Cigna, F. COSMO-SkyMed SAR for Detection and Monitoring of Archaeological and Cultural Heritage Sites. Remote Sens. 2019, 11, 1326. [Google Scholar] [CrossRef] [Green Version]
  23. European Commission. Copernicus Services in Support to Cultural Heritage; Publications Office of the European Union: Luxembourg, 2019. [Google Scholar] [CrossRef]
  24. UNESCO. About World Heritage. List of Factors Affecting the Properties. Available online: https://whc.unesco.org/en/factors/ (accessed on 23 January 2021).
  25. Alba Iulia City Hall. Historic Buildings. Available online: https://www.apulum.ro/index.php/patrimoniu/oras (accessed on 23 January 2021).
  26. Moga, V.; Ciugudean, H. (Eds.) Repertoriul Arheologic al Județului Alba; Muzeul National al Unirii: Alba Iulia, Romania, 1995; Volume 2, pp. 29, 36. [Google Scholar]
  27. Berciu, I. Importanța complexului neolitic “Lumea Nouă” în lumina noilor săpături (1961–1963). Apulum 1968, VII/1, 53–60. [Google Scholar]
  28. Macrea, M. Viața în Dacia romană; Editura Științifică: Bucharest, Romania, 1969; pp. 64, 125. [Google Scholar]
  29. Anghel, G. Alba Iulia din secolul al IX-lea și până la mijlocul secolului al XIII-lea. In Alba Iulia 2000; Muzeul National al Unirii: Alba Iulia, Romania, 1975; pp. 115–116. [Google Scholar]
  30. Pascu, Ș. Semnificațiile unor recente descoperiri arheologice. Voievodatul Românesc al Albei. Magazin Istoric 1981, XV/9, 14–18. [Google Scholar]
  31. Rusu, A.A. Alba Iulia. Între Fondarea Eparhiei și Capitala Principatului Transilvaniei; Editura Haco International: Ghimbav, Romania, 2009; pp. 48, 57, 83–95, 111. [Google Scholar]
  32. Anghel, G. Alba Iulia—Prima capitală a celor trei țări române unite sub Mihai Viteazul. In Alba Iulia 2000; Muzeul National al Unirii: Alba Iulia, Romania, 1975; pp. 154–165. [Google Scholar]
  33. Oberländer-Târnoveanu, E.; Ilie, C.C. 90 de Ani de la Încoronarea de la Alba Iulia; Editura Cetatea de Scaun: Suceava, Romania, 2012. [Google Scholar]
  34. Moga, V. Din Istoria Militară a Daciei Romane: Legiunea XIII Gemina; Editura Dacia: Cluj-Napoca, Romania, 1985; pp. 34–40. [Google Scholar]
  35. Moga, V. Apulum, Porta principalis dextra a castrului Legiunii XIII Gemina. In Bibliotheca Musei Apulensis; Muzeul National al Unirii: Alba Iulia, Romania, 1999; Volume XII, pp. 15, 19. [Google Scholar]
  36. Gudea, N.; Inel, C.; Oargă, O. The Roman Camp of Apulum. Archaeological Research in the Principia. In LIMES XXII, Proceedings of the 22nd International Congress of Roman Frontier Studies Ruse, Bulgaria, Sofia, Bulgaria, 6–11 September 2012; National Archaeological Institute with Museum: Sofia, Bulgaria, 2012; pp. 236–237, 239, 240. [Google Scholar]
  37. Goronea, T. Fortificația Bastionară de tip Vauban de la Alba Iulia (Prima Jumătate a Secolului al XVIII-Lea); Editura Aeternitas: Alba Iulia, Romania, 2007; pp. 9–75. [Google Scholar]
  38. Sabău, N.; Fleșer, G. Sculptura barocă a cetății din Alba Iulia. Anu. Inst. Istor. Arheol. Cluj-Napoca 1980, XXIII, 122–186. [Google Scholar]
  39. Fleșer, G. Alba Iulia: O istorie Urbană Ilustrată; Editura Haco International: Ghimbav, Romania, 2008; pp. 23, 97–98. [Google Scholar]
  40. Rustoiu, I.; Cutean, S.; Cristea, M.; Giurgiu, D. Regii României Mari la Alba Iulia; Editura Cognitiv: Alba Iulia, Romania, 2019; pp. 12–24. [Google Scholar]
  41. Moga, V. Catedrala Încoronării. In Alba Iulia. Memoria Urbis; Editura Mega: Cluj-Napoca, Romania, 2018; pp. 317–321. [Google Scholar]
  42. Cornescu, R. (Ed.) Arh. Victor Stephănescu între Stilul Național și Modernism; Fundației “Andrei Șaguna”: Constanta, Romania, 2018; p. 109. [Google Scholar]
  43. Fleșer, G. Cetatea Alba Iulia: Edificii Istorice și Amenajări Urbanistice; Editura Altip: Alba Iulia, Romania, 2006; pp. 40, 41, 56. [Google Scholar]
  44. Anghel, G. Alba Iulia în secolul al XVIII-lea. Schimbarea vetrei oraşului medieval. In Historia Urbana; Editura Academiei Române: Sibiu, Romania, 1996; Volume 1–2, pp. 64–74. [Google Scholar]
  45. Anghel, G. Despre evoluţia teritorială a oraşului antic, medieval şi modern Alba Iulia. Apulum 1994, XXXI, 293–302. [Google Scholar]
  46. USGS. Earth Explorer. Available online: https://earthexplorer.usgs.gov/ (accessed on 23 January 2021).
  47. Copernicus. Copernicus Open Access Hub. Available online: https://scihub.copernicus.eu/ (accessed on 23 January 2021).
  48. Haas, J. Remote Sensing of Urbanization and Environmental Impacts. Ph.D. Thesis, Royal Institute of Technology (KTH), Stockholm, Sweden, February 2016. [Google Scholar]
  49. Land Monitoring Service. Copernicus: Europe’s Eyes on Earth. Available online: https://land.copernicus.eu/ (accessed on 23 January 2021).
  50. Land Monitoring Service. Copernicus: Europe’s Eyes on Earth. CORINE Land Cover. Available online: https://land.copernicus.eu/pan-european/corine-land-cover (accessed on 23 January 2021).
  51. Burghila, C.; Cimpeanu, S.M.; Badea, A. Main Framework and Indicators Used in Mapping and Assessment of Ecosystem Services for the EU Biodiversity Strategy Up to 2020. Sci. Pap. Ser. E Land Reclam. Earth Obs. Surv. Environ. Eng. 2017, VI, 155–162. [Google Scholar]
  52. Land Monitoring Service. Copernicus: Europe’s Eyes on Earth. Urban Atlas. Available online: https://land.copernicus.eu/local/urban-atlas (accessed on 23 January 2021).
  53. Johnson, B.A.; Iizuka, K. Integrating OpenStreetMap crowdsourced data and Landsat time-series imagery for rapid land use/land cover (LULC) mapping: Case study of the Laguna de Bay area of the Philippines. Appl. Geogr. 2016, 67, 140–149. [Google Scholar] [CrossRef]
  54. Lasaponara, R.; Elfadaly, A.; Attia, W. Low cost space technologies for operational change detection monitoring around the archaeological area of Esna-Egypt. In Lecture Notes in Computer Science, Proceedings of the Computational Science and Its Applications–ICCSA 2016, Beijing, China, 4–7 July 2016; Gervasi, O., Murgante, B., Misra, S., Rocha, A.M.A.C., Torre, C.M., Taniar, D., Apduhan, B.O., Stankova, E., Wang, S., Eds.; Springer: Cham, Germany, 2016; Volume 9787. [Google Scholar] [CrossRef]
  55. Lasaponara, R.; Leucci, G.; Masini, N.; Persico, R.; Scardozzi, G. Towards an operative use of remote sensing for exploring the past using satellite data: The case study of Hierapolis (Turkey). Remote Sens. Environ. 2016, 174, 148–164. [Google Scholar] [CrossRef] [Green Version]
  56. Mustapha, M.R.; Lim, H.S.; Mat Jafri, M.Z. Comparison of Neural Network and Maximum Likelihood Approaches in Image Classification. J. Appl. Sci. 2010, 10, 2847–2854. [Google Scholar] [CrossRef] [Green Version]
  57. Mohd Hasmadi, I.; Pakhriazad, H.Z.; Shahrin, M.F. Evaluating supervised and unsupervised techniques for land cover mapping using remote sensing data. Geogr. Malays. J. Soc. Space 2009, 5, 1–10. [Google Scholar]
  58. Voogt, J.A.; Oke, T.R. Thermal remote sensing of urban climates. Remote Sens. Environ. 2003, 86, 370–384. [Google Scholar] [CrossRef]
  59. Tebaldi, C.; Hayhoe, K.; Arblaster, J.M.; Meehl, G.A. Going to the extremes: An intercomparison of mode-simulated historical and future changes in extreme events. Clim. Chang. 2006, 79, 185–211. [Google Scholar] [CrossRef]
  60. Miky, Y.H. Remote sensing analysis for surface urban heat island detection over Jeddah, Saudi Arabia. Appl. Geomat. 2019, 11, 243–258. [Google Scholar] [CrossRef]
  61. Ferretti, A.; Prati, C.; Rocca, F.L. Permanent Scatterers in SAR Interferometry. IEEE Trans. Geosci. Remote Sens. 2001, 39, 8–20. [Google Scholar] [CrossRef]
  62. Tofani, V.; Raspini, F.; Catani, F.; Casagli, N. Persistent Scatterer Interferometry (PSI) Technique for Landslide Characterization and Monitoring. Remote Sens. 2013, 5, 1045–1065. [Google Scholar] [CrossRef] [Green Version]
  63. Vassileva, M.; Tonolo, F.G.; Riccardi, P.; Lecci, D.; Boccardo, P.; Chiesa, G. Satellite SAR Interferometric Techniques in Support to Emergency Mapping. Eur. J. Remote Sens. 2017, 50, 464–477. [Google Scholar] [CrossRef] [Green Version]
  64. Fiaschi, S.; Holohan, E.P.; Sheehy, M.; Floris, M. PS-InSAR Analysis of Sentinel-1 Data for Detecting Ground Motion in Temperate Oceanic Climate Zones: A Case Study in the Republic of Ireland. Remote Sens. 2019, 11, 348. [Google Scholar] [CrossRef] [Green Version]
  65. Shirani, K.; Pasandi, M. Detecting and Monitoring of Landslides Using Persistent Scattering Synthetic Aperture Radar Interferometry. Environ. Earth Sci. 2019, 78, 1–24. [Google Scholar] [CrossRef]
  66. Wempen, J.M. Application of DInSAR for Short Period Monitoring of Initial Subsidence Due to Longwall Mining in the Mountain West United States. Int. J. Min. Sci. Technol. 2020, 30, 33–37. [Google Scholar] [CrossRef]
  67. Gaber, A.; Darwish, N.; Koch, M. Minimizing the Residual Topography Effect on Interferograms to Improve DInSAR Results: Estimating Land Subsidence in Port-Said City, Egypt. Remote Sens. 2017, 9, 752. [Google Scholar] [CrossRef] [Green Version]
  68. Drahor, M.G. A review of integrated geophysical investigations from archaeological and cultural sites under encroaching urbanisation in İzmir, Turkey. Phys. Chem. Earth 2011, 36, 1294–1309. [Google Scholar] [CrossRef]
  69. Araboaei, L.; Araboaei, M. Schimbări geografice în perioada tranziției și problemele municipiului Alba Iulia în raport cu rolul și poziția în rețeaua urbană actuală. Pangeea 2014, 14, 70–80. [Google Scholar]
  70. Elfadaly, A.; Attia, W.; Qelichi, M.M.; Murgante, B.; Lasaponara, R. Management of Cultural Heritage Sites Using Remote Sensing Indices and Spatial Analysis Techniques. Surv. Geophys. 2018, 39, 1347–1377. [Google Scholar] [CrossRef]
  71. Hinkle, D.E.; Wiersma, W.; Jurs, S.G. Applied Statistics for the Behavioral Sciences, 5th ed.; Publisher Houghton Mifflin Co.: Boston, MA, USA, 2003. [Google Scholar]
  72. Saito, K.; Said, I.; Shinozaki, M. Evidence-based neighborhood greening and concomitant improvement of urban heat environment in the context of a world heritage site—Malacca, Malaysia. Comput. Environ. Urban Syst. 2017, 64, 356–372. [Google Scholar] [CrossRef]
  73. Caneva, G. A botanical approach to the planning of archeological, parks in Italy. Conserv. Manag. Archeol. Sites 1999, 3, 127–134. [Google Scholar] [CrossRef]
  74. Guzman, P.; Pereira Roders, A.R.; Colenbrander, B. Impacts of Common Urban Development Factors on Cultural Conservation in World Heritage Cities: An Indicators-Based Analysis. Sustainability 2018, 10, 853. [Google Scholar] [CrossRef] [Green Version]
  75. Guzman, P.; Pereira Roders, A.R. Bridging the Gap between Urban Development and Cultural Heritage Protection. In Proceedings of the 34th Annual Conference of the International Association for Impact Assessment, Vina del Mar, Chile, 8–11 April 2014; pp. 1–6. [Google Scholar]
  76. Udeaja, C.; Trillo, C.; Awuah, K.G.B.; Makore, B.C.N.; Patel, D.A.; Mansuri, L.E.; Jha, K.N. Urban Heritage Conservation and Rapid Urbanization: Insights from Surat, India. Sustainability 2020, 12, 2172. [Google Scholar] [CrossRef] [Green Version]
  77. ESA. Applications—Sentinel-5P Brings Air Pollution into Focus. Available online: https://www.esa.int/Applications/Observing_the_Earth/Copernicus/Sentinel-5P/Sentinel-5P_brings_air_pollution_into_focus (accessed on 23 January 2021).
  78. United Nations. Sustainable Development Goals. Available online: https://www.un.org/sustainabledevelopment/sustainable-development-goals/ (accessed on 23 January 2021).
Figure 1. Orthophoto image of Alba Iulia City (© image source: Romanian National Agency for Cadaster and Real Estate Advertising (ANCPI) geoportal—https://geoportal.ancpi.ro/). The seven-point star-shaped medieval citadel represents a unique Transylvanian landmark.
Sustainability 13 01406 g001
Figure 2. Location of Alba Iulia city in the central-western part of Romania (© image data source: OpenStreetMap—OSM, geo-spatial.org, Shuttle Radar Topography Mission Digital Elevation Model (SRTM DEM) courtesy of the United States Geological Survey (USGS)).
Sustainability 13 01406 g002
Figure 3. Alba Iulia: (a) via principalis and (b) principia (© image source: the personal photo archive of G. Rustoiu).
Sustainability 13 01406 g003
Figure 4. Alba Iulia: (a) the third gate of the fortress and (b) Coronation Cathedral (© image source: personal photo archive of G. Rustoiu).
Sustainability 13 01406 g004
Figure 5. Urban Heat Island assessment workflow.
Sustainability 13 01406 g005
Figure 6. Land cover classification of satellite imagery from 1988 and 1992.
Sustainability 13 01406 g006
Figure 7. Land cover classification of satellite imagery from 1996 and 2000.
Sustainability 13 01406 g007
Figure 8. Land cover classification of satellite imagery from 2004 and 2006.
Sustainability 13 01406 g008
Figure 9. Land cover classification of satellite imagery from 2012 and 2018.
Sustainability 13 01406 g009
Figure 10. Percentage distribution of the land cover classes (investigated time frame: 1988–2018).
Sustainability 13 01406 g010
Figure 11. Evolution of the land cover classes according to the supervised classification and CORINE Land Cover (in 2000, 2006, 2012, and 2018).
Sustainability 13 01406 g011
Figure 12. Distribution of urban changes in the Alba Iulia territorial administrative unit between 2006 and 2018.
Sustainability 13 01406 g012
Figure 13. Evolution of Alba Iulia city limits over the investigated time frame (1994–2018); background satellite image: Sentinel-2 (© European Space Agency).
Sustainability 13 01406 g013
Figure 14. Average temperatures of the UHI during the study period (1988–2019); background satellite image: Sentinel-2 (© European Space Agency).
Sustainability 13 01406 g014
Figure 15. Temperature trend inside Alba Iulia city.
Sustainability 13 01406 g015
Figure 16. Temperature trend inside Alba Iulia Fortress.
Sustainability 13 01406 g016
Figure 17. Correlation between temperatures within Alba Iulia city and Alba Iulia Fortress.
Sustainability 13 01406 g017
Figure 18. Correlation between the Landsat brightness temperatures and the in situ measurements (1988–2019).
Sustainability 13 01406 g018
Figure 19. The vertical displacement map obtained from Sentinel-1A data (© background data source: OSM).
Sustainability 13 01406 g019
Figure 20. The vertical displacement map obtained from Sentinel-1B data (© background data source: OSM).
Sustainability 13 01406 g020
Figure 21. The subsidence areas within the district affected by high groundwater levels: (Left) the vertical displacement map obtained from Sentinel-1A/B (© background data source: OSM) and (Right) urban development evolution of Alba Iulia city after 1700 (© [44]). As previously mentioned, PS-InSAR enables the assessment of the structural preservation state also at the individual building level.
Sustainability 13 01406 g021
Figure 22. Coronation Cathedral vertical displacement velocity map obtained from Sentinel-1A/B (color symbols as above figures; © background data source: Google 2020).
Sustainability 13 01406 g022
Figure 23. Relevance of the satellite-derived urban development multifaceted analysis in the context of cultural heritage management.
Sustainability 13 01406 g023
Table 1. Error matrix and the overall accuracy calculated for each classified image.
Land cover classesReference Data Land cover classesReference Data
Arable landBuilt-up areasForestGrasslandWater coursesArable landBuilt-up areasForestGrasslandWater courses
Classified Data1988Arable land492060Classified Data2004Arable land520030
Built-up areas338000Built-up areas259000
Forest004600Forest005700
Grassland000320Grassland600500
Water courses000029Water courses000040
Overall accuracy94.63Overall accuracy95.91
Land cover classesArable landBuilt-up areasForestGrasslandWater courses Land cover classesArable landBuilt-up areasForestGrasslandWater courses
Classified Data1992Arable land5940100Classified Data2006Arable land440040
Built-up areas050000Built-up areas058000
Forest004800Forest006400
Grassland300360Grassland500460
Water courses000035Water courses000031
Overall accuracy93.06Overall accuracy96.43
Land cover classesArable landBuilt-up areasForestGrasslandWater courses Land cover classesArable landBuilt-up areasForestGrasslandWater courses
Classified Data1996Arable land392180Classified Data2012Arable land390020
Built-up areas042000Built-up areas132001
Forest004400Forest005600
Grassland200310Grassland600330
Water courses000031Water courses000031
Overall accuracy93.5Overall accuracy95.02
Land cover classesArable landBuilt-up areasForestGrasslandWater courses Land cover classesArable landBuilt-up areasForestGrasslandWater courses
Classified Data2000Arable land3920100Classified Data2018Arable land160000
Built-up areas045000Built-up areas125015
Forest006100Forest004100
Grassland200330Grassland000160
Water courses000031Water courses000020
Overall accuracy93.72Overall accuracy94.40
Total overall accuracy94.59
Publisher’s Note: MDPI stays neutral with regard to jurisdictional claims in published maps and institutional affiliations.

