Article

Soil Structure Stability under Different Land Uses in Association with Polyacrylamide Effects

1
Arid Land Research Center, Faculty of Agriculture, Tottori University, Tottori 668-0001, Japan
2
International Platform for Dryland Research and Education, Tottori University, Tottori 668-0001, Japan
3
The United Graduate School of Agricultural Sciences, Tottori University, Tottori 680-8553, Japan
4
College of Agriculture & Environmental Sciences, Bahir Dar University, Bahir Dar P.O. Box 1289, Ethiopia
5
Institute of Soil, Water and Environmental Sciences, ARO, Rishon LeZion 7505101, Israel
*
Author to whom correspondence should be addressed.
Sustainability 2021, 13(3), 1407; https://doi.org/10.3390/su13031407
Submission received: 1 January 2021 / Revised: 22 January 2021 / Accepted: 26 January 2021 / Published: 29 January 2021
(This article belongs to the Special Issue Soil Erosion and Sustainable Land Management (SLM))

Abstract

:
Soil structural stability is a vital aspect of soil quality and functions, and of maintaining sustainable land management. The objective of this study was to compare the contribution of four long-term land-use systems (crop, bush, grass, and forest) coupled with anionic polyacrylamide (PAM = 0, 25, and 200 mg L−1) application on the structural stability of soils in three watersheds of Ethiopia varying in elevation. Effect of treatments on soil structural stability indices were assessed using the high energy moisture characteristic (HEMC, 0–50 hPa) method, which provides (i) water retention model parameters α and n, and (ii) soil structure index (SI). Soil (watershed), land use and PAM treatments had significant effects on the shape of the water retention curves (α, n) and SI, with diverse changes in the macropore sizes (60–250; >250 μm). Soil organic carbon (SOC) content and SI were strongly related to soil pH, CaCO3 soil type-clay mineralogy, exchangeable Ca2+, and Na+ (negatively). The order of soil SI (0.013–0.064 hPa−1) and SOC (1.4–8.1%) by land use was similar (forest > grass > bush > cropland). PAM effect on increasing soil SI (1.2–2.0 times), was inversely related to SOC content, being also pronounced in soils from watersheds of low (Vertisol) and medium (Luvisol) elevation, and the cropland soil from high (Acrisol) elevation. Treating cropland soils with a high PAM rate yielded greater SI (0.028–0.042 hPa−1) than untreated bush- and grassland soils (0.021–0.033 hPa−1). For sustainable management and faster improvement in soil physical quality, soil properties, and land-use history should be considered together with PAM application.

1. Introduction

1.1. Soil Structure Stability and Its Importance

Soil structure and aggregation are central physical properties of soil that control a wide array of soil properties and functions including water retention and infiltration [1], susceptibility to erosion and the movement of associated contaminants [2], aeration, gaseous exchanges, and greenhouse gas emission [3], C sequestration, soil organic carbon (SOC) protection [4], soil organic matter mineralization [5], and biogeochemical cycling of essential elements such as macro- and micronutrients [6]. Hence, monitoring of soil structure and stability is vital in determining the sustainability of land use and management practices in both agricultural and natural ecosystems [7].
In Ethiopian highlands, like to similar regions, soils under long-term grassland and forest may contain higher levels of SOC content, which is characterized by persistent particulate and mineral-associated fractions, enhanced microbial activity, and a positive C balance [8]. All those, in turn, may improve soil hydraulic properties, and yield a better soil structure with a heterogenic aggregate and pore size distribution (PSD), compared with soils under long-term cropping, where soil structure is substantially modified by soil management [9,10]. Changing land use from grassland or forest to cropland significantly impacts soil quality, decreases SOC, and negatively affects soil functions such as soil aggregation and gas exchange, water and nutrients availability, and plant growth [7,11,12]. Restoring good soil structure and the proper functioning of degraded cropland soils, by using traditional conservation measures such as no-till practices, are highly dependent on climate and soil type, and texture, and may take over 20–40 years; yet significant positive trends could be noted already after 5–10 years of conversion of cropped land to grassland [12,13,14,15,16].

1.2. Ethiopian Highland Soils: Land Use and Soil Degradation

The Ethiopian highlands, an important region of natural biodiversity and agriculture production, are characterized by high erosion rates (interrill, rill, and gully, >40 t ha−1) and of CO2 efflux, and the deterioration of soil hydrological characteristics and cycles. The issue of land degradation is further complicated by global climate change associated with monsoon–type behavior, delivering significant June–September rainfall and flooding, that turn the soil resources vulnerable to physical and chemical degradation [17,18]. Sustainable watershed management and regreening projects (e.g., conservation systems, building terraces, the establishment of agroforestry), promoted by the Ethiopian government about 20 years ago, have led to satisfactorily integrated sustainable land management and livelihoods activities. Yet, erosion in many areas remains challenging. Moreover, the predicted changes in climate and land use indicate great variability and high levels of erosion rates in the upstream areas and increasing sediment loads in the Blue Nile [19].
Numerous studies in natural and farmed field plots in Ethiopian watersheds, on the impacts of short- and long-term land use and management (e.g., agroforest, grass, and croplands), and conservation measures (e.g., soil bunds by grass, use of enclosure, restrained grazing) on the improvement of soil quality, have recently been performed. The results for SOC, cation exchange capacity (CEC), exchangeable cations (Ca2+, Mg2+, Na+), pH, and available nutrients (P and K), soil microbial activity, aggregate stability, crop productivity, and erosion, showed that the efficiency of change in land use and implementation of conservation practices were related to the prevailing agro-ecology and the nature and duration of the used conservation measures [20,21]. Results of these local studies were in line with results from international ones [11,14,15,16,22]. Moreover, the decline in soil quality by land-use change and under high rain intensity, were related to CEC and clay depletion, translocation and leaching or losses of particulate and dissolved organic matter by runoff and erosion, and clogging of subsoil macropores by the suspended clay-size material. Heavy rains may also cause soil-saturation-related runoff and subsequent shallow lateral flow that increases the loss of fine particles from diverse land uses [8,23,24].

1.3. Polyacrylamide (PAM) as a Soil Stabilizing Agent

The future of sustainable land management should be based on appropriate practices under different land-use types, which allow the existence of agricultural production in balance with crop and soil systems to support adequate drainage capacity and soil quality [12]. It should be noted that, despite its importance, the contribution of land use, conservation measures, and amendments (e.g., polyacrylamide, lime, manure, biochar) on soil hydraulic properties (water retention, saturated-unsaturated hydraulic conductivity, effective porosity, infiltration rate) and structure stability of Ethiopian soils, has received merely limited attention [25,26,27].
Application of polyacrylamide (PAM) can considerably (i) enhance soil structure, pore continuity, and aeration via binding of soil particles and eliminating loss of clay particles [28], (ii) sustain SOC accumulation through increasing microbial activity, protecting of SOC in macro- and micro-aggregates, and slowing down of residue decomposition and mineralization rate [29,30], (iii) increase SOC accumulation in subsurface soil layers by providing an appropriate medium for the growth of plants (root penetration, uptake of water and nutrients) [31,32], and (iv) mitigate on-site and off-site impacts of erosion by decreasing runoff generation and erosion rate. PAM addition can, therefore, control the quality of water in various land use areas and could be used for restoring marginal, grass, and forest land [33,34].
Recent studies also revealed that application of PAM could improve soil structure stability and protect SOC, and increase the diversity of soil bacterial communities by increasing soil moisture content and regulating the C to N ratio, regardless of soil with and without plants [35,36]. Therefore, it is expected that PAM application to the Ethiopian highland soils could improve soil structure stability that in turn may facilitate SOC protection [32] and possibly increase SOC storage. It is further anticipated that the use of PAM could replace, at least partly, traditional conservation measures, which often include high-cost conservation practices whose impact may emerge only after 3–4 decades [13,16]. The objective of this study was, therefore, to compare the contribution of four long-term land-use systems (crop, bush, grass, and forest) resulting in significantly varying soil properties and SOC content, with and without anionic PAM application, on structure stability of soils in three watersheds of Ethiopian highlands varying in elevation level.

2. Materials and Methods

2.1. Study Area and Soil Sampling

The Upper Blue Nile basin of Ethiopia is characterized by a monsoon climate with a dry (November to April) and a wet (May to October) season, with >80% of the annual precipitation occurring from June to September. Three watersheds in this basin, Guder, Abagerima, and Dibatie, differing in soils, elevation (2500–2900, 1900–2100, and 1500–1700 m), mean annual rainfall (2450, 1340, and 1020 mm), and temperature (19, 23, and 24 °C), respectively, represent three different agro-ecological zones, that should be considered for sustainable land management [37]. At these three watersheds, livestock types are similar, and croplands occupy a larger percentage of the area than grazing, bushlands, and forest [37]. In Guder, soil type was Acrisol (Alfisol/Ultisol by US taxonomy) with an acidic reaction, and mixed clay mineralogy with a high content of kaolinite (and Fe, Al oxides), and a small fraction of smectite. In Abagerima, the soil type was Luvisol (Cambisol/Alfisol by US taxonomy) with an acidic reaction and mixed kaolinite-smectite clay mineralogy. In Dibatie, the soil type was Vertisol with a slightly acidic reaction and predominantly smectite clay mineralogy. The parent material of the studied area is related to volcanic rocks (e.g., mainly basalt, then rhyolite, tuff, ignimbrites). Both Acrisol and Luvisol develop agric horizons resulting from clay dispersion, transport, and accumulation [23,38].
Soil samples (0–15 cm) were collected from experimental field plots (~0.1–0.2 ha) located in each of the three watersheds. The plots were placed in four long-term land-use systems (cropland, degraded bushland, grassland for grazing, and forest, hereafter referred to as crop, grass, bush, and forest land) that exhibited varying soil properties, including significantly differing SOC contents (Table 1). In each of the 12 sites (3 watersheds × 4 land uses), three randomized samples (used as replicates), each of ~0.5 kg were taken from the same experimental plot, using a soil probe sampler. The samples were brought to the laboratory, air dried, and ground to pass through a 2-mm sieve and then analyzed. The soils were characterized for (i) electrical conductivity (EC) and pH in a 1:2.5 soil:water extraction; (ii) particle size distribution using the hydrometer method, (iii) cation exchange capacity by sodium acetate, (iv) exchangeable cations by ammonium acetate, (v) calcium carbonate content using the volumetric calcimeter method, and (vi) organic matter content by wet combustion [39]. The determined properties of the soils are presented in Table 1. Also, aggregate separation to group sizes of 0.5–1.0 mm by dry sieving was done for HEMC measurement, and <0.25 mm by wet sieving was performed for SOC determination in micro-aggregates to be compared with SOC of bulk soil (<2 mm) [39].

2.2. Preparation of PAM-Treated Soil Aggregates

Treating aggregates with PAM solution (0, 25, and 200 mg L−1) was conducted in accordance with the procedure detailed in Mamedov et al. (2010) [40]. The tested PAM concentration were based on previous relevant studies, where various PAM rates were used to understand the mechanism of soil structure stabilization, and to evaluate a strategy of PAM application along with other conservation measures [32,33,34]. An anionic PAM of high molecular weight (~18 × 106 Da) and 30% hydrolysis with a trading name of Superfloc A–110 (Kemira, Lakeland, Florida, USA) was used. Solutions of 25 and 200 mg L−1 PAM were prepared with tap water (electrical conductivity, [EC] = 0.4 dS m−1, sodium adsorption ratio, [SAR] of = 1.2 [mmolc/L]0.5, and pH = 6.5) under constant stirring and slow addition of PAM granules over 4 h. Plastic boxes (30 × 60 × 3 cm) were filled with very coarse sand to form a 5-mm thick layer that was then covered with a high porosity (>100 μm pore size) filter paper allowing PAM molecules to diffuse to the aggregates from the coarse sand layer. Aggregates (0.5–1.0 mm) from a given soil sample were gently spread on the filter paper to form a monolayer of aggregates, and then saturated from below with 25 or 200 mg L−1 PAM solution for 1 h (at a rate of 4 mm h−1) using a peristaltic pump, and the boxes were then covered and kept in their respective solution for 24 h to reach equilibrium. Thereafter, the boxes were drained and the aggregates were placed in an oven to dry at 60 °C for 24 h, and then the aggregates were sieved to eliminate broken aggregates.

2.3. Determination of Soil Structural Stability Indices

Soil pore size distribution (PSD) and structure stability indices were determined for 108 samples (3 watersheds × 4 land uses × 3 PAM rates × 3 replicates), using the high–energy moisture characteristics (HEMC) method. In the HEMC method, aggregates’ wetting rate is accurately controlled, and energy of hydration, differential swelling, and compression of entrapped air are the main forces responsible for breaking down of aggregates. This method enables the detection of small changes in soil structure and had been successfully applied in the determination of structure stability indices of soils from humid and arid regions with a wide range of stability [41,42].
Briefly, 15 g of aggregates (0.5–1.0 mm) were placed in a 60 mm I.D. funnel with a fritted disc (pore size: 20–40 µm) to form a bed ~5 mm thick with a bulk density of ~1.05 g cm−3. Saturation of the fritted disc was ensured prior to placing aggregates in the funnel. The aggregates were wetted (fast = 100 mm h−1) from the bottom with the deionized water (EC = 0.04 dS m−1) using a peristaltic pump. Then a soil water retention curve (0 to −50 hPa), corresponding to drainable pores of 60 to 2000 µm, using small steps (1–2 hPa), was performed by the hanging column and pipette. Consequently, structure stability indices were then inferred from differences among the water retention and specific water capacity (dθ/dψ) curves (i.e., differences in PSD) of the treatments (Figure 1) by using the modified van Genuchten model [43,44]:
θ   =   θ r + ( θ s θ r )     1 + ( α   ψ ) n   ( 1 / n 1 ) + A ψ 2 + B ψ + C
d θ / d ψ = ( θ s θ r ) 1 + ( α   ψ ) n ( 1 / n 1 ) ( 1 / n 1 ) ( α   ψ ) n n / ψ ( 1 + ( α   ψ ) n ) + 2 A ψ + B
SI = VDP/MS
In Equations (1)–(3), ψ is the matric potential (hPa), θs and θr are pseudo saturated and residual gravimetric water contents, respectively. The parameters α (hPa−1), and n (dimensionless) represent the location of the inflection point and the steepness of the water retention curve, and the reciprocal of α is often equated with the air entry suction; A, B, and C are quadratic terms used to improve the fitting of the model to the water retention curve [43]. Equation (2) is used to determine the volume of drainable pores (VDP, kg kg−1), defined as the integral of the area under the specific water capacity curve (dθ/dψ) and above its baseline; MS (hPa) is the modal suction corresponding to the matric potential at the peak of the specific water capacity curve (Figure 1d) and relates to the most frequent pore size. The SI in Equation (3) is used to evaluate the susceptibility of the tested samples to breakdown; the higher the value of SI the less susceptible the aggregates are to slaking. The coefficient of variation between replicates of water content (θ, kg kg−1) was <5%.

2.4. Statistical Analysis

Analysis of variance (ANOVA) tests were conducted using the SAS Proc GLM procedure [45] to assess the effects of soil type (watershed elevation), land use and PAM treatments and their interactions on soil properties, near saturation water retention curve parameters (α, n), and HEMC stability indices (θs, θr, SI). Treatments mean comparisons were done using the Tukey-Kramer HSD test at p < 0.05 (Supplementary material: Table S1). Pearson pairwise correlation, regression analysis (p < 0.05), and stepwise regression analysis were used to examine the effects of soil properties (e.g., SOC, EC, pH, CEC, cations) on structure stability indices (Table S2).

3. Results

Results of the ANOVA tests revealed that all analyzed soil properties (Table 1), structural stability indices, and parameters (α, n) were significantly (p < 0.001) affected by soil type (watershed elevation), land use, and their interaction (Table S1). The VDP and SI, n and MS were highly correlated [41], and thus we opted to focus the discussion mostly on the SI and the model parameter α in the presented analyses.

3.1. Land Use and Soil Properties

Studying soil properties in different land uses is crucial for understanding the current prevailing conditions in soils from different agro-ecological zones from conservation measures strategy perspective [37,45]. Soil properties showed large variation in pH (5.2–6.7), SOC (1.4–8.1%), cation exchange capacity (CEC, 25–40 cmolckg−1), exchangeable Ca2+ (9.4–16.1 cmolckg−1), soil texture (sandy loam to clay), electrical conductivity (EC, 0.2–0.9 dS m−1), and CaCO3 (0.3–5.8%) (Table 1). Some clear associations of certain soil properties (e.g., SOC, pH, EC), with elevation and land use were noted. Content of SOC was highest and pH was lowest in Guder watershed (highest elevation and rainfall), followed by Abagerima (medium elevation and rainfall) and Dibatie (lowest elevation and rainfall). Differences in soil clay content (texture) were also linked to watersheds: Guder (loam) < Abagerima (clay loam) < Dibatie (clay). The Clay/CEC ratio (i.e., indication of the clay mineralogy [40], also decreased with the increase in elevation: Guder (0.3–0.7) < Abagerima (0.7–0.9) < Dibatie (1.6–2.5) (Table 1). In each watershed, soil pH and SOC were related to land use, and decreased in the following order: Forest > Grass ≥ Bush > Crop. Largely, soil CEC, exchangeable Ca2+ and K+, and EC and CaCO3 were lowest under cropland and highest under forest, grass, or bushland. The changes in exchangeable Mg2+ (3.2–4.5 cmolckg−1) and Na+ (2.4–6.3 cmolckg−1) with variations in land use were not consistent, yet the latter mostly was higher under cropland or bushland (Table 1).
In general, only in 10 out of 85 cases, meaningful correlations (i.e., r ≥ 0.7) were noted among the various soil properties studied (Table 2a). However, in each watershed, strong correlations (50% of cases) between SI or SOC and the mean of soil properties were found (Table 2b). For instance, soil pH or EC were weakly related to SOC and SI (r < 0.3–05) when all samples were involved (Table 2a). Nevertheless, when separating correlation analysis by watersheds, pH was very strongly associated (r > 0.9) with SOC and SI in the acidic Acrisol and Luvisol, and moderately with slightly acidic Vertisol; soil EC was closely related to SOC and SI in Luvisol and Vertisol (r > 0.7–0.9), but not in Acrisol (r < 0.7) (Table 2b). Correlation analysis for all soils studied indicated that exchangeable Ca2+ was closely related to SOC (r = 0.7), while it was not related to CaCO3 content (r = 0.3) (Table 2a). However, analysis for each watershed alone showed better relation between Ca2+ and CaCO3 (r = 0.5–0.6) (Table S2).

3.2. Water Retention and Structure Stability of Untreated and PAM-Treated Soils

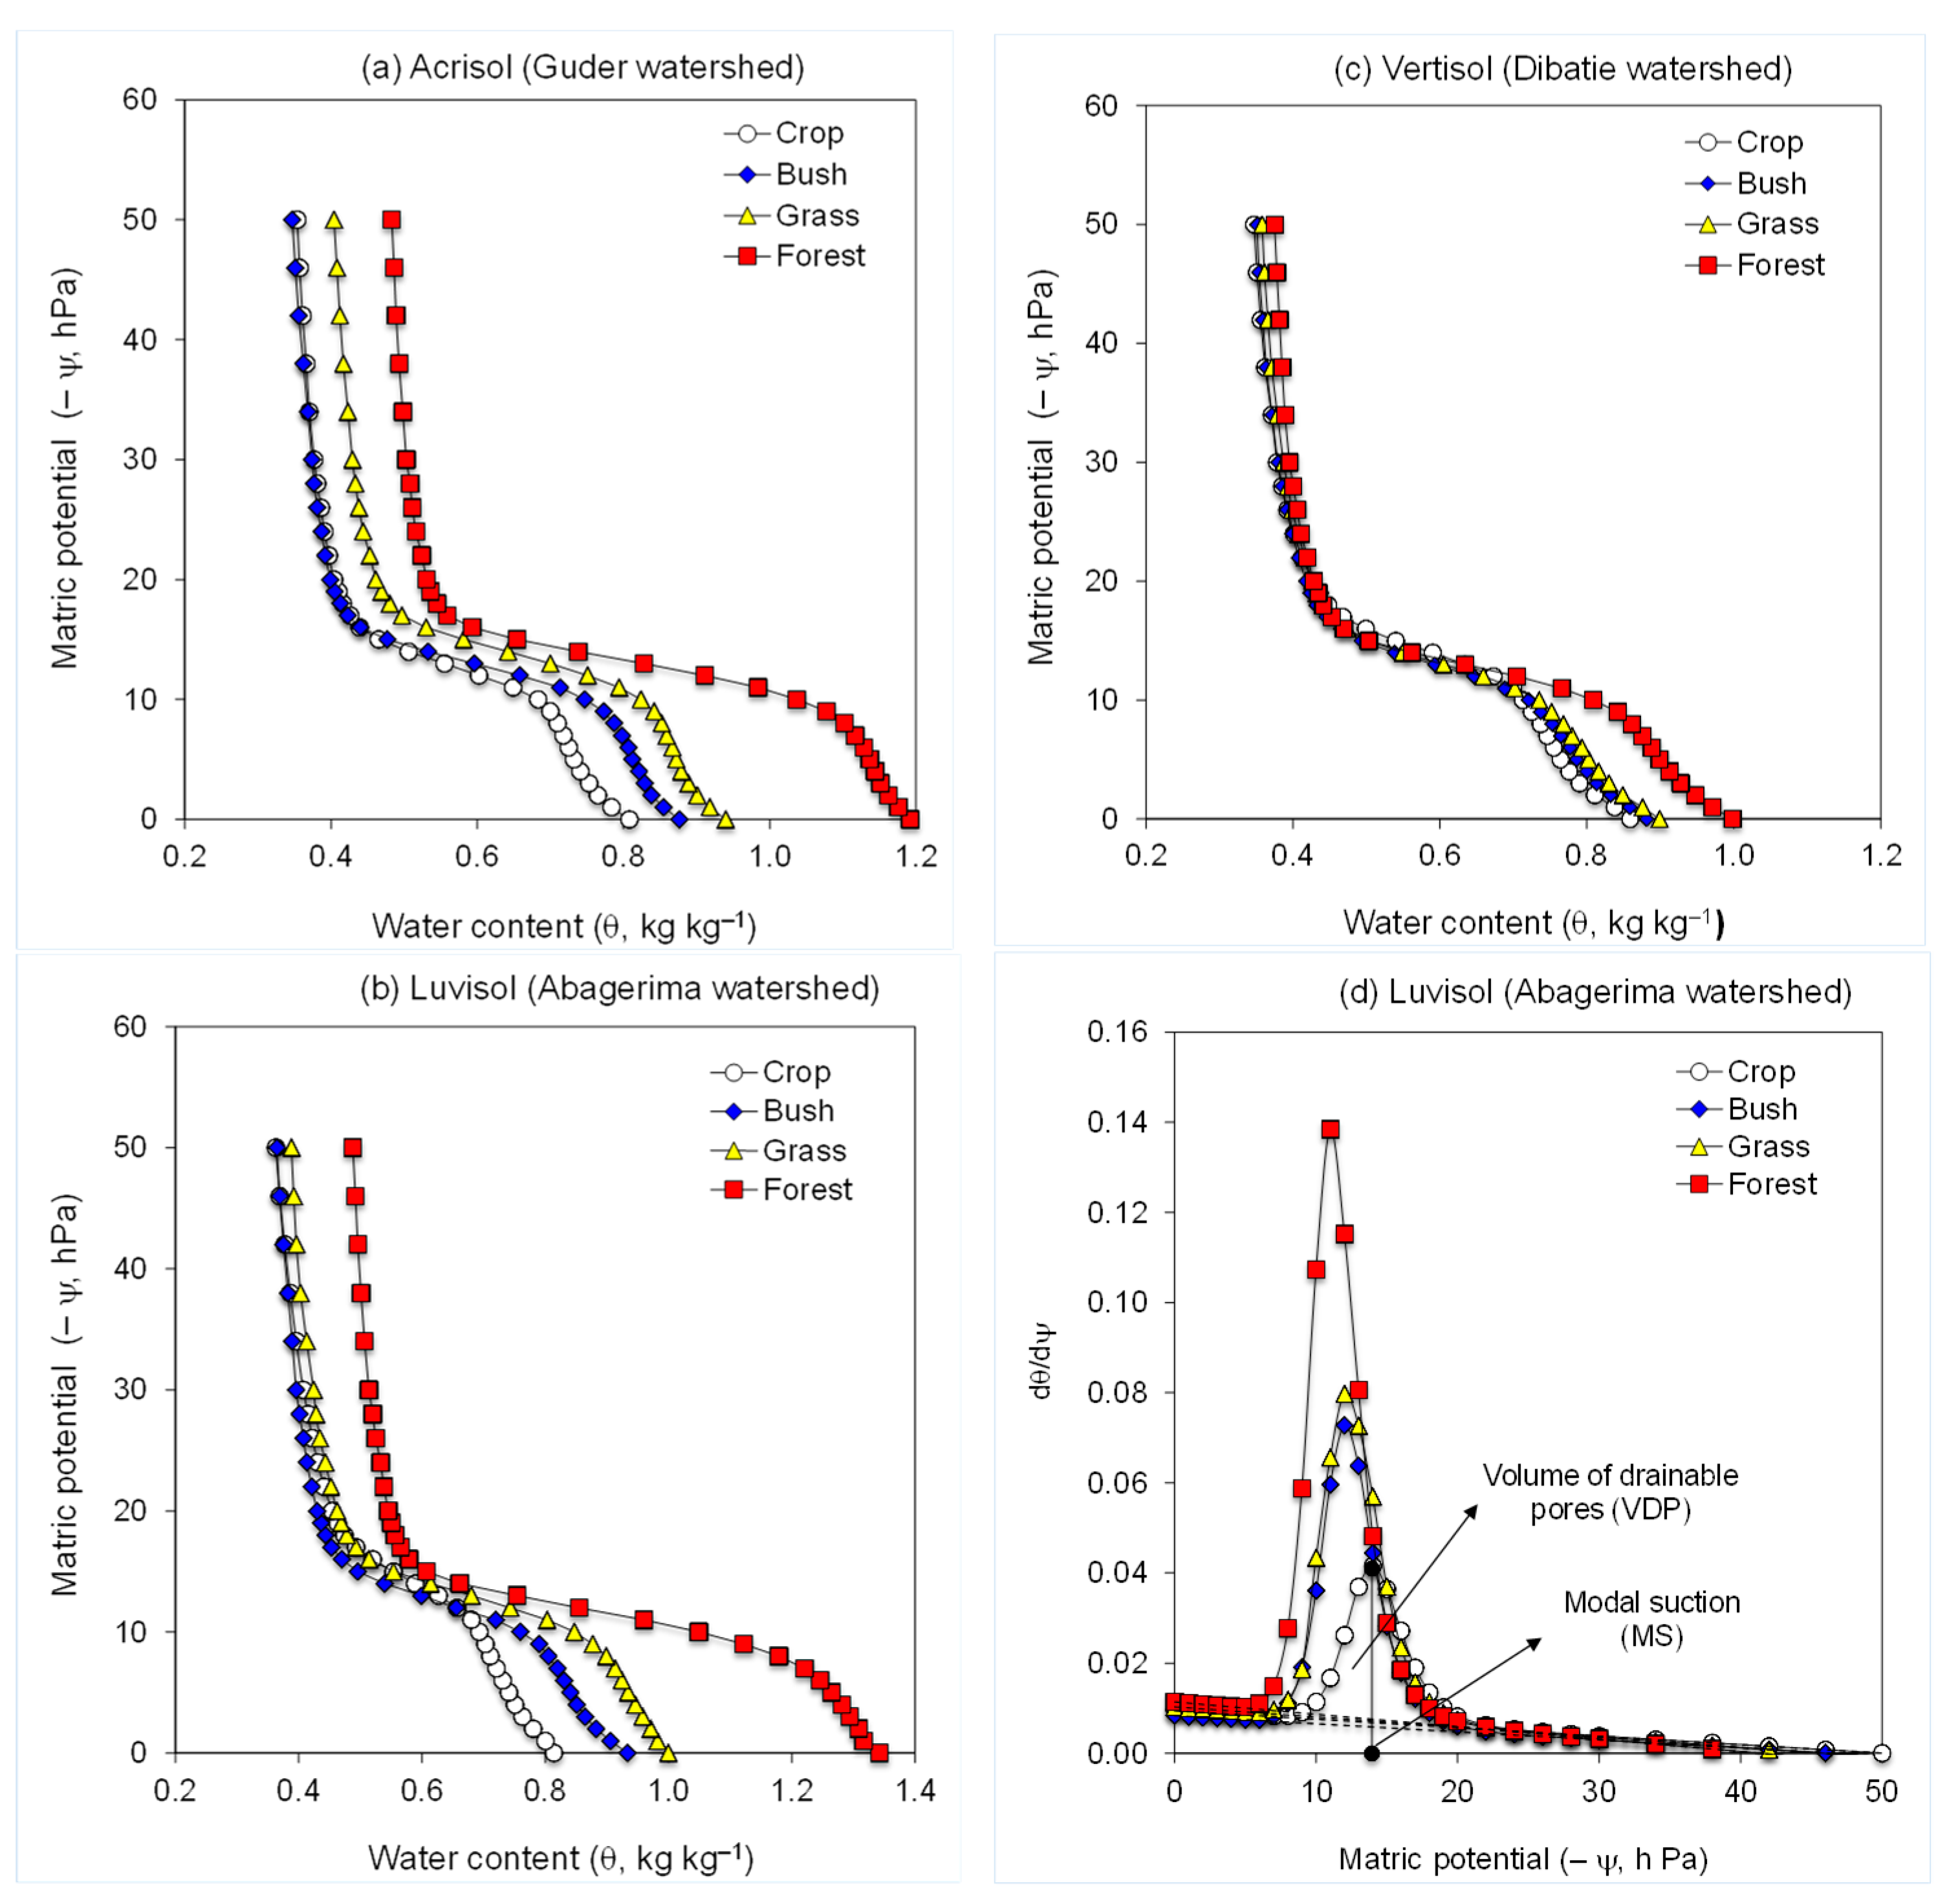
3.2.1. Water Retention of Untreated and PAM-Treated Soils

An evaluation of the shape of the water retention curves indicates the existence of differences associated with the distribution of the studied pores (>60 µm), with pore diameter being calculated from the matric potential (d = −300/ψ, where d is the equivalent pore diameter, µm). Land use and PAM treatments had considerable effects on the shape of the near saturation water retention curves, and consequently on its model parameters (θs, θr, α, n), and the soil structural stability indices (VDP, MS, SI) (Figure 1, Figure 2 and Figure 3, Table 3).
In all watersheds, the water retention curves of untreated soils for the different land uses exhibited similar trends, but of different magnitudes (Figure 1, Table 3). In the relative wet (−ψ > 12 hPa; pore size > 250 µm) and dry (−ψ < 24 hPa; pore size 60–125 µm) parts of the HEMC curves, soil moisture content (θ) at a given matric potential (ψ) was positioned in the following order of land use: forest > grass > bush > crop (excluding bushland soil at the dry end which was similar to the crop one). In the medium matric potential range (−ψ =12–24 hPa; pore size 125–250 µm) such differences for the different land uses were inconsistent (Figure 1, Table 3).
Treating the soils with PAM modified the shape of water retention curves in the entire range of the matric potential studied (ψ = 0–50 hPa) compared with the untreated ones, with the effect of PAM being dependent on PAM rate, land use, and soil type (watershed) (Table 3). In all three watersheds, water retention curves of PAM-treated soils were mostly to the left side of (or below) those of the untreated soils in crop and grassland soils (results for bushland were similar to grassland—data not presented). Moreover, a trend was noted whereby, the difference between the water retention of untreated and PAM-treated soil was higher in the cropland soils compared with the grass or forest ones. In the forest soil, the water retention curves of the untreated and PAM-treated samples were comparable in Guder and Abagerima watersheds, whereas in the Dibatie watershed (with very sparse forest) water retention of samples was somewhat similar to those observed in the grassland soils (Figure 2).
The contribution of the PAM rate in Acrisol (Guder), yielded only small differences between the retention curves of the two PAM rates at the entire range of the matric potential (Figure 2a–c). By contrast, in Luvisol (Abagerima), a distinct difference between the retention curves for the two rates of PAM was noted, especially at ψ > 10–12 hPa in the crop and grassland, where water retention curves of high rate PAM-treated soils were on the left side of the low rate PAM-treated soils, revealing to more draining water at a given matric potential (Figure 2d–f). In Vertisol (Dibatie), the impact of PAM rate on the water retention curves was similar to that noted in the Luvisol (Abagerima), but it extended also to the forest soil (Figure 2g–i).

3.2.2. Structure Stability of Untreated and PAM-Treated Soils

Structure stability indices and model parameters by soil type (watershed), land use, or PAM differed: the n (and MS) decreased, while θs, θr, α, and SI (and VDP), increased with the following order of land use: crop < bush < grass < forest (Table 3). The SI values of the individual treatments varied over a wide range, between 0.013 to 0.079 hPa−1, which could be related to the difference in soil type and properties among the watersheds and land use. However, within each watershed, and regardless of land use, PAM addition significantly increased soil SI. Moreover, similar to SOC order, untreated and PAM-treated soils had the same order of SI by land use: crop < bush < grass < forest (Figure 3).
In each watershed, the PAM effect on SI was highest in cropland and lowest in the forest (Figure 3). Relative to the untreated soils, PAM application increased soil SI by 1.2–1.3, 1.2–1.8, and 1.6–2.3 times in the soils of Guder (Acrisol), Abagerima (Luvisol), and Dibatie (Vertisol) watersheds respectively. At a high rate, PAM increased SI in the following order: Vertisol ≥ Luvisol > Acrisol for each type of land use (expect forest in Abagerima), while at a low rate of PAM and for untreated samples, the order of SI for same land use between the watersheds (or soil types) was inconsistent, although untreated soils under bush, grass, and forest land from Guder and Abagerima were more stable than from Dibatie watershed (Figure 3). It should be noted that treating cropland soils with a high PAM rate yielded greater or comparable SI (0.028–0.042 hPa−1) than untreated grass and bushland soils (0.021–0.033 hPa−1) in all watersheds (Figure 3). However, increase in PAM rate was (i) effective only in cropland soil with the lowest SOC (<2%) in Acrisol, (ii) not significant only in forest soil with highest SOC (~8.0%) in Luvisol, and (iii) significant for all land use samples in Vertisol (SOC = 1.7–5.1%). In the Guder watershed, the PAM rate has not changed the SI of bush, grass, and forest land samples (Figure 3).
A strong linear relation (R2 = 0.72) between soil SI and SOC for the untreated soils, and for the low rate PAM-treated soil (R2 = 0.64), was noted; for the high rate PAM-treated soils, no meaningful relation (R2 = 0.26) between SI and SOC was obtained (Figure 4a). The relation between SOC of micro-aggregates (<0.25 mm) and that of bulk soil exhibited a strong linear relation that could be associated with the effect of micro-aggregate stabilization by SOC on soil SI (Figure 4a,b).
A stepwise regression analysis revealed that in untreated soils, 92% of the variation in SI was associated mainly with SOC (71%), and CaCO3 (+12%). For the low rate PAM-treated soils, variation in SI was also associated with SOC (62%) and EC (+17%). However, for the high PAM application rate, 96% of the variation was related to EC, silt, SOC, pH, and clay content (Table 4). There was an exponential relation (3 watersheds × 4 land use × 3 PAM rate = 36 treatments) between soil SI and water retention model parameter α; the strength of this relation was inversely related to SOC level (Figure 5).

4. Discussion

4.1. Land Use and Soil Type (Elevation) Effects

The impact of land use on the soil properties (Table 1) was in agreement with other studies on similar soils or from those in Ethiopia, revealing that topsoil attributes, such as CEC and exchangeable cations (Ca2+, Mg2+, or Na+), SOC, pH, and aggregate stability were considerably higher, in soils under forest, grass or pasture lands than under cropland [8,20,21]. Results of the pair-wise correlation analysis for all the soils studied (Table 2a) highlight the considerable contribution of land use type coupled with soil type/elevation on the examined soil properties. These observations were in agreement with recent studies [37,46]. Moreover, the variation in the soil properties and structure stability indices under various land use (Table 1, Table 2 and Table 3) could be related to the sensitivity of characteristics of the studied soil types to structure-modifying processes [12,14,16], which is also associated with elevation or watersheds. Soil structure stabilization in the studied watersheds of the Ethiopian highland under long-term conservation practices leads to a reduction of runoff and soil loss, minimizing loss of crop residues and organic components, and to SOC accumulation [37,46,47]. However, the role of soil CaCO3 on soil biogeochemistry (e.g., pH, EC, Ca2+, CEC) in general and in particular its contribution to improving soil structure stability as observed in our study (Table 4), is still greatly overlooked in acidic soils, including in soils from Ethiopian highland [48].
Aggregate-structure stability (expressed in terms of SI or α) was directly associated with SOC irrespective of elevation (Table 2). The distinct relation between SOC and aggregate stability has been recognized long ago and has been ever since verified in many studies [21,44,47]. Aggregate stability was directly related to exchangeable Ca2+ in Luvisol and Vertisol (Abagerima and Dibatie) and CaCO3 content in Acrisol and Luvisol (Guder and Abagerima) (Table 2b). Evidentially, to maintain stable structure in soils of Ethiopian highlands, agricultural practices should include, in addition to means for increasing soils SOC, timely monitoring of soil Ca2+ and, if needed, adding some external source of Ca2+ (e.g., lime), especially at high altitudes, to balance Ca2+ deficiency and storage [27,34,48]. Similar to soils from semi-arid and arid regions, the stability of the soils in the Ethiopian highlands was susceptible to exchangeable Na+ or sodicity (i.e., ESP). Even though the negative role of sodicity on soil structure stability was evident in our study (Table 2), this topic, as well as the inverse relation between sodicity and SOC, have not been receiving their due attention in studies related to these acidic soils [25,26], although elevated exchangeable Na+ was also recently noted by other studies performed under natural condition or conservation practices in the highland region [8,46].

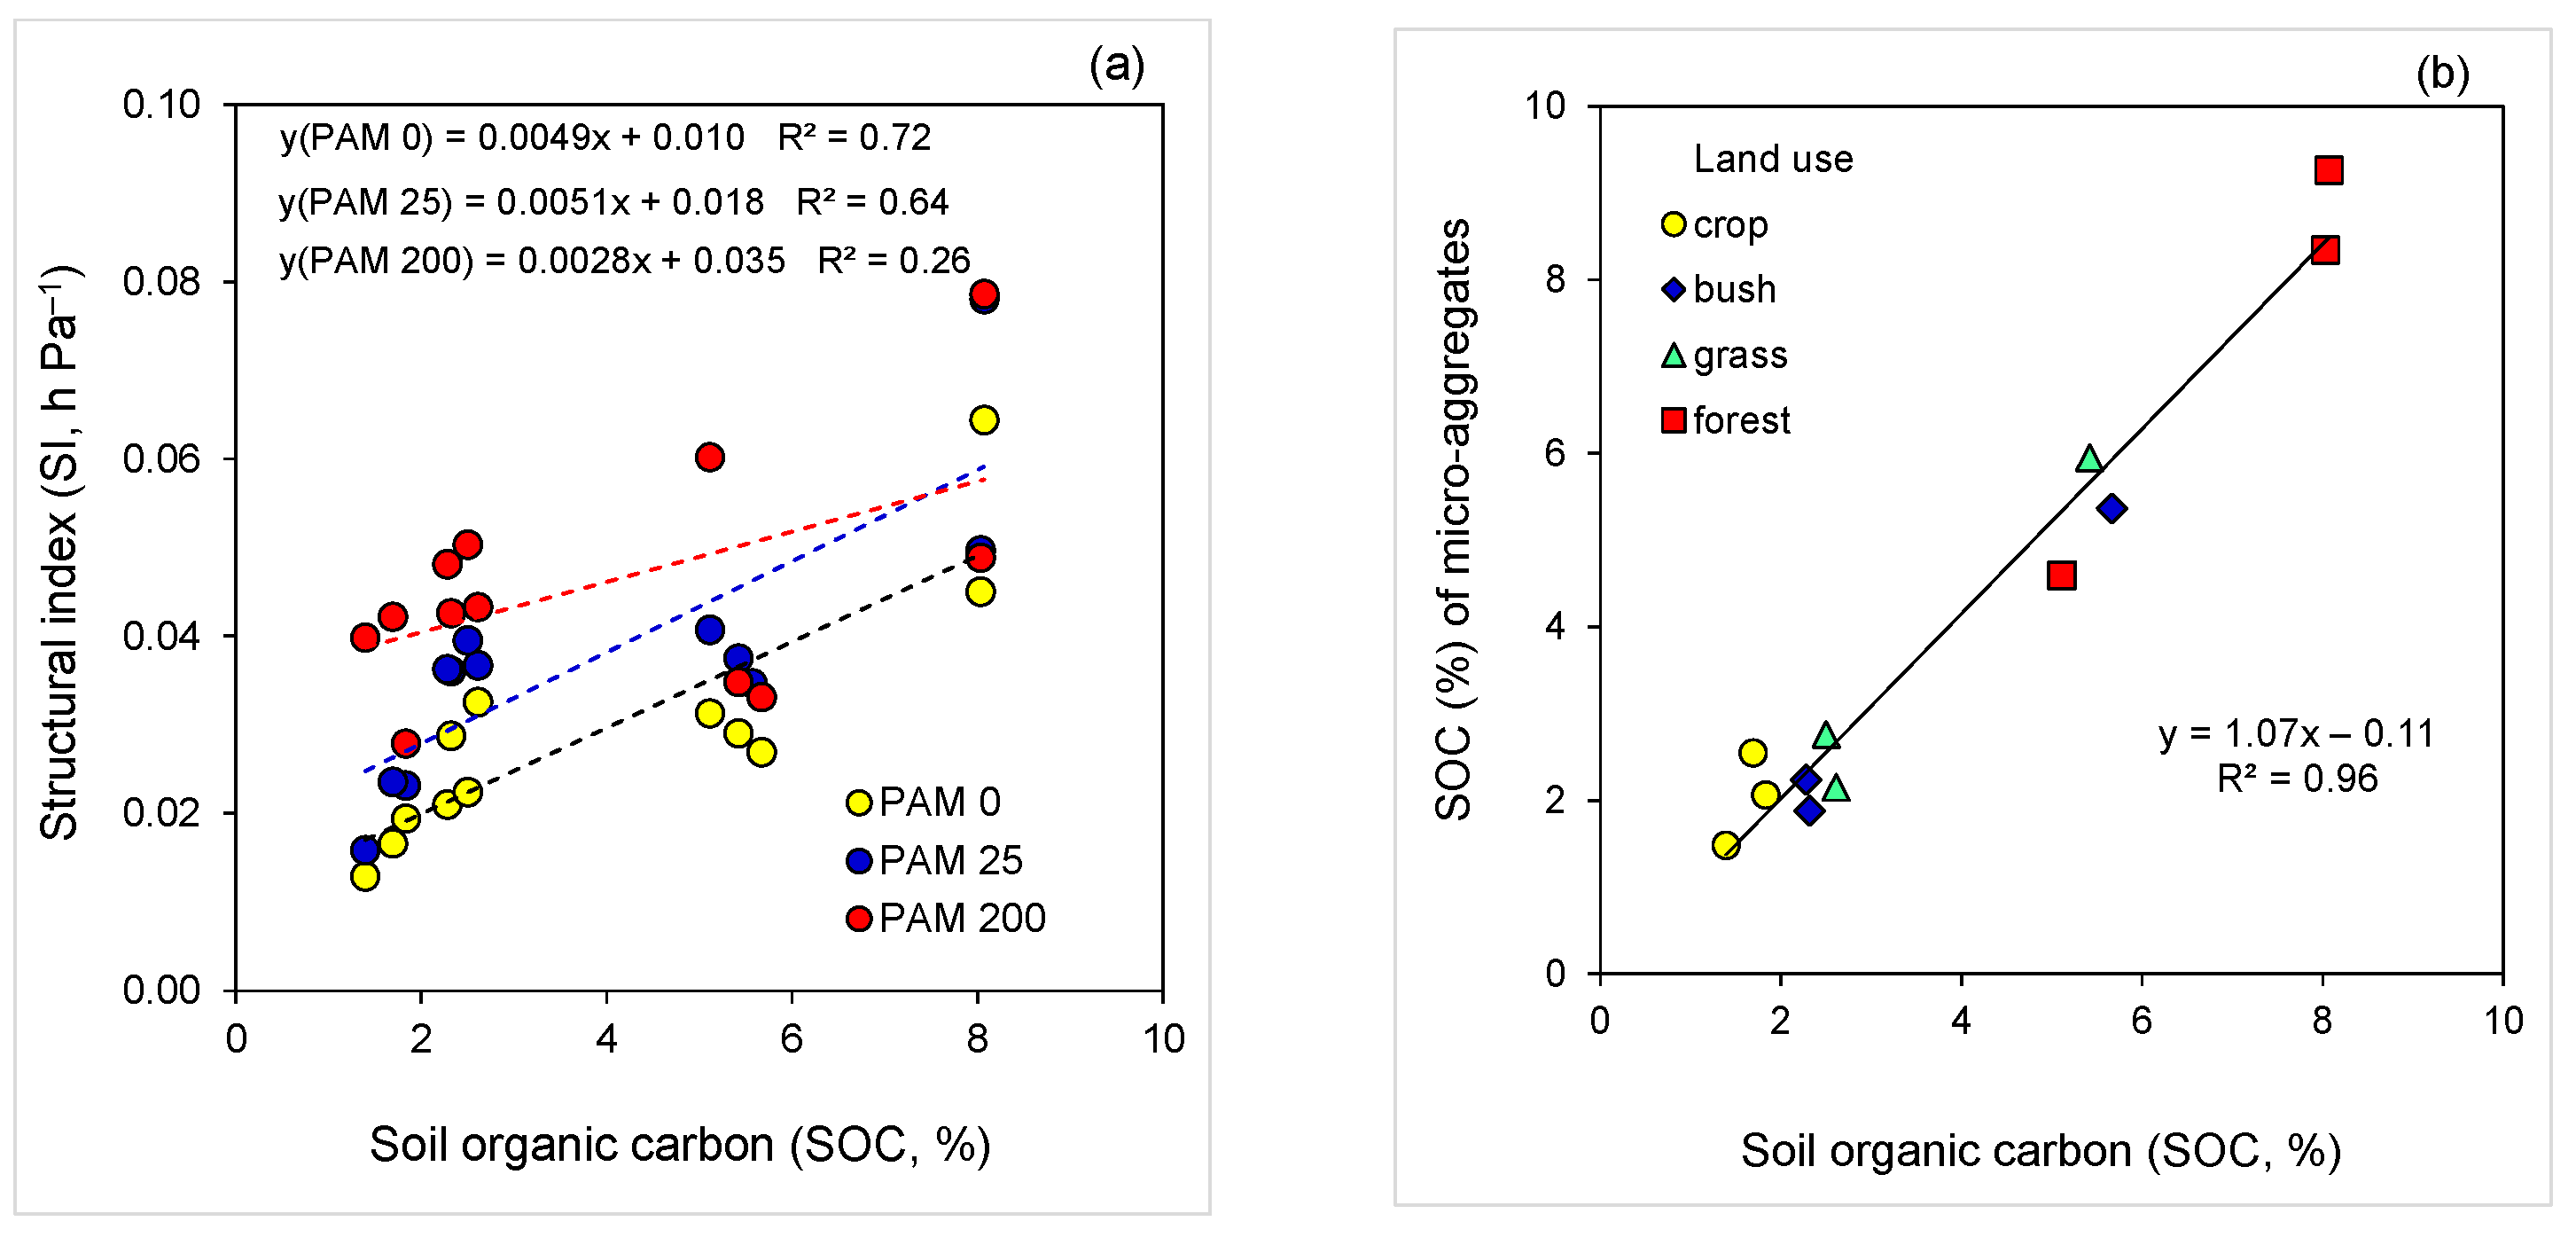
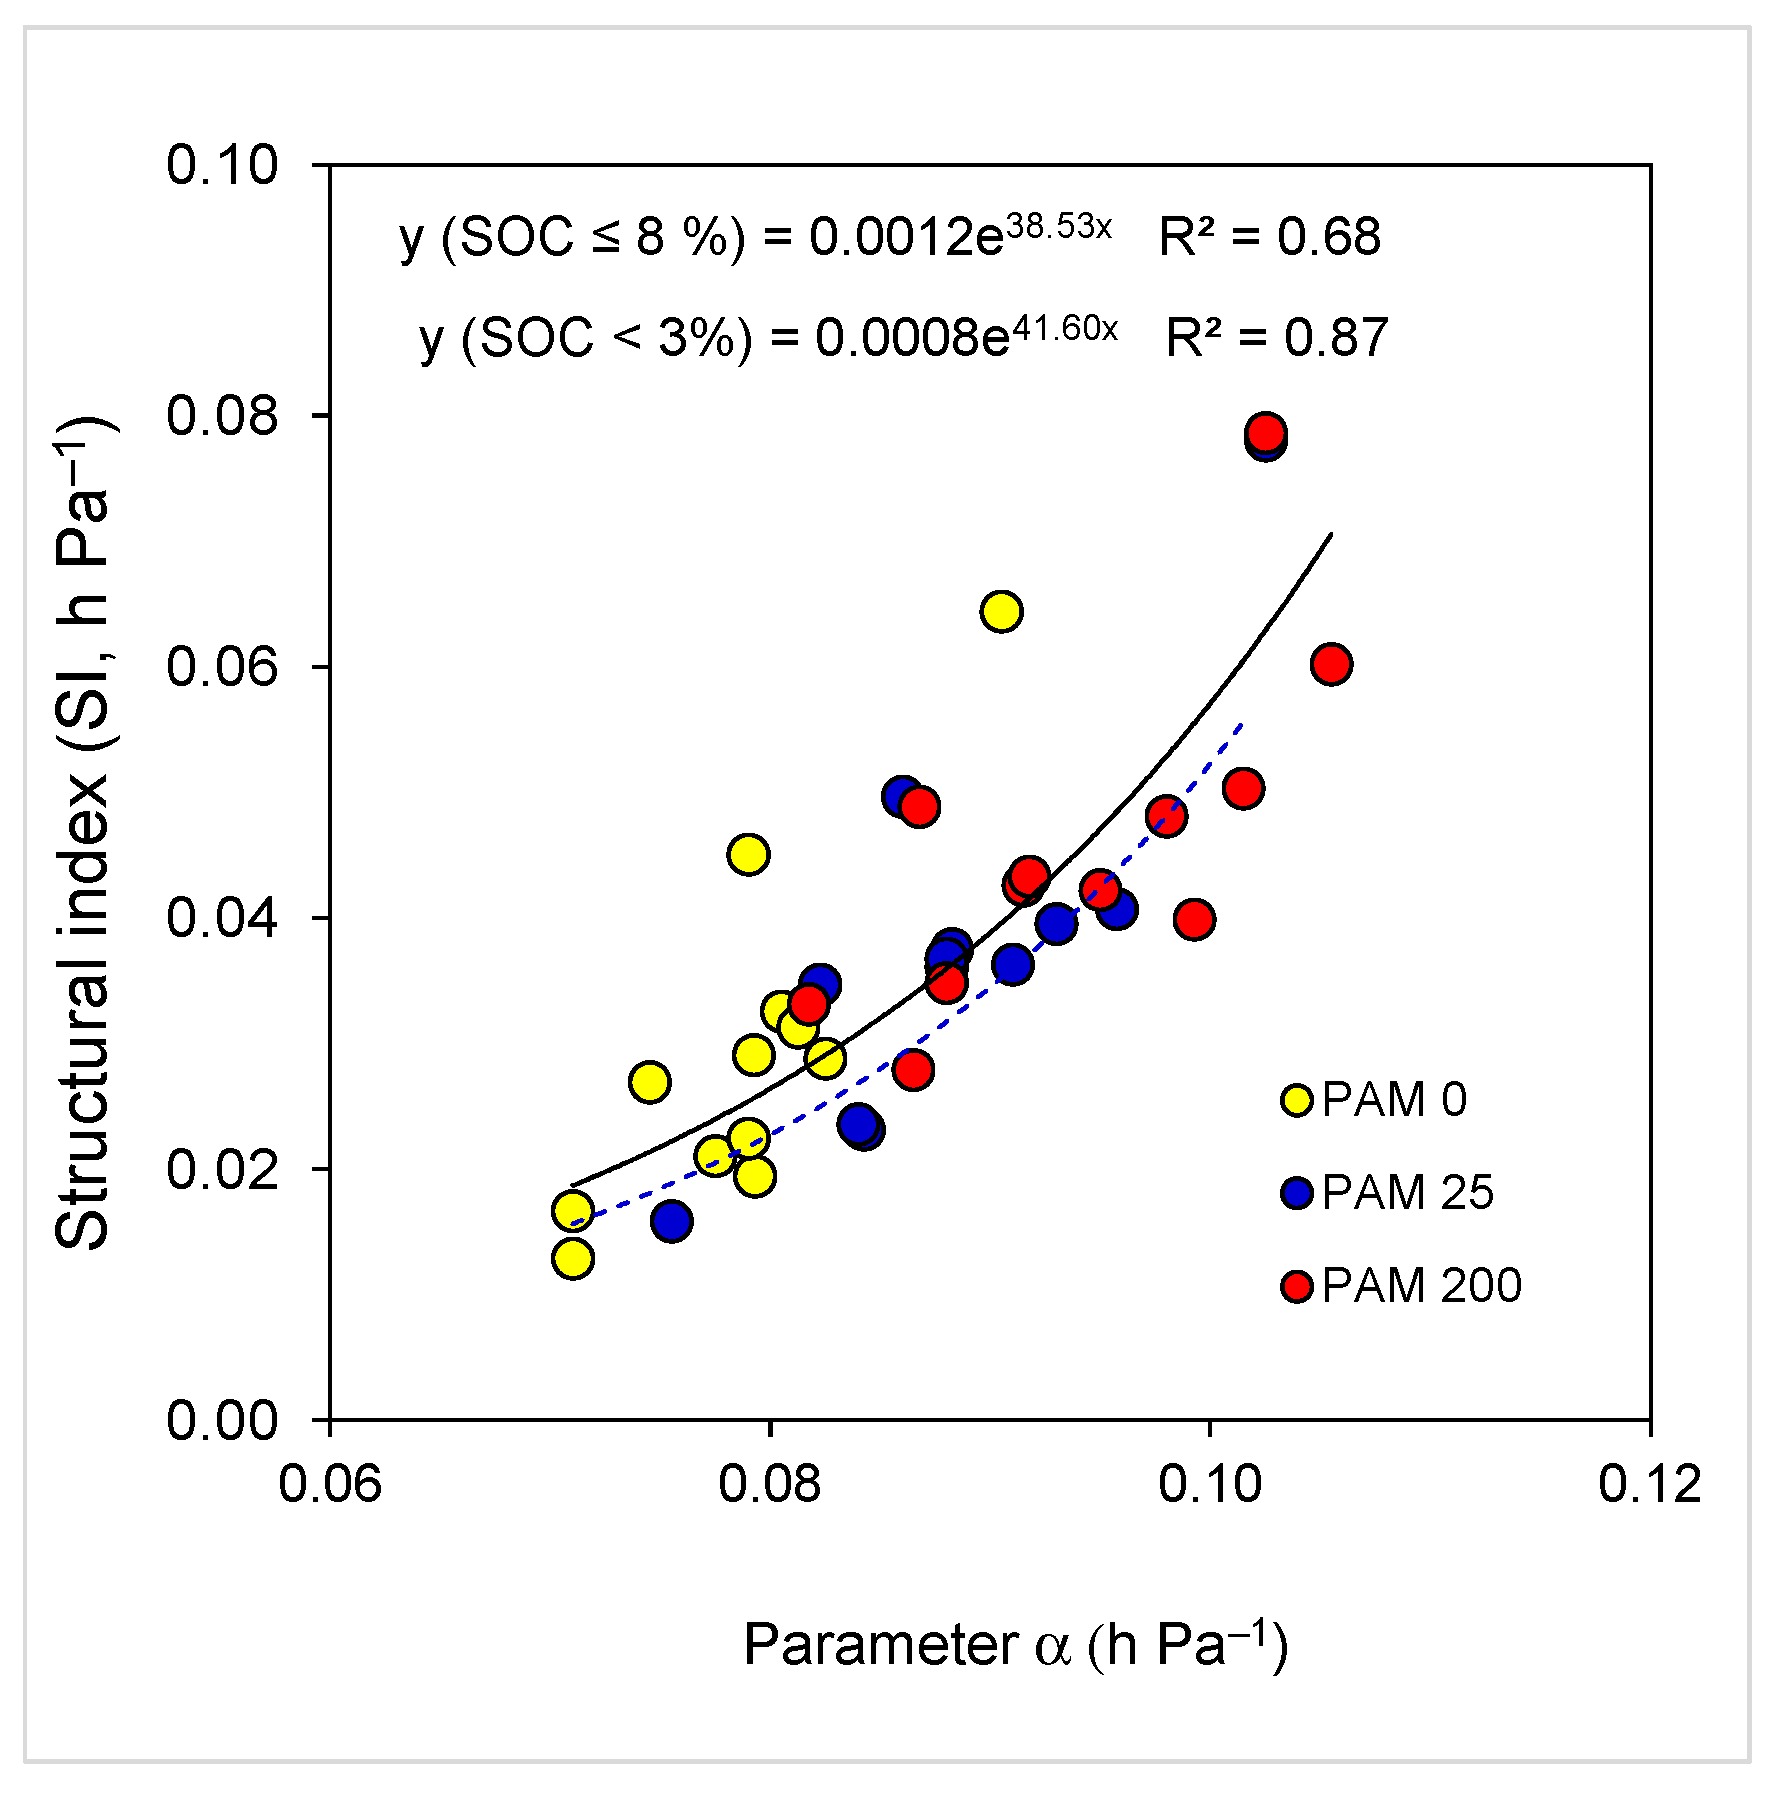
4.2. Soil Organic Carbon and Polyacrylamide Effect on Soil Structure Stability Indices

The shape of the water retention curves and hence the range of SI in untreated soils is associated with aggregation and can be explained by the conceptual aggregate hierarchy model [49], postulating that aggregates are sequentially formed through the action of organic binding agents leading to the formation of micro-aggregates (20–250 μm) and then macro-aggregates (>250 μm). Micro-aggregates could be formed within macro-aggregates by roots and microbial activity; aggregates and pores provide physical protection of SOC and mineralization [4,5,50]. Aggregate size influences the emissions of CO2, and correlations exist between aggregate size and macroporosity, number of pores, and pore size [3,28]. It should be noted that in the untreated soils, SOC content (and thus SI) is controlled by soil type or clay mineralogy (adsorption of SOC on clay minerals) and it is linked to CEC, pH, and CaCO3, i.e., soil attributes affected by the consequences of land use [4,7,9,51].
The water retention curves for forest, grass or bushland soils differed from that of cropland in the range of macro-pores (>250 μm; −ψ > 12 hPa) and micropores (60–125 μm; 12 < −ψ < 24 hPa) (Figure 2). The deviation of the grass and forest soil water retention curves from that of the cropland one at the micropore size range (60–125 μm) was associated with micro-aggregate stabilization through avoiding soil disturbance by tillage, and higher SOC content [4,6]. The observed strong correlations between SI and SOC (r > 0.9) for each soil type, linear relations between SOC and SI (R2 = 0.72), and between SOC of bulk soil and micro-aggregates (R2 = 0.92) (Table 2, Figure 4) emphasize that good soil structure could support soil SOC accumulation at micro-and macro-aggregate level [7]. However, stable micro-aggregates play a critical role in the long-term stabilization of soil organic matter, whereas less stable macro-aggregates provide only a small physical protection [50]. In turn, good and stable soil structure facilitate the supply of food source for soil microbes and subsequently SOC development, and hence, positive feedback exists between microbial activity, SOC accumulation, and soil structure formation [36,42,51,52].
Treating soils with anionic PAM was effective in stabilizing existing aggregates and improving bonding between and aggregation of soil particles. The magnitude of the PAM effects, similar to the effects of SOC, were soil type-clay mineralogy and land use (e.g., SOC, EC, pH, Ca2+) dependent (Table 3, Figure 4a) and could be related to the integrated PAM–Soil (Ca2+, Mg2+)–SOC interaction [51,53]. Positively charged cations (adsorbed on negatively charged mineral surfaces) facilitate the adsorption of negatively charged long-chain organic molecules through cation bridging. Aggregation depends on the strength of bonding governed by the chain length of the organic molecules and the type of cations on the exchange sites. Aggregates can be held together more strongly by PAM rather than by electrolytes because a single PAM chain is linked to multiple soil particles [54,55]. Thus, the higher SI from PAM treatments could be attributable to the adsorption of the long-chain PAM molecules to soil particles, which act as cementing material, and minimize aggregate slaking, and enhances soil aggregate and structure stability more than organic or inorganic amendments [40,56].
The deviation of the water retention curves of the PAM-treated cropland soils from the untreated one was less evident than the aforementioned deviations observed in the case of the changes in land use (Figure 1 and Figure 2); yet, at times changes took place in the regions of the micro- and meso-size pores (60–250 μm; −ψ < 12 hPa). This phenomenon could possibly be linked to the fact that, in contrast to the non-tilled land uses (forest, grass, and bushland), application of PAM does not lead to the buildup of new soil aggregates with time, but to preserving and strengthening existing aggregates [29,32,41]. Moreover, in the aggregate size range studied (0.5–1.0 mm), adsorption of PAM of high molecular weight used on soils takes place mostly on exterior surfaces of soil material, because the narrow pores in small–size aggregates may not allow penetration of the large PAM molecules into the aggregates [57]. This pattern of PAM adsorption to the aggregates explains the significant impact of the PAM rate on the SI (Table 3); the larger the rate, the greater the SI [28,34,58].
The favorable impact of PAM, irrespective of its rate, on SI of the slightly acidic soils under cropland (Figure 3), was significantly greater than on the other land uses. This observation was also noted in soils from a semi-arid region [58,59]. Moreover, it is worthwhile noting that the contribution of PAM to improving SI (Acrisol < Luvisol < Vertisol) by watershed was opposite to the trend of SOC accumulation in these soils (Acrisol > Luvisol > Vertisol); yet all soil samples with SOC < 3–5% used under crop, grass, and bushland were significantly affected by PAM application (Figure 3). This fact could be seen as analogous to findings from former studies, where the positive effect of PAM on SI was related to (i) soil texture, with PAM being more effective in loam with initially much weaker soil structure than in clay soils [28,29], and (ii) soil clay mineralogy, with PAM being more effective in unstable smectitic soils than in the stable kaolinitic ones [40,59,60,61]. Our observations regarding PAM contribution to improving aggregate stability being more pronounced in soils with lower SOC than with higher SOC content, further highlight that PAM is more effective in soils of a priori lesser stability. Moreover, at a low PAM rate, SOC and PAM could jointly contribute (Table 4, Figure 4a) to soil quality and macropore stabilization for short or long-term PAM application strategy [32,40].
The exponential relation between soil SI and model parameter α (Figure 5), reveals that an increase in α by SOC or PAM treatment may significantly increase soil SI due to the increase in the mean aggregate and pore size, and resistance of aggregates to slaking [10,34]. Excluding samples with high SOC content (>5%) from the relation increased the coefficient of determination R2 from 0.68 to 0.87 (Figure 5), yet regression curves with the close exponents were “parallel”. Thus, exponential relations between SI and α (which include untreated and PAM-treated samples), could be considered as important and might suggest that along with SI, parameter α could also be used for evaluating changes in aggregate-structure stability following changes in soil intrinsic or extrinsic conditions associated with land use and management, including PAM application [59,60]. Finally, it transpires from our findings that PAM, in combination with other conservation methods, can integrally regulate soil aggregate-structure stability. Thus, PAM can be applied for restoration of crop, grass, bushland soil, or even forest soils, particularly in “hot spot” areas associated with enhanced translocation and leaching of the clay particles and cations in degraded lands from tropical, humid, and arid regions [8,23,32,33,34,59,62].

5. Conclusions

It emerged from our study that change of land use from cropland soils (annually tilled) to land uses that do not require tillage (bush, grass, and forest) has substantial positive effects on aggregate-structure stability indices in the studied acidic soils from the Ethiopian highlands. The observed positive effect of CaCO3, and the negative effects of sodicity on SOC accumulation and soil structure development in the acidic soils studied, which have previously been mostly overlooked, need greater attention. The positive effects of the non-tilled land uses were ascribed to SOC accumulation and a lesser extent to CaCO3 content; the magnitude of the effects depended on soil type. A viable alternative in the form of using small amounts of PAM (e.g., a soil amendment), was found effective in stabilizing aggregates and improving soil structure in all the studied soils. The contribution of PAM to improving aggregate stability was more pronounced in soils of lower SOC content, thus emphasizing PAM efficacy as a soil stabilizing agent in soils of a priori weak structure stability. The mechanisms by which SOC and PAM improve aggregate stability seems to differ as predominant changes were observed in the pore size range of macropores (>250 μm) for changes in land use and hence SOC effect, and in the pore size range of 60–250 μm in the case of PAM application.
The efficacy of PAM application suggests that improving soil aggregate-structure stability is obtained almost immediately without the need to go through the time-consuming process of changing land use or using long-term no-till practices, to achieve the Sustainable Development Goals of the United Nations Land Degradation Neutrality challenge [63]. The results of PAM addition to the Ethiopian highland soils met our expectations that PAM addition (i) improves soil structure stability, and (ii) could replace, at least partly, traditional conservation measures, which include high-cost cultivation practices whose impact may emerge only after several decades. As the soil types and type of clay minerals and soil texture cannot be changed by management practices, employing practices such as PAM addition and SOC driven aggregation is crucial for short- and long-term soil structure stabilization under various land uses.

Supplementary Materials

The following are available online at https://www.mdpi.com/2071-1050/13/3/1407/s1, Table S1: Analysis of variance (ANOVA) of the effect of the treatments on soil properties, and near saturation water retention model parameters (θs, θr, α, n), and the HEMC structure stability indices (VDP, MS, and SI). W: watershed, LU: land use, PAM: polyacrylamide, VDP: volume of drainable pores, MS: modal suction, SI: structural index, α and n, are the location of the inflection point and the steepness of the water retention curve. θr and θs, are the residual and saturated water content, EC: electrical conductivity (1:2.5), CEC: cation exchange capacity, SOC: soil organic carbon; CCR: the ratio of clay content to CEC (indication of clay mineralogy); *: p < 0.001, Table S2: Pearson pairwise correlation coefficients for properties of the soils used. Units of the respective properties are as in Table S1. The coefficients higher than 0.5 are significant at p < 0.01–0.001. EC: electrical conductivity (1:2.5); CEC: cation exchange capacity, SOC: soil organic carbon.

Author Contributions

Conceptualization, A.I.M., A.T., N.H., and G.J.L.; methodology, A.I.M., G.J.L., T.K., B.K., T.M., G.A., and A.W.; software, A.I.M. and H.F.; validation, A.I.M., A.T., and G.J.L.; formal analysis, A.I.M., M.T., and N.H.; investigation, A.I.M., H.F., B.K., T.M., A.W., and M.T.; resources, A.T., H.F., and T.K.; data curation, M.T. and H.F.; writing-original draft preparation, A.I.M. and G.J.L.; writing—review and editing, A.I.M., G.J.L., and A.T.; visualization, A.I.M.; supervision, A.T., A.I.M., and N.H.; project administration, A.T.; funding acquisition, A.T. and H.F. All authors have read and agreed to the published version of the manuscript.

Funding

This research was funded by the Science and Technology Research Partnership for Sustainable Development (SATREPS)—Development of a Next-Generation Sustainable Land Management (SLM) Framework to Combat Desertification project, Grant Number JPMJSA1601, Japan Science and Technology Agency (JST)/Japan International Cooperation Agency (JICA).

Institutional Review Board Statement

Not applicable.

Informed Consent Statement

Not applicable.

Acknowledgments

The authors thank Arid Land Research Center, Tottori University, The Science and Technology Research Partnership for Sustainable Development (SATREPS), and Japan Science and Technology Agency (JST)/Japan International Cooperation Agency (JICA). We also would like to thank the Kemira Company (Lakeland, Florida, USA) for providing anionic polyacrylamide, SUPERFLOC A-110.

Conflicts of Interest

The authors declare no conflict of interest.

References

  1. Chandrasekhar, P.; Kreiselmeier, J.; Schwen, A.; Weninger, T.; Julich, S.; Feger, K.H.; Schwärzel, K. Why we should include soil structural dynamics of agricultural soils in hydrological models. Water 2018, 10, 1862. [Google Scholar] [CrossRef] [Green Version]
  2. Mamedov, A.I.; Bar–Yosef, B.; Levkovich, I.; Fine, P.; Silber, A.; Levy, G.J. Physicochemical mechanisms underlying soil and organic amendment effects on runoff P losses. Land Degrad. Dev. 2020, 31, 2395–2404. [Google Scholar] [CrossRef]
  3. Mangalassery, S.; Sjögersten, S.; Sparkes, D.L.; Sturrock, C.J.; Mooney, S.J. The effect of soil aggregate size on pore structure and its consequence on emission of greenhouse gases. Soil Tillage Res. 2013, 132, 39–46. [Google Scholar] [CrossRef]
  4. Kravchenko, A.N.; Negassa, W.C.; Guber, A.K.; Rivers, M.L. Protection of soil carbon within macro-aggregates depends on intra-aggregate pore characteristics. Sci. Rep. 2015, 5, 16261. [Google Scholar] [CrossRef] [Green Version]
  5. Juarez, S.; Nunan, N.; Duday, A.C.; Pouteau, V.; Schmidt, S.; Hapca, S.; Chenu, C. Effects of different soil structures on the decomposition of native and added organic carbon. Eur. J. Soil Biol. 2013, 58, 81–90. [Google Scholar] [CrossRef]
  6. Totsche, K.U.; Amelung, W.; Gerzabek Martin, H.; Guggenberger, G.; Klumpp, E.; Knief, C.; Lehndorff, E.; Mikutta, R.; Peth, S.; Kögel-Knabner, I.; et al. Microaggregates in soils. J. Plant. Nutr. Soil Sci. 2017, 181, 104–136. [Google Scholar] [CrossRef] [Green Version]
  7. Rabot, E.; Wiesmeier, M.; Schlüter, S.; Vogel, H.J. Soil structure as an indicator of soil functions: A review. Geoderma 2018, 314, 122–137. [Google Scholar] [CrossRef]
  8. Kassa, H.; Dondeyne, S.; Poesen, J.; Frankl, A.; Nyssen, J. Impact of deforestation on soil fertility, soil carbon and nitrogen stocks: The case of Gacheb catchment in the White Nile basin, Ethiopia. Agric. Ecosyst. Environ. 2017, 247, 273–282. [Google Scholar] [CrossRef] [Green Version]
  9. Kodešová, R.; Jirku, V.; Kodeš, V.; Mühlhanselová, M.; Nikodem, A.; Žigová, A. Soil structure and soil hydraulic properties of Haplic Luvisol used as arable land and grassland. Soil Tillage Res. 2011, 111, 154–161. [Google Scholar] [CrossRef]
  10. de Oliveira, J.A.T.; Cássaro, F.A.M.; Pires, L.F. Estimating soil porosity and pore size distribution changes due to wetting-drying cycles by morphometric image analysis. Soil Tillage Res. 2021, 25, 104814. [Google Scholar] [CrossRef]
  11. Schweizer, S.A.; Fischer, H.; Haring, V.; Stahr, K. Soil structure breakdown following land use change from forest to maize in Northwest Vietnam. Soil Tillage Res. 2017, 166, 10–17. [Google Scholar] [CrossRef]
  12. Wiesmeier, M.; Urbanski, L.; Hobley, E.; Lang, B.; von Lutzow, M.; Marin-Spiotta, E.; van Wesemael, B.; Rabot, E.; Ließ, M.; Garcia-Franco, N.; et al. Soil organic carbon storage as a key function of soils-a review of drivers and indicators at various scales. Geoderma 2019, 333, 149–162. [Google Scholar] [CrossRef]
  13. Jacobs, A.; Rauber, R.; Ludwig, B. Impact of reduced tillage on carbon and nitrogen storage of two Haplic Luvisols after 40 years. Soil Tillage Res. 2009, 102, 158–164. [Google Scholar] [CrossRef]
  14. Ogle, S.M.; Alsaker, C.; Baldock, J.; Bernoux, M.; Breidt, F.J.; McConkey, B.; Regina, K.; Vazquez-Amabile, G.G. Climate and soil characteristics determine where no-till management can store carbon in soils and mitigate greenhouse gas emissions. Sci. Rep. 2019, 9, 11665. [Google Scholar] [CrossRef] [PubMed]
  15. Jensen, J.L.; Schjønning, P.; Watts, C.W.; Christensen, B.T.; Obour, P.B.; Munkholm, L.J. Soil degradation and recovery—Changes in organic matter fractions and structural stability. Geoderma 2020, 364, 114181. [Google Scholar] [CrossRef] [PubMed]
  16. Liang, C.; Vanden Bygaart, A.; Macdonald, J.; Cerkowniak, D.; McConkey, B.; Desjardins, R.; Angers, D. Revisiting no-till’s impact on soil organic carbon storage in Canada. Soil Tillage Res. 2020, 198, 104529. [Google Scholar] [CrossRef]
  17. Haregeweyn, N.; Tsunekawa, A.; Nyssen, J.; Poesen, J.; Tsubo, M.; Meshesha, D.T.; Schutt, B.; Adgo, E.; Tegegne, F. Soil erosion and conservation in Ethiopia: A review. Prog. Phys. Geogr. 2015, 39, 750–774. [Google Scholar] [CrossRef] [Green Version]
  18. Tesfaye, M.A.; Bravo, F.; Ruiz–Peinado, R.; Pando, V.; Bravo–Oviedo, A. Impact of changes in land use, species and elevation on soil organic carbon and total nitrogen in Ethiopian Central Highlands. Geoderma 2016, 261, 70–79. [Google Scholar] [CrossRef]
  19. Lemann, T.; Roth, V.; Zeleke, G.; Subhatu, A.; Kassawmar, T.; Hurni, H. Spatial and temporal variability in hydrological responses of the Upper Blue Nile basin, Ethiopia. Water 2019, 11, 21. [Google Scholar] [CrossRef] [Green Version]
  20. Tesfahunegn, G.B. Soil quality indicators response to land use and soil management systems in Northern Ethiopia’s catchment. Land Degrad. Dev. 2016, 27, 438–448. [Google Scholar] [CrossRef]
  21. Delelegn, Y.T.; Purahong, W.; Blazevic, A.; Yitaferu, B.; Wubet, T.; Goransson, H.; Godbold, D.L. Changes in land use alter soil quality and aggregate stability in the highlands of northern Ethiopia. Sci. Rep. 2017, 7, 13602. [Google Scholar] [CrossRef] [PubMed] [Green Version]
  22. Dignac, M.F.; Derrien, D.; Barré, P.; Barot, S.; Cecillon, L.; Chenu, C.; Chevallier, T.; Freschet, G.T.; Garnier, P.; Roumet, C.; et al. Increasing soil carbon storage: Mechanisms, effects of agricultural practices and proxies. A review. Agron. Sustain. Dev. 2017, 37, 14. [Google Scholar] [CrossRef] [Green Version]
  23. Tebebu, T.Y.; Bayabil, H.K.; Stoof, C.R.; Giri, S.K.; Gessess, A.A.; Tilahun, S.A.; Steenhuis, T.S. Characterization of degraded soils in the humid Ethiopian highlands. Land Degrad. Dev. 2017, 28, 1891–1901. [Google Scholar] [CrossRef] [Green Version]
  24. Chaplot, V.; Darboux, F.; Alexis, M.; Cottenot, L.; Gaillard, H.; Quenea, K.; Mutema, M. Soil tillage impact on the relative contribution of dissolved, particulate and gaseous (CO2) carbon losses during rainstorms. Soil Tillage Res. 2019, 187, 31–40. [Google Scholar] [CrossRef]
  25. Shabtai, I.A.; Shenker, M.; Edeto, W.L.; Warburg, A.; Ben–Hur, M. Effects of land use on structure and hydraulic properties of Vertisols containing a sodic horizon in northern Ethiopia. Soil Tillage Res. 2014, 136, 19–27. [Google Scholar] [CrossRef]
  26. Bayabil, H.K.; Stoof, C.R.; Lehmann, J.C.; Yitaferu, B.; Steenhuis, T.S. Assessing the potential of biochar and charcoal to improve soil hydraulic properties in the humid Ethiopian Highlands: The Anjeni watershed. Geoderma 2015, 243–244, 115–123. [Google Scholar] [CrossRef]
  27. Bekele, A.; Kibret, K.; Bedadi, B.; Yli–Halla, M.; Balemi, T. Effects of lime, vermicompost, and chemical P fertilizer on selected properties of acid soils of Ebantu District, Western Highlands of Ethiopia. Appl. Environ. Soil Sci. 2018, 2018, 8178305. [Google Scholar] [CrossRef]
  28. Mamedov, A.I.; Huang, C.; Aliev, F.A.; Levy, G.J. Aggregate stability and water retention near saturation characteristics as affected by soil texture, aggregate size and polyacrylamide application. Land Degrad. Dev. 2017, 28, 543–552. [Google Scholar] [CrossRef] [Green Version]
  29. Caesar-Tonthat, T.; Busscher, W.; Novak, J.; Gaskin, J.; Kim, Y. Effects of polyacrylamide and organic matter on microbes associated to soil aggregation of Norfolk loamy sand. Appl. Soil Ecol. 2008, 40, 240–249. [Google Scholar] [CrossRef]
  30. Awad, Y.M.; Lee, S.S.; Kim, K.H.; Ok, Y.S.; Kuzyakov, Y. Carbon and nitrogen mineralization and enzyme activities in soil aggregate-size classes: Effects of biochar, oyster shells, and polymers. Chemosphere 2018, 198, 40–48. [Google Scholar] [CrossRef]
  31. Lee, S.S.; Shah, H.S.; Awad, Y.M.; Kumar, S.; Ok, Y.S. Synergy effects of biochar and polyacrylamide on plants growth and soil erosion control. Environ. Earth Sci. 2015, 74, 2463–2473. [Google Scholar] [CrossRef]
  32. Ma, B.; Ma, B.L.; McLaughlin, N.B.; Mi, J.; Yang, Y.; Liu, J. Exploring soil amendment strategies with polyacrylamide to improve soil health and oat productivity in a dryland farming ecosystem: One-time versus repeated annual application. Land Degrad. Dev. 2020, 31, 1176–1192. [Google Scholar] [CrossRef]
  33. Sojka, R.E.; Orts, W.J.; Entry, J.A. Soil physics and hydrology: Conditioners. In Encyclopedia of Soils in the Environment; Elsevier: Oxford, UK, 2005; pp. 301–306. [Google Scholar]
  34. Mamedov, A.I.; Fujimaki, H.; Tsunekawa, A.; Tsubo, M.; Levy, G. Structure stability of acidic Luvisols: Effects of tillage type and exogenous additives. Soil Tillage Res. 2021, 206, 104832. [Google Scholar] [CrossRef]
  35. Tian, X.; Fan, H.; Wang, J.; Ippolito, J.; Li, Y.; Feng, S.; An, M.; Zhang, F.; Wang, K. Effect of polymer materials on soil structure and organic carbon under drip irrigation. Geoderma 2019, 340, 94–103. [Google Scholar] [CrossRef]
  36. Tian, X.; Wang, K.; Liu, Y.; Fan, H.; Wang, J.; An, M. Effects of polymer materials on soil physicochemical properties and bacterial community structure under drip irrigation. Appl. Soil Ecol. 2020, 150, 103456. [Google Scholar] [CrossRef]
  37. Abebe, G.; Tsunekawa, A.; Haregeweyn, N.; Takeshi, T.; Wondie, M.; Adgo, E.; Masunaga, T.; Tsubo, M.; Ebabu, K.; Berihun, M.L.; et al. Effects of land use and topographic position on soil organic carbon and total nitrogen stocks in different agro–ecosystems of the Upper Blue Nile Basin. Sustainability 2020, 12, 2425. [Google Scholar] [CrossRef] [Green Version]
  38. IUSS Working Group WRB. World reference base for soil resources 2014, update 2015. In International Soil Classification System for Naming Soils and Creating Legends for Soil Maps. World Soil Resource Reports No. 106; FAO: Rome, Italy, 2015; p. 239. [Google Scholar]
  39. Klute, A. Methods of Soil Analysis, 2nd ed.; Agronomy Monograph 9; ASA and SSSA: Madison, WI, USA, 1986. [Google Scholar]
  40. Mamedov, A.I.; Wagner, L.E.; Huang, C.; Norton, L.D.; Levy, G.J. Polyacrylamide effects on aggregate and structure stability of soils with different clay mineralogy. Soil Sci. Soc. Am. J. 2010, 74, 1720–1732. [Google Scholar] [CrossRef] [Green Version]
  41. Mamedov, A.I.; Levy, G.J. High energy moisture characteristics: Linking between some soil physical processes and structure stability. In Quantifying and Modeling Soil Structure Dynamics: Advances in Agricultural Systems Modeling. Trans-disciplinary Research, Synthesis, Modeling and Applications; SSSA: Madison, WI, USA, 2015; Volume 3, pp. 41–74. [Google Scholar] [CrossRef]
  42. Saffari, N.; Hajabbasi, M.A.; Shirani, H.; Mosaddeghi, M.R.; Mamedov, A.I. Biochar type and pyrolysis temperature effects on soil quality indicators and structural stability. J. Environ. Manag. 2020, 221, 110190. [Google Scholar] [CrossRef]
  43. Pierson, F.B.; Mulla, D.J. An Improved method for measuring aggregate stability of a weakly aggregated loessial soil. Soil Sci. Soc. Am. J. 1989, 53, 1825–1831. [Google Scholar] [CrossRef]
  44. Levy, G.J.; Mamedov, A.I. High-Energy-Moisture-Characteristic aggregate stability as a predictor for seal formation. Soil Sci. Soc. Am. J. 2002, 66, 1603–1609. [Google Scholar] [CrossRef]
  45. SAS Institute. SAS User’s Guide; Version 9.2; SAS Institute: Cary, NC, USA, 2008. [Google Scholar]
  46. Ebabu, K.; Tsunekawa, A.; Haregeweyn, N.; Adgo, E.; Meshesha, D.T.; Aklog, D.; Masunaga, T.; Tsubo, M.; Sultan, D.; Fenta, A.A.; et al. Exploring the variability of soil properties as influenced by land use and management practices: A case study in the Upper Blue Nile basin, Ethiopia. Soil Tillage Res. 2020, 200, 104614. [Google Scholar] [CrossRef]
  47. Welemariam, M.; Kebede, F.; Bedadi, B.; Birhane, E. Effect of community-based soil and water conservation practices on soil glomalin, aggregate size distribution, aggregate stability and aggregate-associated organic carbon in northern highlands of Ethiopia. Agric. Food Secur. 2018, 7, 42. [Google Scholar] [CrossRef]
  48. Rowley, M.C.; Grand, S.; Verrecchia, E.P. Calcium–mediated stabilization of soil organic carbon. Biogeochemistry 2018, 137, 27–49. [Google Scholar] [CrossRef] [Green Version]
  49. Tisdall, J.M.; Oades, J.M. Organic matter and water stable aggregates in soils. J. Soil Sci. 1982, 33, 141–163. [Google Scholar] [CrossRef]
  50. Six, J.; Bossuyt, H.; Degryze, S.; Denef, K. A history of research on the link between (micro)aggregates, soil biota, and soil organic matter dynamics. Soil Tillage Res. 2004, 79, 7–31. [Google Scholar] [CrossRef]
  51. Singh, M.; Sarkar, B.; Biswas, B.; Churchman, J.; Bolan, N.S. Adsorption–desorption behavior of dissolved organic carbon by soil clay fractions of varying mineralogy. Geoderma 2016, 280, 47–56. [Google Scholar] [CrossRef]
  52. Gui, J.; Holden, N.M. The relationship between soil microbial activity and microbial biomass, soil structure and grassland management. Soil Tillage Res. 2015, 146, 32–38. [Google Scholar] [CrossRef]
  53. Levy, G.J.; Warrington, D.N. Polyacrylamide addition to soils: Impacts on soil structure and stability. In 533 Functional Polymers in Food Science: From Technology to Biology, Volume 2: Food Processing; John Wiley and Sons: Hoboken, NJ, USA, 2015; pp. 9–32. [Google Scholar] [CrossRef]
  54. Bhardwaj, A.K.; McLaughlin, R.A.; Shainberg, I.; Levy, G.J. Hydraulic characteristics of depositional seals as affected by exchangeable cations, clay mineralogy, and polyacrylamide. Soil Sci. Soc. Am. J. 2009, 73, 910–918. [Google Scholar] [CrossRef]
  55. Shainberg, I.; Goldstein, D.; Mamedov, A.I.; Levy, G.J. Granular and dissolved polyacrylamide effects on hydraulic conductivity of a fine sand and a silt loam. Soil Sci. Soc. Am. J. 2011, 75, 1090–1098. [Google Scholar] [CrossRef]
  56. Miller, W.P.; Willis, R.L.; Levy, G.J. Aggregate stabilization in kaolinitic soils by low rates of anionic polyacrylamide. Soil Use Manag. 1998, 14, 101–105. [Google Scholar] [CrossRef]
  57. Mamedov, A.I.; Beckmann, S.; Huang, C.; Levy, G.J. Aggregate stability as affected by polyacrylamide molecular weight, soil texture, and water quality. Soil Sci. Soc. Am. J. 2007, 71, 1909–1918. [Google Scholar] [CrossRef] [Green Version]
  58. Kebede, B.; Tsunekawa, A.; Haregeweyn, N.; Mamedov, A.I.; Tsubo, M.; Fenta, A.A.; Meshesha, D.T.; Masunaga, T.; Adgo, E.; Abebe, G.; et al. Effectiveness of polyacrylamide in reducing runoff and soil loss under consecutive rainfall storms. Sustainability 2020, 12, 1597. [Google Scholar] [CrossRef] [Green Version]
  59. Mamedov, A.I.; Tsunekawa, A.; Tsubo, M.; Fujimaki, H.; Ekberli, I.; Şeker, C.; Öztürk, H.S.; Cerdà, A.; Levy, G.J. Structure stability of cultivated soils from semi-arid region: Comparing the effects of land use and anionic polyacrylamide application. Agronomy 2020, 10, 2010. [Google Scholar] [CrossRef]
  60. Porebska, D.; Slawinski, C.; Lamorski, K.; Walczak, R.T. Relationship between van Genuchten’s parameters of the retention curve equation and physical properties of soil solid phase. Int. Agrophys. 2006, 20, 153–159. [Google Scholar]
  61. de Melo, D.V.M.; de Almeida, B.G.; de Souza, E.R.; Silva, L.S.; Jacomine, P.K.T. Structural quality of polyacrylamide-treated cohesive soils in the coastal tablelands of Pernambuco. Rev. Brasil. Ciênc. Solo 2014, 38, 476–485. [Google Scholar] [CrossRef] [Green Version]
  62. Inbar, A.; Ben–Hur, M.; Sternberg, M.; Lado, M. Using polyacrylamide to mitigate post fire soil erosion. Geoderma 2014, 239, 107–114. [Google Scholar] [CrossRef]
  63. Keesstra, S.; Nunes, J.P.; Novara, A.; Finger, D.C.; Avelar, D.; Kalantari, Z.; Cerda, A. The superior effect of nature based solutions in land management for enhancing ecosystem services. Sci. Total Environ. 2018, 610, 997–1009. [Google Scholar] [CrossRef] [Green Version]
Figure 1. Water retention curves of the soils form (a) Guder (Acrisol), (b) Abagerima (Luvisol), and (c) Dibatie (Vertisol) watersheds used under crop, grass, bush, and forest land, and (d) the specific water capacity curves of soils from Abagerima (Luvisol). The dashed baseline in the specific water capacity curve represents the soil shrinkage line.
Sustainability 13 01407 g001
Figure 2. Water retention curves of untreated (PAM 0) and polyacrylamide (PAM) treated (25 and 200 mg L−1) soils used under crop, grass, and forest land for (ac) Guder (Acrisol), (df) Abagerima (Luvisol), and (g–i) Dibatie (Vertisol) watersheds.
Sustainability 13 01407 g002
Figure 3. Structural index (SI) of the soils as affected by (a) soil type (watershed), (b) land use, and (c) polyacrylamide (PAM) treatments (0—untreated, 25 and 200 mg L−1). Columns labeled with the same letter are not significantly different at p < 0.05 level: (a), within the soil (watershed); (b), within land use; and (c), within each soil (watershed).
Sustainability 13 01407 g003
Figure 4. Relations (p < 0.001) between (a) soil structural index (SI) and soil organic carbon (SOC) for untreated (PAM 0) and polyacrylamide (PAM)-treated soils (25, 200 mg L−1), and (b) SOC of micro-aggregates (<0.25 mm) and bulk soil (<2 mm).
Sustainability 13 01407 g004
Figure 5. Relations (p < 0.001) between soil water retention model parameter α and soil structural index (SI) for all samples (SOC ≤ 8.1%, solid line) and samples with SOC ≤ 3% (dash line). Soil samples include untreated (PAM 0) and polyacrylamide (PAM)-treated ones (25, 200 mg L−1).
Sustainability 13 01407 g005
Table 1. Selected physical-chemical properties (mean ± standard deviation) of the soils sampled from 0–15 cm depth in the study sites. In each column, means labeled with the same letter are not significantly different at p < 0.05 based on the Tukey–Kramer HSD test.
Soil Watershed
Elevation
Land
Use
pHECParticle Size Class, %SOC
1:2.5dS/mSandSiltClay%
Acrisol
Guder
High
Crop5.18 ± 0.09 f0.18 ± 0.01 ij424018 ± 0.9 f1.83 ± 0.09 f
Bush5.73 ± 0.11 d0.21 ± 0.02 hi563212 ± 1.0 g5.67 ± 0.27 b
Grass5.68 ± 0.10 d0.25 ± 0.01 g384220 ± 0.7 ef5.42 ± 0.30 b
Forest6.16 ± 0.12 c0.23 ± 0.01 gh721810 ± 0.8 g8.03 ± 0.38 a
Luvisol
Abagerima
Medium
Crop5.21 ± 0.10 f0.20 ± 0.01 hi522622 ± 1.1 de1.39 ± 0.07 g
Bush5.43 ± 0.11 e0.53 ± 0.04 e324028 ± 1.2 c2.32 ± 0.13 e
Grass5.38 ± 0.10 e0.64 ± 0.03 d344224 ± 1.4 d2.61 ± 0.12 d
Forest6.43 ± 0.13 b0.94 ± 0.06 a601624 ± 1.3 d8.07 ± 0.40 a
Vertisol
Dibatie
Low
Crop6.05 ± 0.12 c0.16 ± 0.01 j161866 ± 3.3 a1.69 ± 0.09 fg
Bush6.59 ± 0.12 a0.77 ± 0.02 c162856 ± 3.4 b2.28 ± 0.13 e
Grass6.15 ± 0.14 c0.29 ± 0.05 f122068 ± 2.8 a2.50 ± 0.11 de
Forest6.67 ± 0.11 a0.87 ± 0.05 b182458 ± 2.9 b5.11 ± 0.26 c
Soil
Watershed
Elevation
Land
use
Exchangeable cations, cmolc/kgCECCaCO3
CaMgNaKcmolc/kg%
Acrisol
Guder
High
Crop9.4 ± 0.47 g3.6 ± 0.14 fg4.91.526.40.28 ± 0.01 g
Bush16.1 ± 0.51 b3.3 ± 0.15 hi5.11.629.60.48 ± 0.01 g
Grass10.2 ± 0.81 f3.7 ± 0.10 ef4.71.637.50.32 ± 0.02 g
Forest14.0 ± 0.70 d3.2 ± 0.13 i4.51.339.61.28 ± 0.05 f
Luvisol
Abagerima
Medium
Crop10.1 ± 0.50 f3.8 ± 0.15 d3.31.425.14.01 ± 0.16 c
Bush11.3 ± 0.59 e3.8 ± 0.18 de3.41.534.02.72 ± 0.22 e
Grass11.8 ± 0.56 e4.3 ± 0.16 b4.12.235.45.60 ± 0.11 a
Forest17.8 ± 0.89 a3.5 ± 0.14 fg3.93.033.65.80 ± 0.23 a
Vertisol
Dibatie
Low
Crop9.9 ± 0.52 fg3.5 ± 0.14 gh6.31.926.53.52 ± 0.12 d
Bush13.5 ± 0.67 d4.5 ± 0.16 a2.92.532.44.56 ± 0.15 b
Grass13.4 ± 0.64 d4.0 ± 0.18 c2.42.029.53.44 ± 0.18 d
Forest14.7 ± 0.73 c4.2 ± 0.17 b3.41.836.04.42 ± 0.20 b
pH and EC were determined in the solution part of 1:2.5 soil:water extract using deionized water. EC: electrical conductivity, CEC: cation exchange capacity, SOC: soil organic matter.
Table 2. Pearson pair-wise correlation coefficients for properties and structural index (SI) of the soils used. The correlations with r ≥ 0.7 are in bold. Units of properties are in Table 1.
VariablesSIpHECSandSiltClayCaMgNaKCECCaCO3CCRSOC
   (a) between the indicators of soil properties for all watersheds
SI1
pH0.38 *1
EC0.54 *0.57 *1
Sand0.51 *−0.3 *−0.181
Silt−0.3 *−0.6 *−0.110.051
Clay−0.3 *0.56 *0.23−0.9 **−0.41 *1
Ca0.70 *0.70 **0.57 **0.29−0.47 *−0.021
Mg−0.280.230.55 **−0.6 *0.240.51 *0.031
Na−0.04−0.20−0.5 *0.270.08−0.25−0.20−0.6 *1
K0.45 *0.53 *0.73 **−0.22−0.260.34 *0.52 **0.43 **−0.241
CEC0.56 *0.40 *0.42 **0.210.12−0.190.38 *0.150.060.121
CaCO30.240.38 *0.73 **−0.30−0.36 *0.45 *0.30 *0.59 *−0.4 **0.72 **0.031
CCR−0.4 *0.44 *−0.060.84 **−0.44 *0.97 **−0.130.38 *−0.160.27−0.4 *0.39 *1
SOC0.84 **0.46 *0.270.63 **−0.33 *−0.41 *0.72 **−0.5 *0.140.150.63 *−0.11−0.49 *1
   (b) between soil properties and SOC or SI for each watershed: Guder (G), Abagerima (A), and Dibatie (D)
VariableSIpHECSandSiltClayCaMgNaKCECCaCO3CCRESP
G
G
SOC0.91 **0.99 **0.69 **0.66 *−0.76 **−0.65 *0.68 *−0.61 *−0.4 *−0.4 *0.81 **0.80 **−0.96 **−0.85 **
SI10.91 **0.53 *0.79 **−0.85 **−0.65 *0.43 *−0.65 *−0.6 *−0.7 **0.80 **0.93 **−0.90 **−0.70 **
A
A
SOC0.97 **0.99 **0.88 **0.64 *−0.70 **−0.110.99 **−0.55 *0.49 *0.91 **0.37 *0.62 *‒0.56 **−0.92 **
SI10.94 **0.96 **0.43 *−0.52 *0.100.96 **−0.47 *0.55 *0.92 **0.52 *0.60 *−0.67 *−0.86 **
D
D
SOC0.95 **0.70 **0.72 **0.53 *0.32 *−0.39 *0.74 **0.41 *−0.3 *−0.4 *0.82 **0.52 *−0.72 **−0.40 *
SI10.63 *0.72 **0.330.35 *−0.48 *0.78 **0.45 *−0.5 *−0.4 *0.73 **0.47 *−0.71 **−0.56 *
EC: electrical conductivity, CEC: cation exchange capacity, SOC: soil organic carbon, CCR: clay to CEC ratio, ESP: exchangeable sodium percentage; *, **: significant at the 0.01 (0.05) and 0.001 level accordingly.
Table 3. Effects of the treatments on the HEMC structure stability indices (VDP, MS, and SI) and near saturation water retention model parameters (θs, θr, α, n). Within each factor, the columns labeled with the same letter are not significantly different at p < 0.05 level.
FactorsTreatmentsθsθrαnVDPMSSI
kg kg−1kg kg−1hPa−1 kg kg−1hPahPa−1
SoilAcrisol (Guder)1.04 a0.39 a0.083 b8.52 a0.405 b11.92 a0.034 c
Luvisol (Abagerima)0.96 b0.36 b0.088 a8.23 b0.453 a11.22 b0.042 a
Vertisol (Dibatie)0.92 c0.32 c0.089 a8.56 a0.385 c11.15 b0.036 b
Land
use
Crop0.83 d0.32 c0.082 b9.73 a0.285 d12.10 a0.025 d
Bush0.91 c0.32 c0.085 c8.04 c0.389 c11.59 c0.034 c
Grass0.96 b0.35 b0.087 b8.22 b0.402 b11.28 b0.036 b
Forest1.19 a0.43 a0.092 a7.76 d0.581 a10.75 d0.055 a
PAM
mg L‒1
00.96 b0.33 c0.079 c9.67 a0.359 c12.62 a0.029 c
250.98 a0.36 b0.088 b8.43 b0.412 b11.21 b0.038 b
2000.99 a0.38 a0.094 a7.22 c0.472 b10.46 c0.046 a
VDP: volume of drainable pores, MS: modal suction, SI: structural index, θs and θr: saturated and residual water contents, α and n: represent the location and steepness of the water retention curve.
Table 4. Stepwise regression analysis of the effect of soil properties on the structural index (SI), for the untreated (PAM 0) and PAM-treated (25, 200 mg L−1) samples.
TreatmentParametersp < FR2TreatmentParametersp < FR2
AllSOC0.0010.43PAM 0SOC0.0010.71
CaCO30.0010.62 CaCO30.0010.83
EC (or CEC)0.0780.64 pH0.0010.86
EC0.0080.89
CCR0.0020.92
PAM 25SOC0.0010.62PAM 200EC0.0010.56
mg L−1EC0.0010.79mg L−1Silt0.0010.88
CEC0.0280.80 SOC0.0010.90
CaCO30.1200.82 pH0.0010.93
Clay0.0010.95
Ca + Mg0.0740.97
EC: electrical conductivity, CEC: cation exchange capacity; SOC: soil organic carbon, CCR: clay to CEC ratio.
Publisher’s Note: MDPI stays neutral with regard to jurisdictional claims in published maps and institutional affiliations.

