1. Introduction
In the area of building energy systems, several different types of studies have investigated how to increase the systems’ performance in the viewpoint of energy use and human comfort. In order to determine optimized control rules, recent diversified thermal systems have investigated comprehensive statistical approaches, advanced metering methods, and data-driven matrixes derived from building thermal system operations and management. Many different operation methods for improving the performance of the Heating, Ventilation, and Air Conditioning (HVAC) systems were compared with each other through analyses of the numerical variables by adjusting the parameters, functions, and regression coefficients in their inner structures and matrixes. With complex statistics, controllers that adopt mathematical differential and integral models were developed for sensitive control of the amount, the pressure, or the speed of fuels for boilers, plants, and exchangers, especially for the rule-based energy generation and management systems [
1,
2,
3]. However, for the satisfaction of the recent enhanced regulations and guidelines for energy-saving and environmental protection, a more effective algorithm that dealt with huge data from numerous building operations and management was required.
As recent computing technologies have rapidly improved, the control methods have also become much more diverse and precise by adopting various statistical approaches. Amongst these, the Fuzzy Inference System (FIS), which can greatly help to quantify patterns of occupant behavior that can vary significantly depending on each individual, and the Artificial Neural Network (ANN), which can significantly help to create an improved regression model of operating data from several pieces of equipment, have often been used in the field of building science. The linguistic approaches of the FIS algorithm can assist to solve existing control rules in several situations where the sensitive decision for quantification is needed. In comparison with control errors between the mathematics and the FIS outputs, refined adjustments of node construction and networks were tested on control rules that have been made about control methods, which are mathematically necessary but may be unnecessary in practical use. The several combined methods in energy supply networks were investigated to improve the control accuracy to utilize fuel injection systems in boilers and distribution systems in building or district models [
4,
5,
6]. In addition to the several mathematically complex problems, the FIS’s linguistic logics that deal with complemented determination at ambiguous situations have been studied to take into account the existing control rules or genetic algorithms based on conventional thermal dynamics and physical experiments. In generating regression models from experimental data and simulated results, the FIS model complemented several outliers and control errors to conclude with higher effectiveness of the HVAC systems in many case studies, reflecting the distinct characteristics of locations, buildings, thermal systems, and occupants [
7,
8,
9].
While the FIS deals with improved deterministic methodology about direct processing of input values, the ANN, another major approach that is frequently used in building systems, has been mainly conducted to learn to define accurate regression models from various or long-acquired input values. The ANN system has helped many researchers to figure out their complex problems that have been difficult to understand in the past because several combined models utilizing a few polynomials in the process have become exponentially complicated, even if only a few variables or monomials are added. Especially, many source-efficient models have been generated in areas where time-consuming complex correlation analysis is required, such as radiation impact, air ventilation, and envelope infiltration [
10,
11]. It has successfully helped to examine combined node models in energy networks, which consist of the boiler, the plant, the heat exchanger, the damper, and the valve with topological approaches. For defining a system’s efficiency of comprehensive methods, combined control strategies of mechanical devices for heating and cooling were investigated from several data-driven analyses to respond to specific thermal factors connecting lab-scaled and true-sized systems. The combination of the FIS and the ANN algorithms was tested to improve the validity of regression models and the deterministic effectiveness by the use of multilayer structures. The combined models have been able to solve complex strategies that depend on the number of data and deterministic processes, such as combustion in power plants, friction loss in distribution networks, and kinetic façade in building envelopes [
12,
13]. As these approaches become available, many experimental models, including several outliers and technical errors, were investigated to define better-fitted models rather than one-directional analyses in the past. In such cases that deal with the control effectiveness of controlling the angle of the dampers and the temperature or speed for heating resistance coils, the data-driven multivariate regressions were effectively analyzed to promptly respond to the changes in thermal demands connecting several weather conditions and building characteristics [
14,
15].
On the other hand, several types of theory-based, experiment-based, survey-based, and simulation-based studies have been examined by means of various types of data derived from categorized characteristics of the occupants in the area of indoor thermal comfort [
16,
17,
18]. In addition to the subjective indices that reflect occupant responses, there has been a need to more objectively analyze subjective indicators that may be difficult to quantify. Among them, the Predicted Mean Vote (PMV) and the Predicted Percentage of Dissatisfied (PPD), which reflect the numerical variables, such as operative temperature, relative humidity, metabolic rate, and clothing insulation, are representative indicators. Despite of controversial for their predictive performance and handling of variables, the PMV and the PPD have been used in several fields due to their advantage of being able to quantitatively compute users’ comfort levels. In this area, the refined FIS membership matrix has been frequently conducted to define effective control strategies for improving thermal comfort levels, and the ANN algorithm has been adopted in the correlation analysis to improve the performance of specific thermal sensation votes based on traditional control or tuning rules [
19,
20]. Several possible hidden correlations between building geometries, thermal systems, and occupant characteristics were adopted to define better quantitative results in the studies that dealt with extreme weather conditions and unexpected climate change. In addition to the improvement of the mathematical models, the methods contributed to enhancing the validity of the environmental regulations and the design guidelines, including several components that seemed less relevant to each other [
21,
22]. Diversified control strategies adopting the fuzzy approaches were tried to assess the non-deterministic linguistic values derived from the qualitative aspects of human factors in the design phase. Various design scenarios were considered to define sensitive PMV levels influenced by numerous factors associated with human thermal sensation. Like several mechanical models, the genetic algorithms were developed for several activation functions, such as linear, piece-wise, sigmoid, and hyperbolic, to avoid ambiguous solutions and to improve their quantitative validity in various deterministic processes [
23,
24,
25]. During the process for increasing accuracy and responsiveness, co-simulation programs and plug-in applications were developed in controlling indoor thermal elements with immediate responses to users’ demands by means of the communication between simulation and programming language applications. Several energy efficiency measures also were investigated to complement mathematical and mechanical interpretations derived from complex architectural components, such as types or materials of walls and fenestrations, types of lighting equipment, and daily and weekly time schedules for working. Recently, through the use of multi-layered frameworks, some combined models were tested, reflecting timely design scenarios of architectural mechanical assumptions, and even human subjective responses to define the performance of various energy efficiency measures [
26,
27,
28].
Several studies for buildings’ thermal controls have investigated their system performance by improving control rules that prevent a possible increase in energy consumption, resulting in sensitive controls. Moreover, in addition to the typical outdoor temperature conditions, several actual experiments and virtual tests have continued to assume a variety of outdoor conditions to identify effective strategies that work effectively in unexpected outdoor temperature conditions. However, there were some weaknesses that made it difficult to provide optimized conditions of cooling air for a space scale in a period of extreme heat. This is because when a kind of outlier that extremely deviates from the data range used in learning is entered into the system, the regression model often does not work properly. In this study, a combined approach that controls the conditions of the supply air was proposed to define the model’s performance during a period of intense heat. In results and discussion, the proposed models are compared with a reference model by the indices of thermal comfort and energy use. In conclusion, the effectiveness of the proposed model is described, and some weaknesses are addressed for possible follow-up studies.
2. Methodology
2.1. Control Strategy
This study proposes a network-based adaptive model to control supply air conditions in response to the thermal demands by checking the changes in energy transfer and thermal comfort index in a heat intense area. In order to investigate change patterns, the proposed model finds correlations between the thermal demands and the energy supply. In particular, this model measures indoor thermal comfort level almost simultaneously as heat energy supply is determined, which is the criterion for determining the conditions of supply air for the next signal. If by the indoor environment built by the previous supply air conditions, the range of thermal comfort deviates from a setting value, the control is adjusted to reduce thermal dissatisfaction by immediately changing the setting value.
Figure 1 describes the schematic flow diagram for the supply air control by thermal demands and human factors, and the adaptive control by three serial confirmations of thermal comfort at each one-minute interval. For the supply air control, the condition of the supply air is determined by the amount of change in
Troom and Relative Humidity (R.H.), and the mean value of the three serial human factors at one-minute intervals are additionally reflected to correct
Tset. For this adaptive control for adjusting
Tset, for instance, if the mean value of the three serial PMVs is higher than the setting value for cooling (i.e., the occupant feels hot), the
Tset is lowered by −0.5 °C; if it is lower than the setting value for heating (i.e., the occupant feels cold), the
Tset is increased by 0.5 °C.
- (1)
The thermal transfer of a space in a small office calculates the cooling or heating energy transfer, responding to Tout for the optimized conditions of the supply air.
- (2)
As determination of the condition, the thermal transfer calculation model reads the Troom and values from the design scenario, including relative humidity, air speed, mean radiant temperature, metabolic rate, and clothing insulation.
- (3)
After calculating the PMV level at each time interval, if it is out of a designated setting range (i.e., more than −0.5 °C or less than 0.5 °C), an adaptive model adjusts the Tset as much as each setting value (decreasing −0.5 °C for cooling or increasing 0.5 °C for heating).
- (4)
After the adjustment, if the PMV level is still out of range, the adaptive comfort model additionally adds the value for Troom.
- (5)
In any phase, if the PMV value is within the setting range, the adaptive process stops without any adjustment for Tset.
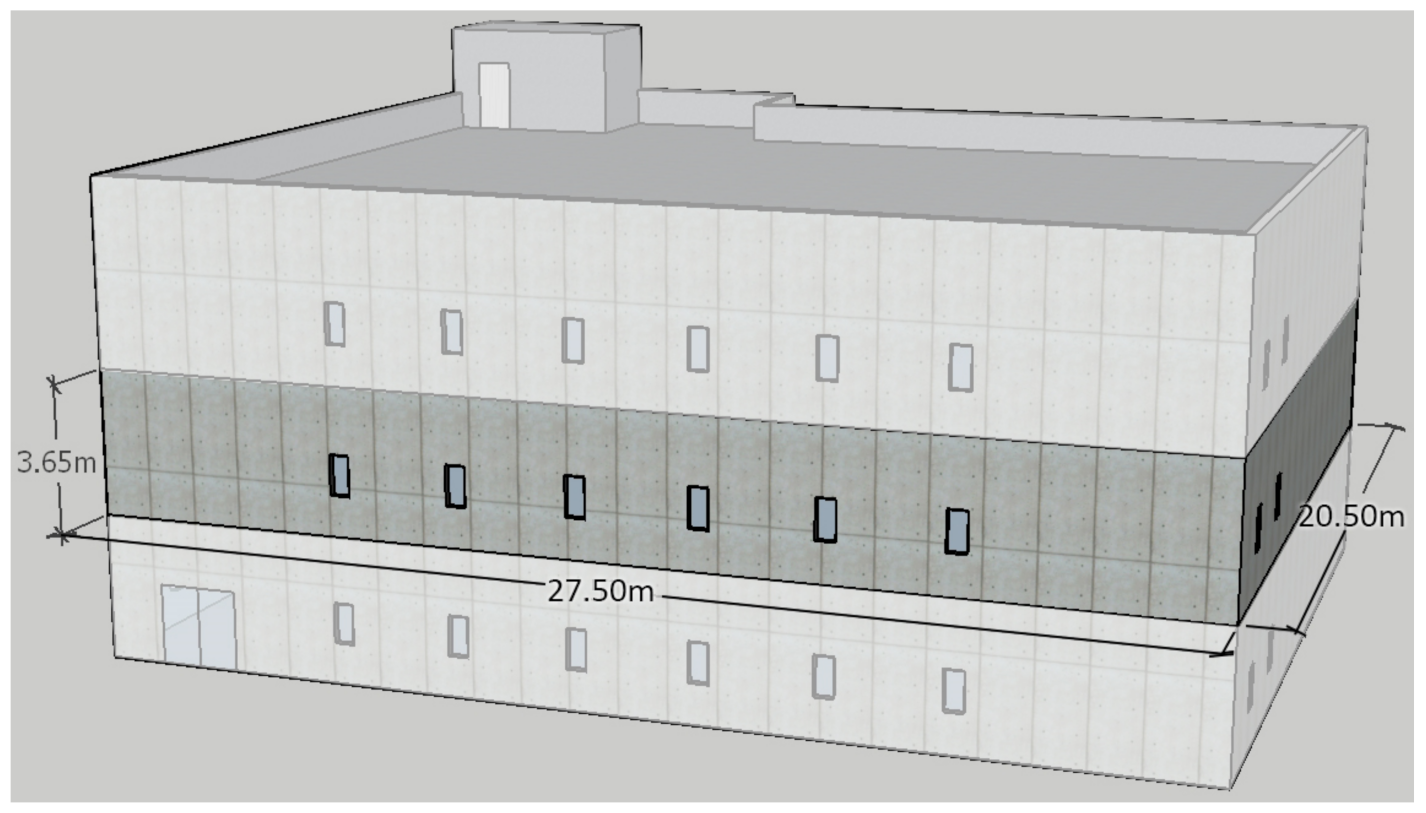
The change rate of air flow in pipes was known to be linearly proportional in most damper opening rates, so this control model of the amount of air assumed that the damper opening by the angle was the same as the amount of air. In addition to this simulation rule, the heat transfer was assumed to occur only through the conduction of exterior walls, roofs, and penetrations. Additionally, the amount of the heat gain did not include sensible or latent heat of any internal loads. In order to save simulation resources, air leakage, and infiltration between envelopes and duct systems, pressure variations as point locations in the space were neglected. Based on these rules, initial configuration values and building geometries for constructing this thermal model are shown in
Table 1. Except for the three fixed values of the external work, the relative humidity, and the air velocity were adopted from the Energy+ simulation template, and it was assumed that the mean radiant temperature (every one-minute interval mean value of
Troom and
Tout) followed the indoor temperature. Other design parameters were adopted from the American Society of Heating, Refrigerating and Air-Conditioning Engineers (ASHRAE) standards and the Engineering Toolbox guidelines.
Based on the geometry conditions, a conceptual office building model was built via computing apps of OpenStudio and SketchUp, and it is shown in
Figure 1. A schematic diagram of what control process the indoor thermal environment of this building model follows is described in
Figure 2.
2.2. Principles Used for Thermal and Comfort Models
According to the thermodynamics, the thermal energy transfer of a room is given by [
29]
where
Qloss is the heat transfer from a room to outside and
Qgain is the heat transfer from a heater to a room.
U is the internal energy and
t is the time.
By using the rules of thermal conduction,
Qloss, as its energy loss, is given by
where
and
are the heat transfer coefficients,
is the transmission coefficient,
is the area, and
is the depth of envelope components.
From the mass flow rate and enthalpy, assuming that there is no work in the system, the thermal energy gain of room,
, is given by [
29]
The rate of internal energy is given by
Regarding the equations above, the time derivative of
Troom is obtained by
The Predicted Mean Vote (PMV) developed by P.O. Fanger is commonly used for quantitative analysis for indoor thermal comfort, and the Predicted Percentage of Dissatisfied (PPD), derived from the PMV, is defined by the equation below [
30,
31]:
where
M is the metabolic rate, and
L is the thermal load.
In addition, the thermal load,
L, is given by
where
qmet,heat is the metabolic heat loss,
Tcl is the average surface temperature of a clothed body,
fcl is the ratio of clothed surface area to DuBois surface area,
Ta is the air temperature,
hc is the convection heat transfer coefficient,
Tr is the mean radiant temperature,
hr is the radiative heat transfer coefficient,
Wa is the air humidity ratio, and
Wsk is the saturated humidity ratio at the skin temperature.
These two equations are used to detect the thermal comfort levels for buildings. Furthermore, the PPD levels are defined by an exponential function of the PMV, as below [
30,
31]:
2.3. Principles Used for Control Models
The thermostat works according to a typical dead-band setting, ± 1 °C. For instance, in a cooling process, if the Troom is 1 °C higher than the Tset, the thermostat sends an off-signal to the thermal supply model working. If the Troom continues to lower and is 1 °C lower than the Tset, it sends an on-signal to the thermal supply model.
The FIS model was utilized as a comparison group to define the performance of the proposed model. The FIS algorithm determines the optimized conditions of the supply air, which reflects the difference between the
Tset and
Troom, like the thermostat model. The equations below simply explain a membership function for two input variables. the difference between
Tset and
Troom (
E) is utilized for defining a derivative of the difference
(ΔE) [
32].
For using these two variables, (
E) and (Δ
E), the first-order Sugeno algorithm works according to
x (
E) and
y (Δ
E) and the fuzzy IF-THEN rules below [
32].
The fuzzy membership functions work by the two inputs
x and
y, which reflect a triangular function for
x and
y. According to a specific range from
a to
c, the triangle membership function
or
is given [
32].
where (
ai, bi, ci) is the set of parameters that, in the layer, are referred to as premise parameters, which reflects a triangular membership function.
In the triangular membership functions, two output variables for the mass flow rate and its temperature uses the range of a maximum equal to 1 and a minimum equal to 0. It means that, for controlling the amount of supply air, “0” represents 0% opening, and “1” represents 100% opening. Likewise, for controlling the temperature of supply air, “0” represents 0 °C, and “1” represents 10 °C.
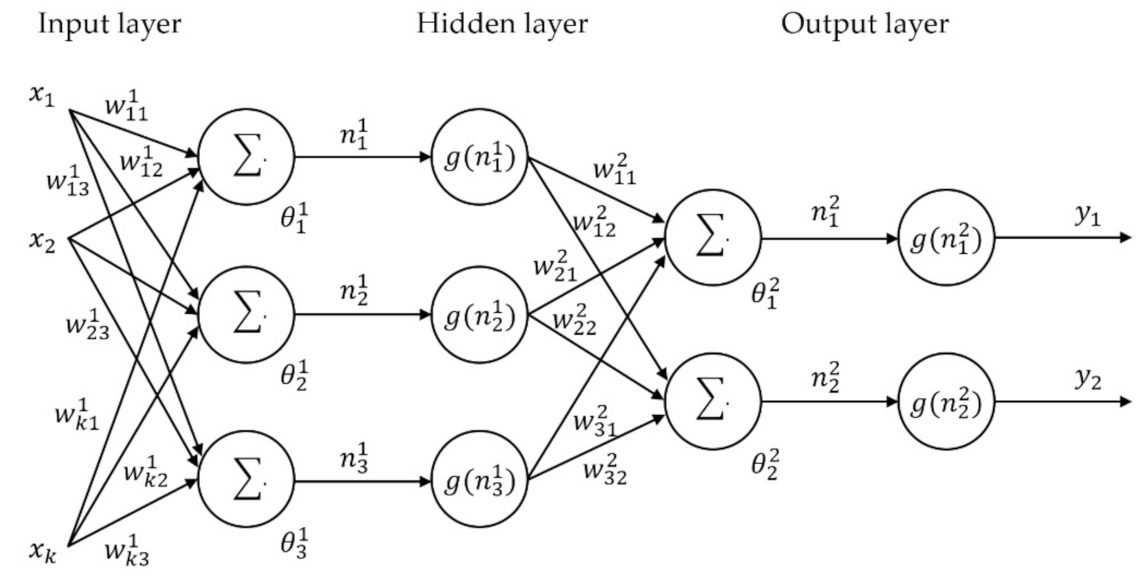
The ANN algorithm typically has large sets of structures by nodes and flows for its entire structure. In this study, it consists of two input layers, ten hidden layers, and one output layer. In Equation (13), the inputs,
x1, x2, and
xk, to the neuron are multiplied by weights
wki and summed up with the constant bias term
θi, and the resulting
ni is the input to the activation function
g [
33,
34]. After the results are updated, this network calculates the gradient of errors [
33,
34].
The conceptual diagram of the artificial neural networks is depicted in
Figure 3.
The ANN algorithm reflects two inputs of E and ΔE from the thermostat controller, and two separated ANN models define the amount of supply air and the temperature of the supply air, respectively. Then, the results are independently trained to define optimized patterns for the amount and the temperature that can maintain the Troom within the PMV comfort settings. For this training, a scale conjugate gradient algorithm is used. Then, in order to get high enough statistical validation, the iteration process for the training continues up to 1000 times in association with energy use and thermal comfort responding to Tout. The number of the iteration is repeated a maximum of 10 times as one epoch. After the typical training process, the R2 values were confirmed as 0.99230 for controlling the amount of the supply air and 0.99088 for controlling the temperature of the supply air, respectively.
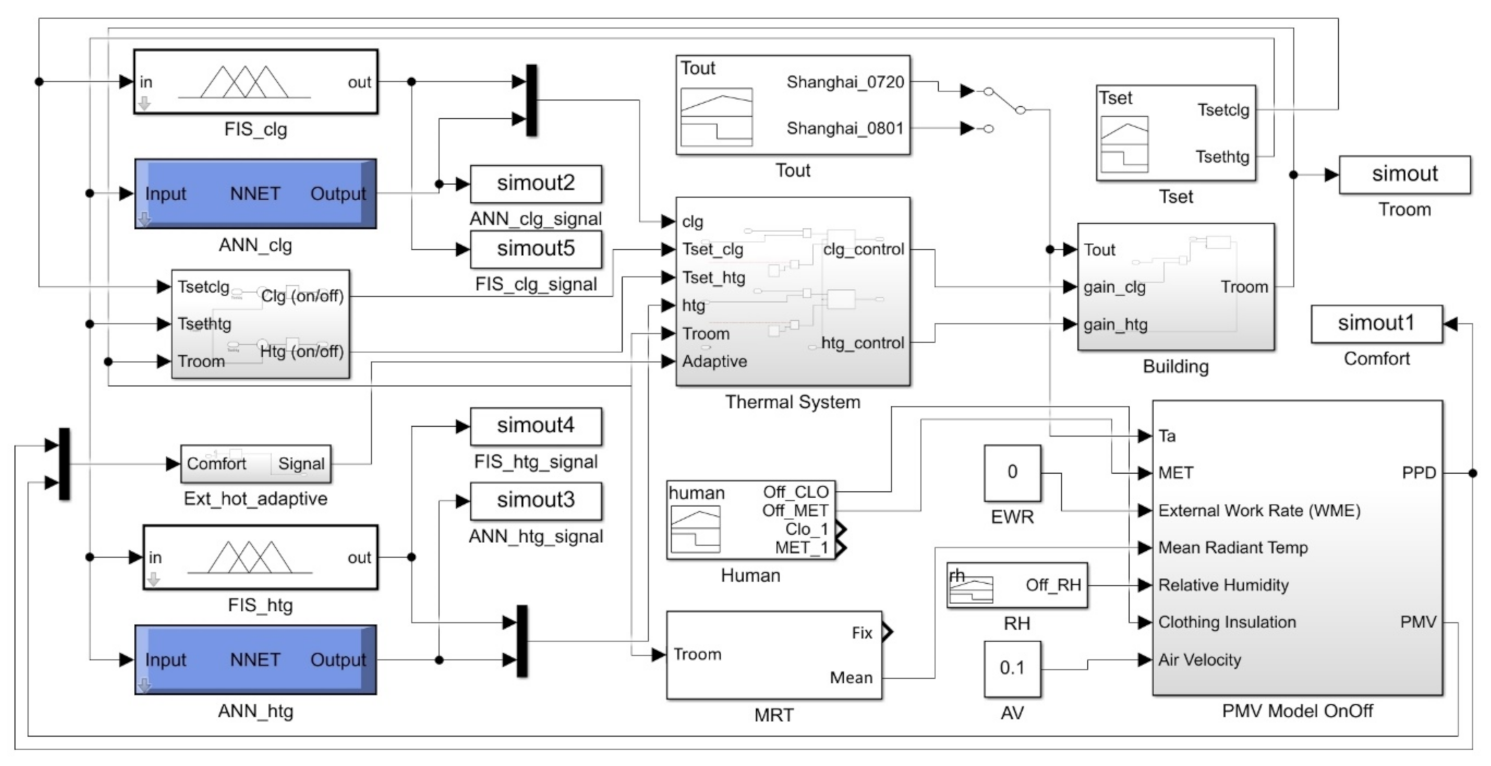
2.4. Concept of a Simulation Model
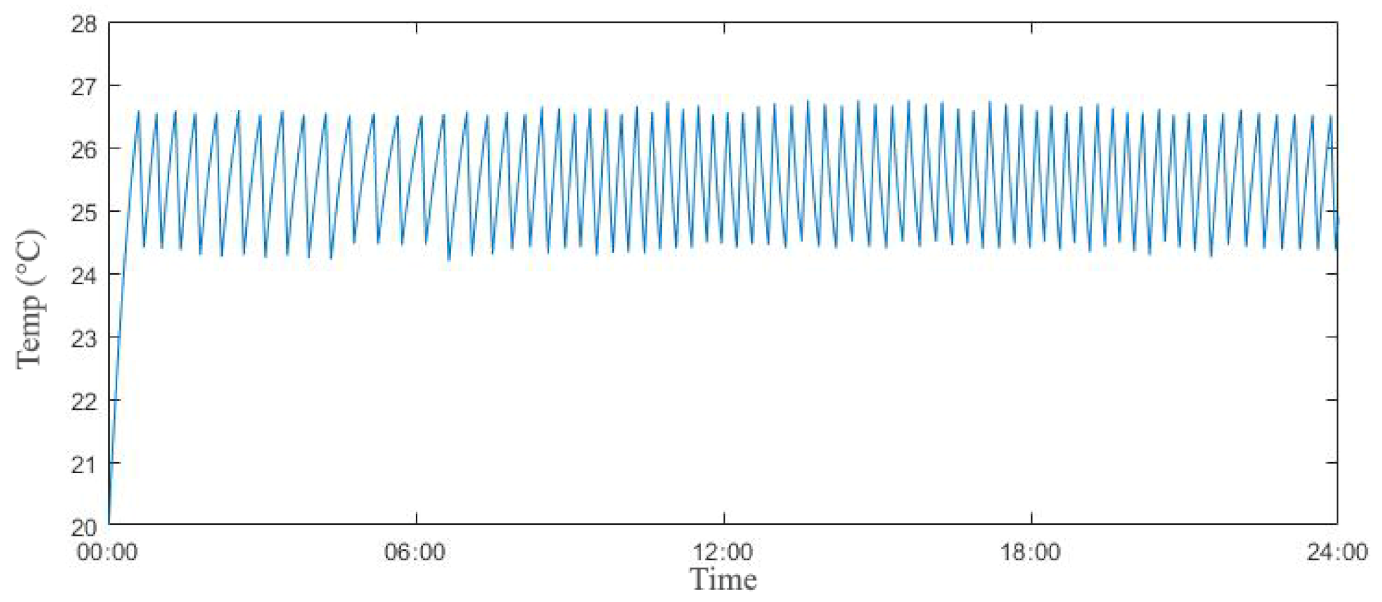
Figure 4 displays a conceptual simulation block diagram where the heat transfer is caused by the temperature difference between inside and outside, and the thermal system sends the two different conditions of cooling or heating supply air to maintain the
Troom within the
Tset. As previously mentioned, the PMV value is calculated every one minute, and the adaptive controller sends signals of ±0.5 to adjust one or both sides of the range of the
Tset in the thermal model, based on the result values from the PMV model. After completion of this process to reduce thermal dissatisfaction levels, the process of re-reading the newly adjusted conditions of the supply air and the PMV values in a feedback cycle is carried out in the next one-minute interval.
4. Discussion
Table 2 summarizes the results of two different thermal comfort indices and their efficiency, as compared to the thermostat model. Because the PMV levels, in principle, proceed on both sides on a zero basis, the Root Mean Square Error (RMSE) was used to avoid ambiguity in determining each performance for the PMV. The FIS model was 4.4% more efficient than the thermostat, but, on the other hand, the ANN model shows quite high performance, unlike the thermostat, by 15.5%. In the case of the PPD, the efficiency difference widens more. Unlike the PMV for the FIS, there was a slight improvement in performance compared to the thermostat, but for the ANN, the efficiency was significantly improved by as much as 29.3%. This difference in indoor thermal comfort may affect the productivity and workability of employees in commercial offices, so comprehensive studies need to be performed for the quantitative assessment in this economic aspect.
Assuming the building space type is a commercial office, the metabolism rate and clothing insulation were fixed at 1, resulting in a relatively high level of dissatisfaction. Not only the PMVs’ but also other thermal sensation indicators’ weaknesses have been identified even in various adaptation models. In addition to the accuracy issue of the PMV prediction, there is the need for a correction of indicators and improved data handling in relative humidity, air speed, and clothing insulation. Sufficient data collection and analysis of how the indicators change depending on the type or the size of the building could be required. Therefore, in follow-up studies, a more refined model will be performed to complement the conventional PMV model through adaptive modules that reflect hidden correlations between quantitative and qualitative variables.
As a common index, the energy transfer was used, and
Table 3 summarizes the results derived from the three different control models. It was confirmed that the FIS and the ANN achieved over 48% and 30% efficiency, respectively, unlike the thermostat. Unlike the results of the thermal comfort, the difference of the efficiency as clear numbers can be converted into the economic value by energy savings. In terms of heat transfer alone, the FIS model has been identified as the improved performance. However, the FIS model responds to limited parameters entered simultaneously during each simulation cycle, such as temperature differences, humidity, and the PMV indices derived from fixed thermal factors, so its efficiency was identified in terms of a single determination process. Considering comprehensively that it was a result of precise control to consistently maintain its thermal comfort, it can be concluded that controlling the energy consumption of the ANN models also showed effective results.
In
Figure 12 and
Figure 13 for the FIS, and
Figure 14 and
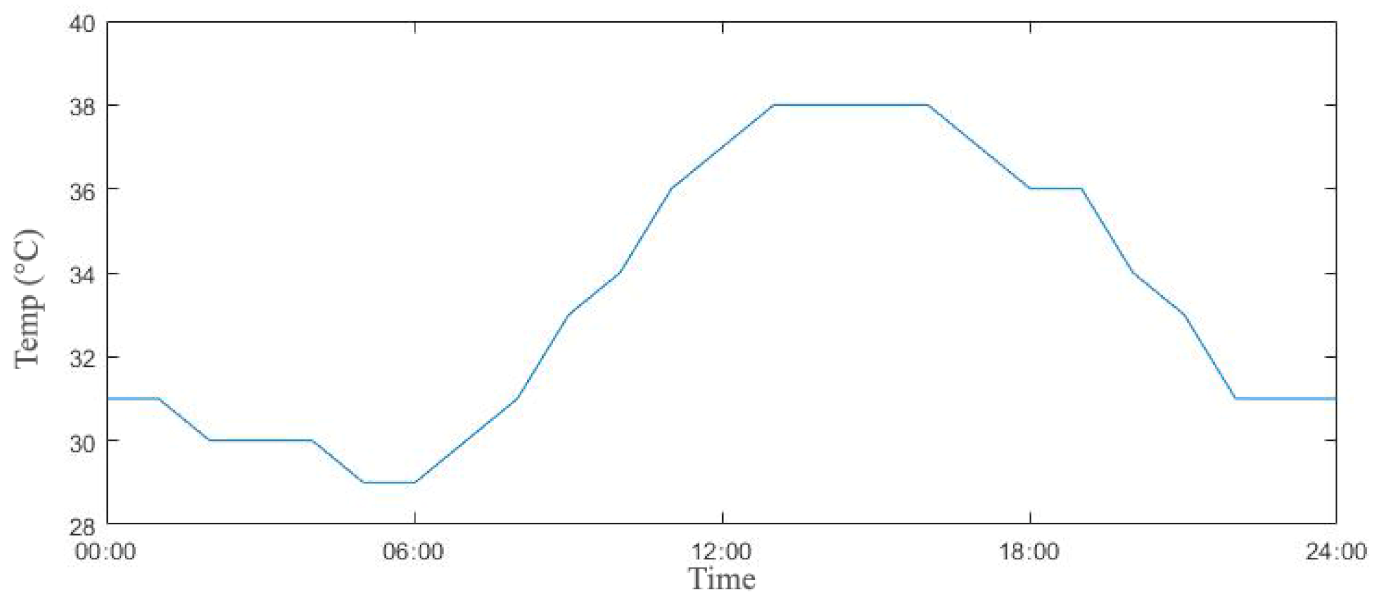
Figure 15 for the ANN, the two control patterns show quite complex changes as compared to the thermostat. For the ANN, except for the range where the graph patterns of relatively smooth curves from 02:00 to 09:00 were identified. In particular, the ratio was controlled by the entire range from 0 to 100% in the conditions of over 33 °C
Tout from 09:00 to 17:00. In specific time ranges, the temperature of the supply air was further lowered to control the
Troom, despite a 100% opening. This implies the fact that, in the case of over 36 °C
Tout, there are some ranges where the maximum energy of the system needs to be used to reduce thermal dissatisfaction. This proves that even though the energy consumption by the ANN model is less than that of the thermostat in most time ranges, its efficiency appears relatively low as compared to the FIS.
Regarding the results, in favor of the precise design for the capacity of the system for cooling in the hot area, the ANN model can be effective. That is because it can abate the increases of possible overshoots and peak demands to optimize the mass and temperature simultaneously at relatively high outside temperatures, especially, over 32 °C. In addition, the figures and tables indicate that the FIS model that deals with a deterministic algorithm in ambiguous situations did not operate properly if it detected situations in which inefficiency is caused by primary decisions, and signals a rebalancing of internal signals. However, in the case of the ANN, in addition to the effective signal patterns to lower energy consumption, it can be confirmed that it also worked properly with interventions in the adaptive controller, regarding users’ thermal comfort. Therefore, it can be assumed that, in newly designed situations of indoor thermal environments, the ANN algorithm can be significantly improved by the simple additional installation of auxiliary systems to supplement the existing control, without replacing the existing system or operational framework overall. However, since the control patterns have already been learned with results from the Energy+ simulation data, there are some challenges in identifying the correlations between some major variables, such as mean radiant temperature, ventilation, and occupancy. This aspect can derive the weakness that certain values do not have a clear engineering basis because they are not computed with equations of scientific thermodynamics but are based on the learning results of ANNs. Naturally, however, it is the method of Machine Learning and the ANN that is used when it is not possible to reveal clear engineering correlations in such real-time data.
5. Conclusions
By comparative analyses, the performance of three distinct thermal control models were investigated for how to optimize the conditions of supply air to effectively reach within the setting values. For the design, combined simulation models that consist of energy, comfort, and adaptive modules were proposed, and it was confirmed that they were able to maintain indoor temperatures within setting ranges and thermal comfort levels. The proposed network-based model properly improved control performance from 15.5% to 29.3% in thermal comfort, and over 30% in energy efficiency, as compared to two different logic models.
Consequently, the network-based model with the additional adaptive controller immediately calculating thermal comfort levels efficiently works to improve both the energy efficiency and the thermal comfort. This improved performance derived from a neural network algorithm and an adaptive control scheme can be significant in places such as office buildings, train station complexes, airport terminals, and general hospitals, where many spaces are woven at a high density. However, there were some weaknesses that some major variables in thermal and comfort models were assumed as fixed values, and there is a lack of analysis on the correlation of the variables used for the learning of the ANN model. That is one of the reasons that the analytic comparison was not able to address how the control signals and their patterns were built. Thus, a follow-up study will be conducted for realistic thermal comfort by applying comprehensive scenarios and actual observed data based on the characteristics of their use of space to identify the correlations between thermal and human factors. At the same time, experimental methods will be sought to apply to actual systems in real buildings.


