Article

Research of the Disparities in the Process of Revitalization of Brownfields in Small Towns and Cities

1
Department of Spatial Planning and the Environment, Karvina City Authority, Frystatska 72/1, 733 24 Karvina, Czech Republic
2
Department of Urban Engineering, Faculty of Civil Engineering, VSB—Technical University of Ostrava, Ludvika Podeste 1875/17, 708 00 Ostrava-Poruba, Czech Republic
*
Author to whom correspondence should be addressed.
Sustainability 2021, 13(3), 1232; https://doi.org/10.3390/su13031232
Submission received: 27 November 2020 / Revised: 15 January 2021 / Accepted: 21 January 2021 / Published: 25 January 2021
(This article belongs to the Special Issue Civil Engineering as a Tool for Developing a Sustainable Society)

Abstract

:
The subject of the work is the research on relevant factors influencing participation in the success of brownfield revitalization, especially in the territory of small municipalities. Research has so far dealt with the issue of determining disparities in the municipalities of the Czech Republic, not excluding small municipalities, but their subsequent application has usually been presented in larger cities. The focus on smaller municipalities or cities was usually addressed only in general. The introduction provides an overview of theoretical knowledge in the field of brownfield revitalization. Defining the level of knowledge of the monitored issues is an essential step for the purposes of more effective determination of disparities. Disparities will be determined on the basis of information on localities that have been successfully revitalized. The identified disparities are then monitored in the territory of small municipalities. For the purposes of processing, it was determined that a small municipality or city is an area with a maximum of 5000 inhabitants. Using appropriately selected statistical methods, an overview of disparities and their weights is determined, which significantly affect the success of revitalization. In small municipalities, the issue of brownfields is not emphasized but, in terms of maintaining community strength and reducing population turnover, the reuse of brownfields is a crucial theme.

1. Introduction

The importance of brownfield regeneration is closely connected with the protection of the agricultural land fund and the open landscape, which is one of the exhaustible and usually nonrenewable resources. One of the possibilities of preserving greenfield sites is the reuse of so-called brownfield sites (i.e., areas, buildings, and land) that are no longer used today, abandoned, usually burdened by a certain degree of contamination and affected by the original purpose of use [1,2]. Most of them are located on very lucrative lands in the built-up area of towns and villages. They thus become one of the elements limiting the development of the territory, and their existence usually contributes to creating a negative view of the city as a whole, mainly due to their negative characteristics, but also in terms of various accompanying aspects related to them, such as socio-pathological phenomena, crime, rising unemployment and other social, economic and environmental phenomena [3]. However, the use of these brownfields can lead to a reduction in the amount of unproductive dilapidated real estate and at the same time to an influx of new investors, but above all to the preservation of greenfield sites [4].
The term brownfield is not enacted in the Czech legislation, as is the case in many other countries of the European Union. In the Czech Republic, a definition from the National Brownfield Regeneration Strategy can be given: “A brownfield is a property (land, building, area) that is underused, neglected and can even be contaminated. It arises as a remnant of industrial, agricultural, residential, military, or other activities. Brownfield cannot be used properly and efficiently without a process of regeneration.” [5].
For comparison, the Czech definition is supplemented by the American definition according to the Environmental Protection Agency (EPA) organization: “brownfields are abandoned, empty, unused industrial or commercial areas, where their original use has caused some contamination, where there is potential for regeneration. They typically include old industrial bodies of water, abandoned mines, former railway stations, abandoned gas stations and former treatment plants” [6].
In the territory of small municipalities, the process is complicated by the more limited possibility of obtaining subsidies. Currently, this trend is beginning to reverse and the mayors of municipalities make extensive use of these financial resources. The fact that the revitalization of small municipalities in the eyes of the public is often described as a success for a larger territorial unit (for example, successful revitalization in a small town is described as a success for a regional city or a territorially close large city) was found to be a major shortcoming. The main goal of the CircUse project, for example, was to support the sustainable development of the area and at the same time protect the environment by supporting the reuse of areas that are no longer in use today, brownfields, in favor of protecting the land fund. It proposes the recycling of areas as an option for the protection of the agricultural fund [7,8,9,10].
Much revitalization has been carried out in the territory of small towns and these are often successful projects, usually of a small scale, but they are essential for the development of the municipality. The issue of brownfield regeneration is becoming of interest in smaller municipalities, and so, for example, agricultural brownfields have already become part of the open landscape in many places and residents have become accustomed to their existence close to home [11,12,13].
In the existing literature, indicators are used for the evaluation of municipalities, which usually verify their potential development and relationship to a healthy environment. For the evaluation of brownfield areas, the evaluation of the suitability of the locality for subsequent revitalization is often missing.
Many authors consider that the most effective way to revitalize a brownfield area in the territory of small municipalities for community purposes is by multifunctional buildings, which are used throughout the year for leisure, social and cultural activities, sports activities, rest and the education of children for all residents, without distinction [14,15,16,17,18,19,20,21,22,23]. The implementation of community centers in abandoned buildings, especially in small villages and towns, is popular in the USA and Canada.
In the last ten to fifteen years, with a change in the lifestyle of the population and a change in the approach to nature protection, a large number of associations and organizations are being established which are actively involved in the process of revitalizing abandoned buildings. These do not have to be private individuals, but can also be organizations that are backed by large municipalities. Reduced space rental costs create a large number of small businesses that are set up only for a limited time until the founder secures sufficient resources for further development. This is one of the new approaches to the temporary use of resources, because it is always more appropriate to use the resource at least partially than to leave it abandoned.

2. Materials and Methods

From available sources, it was found that the relationship between disparities and the process of brownfield revitalization has not been comprehensively addressed. Many authors [24,25] use the term disparity as a synonym for the term indicators. Indicators are commonly discussed in strategic documents, territorial analysis documents and other documents related to territorial or regional development. It follows from the definition of disparities that it is not a synonym for the term indicator, but often the two terms are confused. In general, disparities are evaluated negatively, but their identification can also lead to positive results, which can describe the significance and potential of, for example, the project in relation to others [24].
Most authors deal with the issue of disparities within the following definition of the word—in general, disparities mean inequalities or differences. Some authors address regional disparities as a multidisciplinary issue that can become a major obstacle to achieving sustainable development goals [24,25,26]. The methodology and scope of disparity detection depends on the purposes for which the research results will be subsequently used. First of all, it is necessary to perform an analysis and then the creation of a list of the most important disparities that can subsequently motivate specific authorized entities to propose possible variants of the approach to the monitored issues. Disparity is “any difference or inequality, the identification and comparison of which makes some sense (social, economic, political, etc.)” [24]. Disparities accompany every development project, in every territory and are variable over time. Disparities can be influenced or unaffected. Identified disparities usually have the following characteristics:
  • cognitive: represents an overview of information on monitored attributes;
  • motivational: based on the findings, can lead to the motivation of the competent authorities to correct, to take action;
  • operational: based on the information obtained, it is easier to respond to the ever-changing situation;
  • decision-making: it is easier to make a decision based on the information found [24].
The countries of the European Union also face regional disparities, which are often influenced by the approach to solving them in individual member states. In many countries, regional policy is perceived as a national problem, not a single region problem. The approach to the solution and evaluation of regional disparities on the scale of the countries of the European Union is not focused only on individual regions and their specific disparities, but is taken into account from a broader national and international perspective. This makes the region competitive and supports economic growth in all countries of the European Union [24].

2.1. Research Target

The goals of the research were determined on the basis of the shortcomings identified during the process of searching for current knowledge of the issue, the experience resulting from previously implemented projects, and the needs of municipalities. The main goal of the research is to determine the disparities affecting the success of brownfield revitalization, especially in small municipalities and cities, and then assess the data using appropriate statistical methods.
The subobjectives of the research include, in particular:
  • evaluation of the current state of the monitored issues;
  • overview of disparities and determination of significance weights;
  • evaluation of data obtained from statistical methods.
The subobjectives are met through the following procedure:
  • an overview of successfully revitalized brownfield sites which took place more than five years ago (municipalities with less than 5000 inhabitants);
  • defining relevant indicators (disparities) that significantly affected regeneration;
  • selection of small municipalities (including an overview of successfully revitalized brownfield sites) based on criteria and knowledge of the current state of the monitored issues;
  • determination of disparities affecting the success of revitalization and subsequent comparison of data, with data identified in the initial phase of research;
  • using an appropriately selected statistical method to establish an overview of relevant indicators;
  • evaluation of disparities and determination of their significance in the revitalization process;
  • proposal of a suitable approach to the decision-making process in the field of brownfield regeneration.
In the initial phase of the research, data were collected from publicly available sources. Subsequently, at least 10 successful projects were selected, which were implemented approximately five years ago, regardless of the size of the municipality and country of origin. The disparities that contributed most to influencing the success of these projects were monitored. Then, at least 10 revitalized brownfield sites in selected small municipalities were selected. The identified disparities were subjected to graphical and statistical evaluation, the result of which is the evaluation of which of these disparities are the most significant (and, respectively, the least significant) in the process of brownfield revitalization. An equally important part of the work was the evaluation of the approaches of small and large municipalities to the monitored issues. In the final phase of elaboration, a document was created, the main purpose of which was to create a practical methodological guide for the decision-making process for representatives of small municipalities and cities to help assess the potential of individual areas.
For more effective knowledge of the monitored issues and verification of the suitability of the model, the following research questions were defined, which were tested during the research. Based on the obtained results, it will be possible, for example, to express the potential of small towns and municipalities as areas suitable for investment.
  • What kind of financing prevails in the process of brownfield revitalization in small municipalities?
  • Which attributes (disparities) most influence investors in the investment decision-making process?
  • Is the process of brownfield revitalization more demanding in the territory of small municipalities? If so, can this be expressed through disparities?
  • Are there differences in indicators (disparities) in the process of brownfield revitalization in large and small municipalities?
  • Is there a direct link between the success of brownfield revitalization and the size of the municipality in which the site is located?

2.2. Data File Sources

Determining a clear database was a key part of the research. Many portals of regions, cities, municipalities, and various organizations provide data that had to be clearly grouped, modified, and supplemented so that they could then be used appropriately for analysis. All data came from publicly available servers and additional information was found on the portals of municipalities, the Czech Surveying and Cadastre Office, and data from the Czech Statistical Office.
For analyzes where the population was taken into account, Prague (the capital city of the Czech Republic) was not included, as the results could be skewed. Municipalities with a larger population are more concerned with brownfields, and therefore the scope of information is more extensive. They are given greater importance in places where they pose a major problem or obstacle to the development of the area, such as an environmental problem due to their contamination, and municipalities therefore consider it necessary to deal with these sites effectively. In summary, it can be said that the approach of individual municipalities is similar. For now, they are becoming acquainted with the term brownfield and do not attach much importance to it. The analysis of individual territorial analytical data shows that many municipalities do not deal with the issue of brownfields at all. For the purposes of analysis and further use of information, GIS applications are very helpful, which provide more specific, especially topographic, information about localities. However, there are very few municipalities that can financially provide such a service, specifically four out of a total of 38 investigated municipalities with extended powers (Most, Karviná, Ostrava, Ústí nad Labem).
Table 1 shows an excerpt from the authors’ prepared database.

2.3. Data Processing Methods

Based on the available data, it is clear that a substantial part of the research methods consists of so-called exploitative (descriptive) statistics. Using these statistics, the obtained data were clarified for their subsequent application in other more sophisticated statistical methods. For the purposes of determining disparities in the territory of small municipalities and cities, the method of field research was essential.
An important method for this research is regression analysis, which allows the determination of the dependence between individual (quantitative) variables, independent (explanatory, i.e., cause) variables, and dependent (explained, consequence) variables—in this case the dependence of regeneration time on distance from the village center. Another method used is ANOVA (analysis of variance), to compare several mean values of independent random samples—in this case Population, Distance from the city center, Distance from a major road, Distance from the railway and Distance from the state border. Within the research related to the size of municipalities, multicriteria analysis was also used, one of the most used types of analysis of qualitative and quantitative criteria on a given problem. These statistical methods were also supplemented by the χ2 test of independence in the contingency table, which serves to evaluate the dependence of the obtained results, or by refuting the assumed hypotheses.
For the purposes of graphical analysis, MS EXCEL 2016 was used; with the extension of the 3D Maps module, data supplemented with GPS coordinates can be imported into the prepared map data. Unfortunately, data containing information on the location of individual objects are among the basic shortcomings of almost all records of brownfield sites, and for this reason it was necessary to find at least their approximate location in all localities. This process was very lengthy and demanding, and it was often only stated that the site was located in a certain region, and on which street it lay, so it was necessary to use the possibilities of google.maps.com and ortho-photomaps, and to view the site via StreetView to find GPS coordinates. The set of all acquired, modified, and supplemented data was subsequently processed using STATISTICA® and r-studio software tools.

3. Results—Application of Statistical Methods

Graphical and statistical analysis of the input data was performed using the application of statistical methods to the created data file. Although the possibilities of using many other statistical methods are unlimited, it is necessary to take into account not only the nature of the available data, but above all what the desired solution is and what is to be explained.

3.1. Graphic Analysis of Input Data

Through the Historical Lexicon, which is published in [27], the analyzed data were also supplemented by data on the population in the respective previous years, i.e., in 1980, 1991, 2001 and 2017. This analysis was performed to evaluate the generally accepted theory, which states that the existence brownfield sites in municipalities is resulting in a rapid decline in population, see in Figure 1.
Below is a part of the graphical data analysis, prepared on the basis of documents from the portal www.brownfieldy.eu [29], which is managed by CzechInvest. This source is one of the most important, because it includes a database for the entire Czech Republic. It is divided into a public and a non-public section, and it is necessary to log in to the nonpublic part using a username and password. The data are current as of 2017. The data are continuously supplemented and updated. In the modified database, for the purposes of this research, the following indicators were selected for the source [29]:
  • number of buildings in municipalities in 1980, 1990, 2001, and 2017;
  • the difference in the number of buildings in municipalities between 1980, 1990, 2001, and 2017;
  • population in 1980, 1990, 2001 and 2017;
  • population difference between 1980, 1990, 2001, and 2017;
  • name of the municipality;
  • site name;
  • name of the cadastral area;
  • area of cadastral territory;
  • built-up area in the cadastral area;
  • number of objects located in the cadastral territory;
  • built-up area of the site;
  • number of objects in the locality;
  • site area;
  • GPS coordinates;
  • use of the site;
  • area/cadastral area;
  • built-up area/number of buildings;
  • area of cadastral territory/number of objects;
  • population/number of buildings.
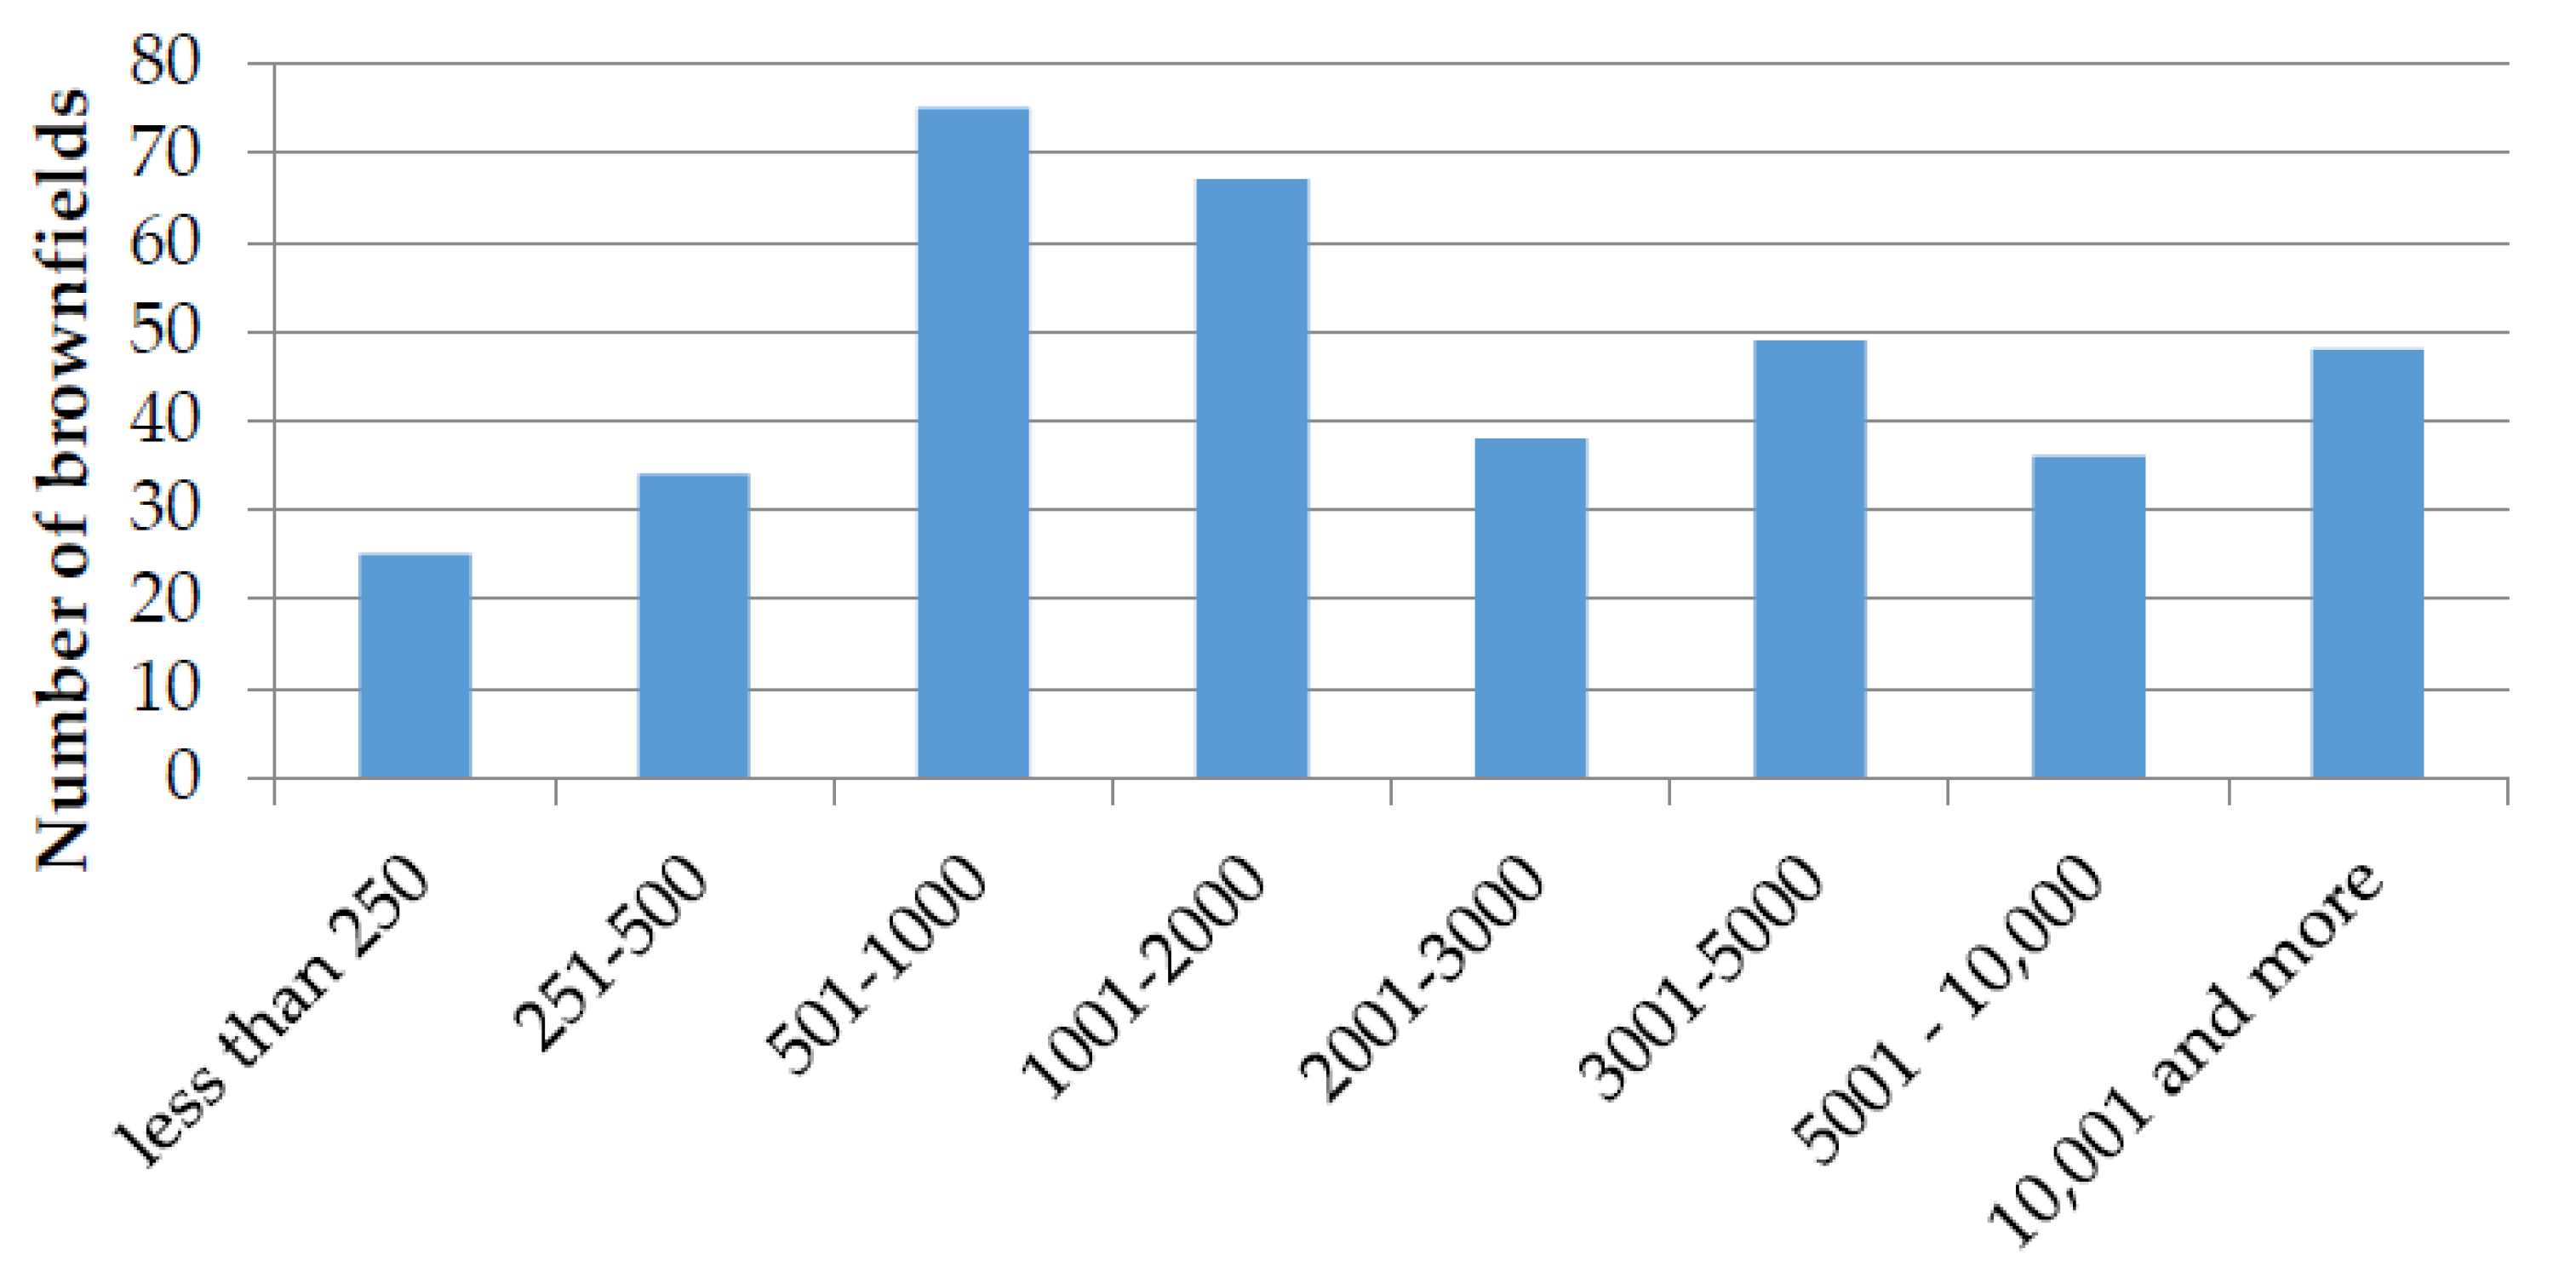
Out of the total number of 450 localities, it was evaluated that 258 localities are located in municipalities with less than 5000 inhabitants, which in percentage terms is 58%. In municipalities with less than 10,000 inhabitants, there are 331 localities, which in percentage terms is 74%. The assumption that most brownfield sites are located in small municipalities has been confirmed and can be seen in Figure 2.
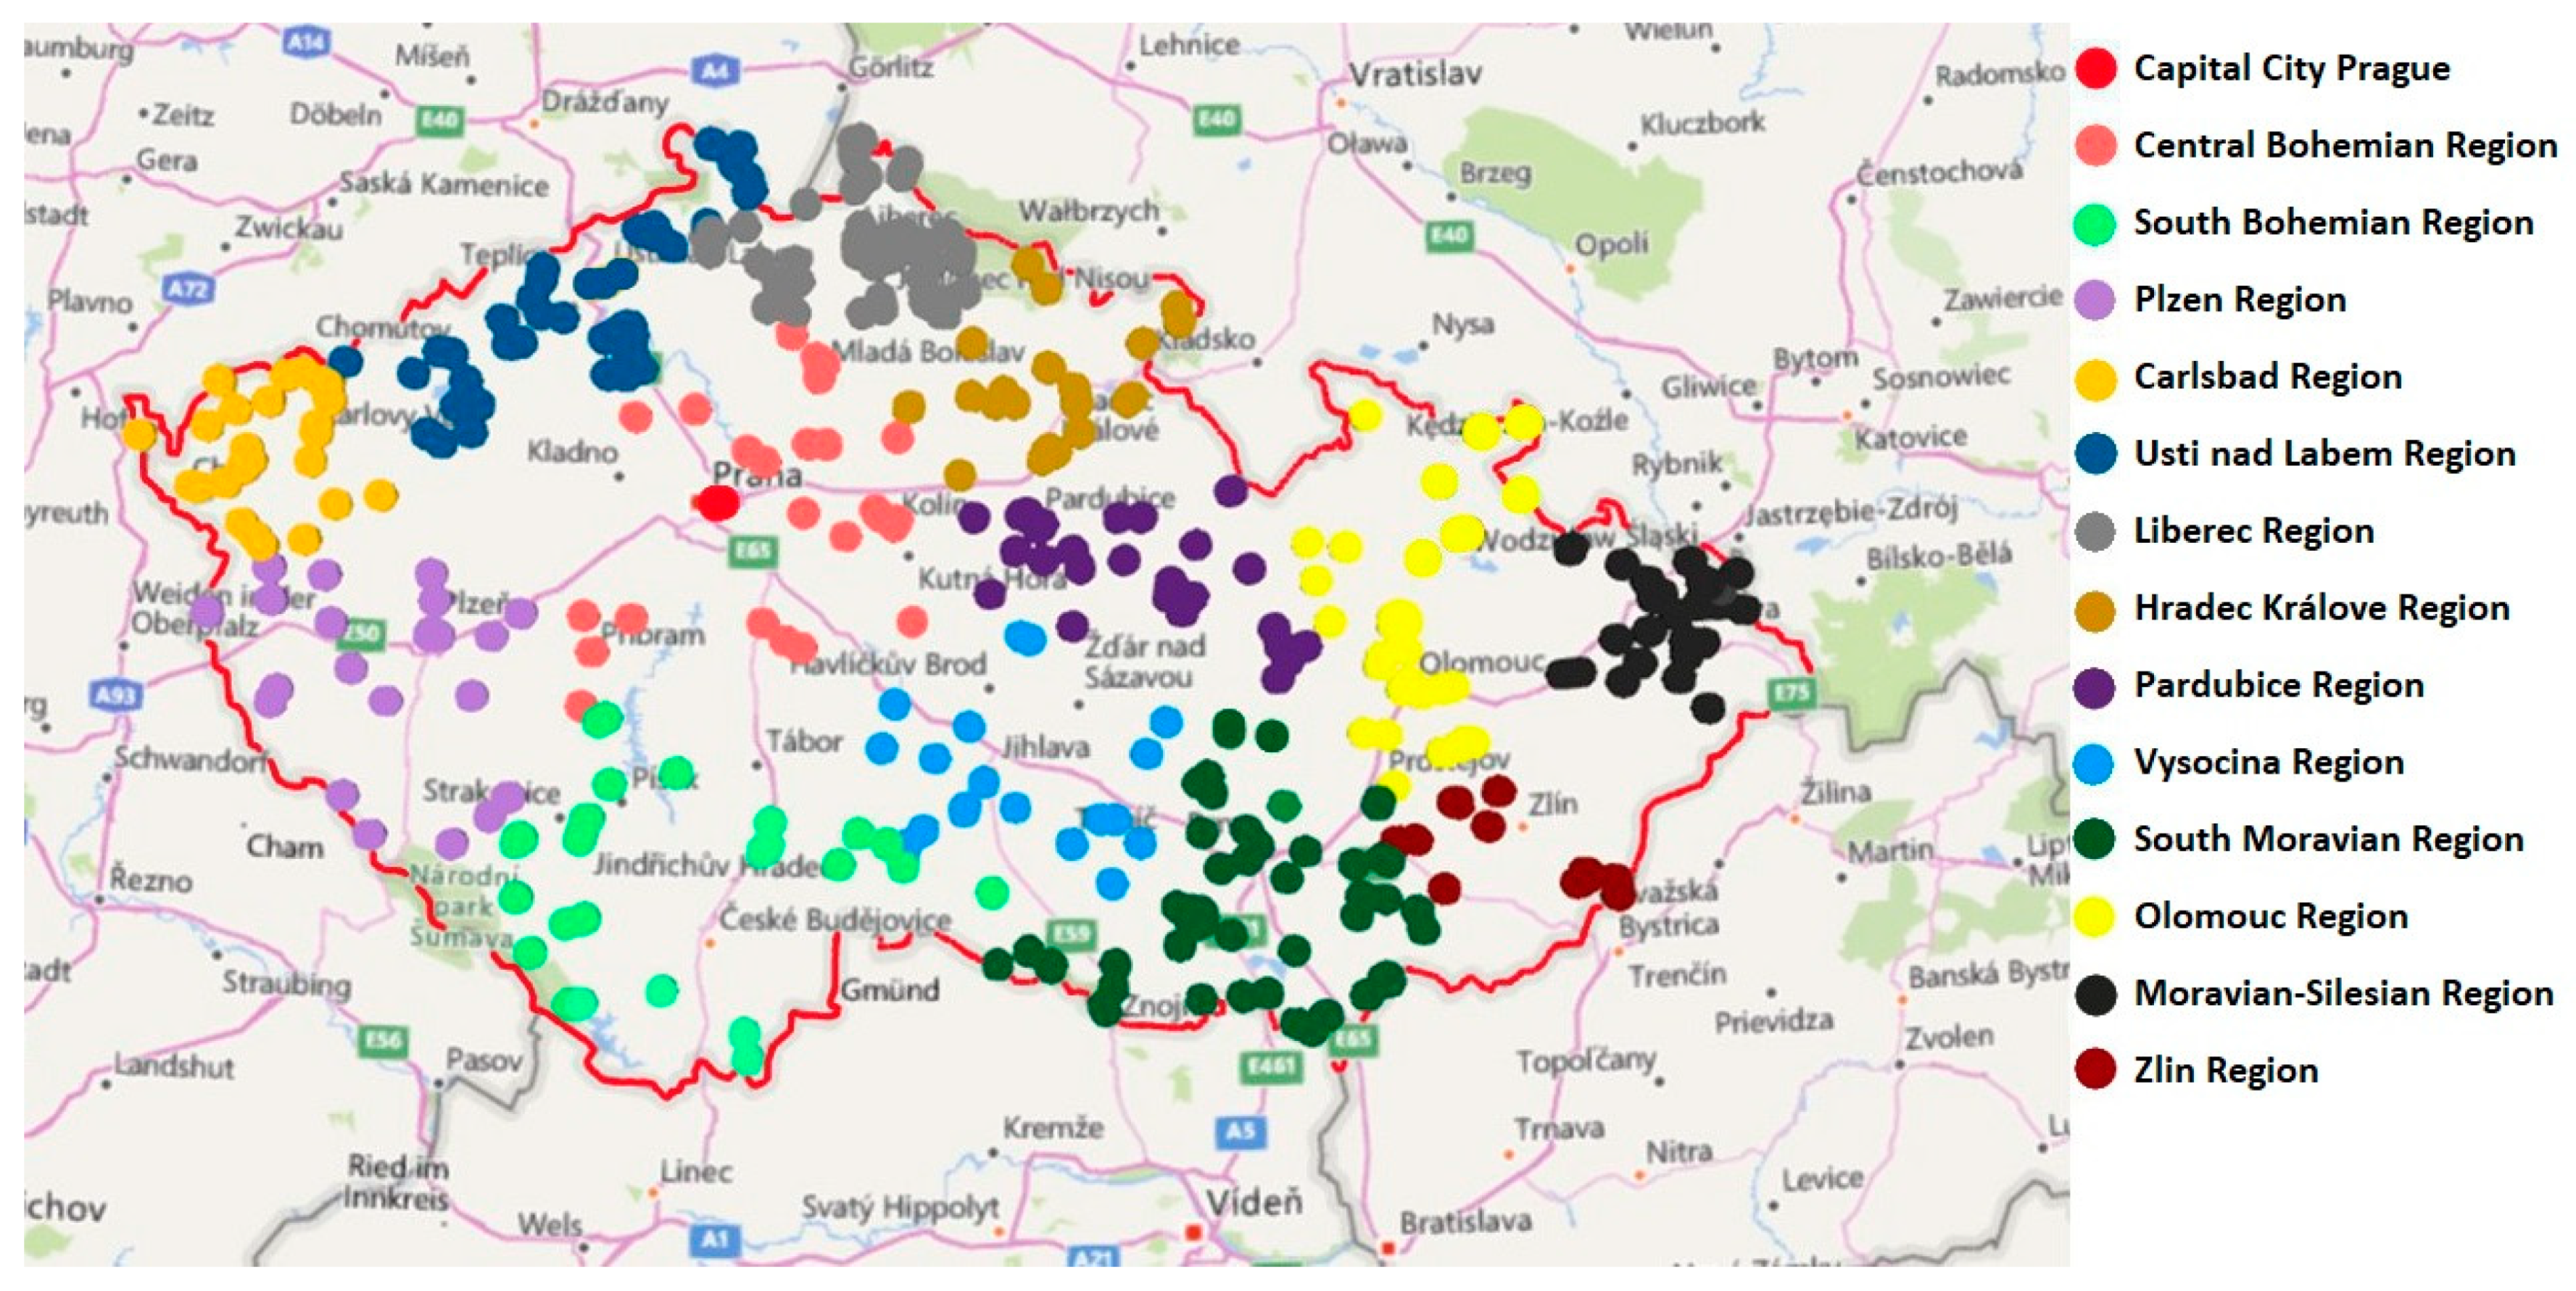
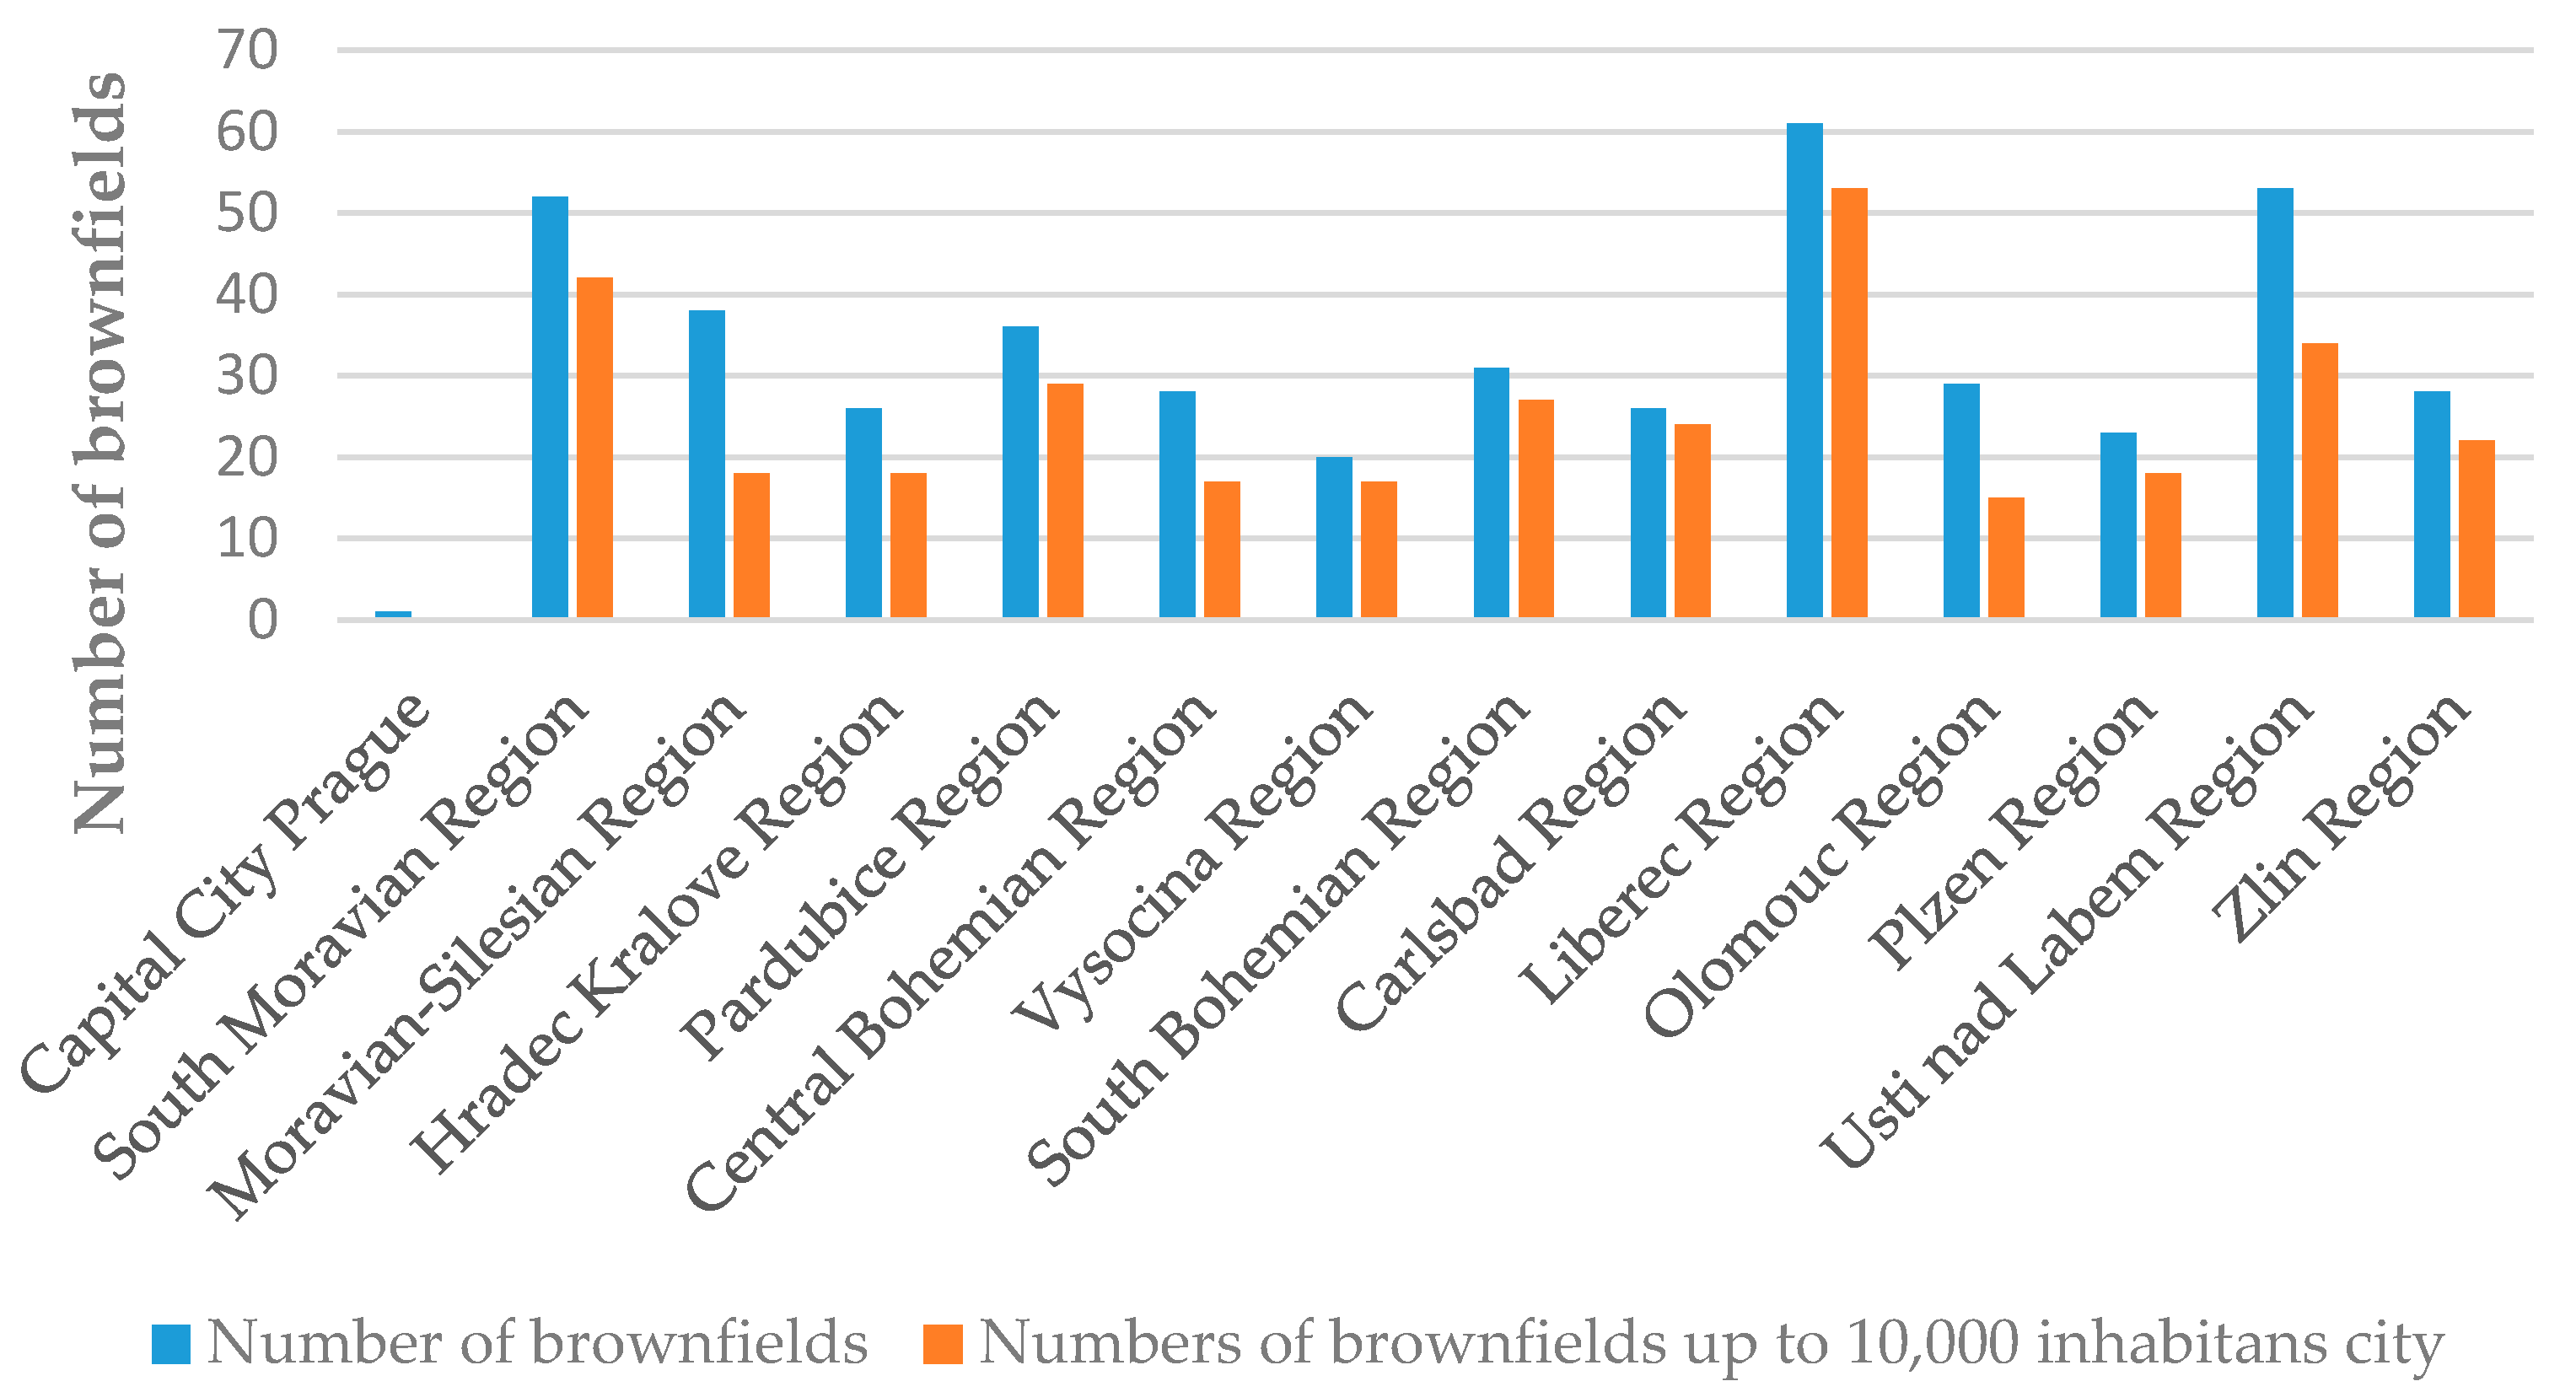
Another evaluation concerns the representation of the number of brownfields according to their position in relation to the regions (see Figure 3). Figure 4 shows that the Liberec Region, the South Moravian Region, the Moravian-Silesian Region, the Pardubice Region, and the Usti Region have the largest share of these areas. In terms of small municipalities, the largest share falls on the Liberec region, the Usti nad Labem region and the South Moravian region.

3.2. Statistical Analysis of Input Data

The data file defined in Section 2.2 was suitably supplemented and expanded with other data, e.g., from field surveys. The statistical methods defined in Section 2.3 were then applied to this data set.

3.2.1. Regression Analysis

The data used relate only to small municipalities [30]. Their dependence was verified using STATISTICA software and the results are given below.
Example: “Dependence of regeneration time with respect to the distance from the village center”. At the beginning of the regression analysis, it is necessary to determine two variables. In this case, this is the length of time for which the building was unused (i.e., the time for regeneration) and the distance of brownfields from the city center or village.
Using a statistic called a “correlation matrix”, the value of the correlation coefficient was found to be 0.27. We can talk about low dependencies of variables (where the value of the correlation coefficient is greater than 0).
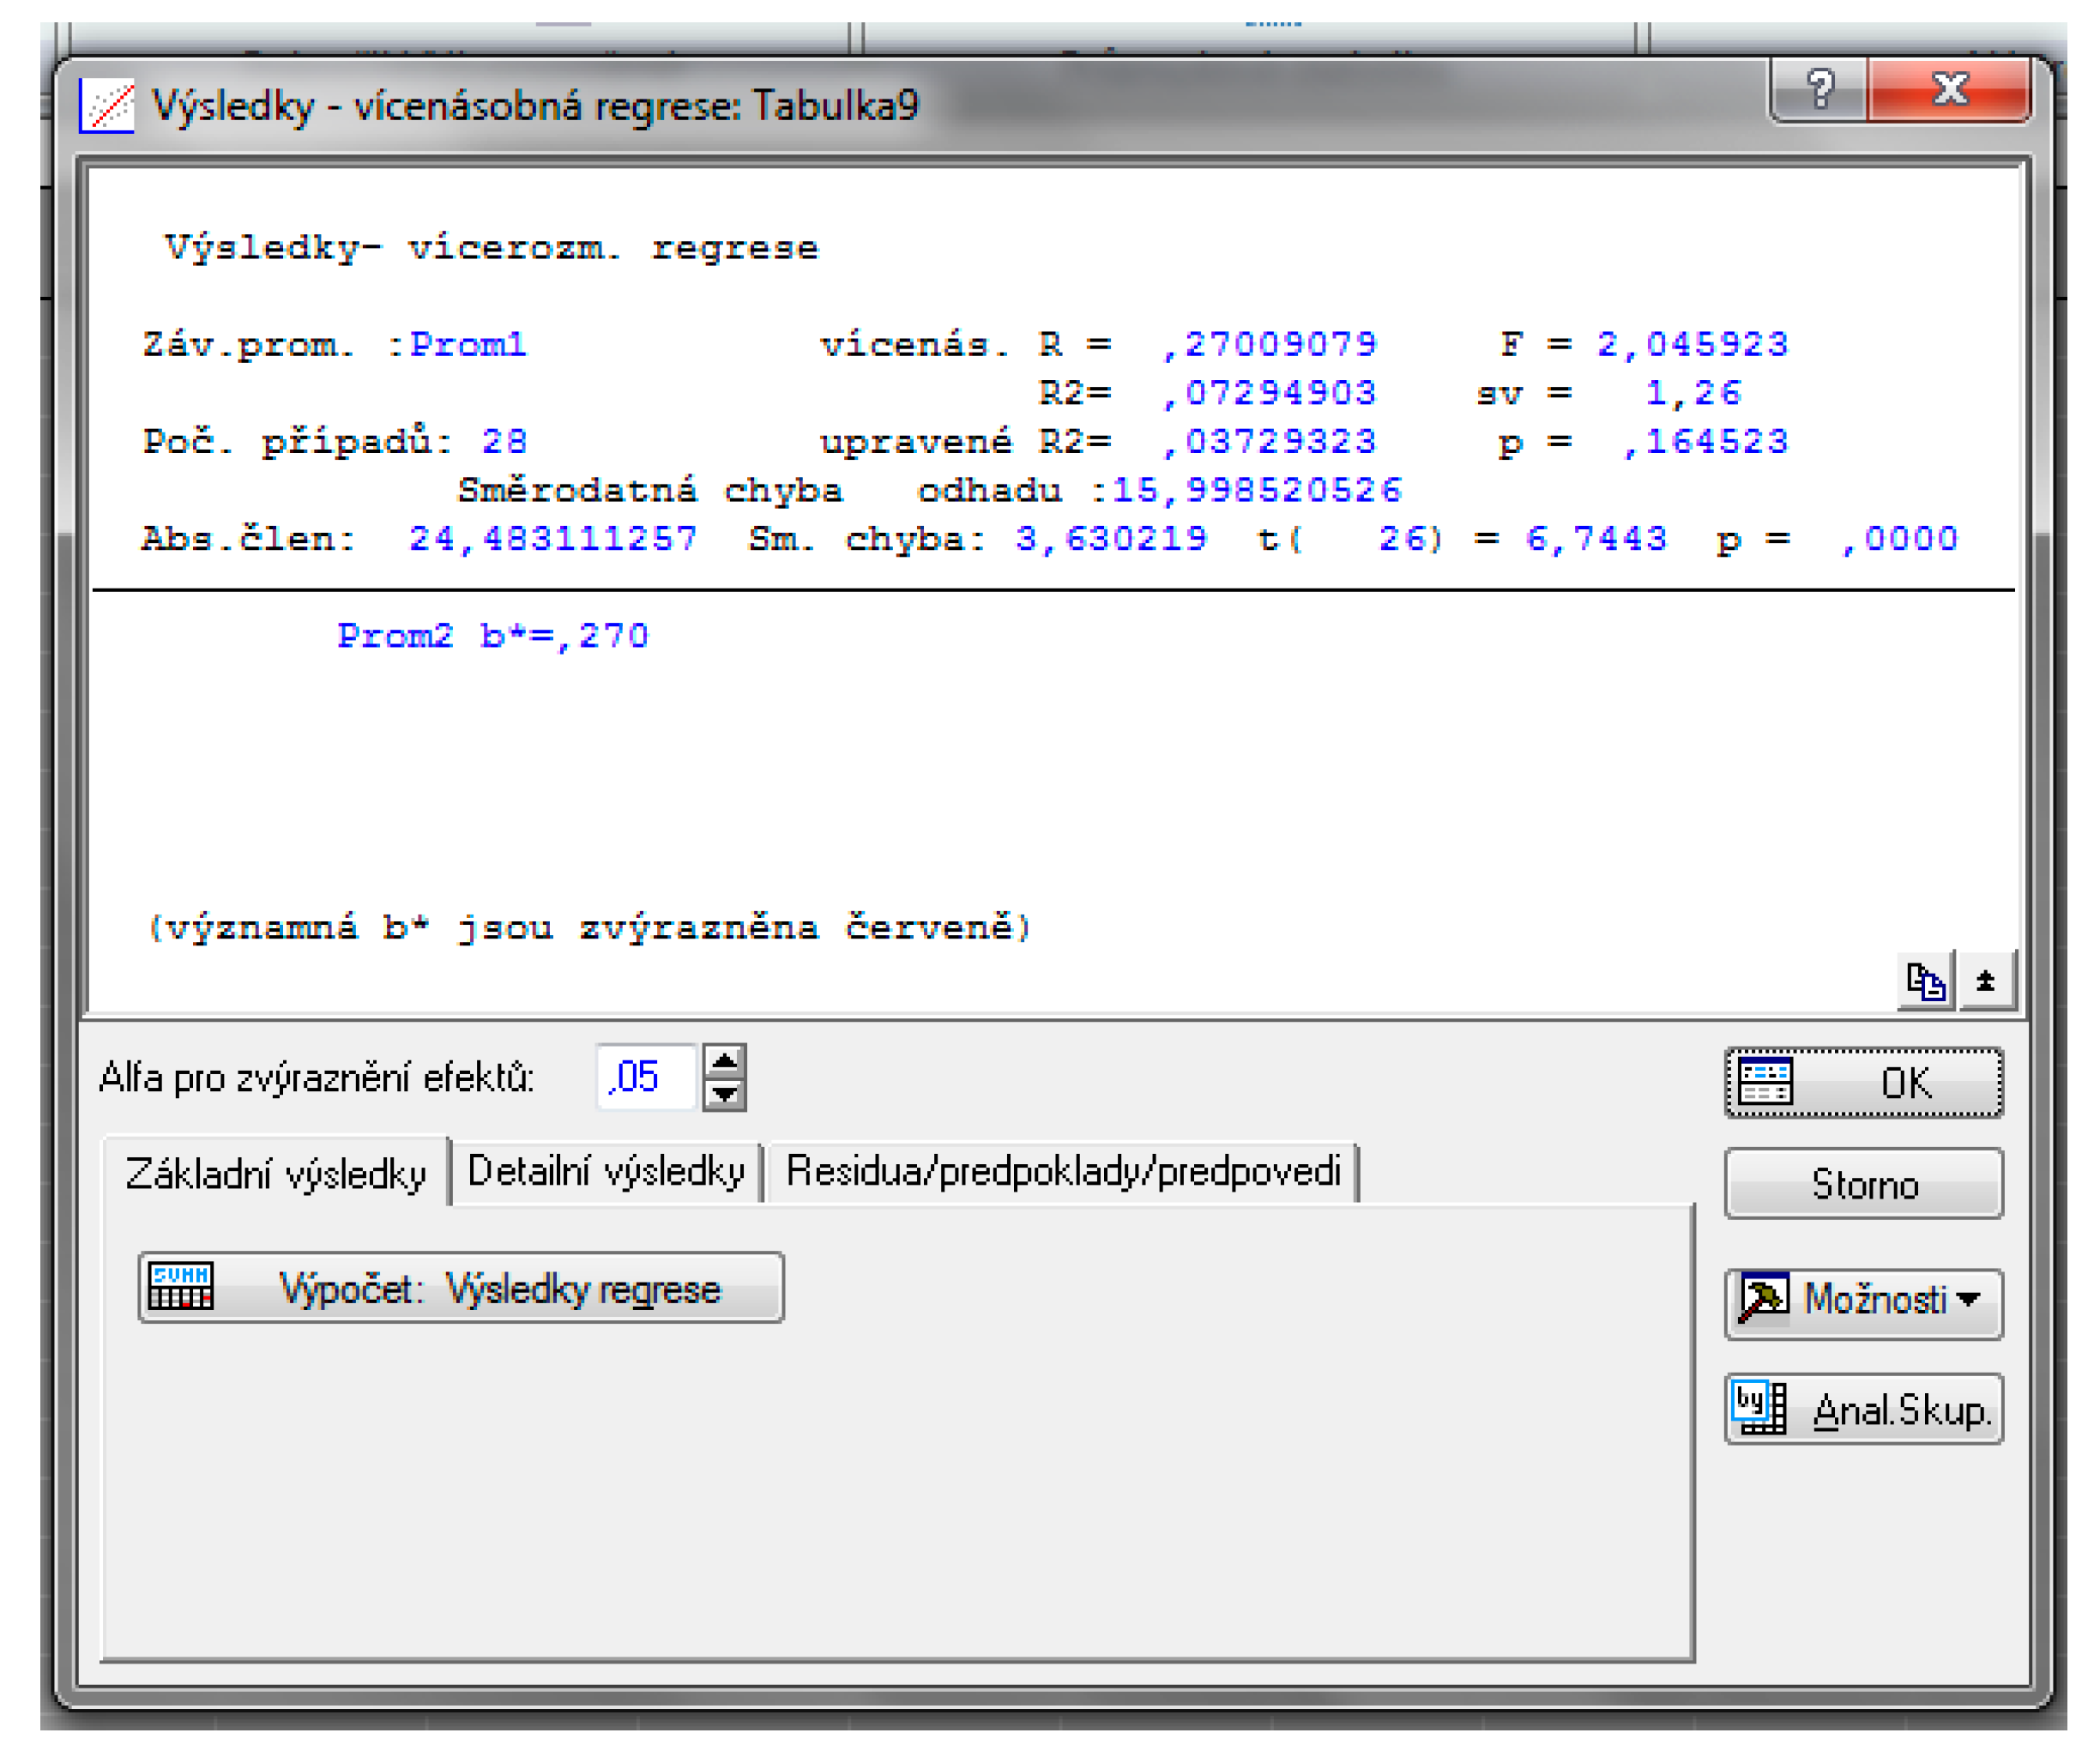
The next step is to use “regression analysis” statistics (Figure 5). The most important data includes the value of R2, which expresses what proportion of the total variability in the dependent variable was solved by the model. The value of R2 = 0.7294 can be read from Figure 5.
From the values given in Figure 5 it is possible to determine the equation of the model:
Regeneration time = 24.28 + 0.0019 * distance from the town center + E
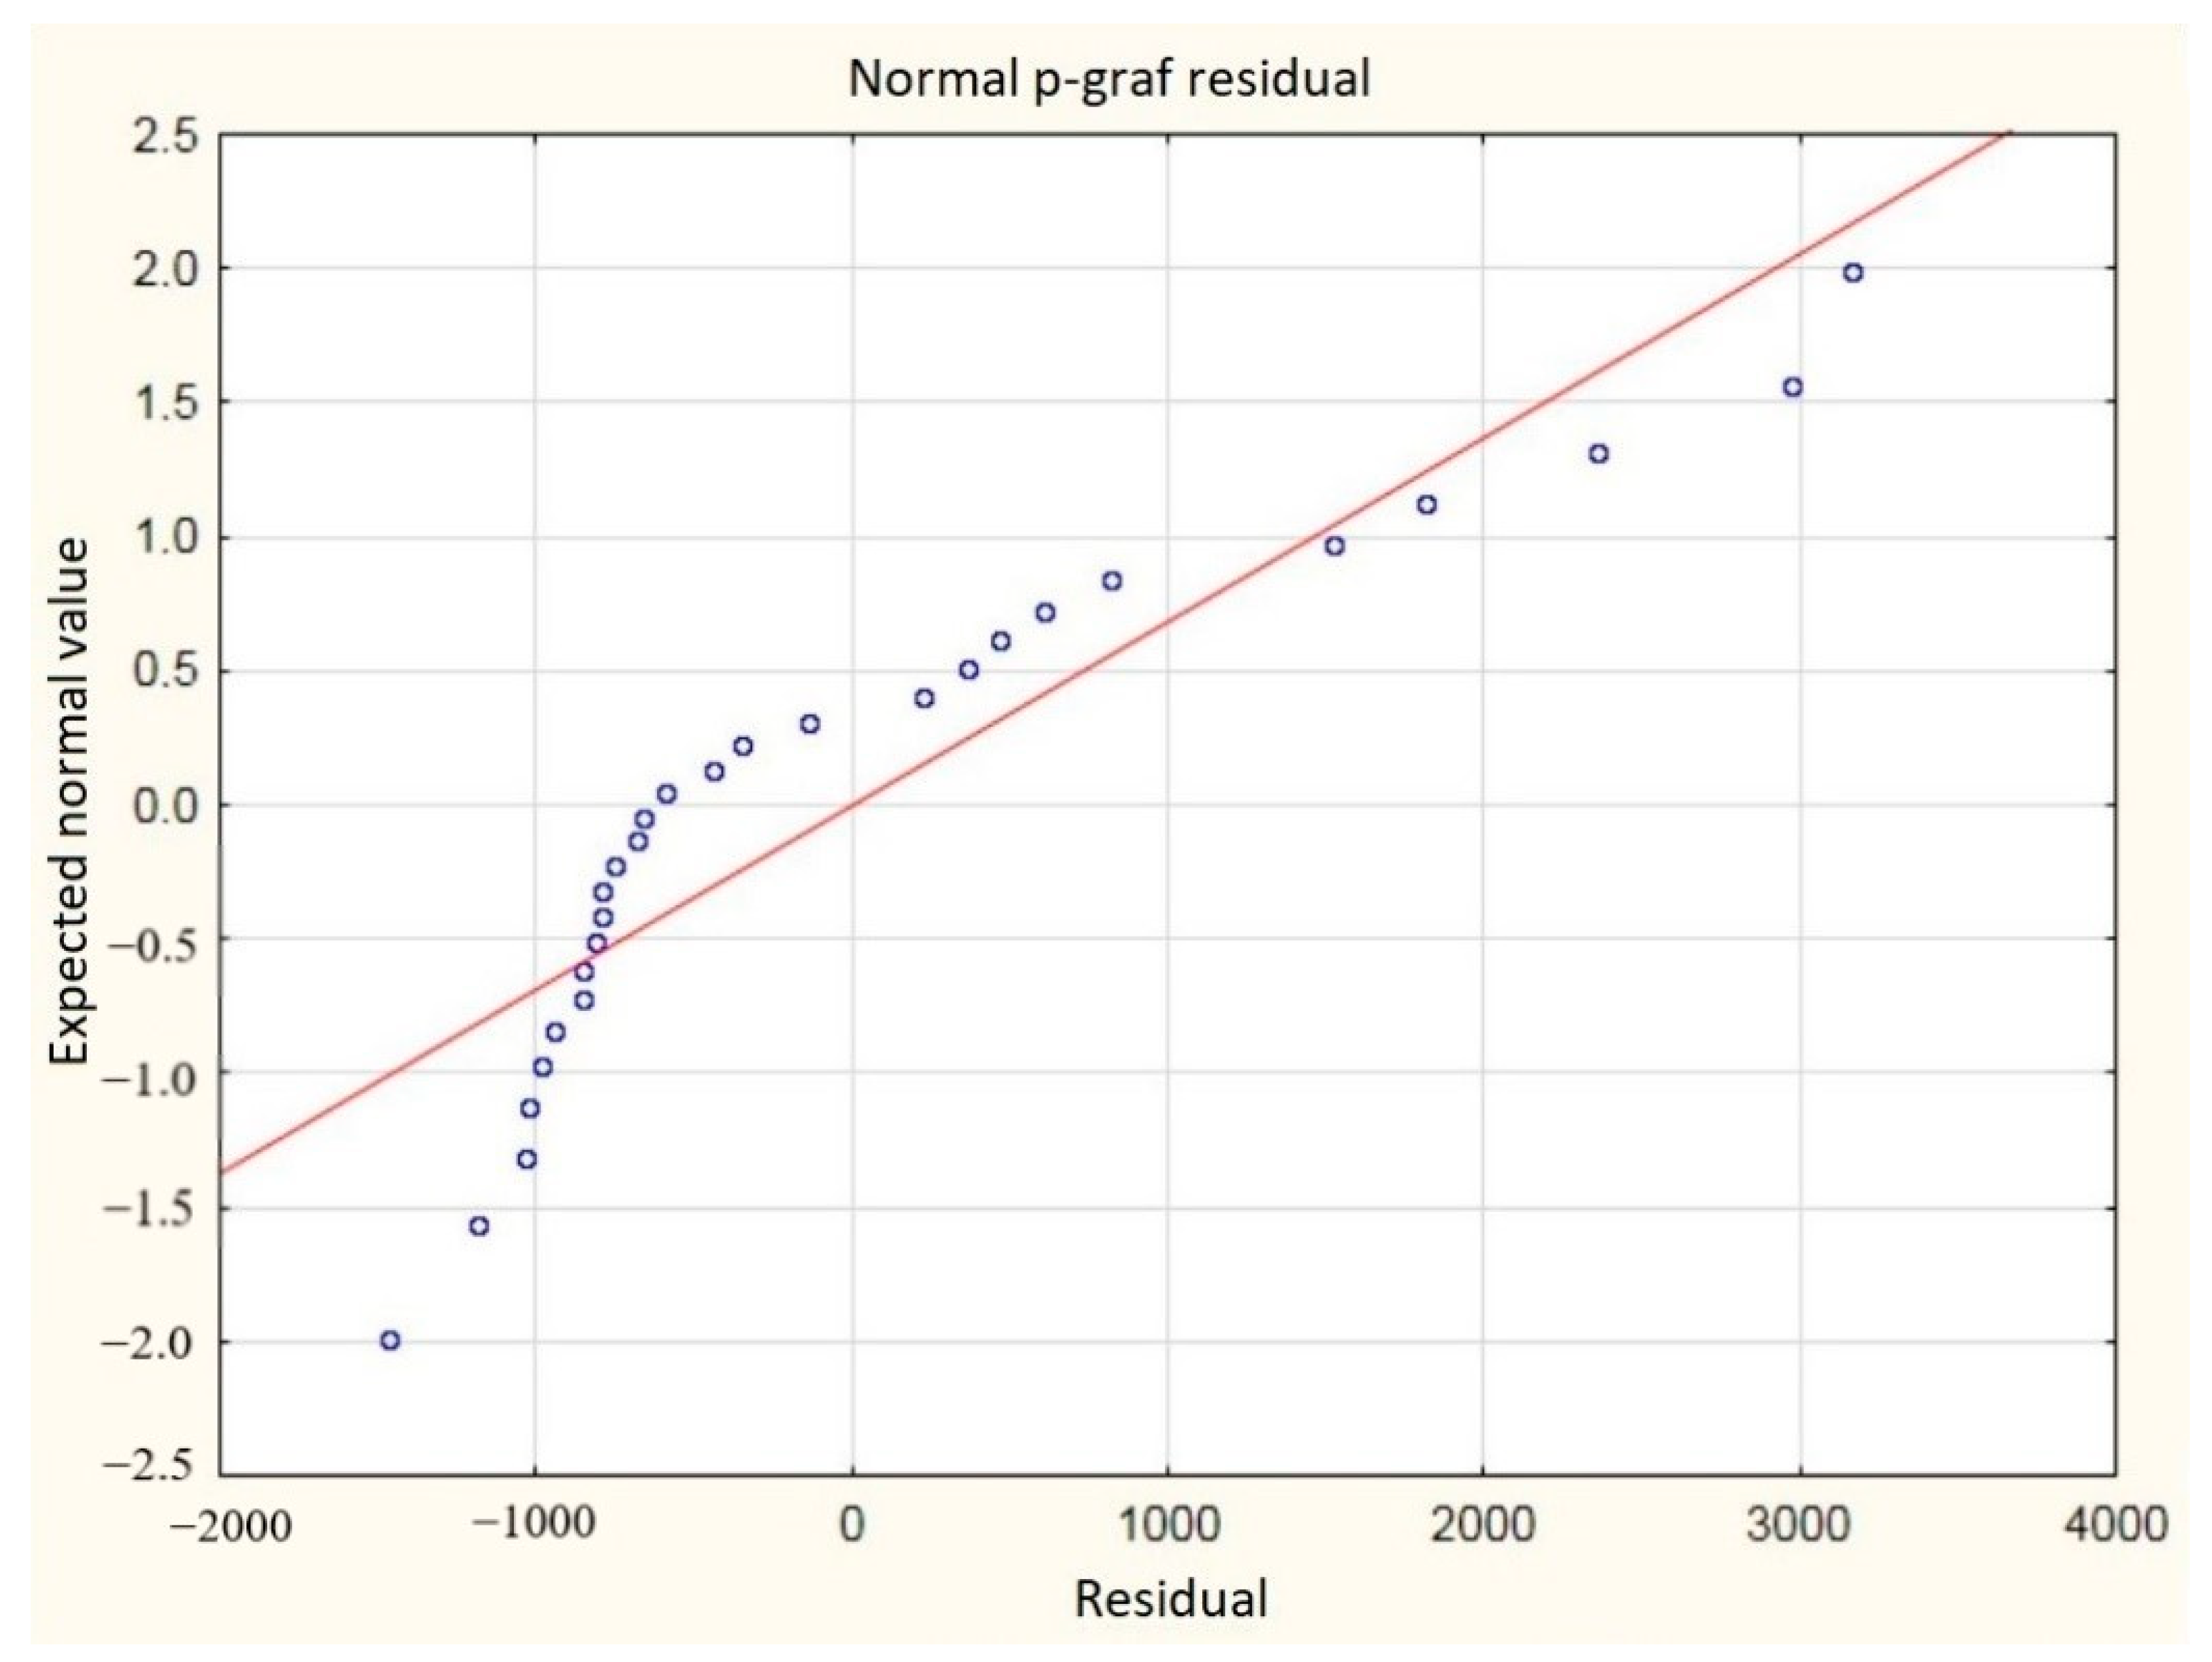
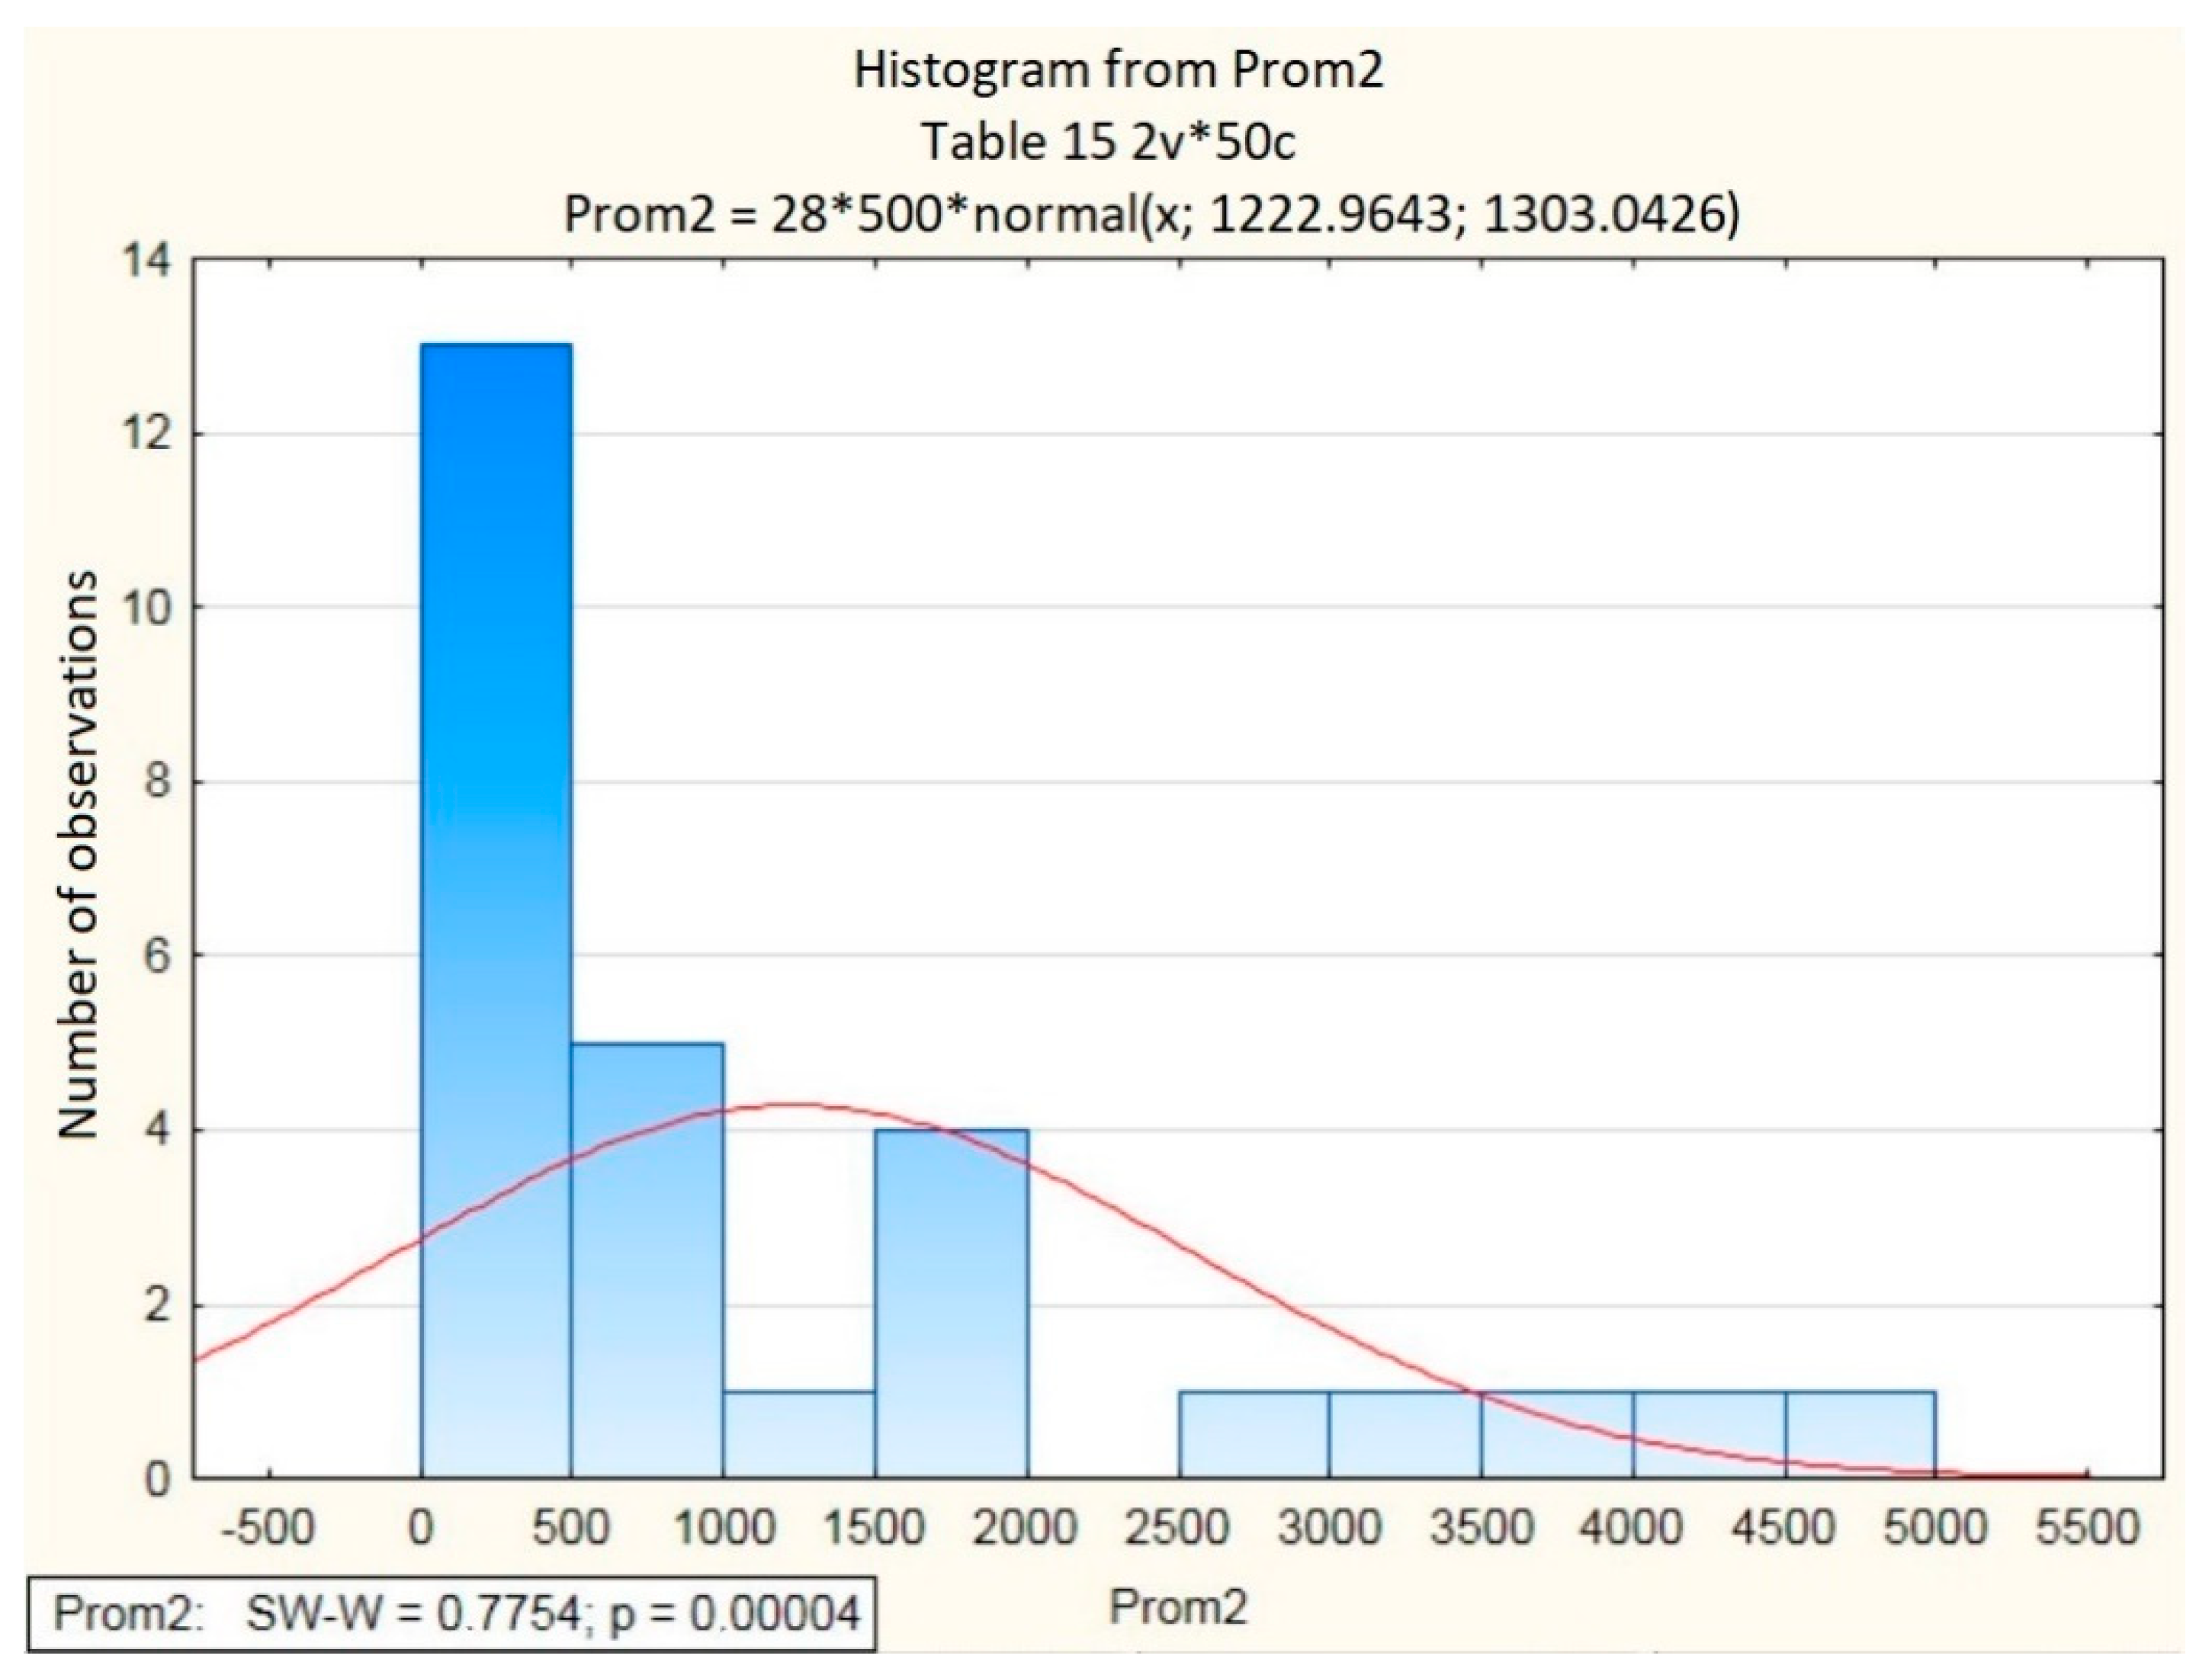
Residues are not evenly distributed around the zero mean, which means that the model was not determined correctly. This result could be caused by a low number of observations or other errors. Residual analysis can be performed using a normal p-graph of residues. The course is the boundary, and the points do not lie around the line (see Figure 6). Rather, we can say that the values do not come from a normal distribution. Another way to determine the normality of the data is to use a histogram (see Figure 7), where it is clearly visible that the normality of the data has again not been confirmed.

3.2.2. Anova

Analysis of variance was used for data based on [31]. The significance of the variables was observed: Population, Distance from the city center, Distance from a major road, Distance from the railway, and Distance from the state border.
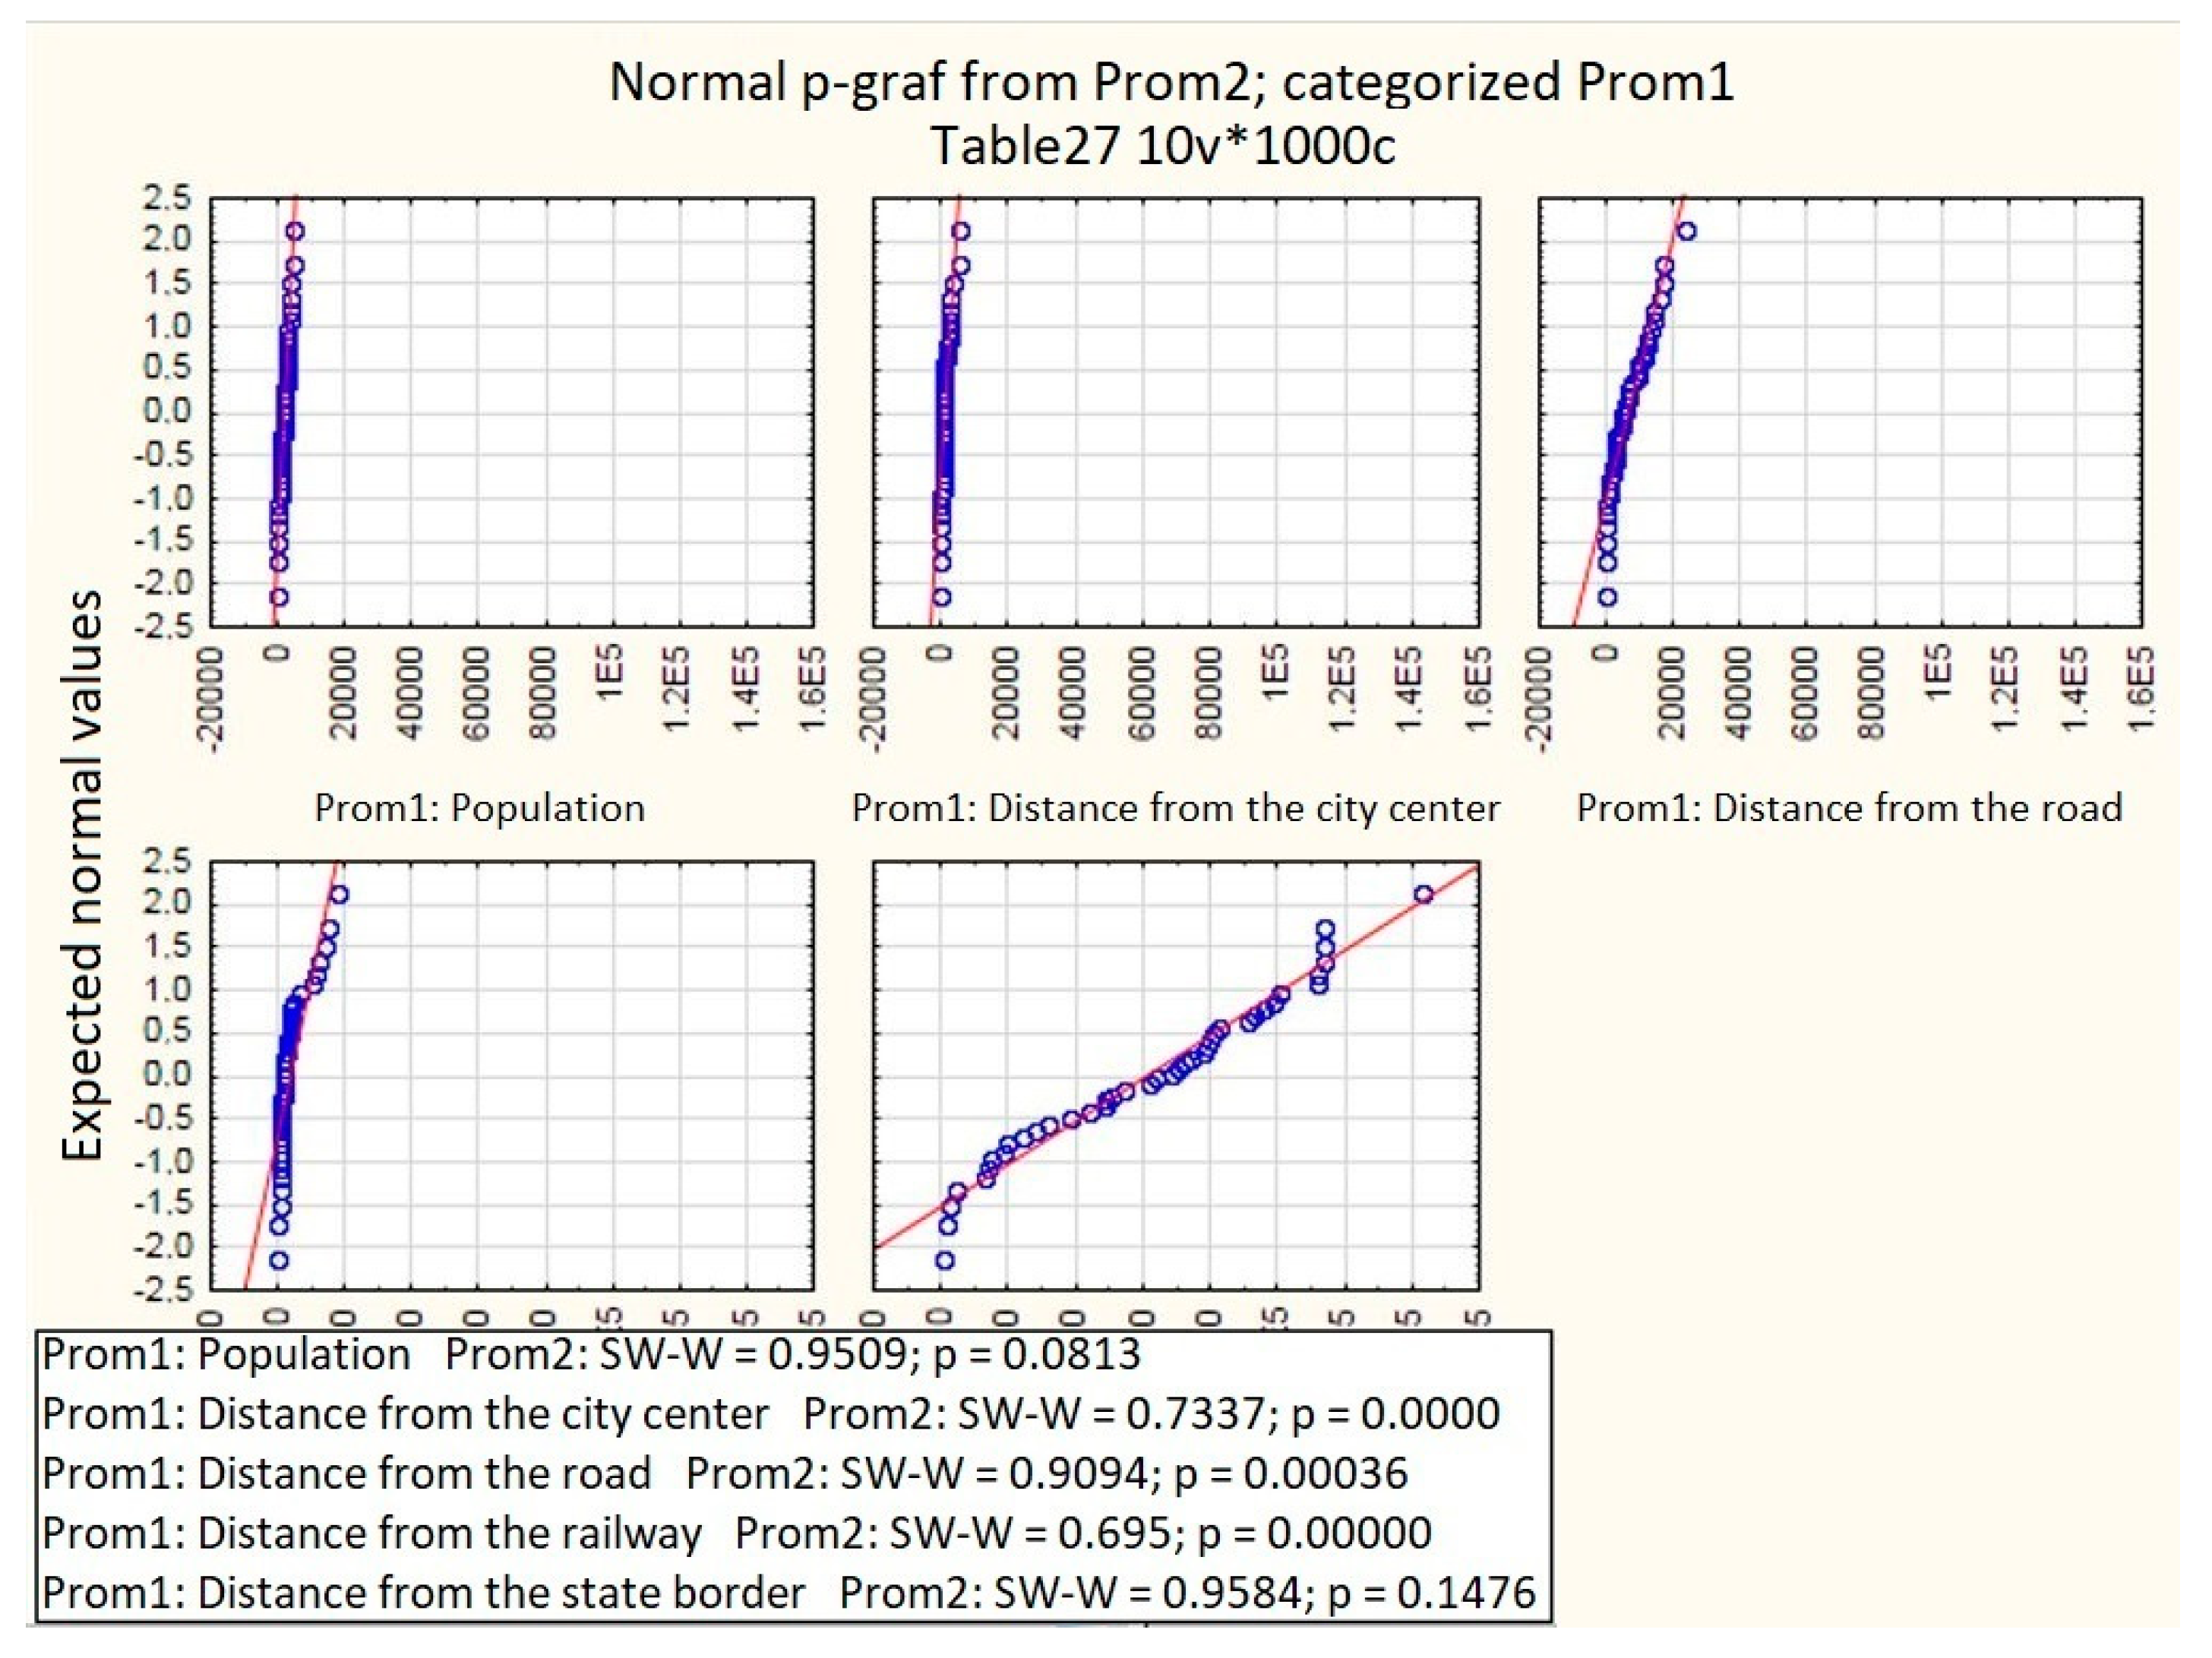
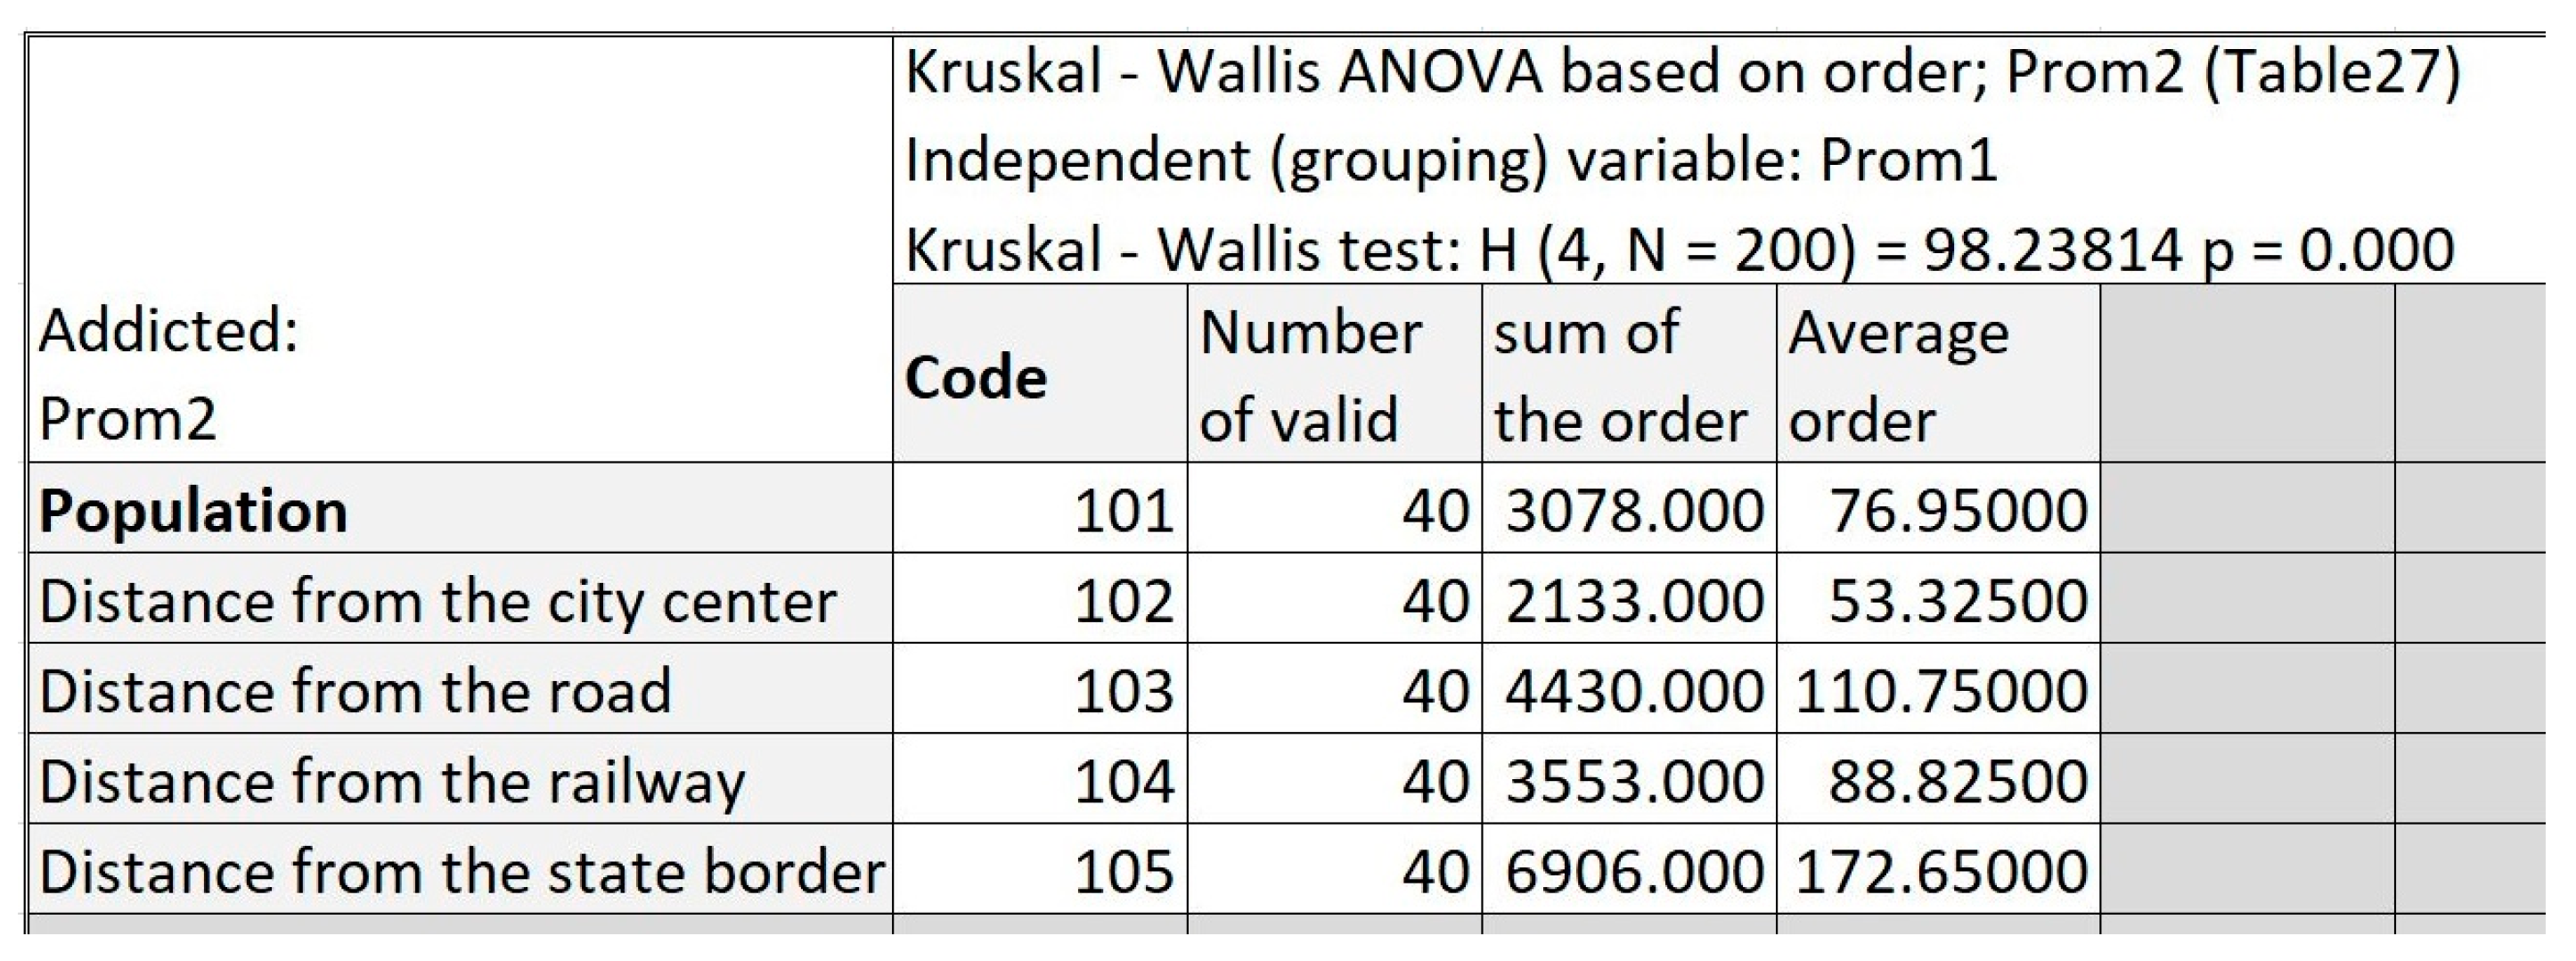
Using a graph and the Shapiro-Wilk test (see Figure 8), it was found that the variables Distance from the center and Distance from the railway did not meet the assumption of normality, and therefore the Kruskal-Wallis test was used, for which data normality does not matter (see Figure 9).
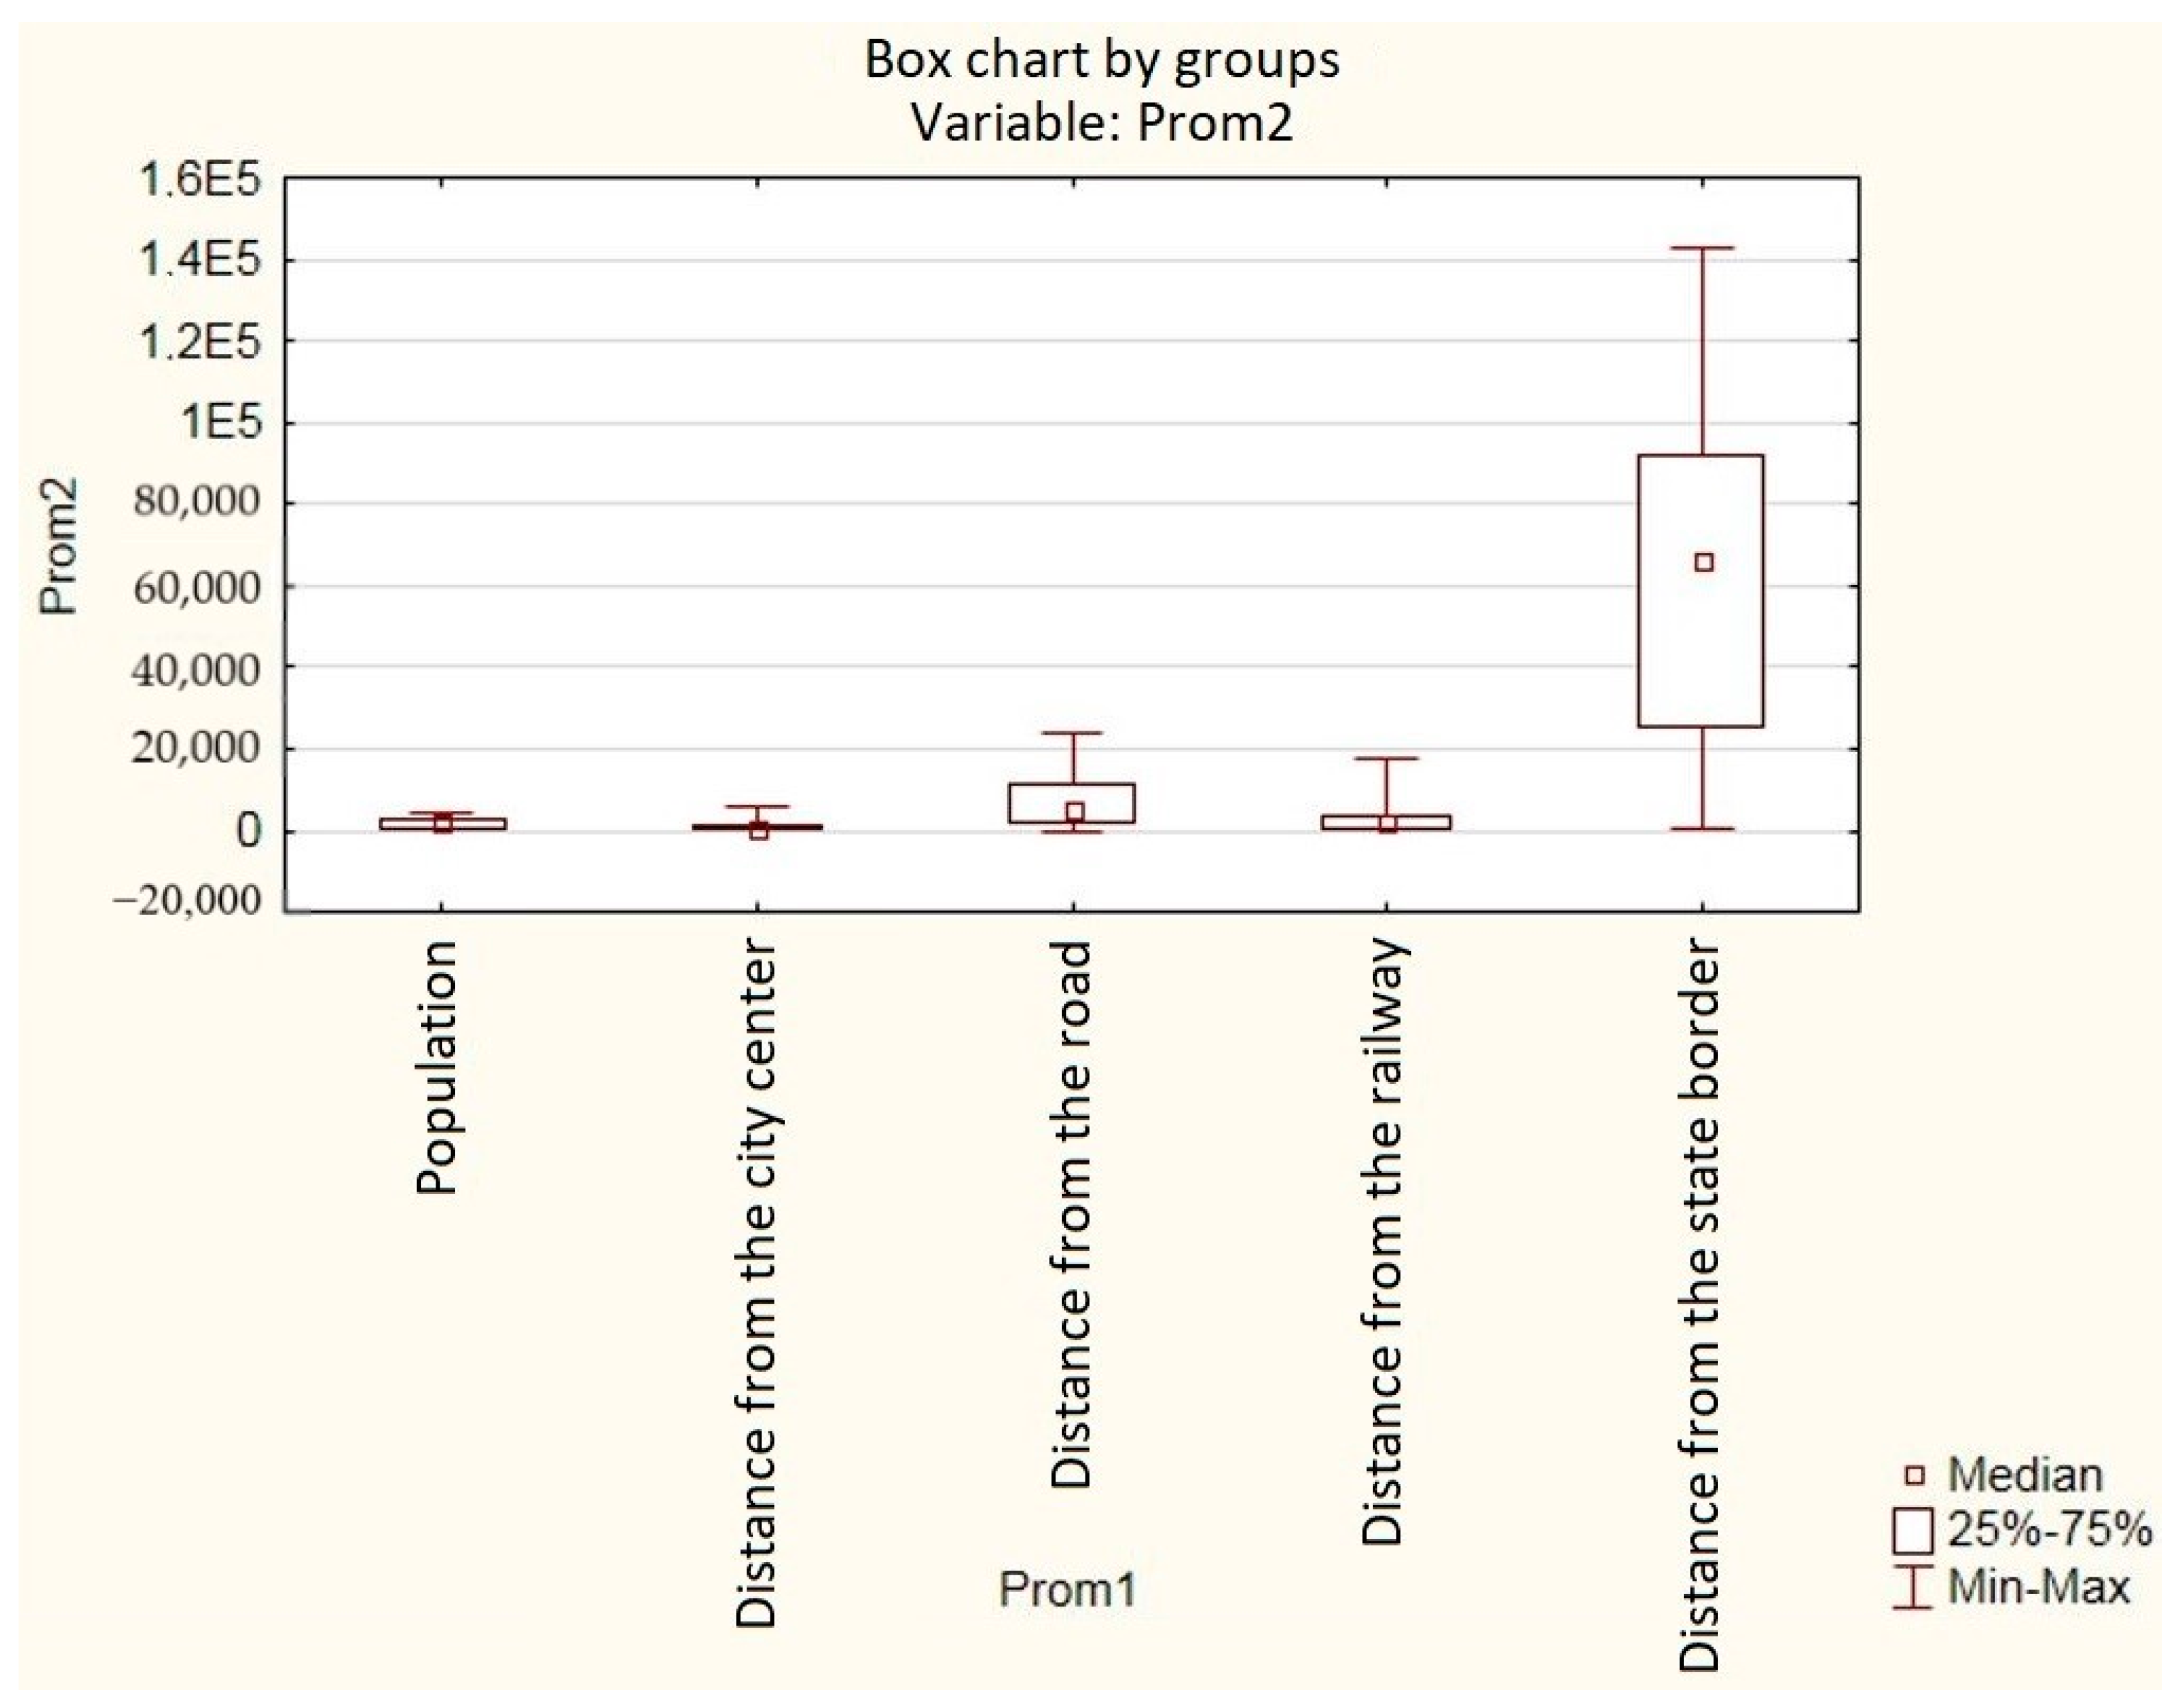
The Kruskal-Wallis test evaluated that the statistically most significant factor is the Distance from the state border, and the least statistically significant is the Distance from the road. This theory is also confirmed by the box graph (see Figure 10), from which the importance of the distance of the locality from the state borders clearly follows.

3.2.3. Multicriteria Analysis

Another statistical application was multicriteria analysis. As an alternative, the sizes of municipalities were determined according to the given range of inhabitants. The analytical criteria were compiled based on the analysis of the data. The order method was used to calculate the weights. A value of 1 was set for the most sensitive criteria and a value of 5 for the least sensitive criteria. The resulting data from the multicriteria analysis are recorded in Table 2, from which the following conclusions were drawn:
  • municipalities with less than 3000 inhabitants are the most sensitive and it is necessary to pay more attention to them in the monitored criteria;
  • in contrast, in municipalities between 2000 and 5000 inhabitants, this sensitivity was evaluated as the lowest.

3.2.4. χ2 Test of Independence in the Contingency Table

The last selected statistic was the χ2 test of independence in the contingency table, which is used to evaluate the dependence of two variables, the frequencies of which are written into the so-called contingency table. EXCEL software (MS Office 2007) was used for this analysis. Data were evaluated that corresponded to those brownfield sites that had already been successfully regenerated (source: own processing according to [30,31]). The dependence or independence of the time when the premises/buildings were without use (i.e., the period from the end of operation to the year of commissioning) was analyzed.
Example: In the following example “Test for municipalities up to 5000 inhabitants”, hypotheses are tested, where it is determined that:
Hypothesis 1 (H1).
The regeneration time does not depend on the type of ownership (Table 3).
and in contrast:
Hypothesis 2 (H2).
The regeneration time depends on the type of ownership (Table 4).
Test criterion:
G   =   i = 1 r j = 1 s ( n i j     n i j ) 2 n i j   =   13.312
Critical value:
X ( 1     α ) ; d f   =   9.488
At the significance level of 5%, we reject the null hypothesis H1 → There is a certain dependence between the regeneration period and the type of ownership, i.e., H2: Regeneration time depends on the type of ownership.
As part of the research, several tests were performed, but for the sake of clarity only one sample example of the calculation was given—“Test for municipalities with less than 5000 inhabitants”. Based on the performed tests and their evaluation, the key results for the research are the listing of variables that proved to be dependent on the test. These variables include:
  • the time from the end of the operation to the start of operation depends on the type of ownership of the site (data source [30]). Only municipalities with a population of up to 5000 were included;
  • the time from the end of the operation to the start of the operation depends on the distance of the site from the state borders. (data source [30]). All municipalities were included;
  • the distance from a first class road or motorway depends on the difference in the number of inhabitants in the period between 2001–2017 (data sources own processing and [27]).
Other tests showed the statistical independence of the monitored variables. The result of this analysis could be influenced by the choice of data source, an inappropriately determined null hypothesis, or insufficiently large data sets.

3.3. Final Evaluation of Statistical Methods

All used statistical methods brought an interesting view of the observed issues. The generally accepted connections with the existence of brownfield sites have not been directly confirmed, but they have also not been directly refuted. This means that for further research, an even more detailed analysis of the data with a wider range of variables is needed, which could lead to clearer results. The main advantage of this analysis is the reference to the possibility of statistical assessment of data related to the revitalization of brownfield sites in the broadest sense.
One of the common conclusions of this analysis was, surprisingly, that the regeneration of brownfield sites is significantly dependent on the distance of the site from the state borders. This theory was confirmed in all three important analyzes, which clearly confirms the significance of this variable.
A major obstacle in the statistical assessment of brownfield sites is the mobility and instability of the monitored data, which means that data are presented according to the subjective evaluation of the creator of the source, which can lead to significant data bias and thus major shortcomings in the analysis. Therefore, it is necessary to present and consider these statistical analyzes as indicative and as a tool for database processors, records, owners of brownfields, and municipalities, which allows clear targeting of the right variables.
However, the use of a simple independence test can be very easy to apply to the selected territory; there are also no demands on the software equipment, and therefore it is more than suitable for selecting suitable indicators, disparities, or other variables. At the same time, the graphical expression using tables, which naturally follows from the test in a clear way, describes the basic statistics, i.e., the frequencies of individual variables.

4. Research Results and Discussion

The main goal of the research was defined as: “The aim of the research is to determine the disparities affecting the success of brownfield revitalization, especially in small municipalities and cities, and then assess the data using appropriate statistical methods.” The character and structure of the data was determined by analyzing publicly available data on brownfield sites in the regions, municipalities, and cities of the Czech Republic. Prior to the actual application of statistical methods, it was necessary to ensure that the data met the basic requirements for the use of statistical methods. If the data did not correspond to the conditions, statistical methods could be used, but the conclusions from the statistical methods can only be considered as indicative.
The conclusions of the statistical methods led to the establishment of a list of important indicators that were monitored and evaluated. They are:
  • location;
  • distance from state borders;
  • distance from first class road, motorway;
  • distance from the railway;
  • population; the difference in the number of inhabitants in individual years;
  • listed building;
  • community strength;
  • territorial pollution—contamination;
  • land ownership;
  • the time from the end of operation to the resumption of operation;
  • sources of funding;
  • number of objects in the monitored locality;
  • site area;
  • number of site owners;
  • original and new use.
The analyzes show the dynamic character of individual monitored disparities and a certain degree of subjectivity in determining values [32,33]. Therefore, it is not possible to unify the statement about the meaning of individual attributes in general. However, we cannot talk about the limited importance of these analyzes, because they can be used to obtain more specific information about the importance and significance of disparities. The original agricultural, military, food, and textile orientation of rural areas was replaced by the demand for services of various kinds (accommodation, sports and recreation, tourism, etc.). The most common use for abandoned buildings is the establishment of a community center [34].

Answering Research Questions

What kind of financing prevails in the process of brownfield revitalization in small municipalities?
  • Small municipalities in the Czech Republic most often use financial resources from various subsidies for development and remediation projects. This statement is conditioned by a certain weight of subjectivity, because information on the type of financing in the Czech Republic is very limited and often unavailable. An overview of subsidy programs suitable for brownfield regeneration is given [29]. In recent years, rural areas and small towns have been supported in solving problems with neglected and abandoned areas. From foreign sources [6,35] it was found that in the territory of small municipalities, the most effective financing was with private funds, and only rarely is there a partnership between the private and public sector (i.e., financing through subsidies and bank loans).
Which attributes (disparities) most influence investors in the investment decision-making process?
  • It was not possible to determine the overview of disparities influencing investors, using the selected statistical methods. Relevant data and necessary information on the type and kind of investors, or on cooperation between the private and public sectors, were not available. The original goal of the work was to trace the properties of this attribute, but this research question could not be answered.
Is the process of brownfield revitalization more demanding in the territory of small municipalities? If so, can this be expressed through disparities?
  • In the territory of small municipalities, the process is more complicated by the more limited possibility of obtaining subsidies. Currently, this trend is beginning to reverse and the mayors of municipalities make extensive use of these financial resources.
Are there differences in indicators (disparities) in the process of brownfield revitalization in large and small municipalities?
  • All indicators that have been analyzed to some extent affect the revitalization process in all municipalities. What their influence is and the difference between them can be described and evaluated using multicriteria analysis. The most understandable method of determining the weights of individual attributes is to sort them according to meaning and importance. The disadvantage of this analysis is a certain degree of subjectivity in compiling the order of attributes. The real differences between the indicators in large and small municipalities were not proven by any statistical method.
Is there a direct link between the success of brownfield revitalization and the size of the municipality in which the site is located?
  • This hypothesis was monitored using statistical methods, but its validity was not confirmed.

5. Conclusions

The research dealt with the area of brownfield revitalization as a broad concept. The introductory part dealt with the position of brownfield sites in spatial planning and urban development both in the Czech Republic and abroad. A large part of the work was devoted to the creation of records (database), which lists the brownfield sites before regeneration, as well as successfully revitalized brownfield sites in the Czech Republic. This inventory was a necessary step before the actual statistical evaluation of the inventory data. The key statistical methods used were regression analysis, ANOVA, χ2 contingency table independence test, and multicriteria analysis. Statistical methods were selected for effective applicability of the data set [35,36].
The volume of defined indicators (disparities) is limited, due to problems with the availability of data files, which do not always contain the necessary data. Publicly available data from the Czech Statistical Office or other sources were presented in such a form and format that for statistical analysis most disparities, which are commonly reported in the literature, were found [37]. The presented research using the application of statistical methods found that the most significant disparities include the distance of the locality from the state borders, the difference in population between 2001 and 2017, the type of ownership and the distance from a first class road or highway. Their significance was confirmed by several statistical methods simultaneously. The distance from the state borders was confirmed to be statistically the most significant factor in all analyzes. It would therefore be appropriate for border areas to support their development potential (so far there has been no specific support for border municipalities). Small municipalities need more promotion for their successful development so that they are not overshadowed by larger cities. It has also been shown that the type of ownership is statistically significant, which means that municipalities should focus their interest on supporting privately owned sites. Publicly owned buildings are among the less revitalized municipalities that cannot compete with private owners, because they cannot consider profits resulting from new use. The dynamics of brownfield-related data significantly influence the statistical analysis.
All used statistical methods brought an interesting view of the observed issues. The generally accepted connections with the existence of brownfield sites have not been directly confirmed, but they have also not been directly refuted. This means that more research is needed for a more detailed analysis of data on a wider range of variables that could lead to clearer results. The main advantage of this analysis is the reference to the possibility of statistical assessment of data related to the revitalization of brownfield sites in the broadest sense.
One of the common conclusions of this analysis was, surprisingly, that the regeneration of brownfield sites is significantly dependent on the distance of the site from the state borders. This theory was confirmed in all three important analyzes, which clearly confirms the significance of this variable.
The main benefit of this paper is to point out the possibility of solving the problem of brownfield sites and the possibilities of their successful, revitalization, not only in terms of humanities and urban planning, but also with the help of statistical methods. Converting individual attributes into numerical values and weights will allow a wide range of uses.

Author Contributions

N.S. and M.T. provided the core idea, collected the data, wrote the manuscript and analyzed the data statistically. F.K. revised and constructively commented on the paper, checked the formal correctness. All authors have read and agreed to the published version of the manuscript.

Funding

The work was supported by funds for Conceptual Development of Science, Research and Innovation for 2021 allocated to VSB–Technical University of Ostrava by the Ministry of Education, Youth and Sports of the Czech Republic.

Institutional Review Board Statement

Not applicable.

Informed Consent Statement

Not applicable.

Data Availability Statement

Publicly available datasets were analyzed in this study. This data´s links can be found in the references.

Conflicts of Interest

The authors declare no conflict of interest. The funders had no role in the design of the study; in the collection, analyses, or interpretation of data; in the writing of the manuscript, or in the decision to publish the results.

References

  1. Bergatt Jackson, J. Brownfields easily and simply. In Handbook Especially for Employees and Representatives of Municipalities; Institute for Sustainable Settlement Development: Prague, Czech Republic, 2005; p. 78. (In Czech) [Google Scholar]
  2. Ferber, U.; Grimsku, D.; Millar, K.; Nathanail, P. Sustainable Brownfield Regeneration: CABERNET Network Report; University of Nottingham: Nottingham, UK, 2006; p. 135. ISBN 0-9547474-5-3. [Google Scholar]
  3. Hurnikova, J. Brownfields and territorial development. In Urbanismus a Územní Plánování; 2009; Volume XII, pp. 3–5. Available online: https://www.google.com/url?sa=t&rct=j&q=&esrc=s&source=web&cd=&cad=rja&uact=8&ved=2ahUKEwjPy4OssbbuAhXLDewKHVdJB7gQFjAAegQIAhAC&url=https%3A%2F%2Fwww.uur.cz%2Fimages%2Fpublikace%2Fuur%2F2009%2F2009-06%2F01_brownfieldy%2520rozvoj.pdf&usg=AOvVaw0XOz_74IPvgjub2ZETuIis (accessed on 25 January 2021). (In Czech)
  4. Peric, A. Institutional cooperation in the Brownfield regeneration process: Experiencess from central and eastern European countries. In European Spatial Research and Policy; Łodz University Press: Łodz, Poland, 2016; Volume 23, pp. 21–46. ISSN 1231-1952. [Google Scholar] [CrossRef]
  5. CzechInvest. Náaodní Databáze Brownfieldů. Available online: http://www.brownfieldy.cz/ (accessed on 1 October 2018).
  6. EPA; United States Environmental Protection Agency. Setting the stage for leveraging resources for brownfields revitalization. In Office of Land and Emergency Management; 2016. Available online: https://www.epa.gov/brownfields/settingstage-leveraging-resources-brownfields-revitalization (accessed on 20 December 2018).
  7. Birli, B.; Prokop, G. Circular flow land management Voitsberg region. In Innovative Solutions to Revitalization of Brownfields; Cardno: Katowice, Poland, 2013; pp. 208–210. [Google Scholar]
  8. Institute for Ecology of Industrial Areas. Circular Flow Land Use Management (CircUse). Available online: http://www.circuse.eu/index.php?s=1 (accessed on 1 October 2018).
  9. Preuss, T.; Verbuecheln, M.; Ferber, U. Circular Flow Land Use Management Strategy Task Nr. 2.4.3., Berlin, s.n. February 2011. Available online: https://difu.de/sites/default/files/CircUse_Flyer_June_2010.pdf (accessed on 1 October 2018).
  10. Mierzejewska, L.; Toelle, A. Towards sustainable spatial development in small and medium—Sized cities. Planning aspirations and realities. In Economic and Environmental Studies; University of Opole: Opole, Poland, 2018; Volume 18, pp. 291–311. ISSN 2081-8319. [Google Scholar] [CrossRef]
  11. Frantal, B.; Greer-Wootten, B.; Klusáček, P.; Krejčí, T.; Kunc, J.; Martinát, S. Exploring spatial patterns of urban brownfields regeneration: The case of Brno, Czech Republic. Cities 2015, 44, 9–18. [Google Scholar] [CrossRef]
  12. Rizzo, E.; Pesce, M.; Pizzol, L.; Alexandrescu, F.M.; Giubilato, E.; Critto, A.; Marcomini, A.; Bartke, S. Brownfield regeneration in Europe: Identifying stakeholder perceptions, concerns, attitudes and information needs. Land Use Policy 2015, 48, 437–453. [Google Scholar] [CrossRef]
  13. Navratil, J.; Krejci, T.; Martinat, S.; Picha, K.; Klusacek, P.; Skrabal, J.; Osman, R. Abandonment or regeneration and re-use? Factors affecting the usage of farm premises in different social spaces of the rural. Sustainability 2020, 12, 9124. [Google Scholar] [CrossRef]
  14. SAVEYOUR. Town. Available online: https://saveyour.town/ (accessed on 1 December 2018).
  15. Kramarova, Z. Brownfields in small towns in the Hradec Králové region. In Člověk, Stavba a Územní Plánování; CVUT, Faculty of Civil Engeneering: Prague, Czech Republic, 2006; pp. 65–72. ISBN 80-01-03461-5. (In Czech) [Google Scholar]
  16. Antucheviceine, J. Principles of revitalization of derelict rural buildings. J. Civ. Eng. Manag. 2003, 9, 225–233. [Google Scholar] [CrossRef]
  17. Kramarova, Z. Brownfieldy a verejnost v mensich sidlech. In Clovek, Stavba a Uzemni Planovani IV; CVUT, Faculty of Civil Engeneering: Prague, Czech Republic, 2010; pp. 14–23. ISBN 978-80-01-04538-1. Available online: http://www.uzemi.eu/vystupy/publikace/-103-brownfieldy-a-verejnostv-mensich-sidlech.html (accessed on 2 December 2018). (In Czech)
  18. Laube, P. Udrzitelny rozvoj malych sidel. In Clovek, Stavba a Uzemni Planovaní; CVUT, Faculty of Civil Engeneering: Prague, Czech Republic, 2006; pp. 58–64. ISBN 80-01-03461-5. (In Czech) [Google Scholar]
  19. Novotna, E.; Musil, M. Promena venkovskych brownfieldu v komunitní centra. In Regionalní Rozvoj Mezi Teorií a Praxi; Civitas per Populi, o.p.s.: Czech Republic, 2016; pp. 35–47. ISSN 1805-3246. (In Czech) [Google Scholar]
  20. Ohio EPA; Ohio Brownfield Redevelopment Toolbox. A Guide to Assist Small and Rural Communities in Redeveloping Ohio’s Brownfields. In Ohio Environmental Protection Agency, Division of Emergency and Remedial Response; 2007. Available online: https://www.epa.ohio.gov/portals/30/sabr/docs/ohio%20brownfield%20toolbox.pdf (accessed on 20 December 2018).
  21. Skala, J.; Cechmankova, J.; Vacha, R.; Horvathova, V. Various aspects of the genesis and perspectives on agricultural brownfields in the Czech Republic. Morav. Geogr. Rep. 2013, 21, 46–55. [Google Scholar] [CrossRef] [Green Version]
  22. Small Business Trends. 50 Business Ideas for Vacant Land. Small Business Trends LLC. Available online: https://smallbiztrends.com/2017/07/business-ideas-for-vacant-land.html (accessed on 5 December 2018).
  23. SRA Scottish Rural Action. Rural Empty Property—Chat Are the Options? Available online: https://www.sra.scot/rural-emptyproperty-what-are-the-options/ (accessed on 1 December 2018).
  24. Kutscherauer, A.; Fachinelli, H.; Hučka, M.; Skokan, K.; Sucháček, J.; Tománek, P.; Tuleja, P. Regional Disparities (Disparities in the Regional Development of the Czech Republic—Concept, Theory, Classification and Evaluation); VSB-TUO, Faculty of Economy: Ostrava, Poland, 2010; p. 152. Available online: http://disparity.vsb.cz/vysledky/15_zaverecna_%20zprava_2010.pdf (accessed on 1 October 2019). (In Czech)
  25. Schejbalova, B. Nekolik poznatku a doporuceni ze subjektivniho hodnoceni disparit a jiných problemu obci o 500–3000 obyvatel v Ceske republice. In Seminar—Vyzkum Pro Reseni Regionalnich Disparit V Ceske Republice; ATACO: Ostrava, Czech Republic, 2010; pp. 23–29. ISBN 978-80-254-6456-4. (In Czech) [Google Scholar]
  26. Maier, K. Udržitelný Rozvoj Území; Grada: Praha, Czech Republic, 2012; p. 253S. ISBN 978-80-247-4198-7. [Google Scholar]
  27. Český Statistický Úřad. Available online: https://www.czso.cz/csu/czso/pocet-obyvatel-v-obcich (accessed on 1 October 2018).
  28. Liberecký Kraj. Investiční Příležitosti. Available online: https://investujpodjestedem.cz/gd-home/ (accessed on 10 December 2018). (In Czech).
  29. CzechInvest. Database of Brownfields. Available online: http://www.brownfieldy.eu/ (accessed on 1 October 2018).
  30. Prázdné Domy. Available online: https://prazdnedomy.cz/ (accessed on 10 December 2018). (In Czech).
  31. Industriální Topografie Průmyslová Architektura a Technické Stavby. Available online: http://www.industrialnitopografie.cz/ (accessed on 1 October 2018). (In Czech).
  32. Schejbalova, B. Some findings and recommendations from the subjective evaluation of disparities and other problems of municipalities with 500–3000 inhabitants in the Czech Republic. In Seminář—Výzkum Pro Řešení Regionálních Disparit V České Republice; ATACO: Ostrava, Czech Republic, 2010; pp. 23S–29S. ISBN 978-80-254-6456-4. (In Czech) [Google Scholar]
  33. Endel, S.; Teichmann, M.; Kutá, D. Possibilities of house valuation automation in the Czech Republic. Sustainability 2020, 12, 7774. [Google Scholar] [CrossRef]
  34. Kramarova, Z. Brownfields and the public in smaller settlements. In Člověk, Stavba a Územní Plánování IV; Czech Technical University in Prague, Faculty of Civil Engineering: Prague, Czech Republic, 2010; pp. 14–23. ISBN 978-80-01-04538-1. Available online: http://www.uzemi.eu/vystupy/publikace/-103-brownfieldy-a-verejnost-v-mensich-sidlech.html (accessed on 1 December 2018). (In Czech)
  35. Center for Community and Economic Development. Creative uses for downtown buildings in small tors. In A Sample of Ideas to Bring People Back Downtown; Wisconsin Economic Development Corporation: Madison, WI, USA, 2017; Available online: https://fyi.uwex.edu/innovativedowntownbusinesses/files/2017/03/Creative-Uses-for-Downtown-Buildings-030317.pdf (accessed on 20 December 2018).
  36. Beran, V.; Teichmann, M.; Kuda, F.; Zdarilova, R. Dynamics of regional development in regional and municipal economy. Sustainability 2020, 12, 9234. [Google Scholar] [CrossRef]
  37. Votocek, J. Solving the Problem of Brownfields. Ph.D Thesis, VSB-Technical University of Ostrava, Ostrava, Czech Republic, 2011. (In Czech). [Google Scholar]
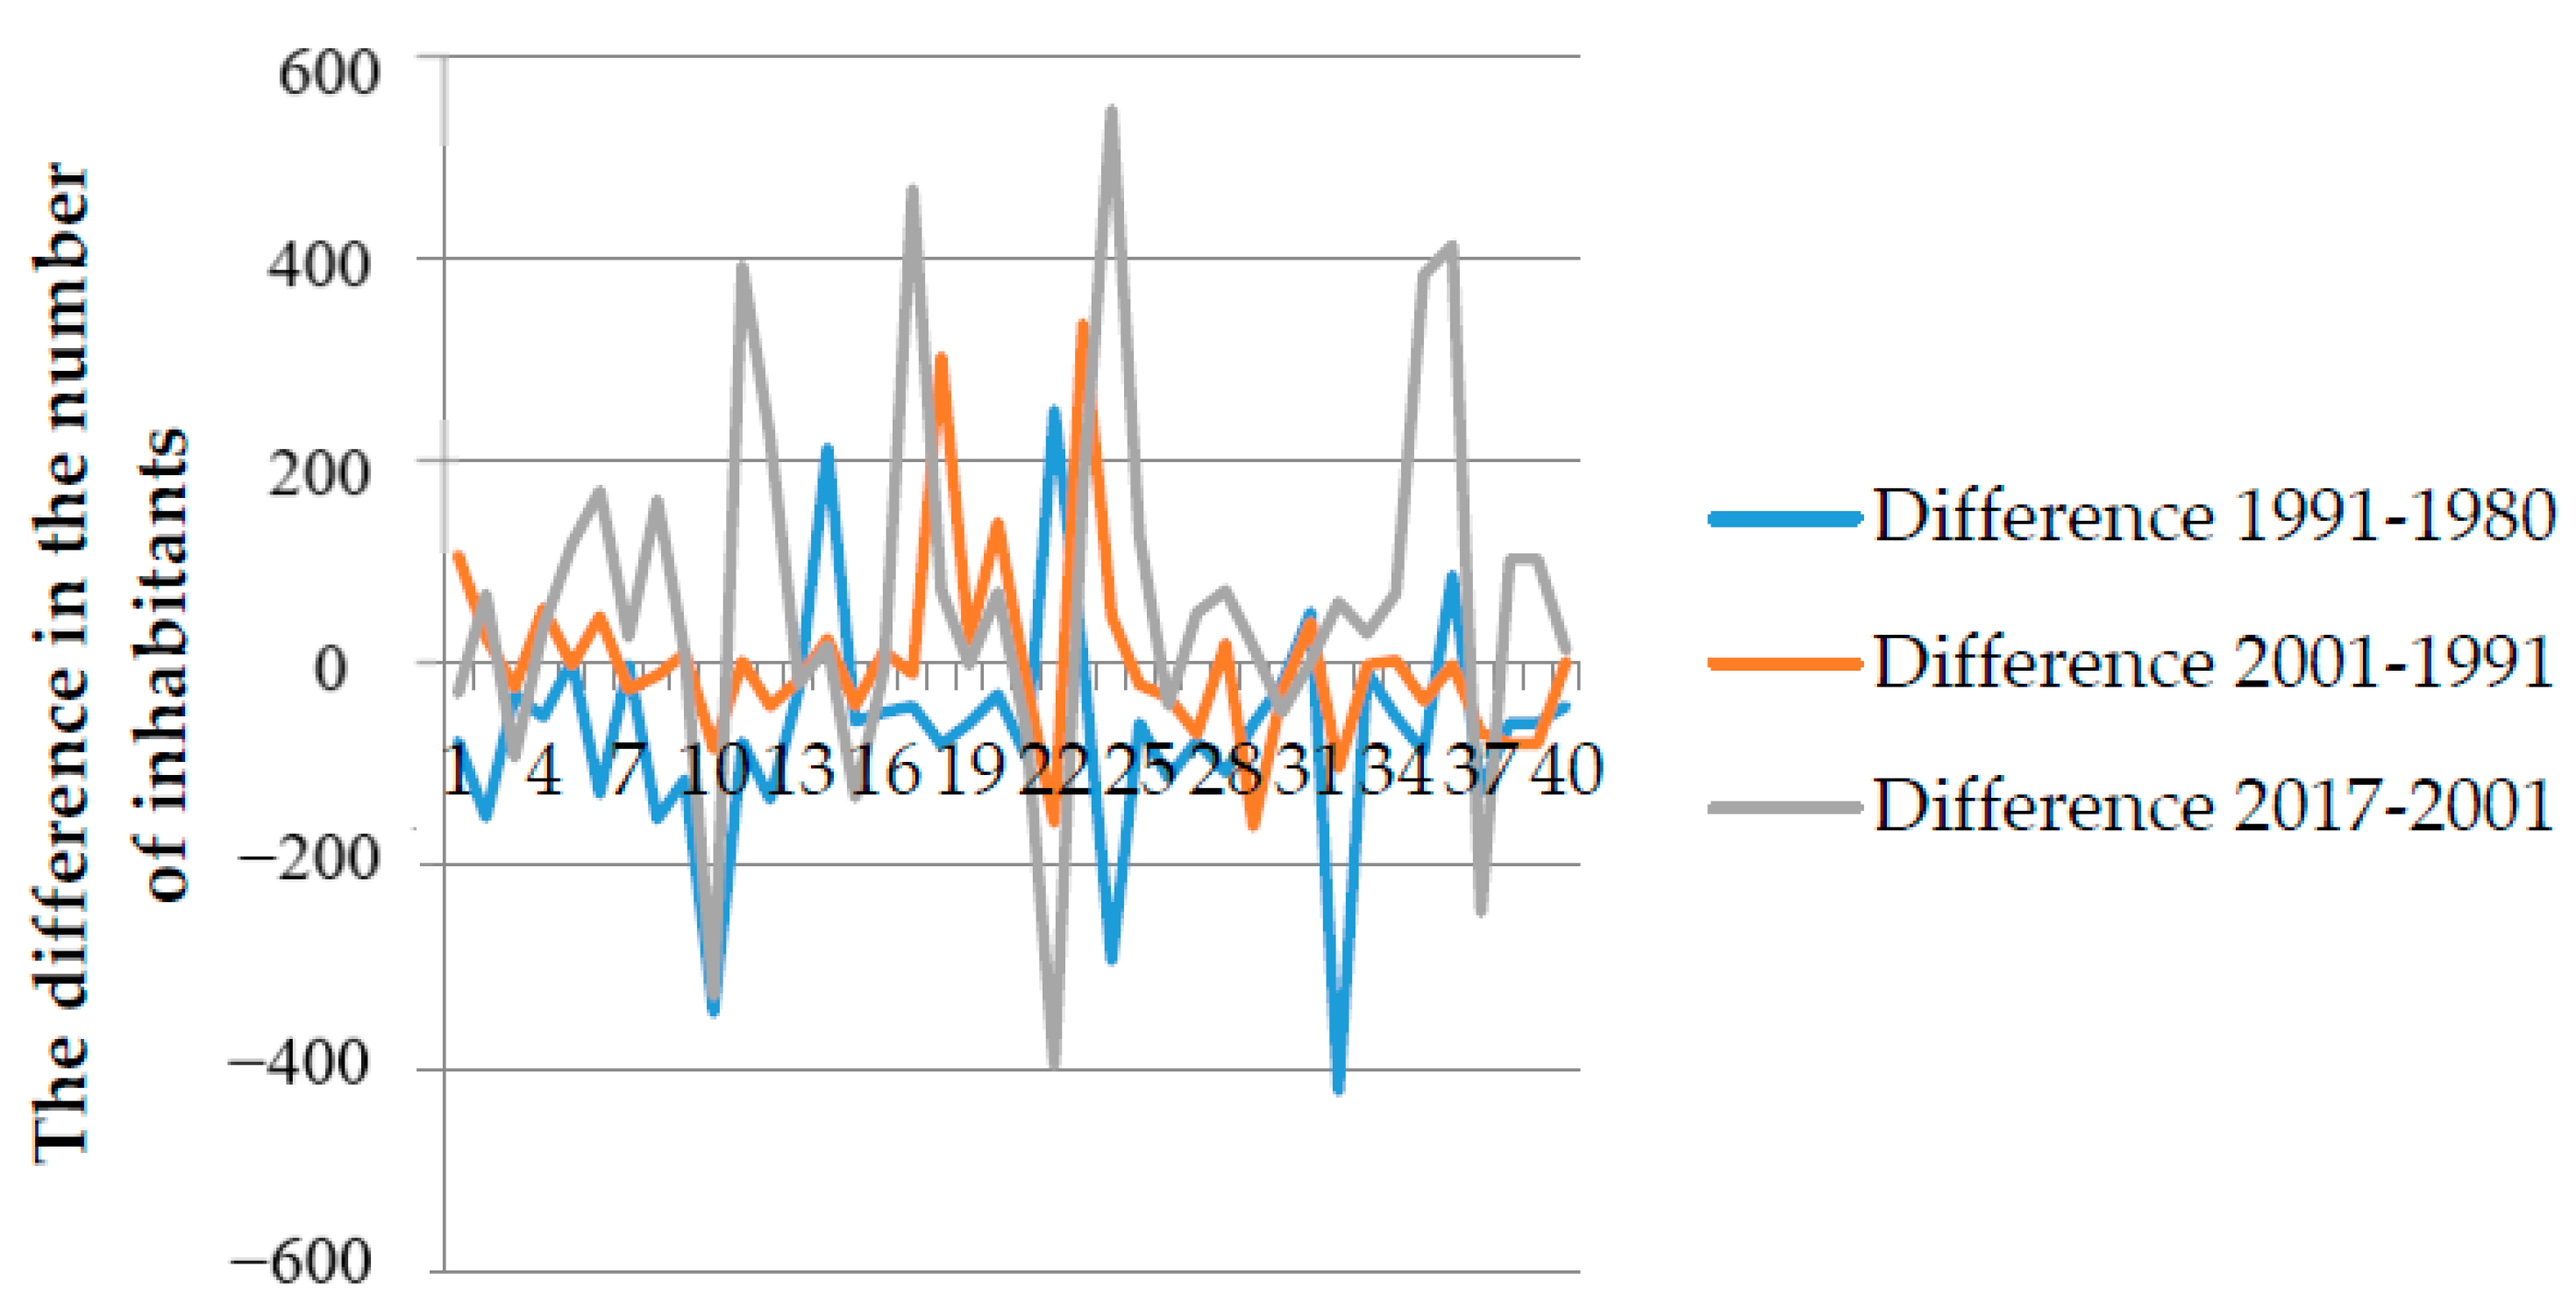
Figure 1. The difference between the increase and decrease in the number of inhabitants in the Czech Republic—own processing according to [28].
Sustainability 13 01232 g001
Figure 2. Overview of the number of brownfield sites according to the number of inhabitants in the Czech Republic—own processing according to [29].
Sustainability 13 01232 g002
Figure 3. Graphic analysis of data describing the location of individual brownfield sites in relation to the location of the regions of the Czech Republic—own processing according to [29].
Sustainability 13 01232 g003
Figure 4. An overview of the number of brownfield sites in individual regions of the Czech Republic—own processing according to [29].
Sustainability 13 01232 g004
Figure 5. The resulting linear regression table for the Example.
Sustainability 13 01232 g005
Figure 6. Residual analysis for the Example.
Sustainability 13 01232 g006
Figure 7. Histogram for the Example.
Sustainability 13 01232 g007
Figure 8. Scatter plots, Shapiro-Wilk test for the Example.
Sustainability 13 01232 g008
Figure 9. Kruskal-Wallis test for the Example.
Sustainability 13 01232 g009
Figure 10. Box chart for the Example.
Sustainability 13 01232 g010
Table 1. Output from multicriteria analysis.
A: Number of Inhabitants—Year 2001 B: Number of Inhabitants—Year 2017Difference [A−B]DistrictCadasterCadaster Area [m2]Settled Area [m2]Number of BuildingsNameArea [ha]UsageOwnershipGPSPast Usage
21128112600KroměřížBlišice (Koryčany)3,783,73663,988160Farma Blišice0.81partially abandonedprivate49°7′24.62″ N, 17°9′41.37″ Eagricultural
47684369−399Uherské HradištěBojkovice18,358,640455,6671422Statek Bojkovice6.42partially abandonedprivate49°2′30.12″ N, 17°47′16.44″ Eagricultural
60915574−517ZlínBrumov21,496,397290,9591056Škola Brumov0.89abandonedpublic49°5′10.78″ N, 18°1′28.91″ Eeducation
60915574−517ZlínBrumov21,496,397290,9591056Pivovar Brumov4.96abandonedprivate49°5′26.41″ N, 18°1′12.79″ Eindustrial
3633718KroměřížBrusné, Slavkov pod Hostýnem8,170,44464,974248Farma Brusné-Slavkov3.38partially abandonedcombination49°22′7.44″ N, 17°40′10.14″ Eagricultural
24482445−3Uherské HradištěBuchlovice31,961,913465,2021438Farma Buchlovice6.31partially abandonedcombination49°4′46.83″ N, 17°20′59.19″ Eagricultural
226180−46KroměřížCetechovice7,486,34167,184168Farma Cetechovice1.26partially abandonedprivate49°10′33.81″ N, 17°15′50.57″ Eagricultural
226180−46KroměřížCetechovice7,486,34167,184168Sýpka Cetechovice1.3abandonedprivate49°10′26.24″ N, 17°15′43.47″ Eagricultural
31637054ZlínDivnice, Lipová7,235,337152,095331Průmyslový areál Slavičín110partially abandonedprivate49°6′4.99″ N, 17°54′23.09″ Eindustrial
31637054ZlínDivnice7,235,337152,095331Vojenský areál Divnice7.48partially abandonedcombination49°5′40.63″ N, 17°54′25.76″ Emilitary
Table 2. Output from multicriteria analysis.
Result (Product of Weights)Sequence
2.87466 × 10−131
1.84188 × 10−105
9.01057 × 10−114
3.18294 × 10−122
1.95001 × 10−113
Table 3. Actual frequencies for the example.
Type of OwnershipUp to 20 Years20–40 YearsOver 40 YearsSum of Frequencies ni
Private910221
Public3205
Ecclesiastical0022
Sums of frequencies nj1212428
Table 4. Expected frequencies for the Example.
Type of OwnershipUp to 20 Years20–40 YearsOver 40 YearsSum of Frequencies ni
Private99321
Public2.142.140.715
Ecclesiastical0.860.860.292
Sums of frequencies nj1212428
Publisher’s Note: MDPI stays neutral with regard to jurisdictional claims in published maps and institutional affiliations.