1. Introduction
The presence of sport cyclists riding on two-lane rural roads is frequent in Spain, both individually and in groups. This fact is correlated with the increment of the number of sports licenses for cyclists and cycling clubs in Spain, reaching 74,768 federated cyclists and 3878 federated clubs in 2019 [
1]. As the number of cyclists increases, so does the number of accidents involving cyclists. In 2018, 7598 accidents involving cyclists were reported in Spain. Even though most of these accidents occurred on urban roads (72%), a relatively high proportion (74%) of deaths related to cyclist accidents were recorded on rural roads [
2].
Spanish two-lane rural roads represent about 90% of the overall network. Most of these roads, where the presence of cyclists is very common, have a narrow section where a shoulder does not exist or is impassable. In fact, 54% of two-lane rural roads have a section width of less than 7 m, and 16% have a width of less than 5 m [
3]. A study carried out in the Valencian region, which used data from 2008–2013 on accidents involving cyclists, showed that 78% of accidents occurred on narrow two-lane rural roads [
4]. Two-lane rural roads in Spain have been mainly designed for motorized vehicles; however, these roads have to be increasingly shared with sport cyclists. This fact can produce an impact on both safety and traffic operation.
Bicycles and motorized vehicles are different in terms of speed, volume, weight, and level of protection for the users. Due to these differences, they usually have to interact by overtaking maneuvers; however, this interaction is very dangerous. The main variables associated with the overtaking manoeuvre are the lateral clearance and the speed difference between the overtaking vehicle and the bicycle. Numerous studies have been developed to analyze manoeuvres by motorized vehicles to overtake cyclists on two-lane rural roads by collecting real data.
Some studies used instrumented cars to collect data with different aims. Dozza et al. [
5], using this methodology, identified four phases of the overtaking manoeuvre (approaching, steering away, passing, and returning). Feng et al. [
6] showed that with the presence of a bike lane (or paved shoulder), a dashed non-centre line produced significantly less lane-crossing than a solid centreline. Kovaceva et al. [
7] concluded that the higher the speed, the larger the lateral clearance maintained by overtaking cars; and drivers were significantly closer to the cyclist when an oncoming vehicle was present. The results from the studies by Dozza et al. [
6] and Kovaceva et al. [
7] highlighted the need for legislation on minimum overtaking distance stratified by vehicle speed.
Driving simulation is another methodology used to analyze different factors related to overtaking manoeuvres to cyclists on two-lane rural roads [
8,
9,
10,
11,
12].
The interactions between motorized vehicles and bicycles on two-lane rural roads has also been analyzed using instrumented bicycles. García et al. [
13] instrumented a bicycle to study the effects of road geometry on overtaking manoeuvres to cyclists in rural roads with different lane and shoulder width. Results showed that, on narrow roads, the percentage of vehicles that occupied the opposing lane is higher. Chapman [
14] evaluated lateral clearance by analyzing the overtaking of bicycles on rural roads with and without bicycle lanes; showing that bicycle lanes reduced the opposing lane invasion and kept the overtaking vehicle trajectory more constant. Llorca et al. [
15] collected a significant number of variables such as lateral clearance, overtaking vehicle speed and type, opposing lane occupation, and cyclist subjective risk perception using an instrumented bicycle. Their results showed a correlation between cyclist risk perception and aerodynamic forces, measured by combining lateral clearance and vehicle speed. Other studies have analyzed the maneuver when passing groups of cyclists. In this line, Pérez-Zuriaga et al. [
16] instrumented bicycles to study the behavior of drivers when passing one, two and four cyclists riding in line on four different rural roads, and their results showed higher speeds and lower clearances when overtaking a cyclist than a group. Using instrumented bicycles, García et al. [
17] also analyzed the influence of grouping configuration on the interaction between cyclists and motor vehicles on two-lane rural roads. They studied a small group of up to three cyclists, concluding that when cyclists rode two-abreast, lower lateral clearance was registered, and when riding in a group, motor vehicle speeds were lower. Moll et al. [
18] analyzed the effect of different factors related to the road, cyclist grouping, and overtaking manoeuvres on the overtaking duration. Results showed that, on narrow roads, the overtaking duration was higher than on wider ones, and it depended on the number of cyclists in the group as well as their configuration.
Most of the studies mentioned above focused on safety measures such as lateral distance or overtaking speed during the overtaking maneuver, but no studies were found related to traffic operation on rural roads with cycle traffic.
On the other hand, the way cyclists ride on two-lane rural roads influences safety and traffic operation. Spanish regulations allow cyclist groups to ride two-abreast as long as there is enough visibility, and cyclists are obliged to ride on the shoulder, or, if it is impracticable, on the right side of the lane. The overtaking manoeuvre is also regulated, requiring a minimum lateral distance of 1.5 m. To facilitate the operation, overtaking bicycles even across a solid line is allowed [
19]. However, from the safety point of view, it is also necessary identify which grouping configuration is safer considering road characteristics and group size. López el al. [
20] studied the perceived risk of a group of ten cyclists when riding in different grouping configurations, and they stated that when cyclists ride two-abreast the overtaking speeds and the lateral clearances were lower, and more accelerative overtaking maneuvers were performed. Accelerative maneuvers are perceived safer by cyclists; lower overtaking speeds and higher lateral clearances were perceived safer as well. In a survey performed by López et al. [
21], cyclists stated a preference to ride two-abreast on narrow two-lane rural roads. Two-abreast configuration implies that motor vehicles have to occupy more space in the opposing direction when overtaking cyclists.
On two-lane rural roads, the possibility of overtaking improves traffic operation, and when there is cycle traffic at a slower speed, overtaking becomes more necessary to ensure an adequate level of service. On narrow roads, overtaking requires practically full occupation of the opposite direction, and in many cases, the overtaking manoeuvre starts from a follow-up stage generated by the impossibility to overtake due to low visibility or oncoming traffic, forcing the vehicle to perform an accelerative manoeuvre. The characteristics of these roads can create a more dangerous situation when motorized vehicles and bicycles interact, and can impede manoeuvring, affecting traffic operation and cyclist’s safety.
To analyze how cycle traffic influence safety and traffic operation on narrow rural roads, it is necessary to obtain field data. From observations, it is possible to obtain safety and performance measures to enable study of the phenomenon. However sometimes, field data are insufficient to perform a complete analysis, and other methodologies, such as traffic microsimulation, can be explored. Microsimulation is a useful tool to analyze many aspects such as traffic stream, emissions, safety, and traffic operation. There are many studies that have applied this methodology to the rural environment, with many different aims. However, there are few that use traffic microsimulation including motorized vehicles and cyclists, and all of them were developed in an urban context [
22,
23,
24]. As a far as the authors are aware, microsimulation has not been used to evaluate the impact of interurban cycling.
This paper presents a traffic microsimulation study to incorporate cyclists and evaluate the effect on two-lane narrow roads. Aimsun Next traffic microsimulation software was used. Aimsun Next has an overtaking module for two-lane rural roads that was modeled, calibrated, and validated with field data on Spanish roads by Llorca et al. [
25]. The current overtaking module was developed considering both light and heavy motorized vehicles, however cyclists were not included. This study introduced bicycles into the overtaking module, incorporating their circulation characteristics and their interaction with motorized vehicles based on field data collected on two-lane narrow roads. To adapt the microsimulator to cycle traffic, several limitations had to be overcome.
Different safety and performance measures obtained from field observations were used to calibrate and validate the microsimulator. By using microsimulation, new performance measures could be obtained. All of these safety and performance measures are used to determine how observed traffic scenarios influence safety and traffic operation on a narrow road.
The results of this study can help road administration to improve the safety and the traffic operation on narrow rural roads with cycle traffic. These improvements can reduce emissions and promote the use of bicycles, increasing the sustainability of the system.
The remainder of the paper is organized as follows:
Section 2 presents the main objectives of the research. In
Section 3 the research methodology and data are drawn.
Section 4 shows the results and discussion. Finally, the last section presents the conclusions.
3. Materials and Methods
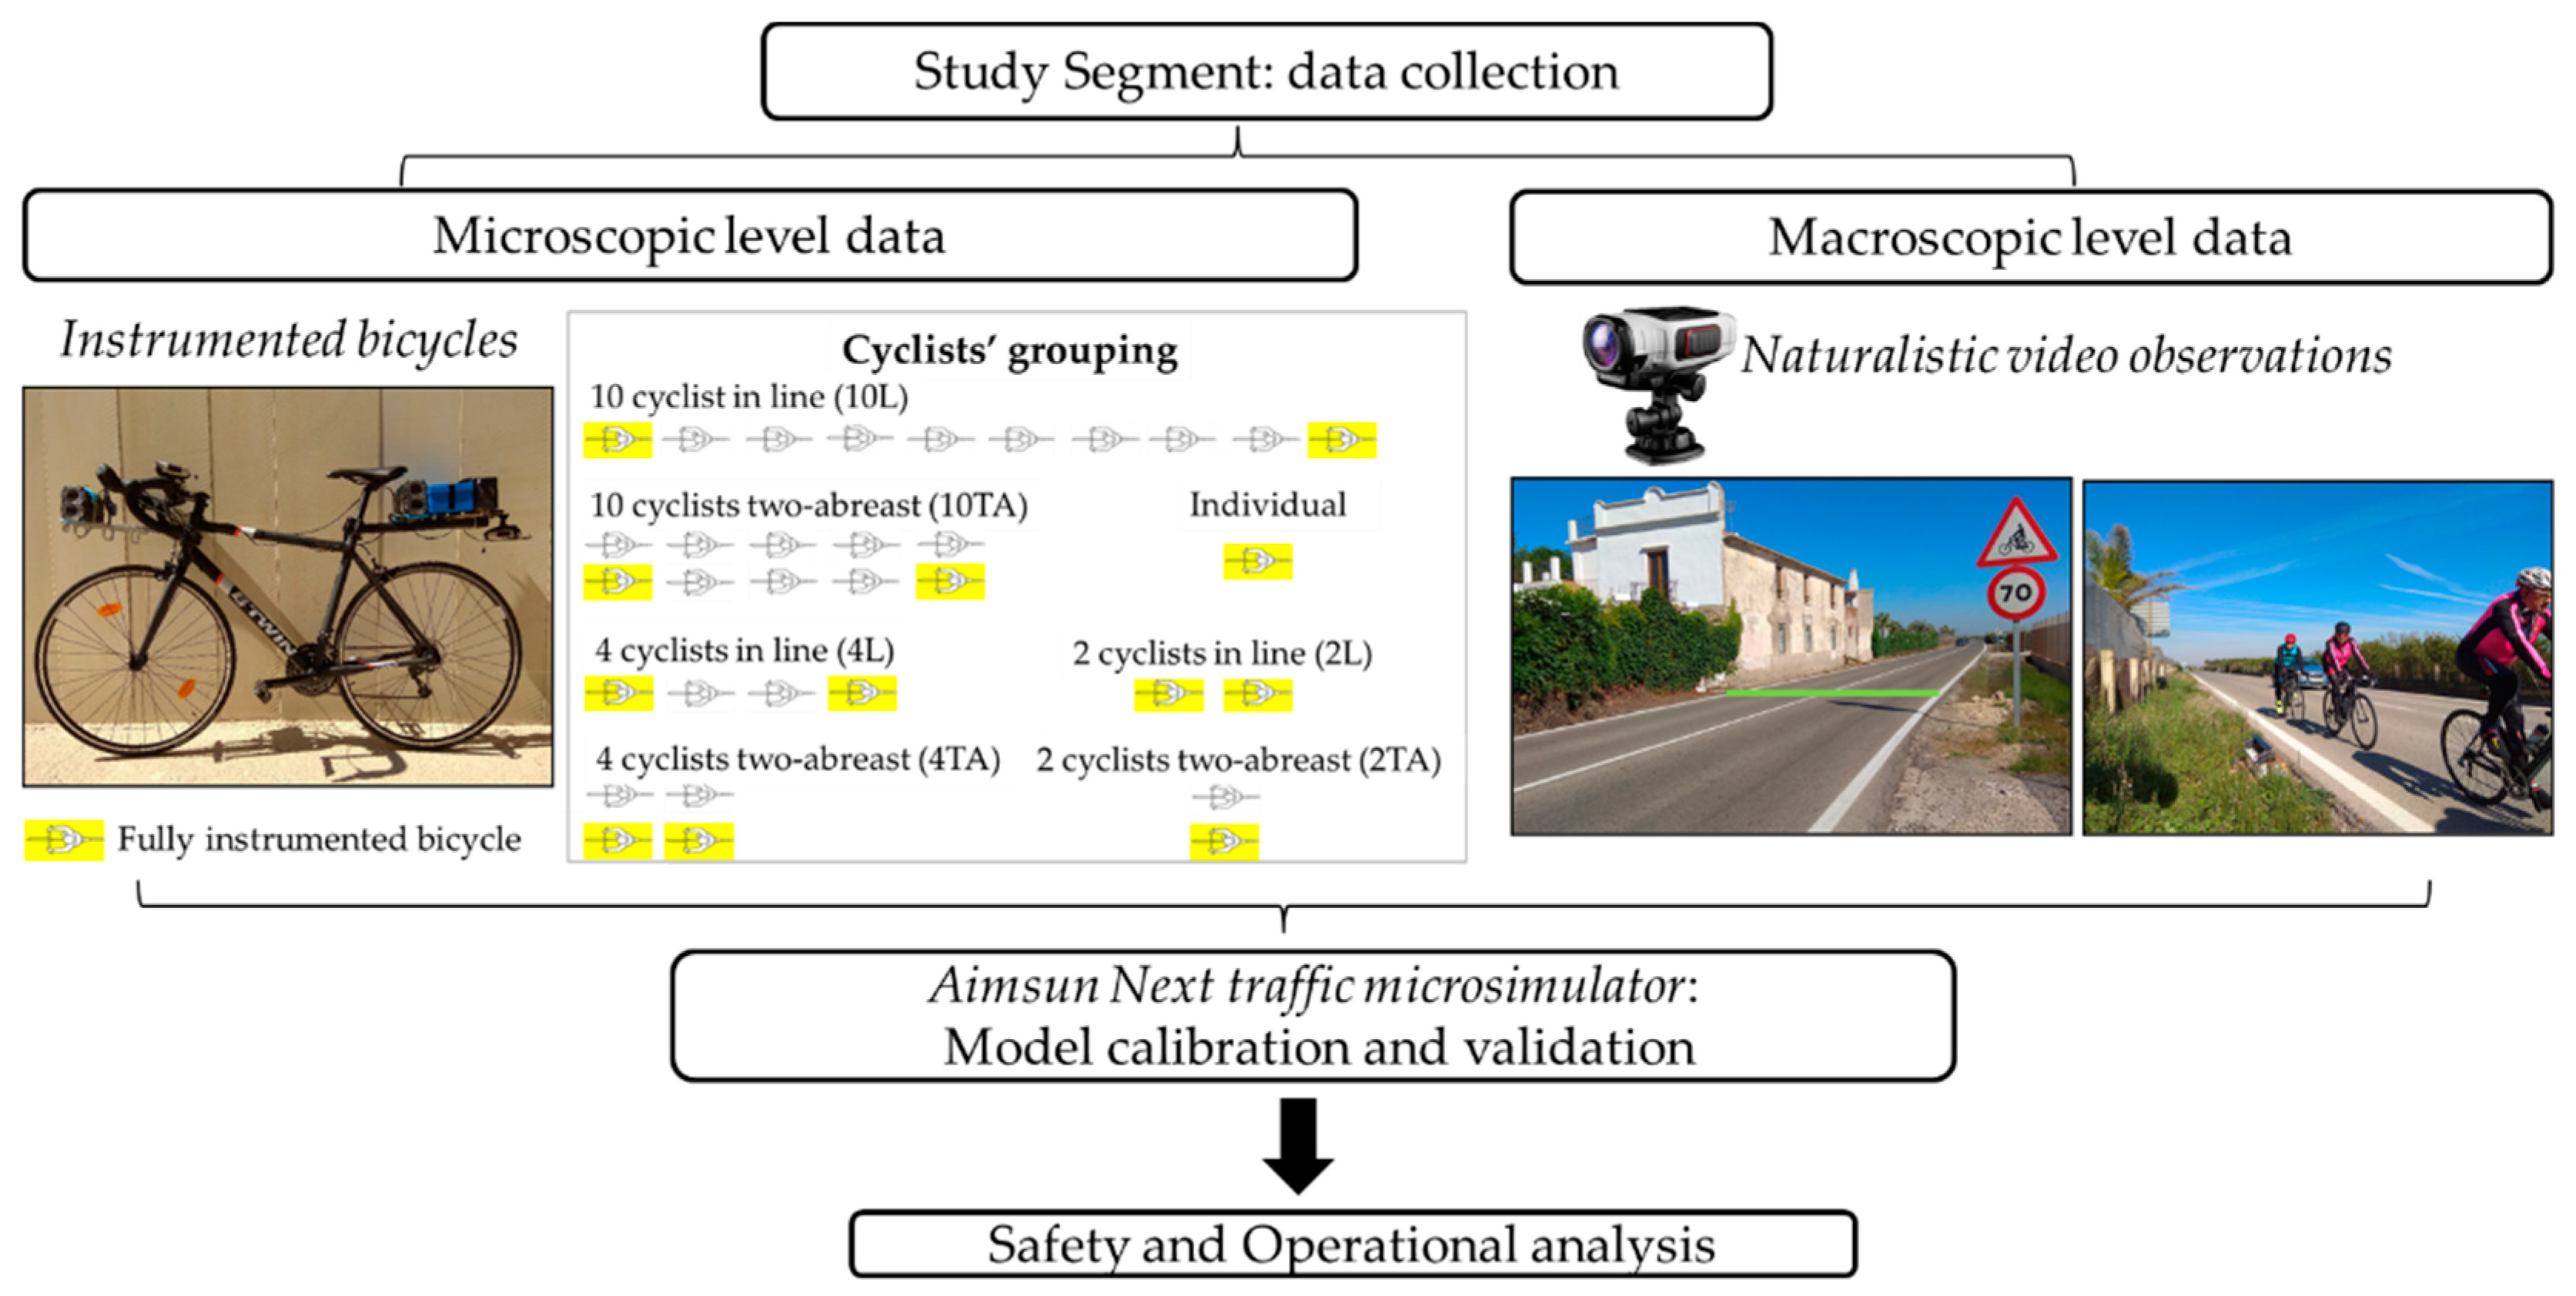
The methodology developed is shown in
Figure 1. The observation of the phenomenon was performed by using two different methodologies for field data collection; on the one hand, bicycles were instrumented to obtain data related to the overtaking manoeuvre at a microscopic level, and on the other, naturalistic videos from static positions were recorded in the study segment to obtain traffic volumes and performance measures that characterize traffic operation at a macroscopic level.
The microscopic level covers the individual data of each road user, such as specific speeds or headways. The macroscopic level encompasses traffic stream variables, which represent the operation of the entire system, such as average travel speed or percent followers. Thus, the phenomenon will be analyzed at two levels, micro and macro, because the two types of variables are necessary to understand the behavior of drivers and cyclists.
Once the data were collected, safety and performance measures and different traffic scenarios, both bicycles and motorized vehicles, were obtained from observations.
The microsimulation model and the overtaking module developed for two-lane rural roads in Aimsun Next were analyzed and adapted to correctly reproduce cycle traffic and their interaction with motorized vehicles. The adapted model was calibrated and validated with field data, and their validity was verified to simulate narrow two-lane rural roads with motorized vehicle and bicycle traffic.
The impact on safety and traffic operation of cycle traffic was determined by using data from observations and microsimulation.
3.1. Study Segment
This study was performed on a segment of narrow two-lane road situated near Valencia (CV–502), so the model could be calibrated and validated with real data. The studied segment had no shoulder, had a lane width of 3.5 m, an Annual Average Daily Traffic (AADT) of 4633 vehicle/day, and a percentage of heavy vehicles of 1.34% [
26]. It was parallel to the coast, and the slope was practically nil throughout the segment. Its length was 2.185 km. The segment was homogeneous without intermediate entrances or exits. To insert the segment into the microsimulator geometric data, posted speed limits and solid lines were collected in the field. The speed limit was 60 km/h. There were 6 curves with radii between 246 and 760 m, and only one with a higher radius (2012.6 m) situated in the middle of the segment. There were 4 non-passing zones, with lengths less than 350 m, homogeneously distributed within the segment.
In this road, several traffic counts were performed, and a high presence of cycle traffic was verified, both on weekdays and weekends. Most of these cyclist groups rode two-abreast. This is a regular road for cycling club tours, where, in recent years, several accidents involving cyclists have been reported.
3.2. Microscopic Level Data
To correctly analyze the interactions between motorized vehicles and bicycles, it is necessary to understand the overtaking manoeuvre. To study this, a data collection methodology based on instrumented bicycles riding the studied segment was designed.
Instrumented bicycles can be observed in
Figure 1. They were equipped with two high-definition video cameras, one located on the bicycle’s handlebar and the second located in the rear of the bicycle. The frontal camera recorded interactions with oncoming vehicles and the end of the overtaking manoeuvre, and the rear camera recorded the approaching vehicle and the start of the manoeuvre. These cameras incorporated a GPS that provided the position and the speed of the bicycles. Bicycles were also equipped with laser devices that collected overtaking vehicle speed and lateral clearance between vehicle and bicycle during the overtaking manoeuvre.
Before collecting data with the instrumented bicycles, observations of the bicycle traffic were performed in the studied road to determine the most common configurations used by cyclists. From these observations, the data collection with instrumented bicycles was designed, in which 7 different configurations of the cyclist group were studied. There was a group of 10 cyclists in the first tests, and 4 cyclists in the following tests, which rode in the configurations indicated by the research team (
Figure 1). Cyclists were semi-professionals, who usually practiced cycling as a sport on two-lane rural roads.
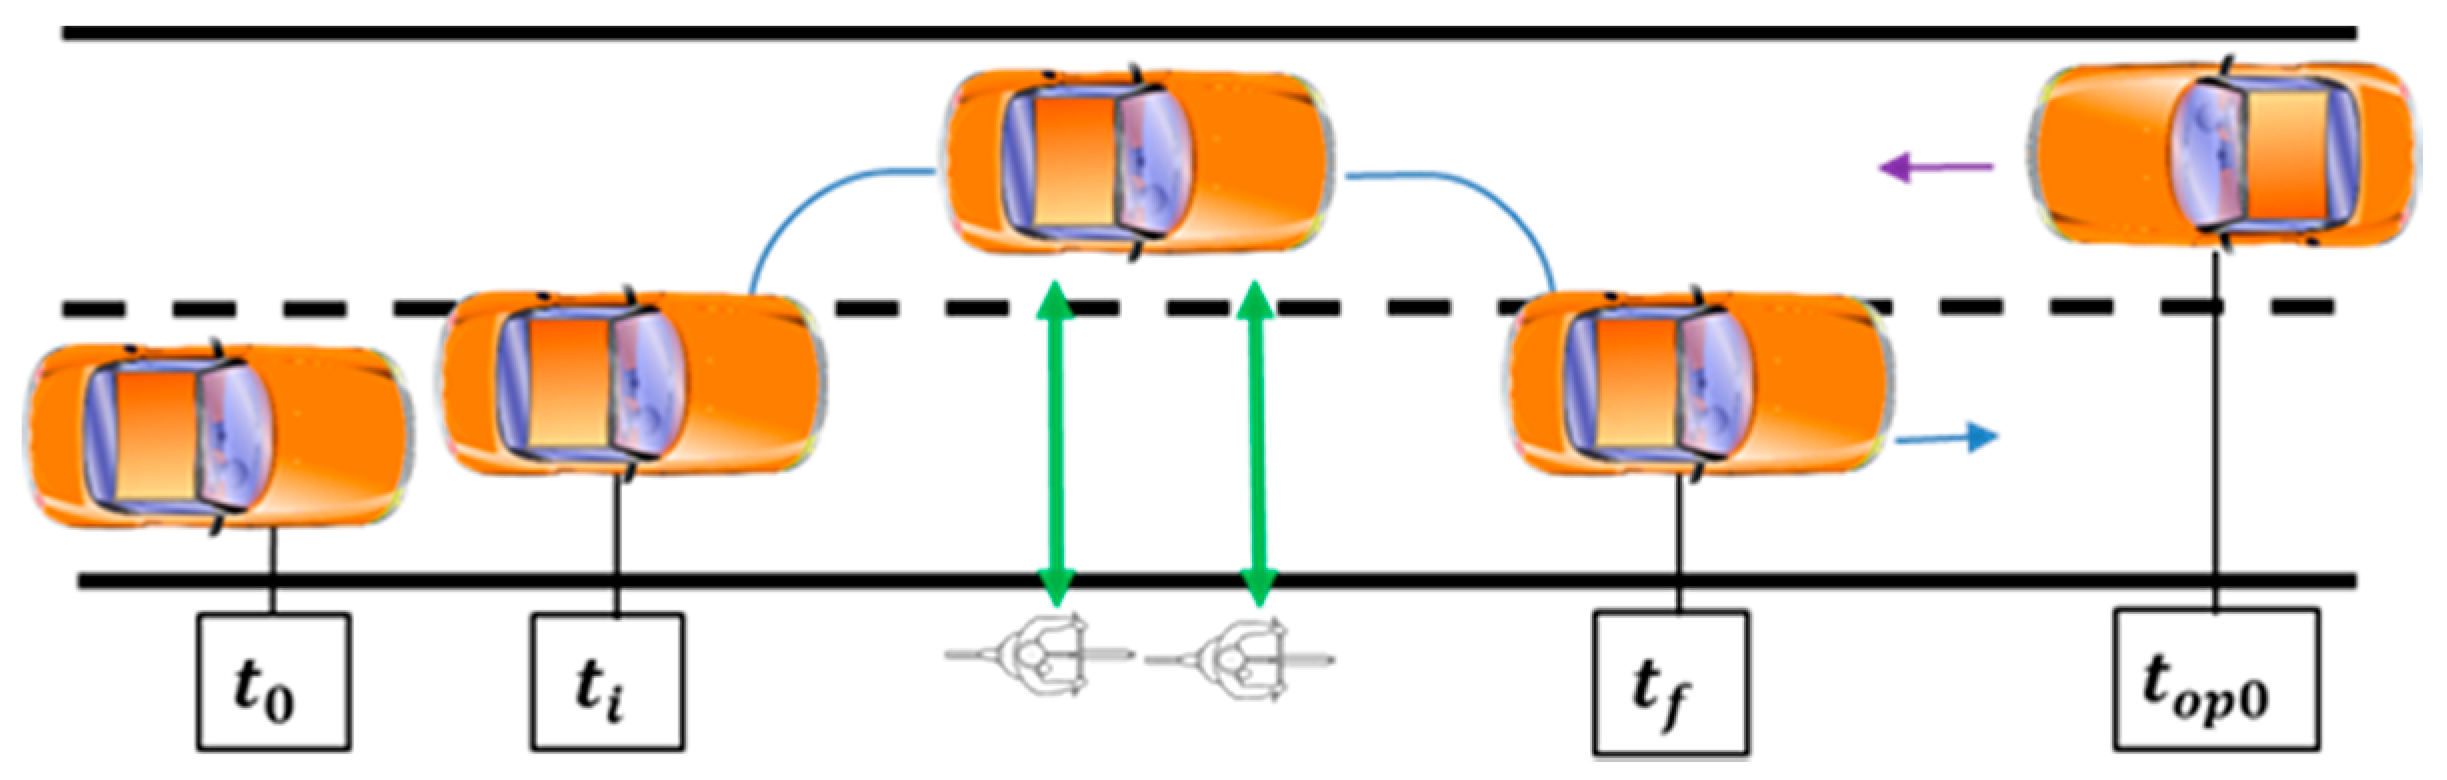
From data collection and reduction, variables characterizing the overtaking manoeuvre of motorized vehicles to cyclists were identified. Overtaking duration for the different groups of cyclists was the main variable used to calibrate and validate the traffic microsimulator. The duration of overtaking is defined as the time from the overtaking vehicle starting the manoeuvre until it returns to its lane (
Figure 2).
Other variables obtained with this methodology, for each overtaking manoeuvre, were overtaking vehicle speed, lateral clearance, opposing lane occupation, type of overtaking vehicle, and the presence of an oncoming vehicle.
3.3. Macroscopic Level Data
To study the effect that cyclists have, videos from a static position at the start and end points of the studied segment were recorded simultaneously. All these recordings were made with high-definition video cameras, which were strategically positioned so the studied variables were perfectly collected in a naturalistic way.
Data reduction, beginning with the start of the segment and following with the end, was carried out using Kinovea video processing software. The timestamp and the typology of each road user was registered. In the case of groups of cyclists, the number of cyclists, their configuration (in-line or two-abreast), and a description to identify the same user in the end point were registered.
Following the methodology of the Highway Capacity Manual (HCM) [
27], traffic volumes were calculated with sliding windows of 5 min, and for each 15 min value the equivalent hourly traffic volume was obtained. Traffic volumes were calculated for bicycles and motorized vehicles, for each traffic direction. To perform the macroscopic analysis, after processing the data, the following variables were calculated:
Time headway between users at start and end points of the segment (TH);
Number of cyclists that form each cyclist group and its in-line (L) or two-abreast configuration (TA);
Travel time of each user (TT);
Average travel speed of individual bicycles (BInd_ATS);
Average travel speed of groups of cyclists (BGroup_ATS);
Average travel speed of motorized vehicles (Motor_ATS);
Percent of followers considering the 3 s criterion suggested by the HCM. It was calculated both at the start and end points of the segment and considering all users (PF);
Percent time spent following, calculated according to the HCM methodology (PTSF).
Finally, equivalent hourly volumes were used to provide the traffic scenarios necessary to calibrate and validate the microsimulator, and to determine the effect of cycle traffic on the road.
3.4. Microsimulation Model Adaptation
Aimsun Next software, version Aimsun Next 20 [
28], was used in this study. Aimsun Next correctly represents the motorized vehicle traffic characteristics on two-lane rural roads, especially the overtaking manoeuvre, because it was developed and tested in different studies [
25,
29].
The passing model is based on three stages of the overtaking manoeuvre: desire, decision, and execution. In the current model, when a vehicle cannot reach its desired speed, it considers the possibility to overtake. The desire to pass is based on four variables (time spent following, difference between desired and actual speed, rank in the queue, and remaining time to the end of the segment). Considering motorized vehicles and bicycles, the desire is always positive due to the high speed difference. The decision to pass is conditioned to verifying if passing is allowed by a non-solid centre line and if simultaneous passing maneuvers are allowed; if this occurs, the gap acceptance process starts. An available gap is accepted if the required gap is minor. In Aimsun Next, it is assumed that each passing vehicle maintains a constant acceleration during overtaking until its desired speed is reached, and then a constant speed is maintained. A passing gap in the opposing direction is accepted if the overtaking duration needed plus a safety margin is less than the time to collision with the oncoming vehicle, whenever the passing time is less than the time until the end of the passing zone. This is an iterative process evaluated in every simulation step. When a gap is accepted, the overtaking vehicle starts the maneuver by accelerating and changing to the opposing lane. In the passing phase the abort time is calculated, and the maneuver is evaluated at each simulation step by re-calculating the overtaking duration needed, time to collision, abort time and the safety margin considered.
However, the overtaking manoeuvre on cyclists has some particularities that have to be included into the microsimulation model: the possibility to overtake a group of cyclists even with a solid line and with partial opposing lane invasion. Some modifications have to be performed to adapt the current passing model to correctly represent bicycles and their interaction with motorized vehicles, without neglecting the interactions between motorized vehicles.
From the authors’ collaboration with the Aimsun Next team, Aimsun Next 20 version has a two-way overtaking model enhancement to model vehicles overtaking other vehicles with a very low desired speed even when there is a solid line. This reflects the fact that, in some countries, a motorized vehicle is allowed to overtake a cyclist even on a road with a solid line [
28]. In this way, it is possible to simulate two overtaking behaviors inside the same simulation, one between motorized vehicles and other between motorized vehicles and bicycles.
In the current two-lane passing module, the bidirectional and the bidimensional models were not compatible, so the lateral movement into the lane was not possible, therefore being impossible to represent the partial opposing lane invasion. To overcome this limitation, the effective length of the different cyclist groups to achieve simulated overtaking durations considering a total opposing lane invasion closer than those observed was calibrated. Every group of cyclists was considered as one user in the microsimulation model, because they rode together at the same speed, as seen in the field observations.
Microsimulation Model Calibration and Validation
The model was calibrated firstly at microscopic level, checking that overtaking manoeuvres to bicycles were carried out correctly. Observed overtaking durations to the different groups of cyclists were used to calibrate the equivalent lengths of each cyclist group introduced into the microsimulator. In Aimsun Next 20, overtaking duration is considered the opposing lane occupation time. Therefore, the length of each cyclist group was a parameter to calibrate, thus overcoming the limitation of the impossibility of partial invasion of the opposing direction. The desired speeds of each road user type were calibrated as well, to obtain a correct behavior.
Secondly, the model was calibrated at macroscopic level by checking basic performance measures for different traffic scenarios. To achieve a PF at the entrance of the segment closer than that observed, a queue generation segment was connected before the studied segment, and its length was calibrated. Motor_ATS, TH, and PF at the end of the segment were used to calibrate the rest of the model parameters.
Statistic tests were performed to compare the simulation results to observed data. A non-parametric Kolmogorov–Smirnov (K–S) test was used to compare distributions of overtaking durations, Motor_ATS and TH. The null hypothesis implied that both samples come from the same distribution. The maximum distance between the cumulative distributions were obtained and compared to an admissible distance.
Mean, standard deviations, and median values of simulated and observed distributions were compared by
t-test, F-test, and U-test, respectively. The null hypothesis in these tests implied that the mean, standard deviation, or median of simulated and observed samples would be equal. ANOVA tests were performed to determine the existence of statistically significant differences between two samples of data that comply to the assumptions required to apply an ANOVA test. To compare results from the simulation and observed data, the root mean square error (
RMSE) was used:
where
Vsim,i is the simulated variable at scenario
i;
Vobs,i is the observed variable at scenario I; and
N is the number of calibration or validation scenarios.
The calibration process was carried out with three traffic scenarios: the maximum (Calmax), minimum (Calmin), and medium (Calmed) bicycle volumes. The model was validated in four traffic scenarios, different from those used for calibration.
3.5. Safety and Performance Measures
To analyze the impact that cyclists produce, the following measures were evaluated:
Safety (from field observation): overtaking duration, overtaking speed and clearance;
Operation (from field observation): average travel speed, percent followers, percent time spent following, and time headways;
Operation (from microsimulation): delay time.
4. Results and Discussion
To begin with, details of the results obtained using the methodologies to collect field data are described. Secondly, the results of the calibration and validation processes of the Aimsun Next software are shown. From these results, a safety and an operational analysis are carried out.
4.1. Microscopic Level Data
A total of 235 overtaking manoeuvres on the cyclist groups were recorded: 96% of cases were carried out by light vehicles, 3% by heavy vehicles, and 1% by motorcycles. Heavy vehicles were characterized as those with two axles or were longer than 10 m. The aim of this study was to analyze the interaction between light vehicles (mainly passenger cars) and bicycles. The main reason was that the behavior of drivers of the light and heavy vehicles and motorcycles when interacting with cyclists may be different, due to the differences between these motorized vehicles in terms of speed, size, and aerodynamical effects. The percentage of manoeuvres that were carried out from a previous follow-up was 21%. Most (99%) of the manoeuvres were realized by invading the opposing lane; from these, 55% implied a total invasion. A total of 92% of the manoeuvres were realized without a visible oncoming vehicle. This high percentage of following and opposing lane occupation was due to the segment cross section, because it was a narrow section without a shoulder, where vehicles must invade practically the entire opposite lane to overtake the bicycles. These results agree with García et al. [
13] and Bella and Silvestri [
8], who determined that narrow roads presented higher opposing lane invasion and lower clearances.
Table 1 shows the overtaking vehicle speed, the lateral clearance, and the overtaking duration between motorized vehicles and the different bicycle groups. To explore if there were significant differences between the study variables among the different cyclist group configurations, an ANOVA assessment was performed. The results indicated that overtaking speed was similar for all cyclist configurations and no statistically significant differences between the means were found (F = 0.76,
p = 0.601). Results indicated that there were statistically significant differences between the mean lateral clearance considering each cyclist configuration (F = 3.02,
p < 0.05), presenting higher values when cyclists rode in line; considering the mean values, all of them respected the minimum required distance of 1.5 m.
Finally, there were statistically significant differences between the means of overtaking duration of the different cyclist groups (F = 12.04, p < 0.001). The data present a directly proportional relationship between the overtaking duration and the number of cyclists that form the group. It was also observed that, for groups with the same number of cyclists, longer durations occurred when they rode in line compared to two-abreast.
4.2. Macroscopic Level Data
Data were collected simultaneously at the start and end points of the studied segment during a weekday morning. The data were reduced and analyzed in both directions, and finally the study was centred on the direction with a higher presence of cyclists. There were 166 bicycles and 263 motor vehicles registered in the studied direction, and 93 bicycles and 319 motor vehicles in the opposing direction. From 166 cyclists registered in the studied direction, 59 rode individually and the rest rode in groups of up to 12 cyclists, most of them riding two-abreast.
An ANOVA test did not show statistically significant differences between the mean values of individually bicycle average travel speed and bicycle groups average travel speed (F = 0.09,
p = 0.759); then, for the microsimulator it was established that all the bicycles, both individual and groups, ride with the same speed distribution. The ATS distributions (
Figure 3) were then used to model the maximum desired speed of motorized vehicles and bicycles on the microsimulator.
A total of 31 different traffic scenarios were obtained with different cycle and motorized vehicle traffic volumes.
Table 2 shows the traffic scenarios chosen to calibrate and validate the adapted traffic microsimualtor. Scenarios with maximum, medium, and minimum hourly bicycle volumes were used to calibrate (Calmax, Calmed, Calmin). The four selected validation scenarios (Val1, Val2, Val3, Val4) covered a wide range of traffic volumes, both of motorized vehicles and cyclist. For each traffic scenario, the ATS of motorized vehicles and bicycles was calculated. TH, PF (at start and end segment points) and PTSF was also calculated; these results are shown in the next section.
Traffic scenarios were simulated considering all cyclists groups riding two-abreast, because it was the grouping configuration that offered the lower overtaking duration and was the most frequent in the field observations.
4.3. Microsimulation Calibration and Validation
The values of the parameters that minimized the differences between the observed values and the results of the simulations are shown in
Table 3. The rest of the parameters were reviewed, and the Aimsun Next default values considering only motorized vehicles were chosen.
Results were obtained considering 15 replications of each simulation scenario to reduce the variability associated with the simulator’s randomness. The model stability with 15 replications was checked considering travel times and total demands, obtaining a variation lower than 5% maximum relative error.
4.3.1. Microscopic Calibration
The overtaking manoeuvres were checked in calibration scenarios, and the equivalent length of each cyclist group (
Table 3) was calibrated to obtain overtaking durations closer to observations.
Table 4 shows the simulation results of the overtaking duration for each calibration scenario and grouping configuration. ANOVA tests were performed, and results showed that there were no statistically significant differences between the means of overtaking duration with a 5% significance level, indicating the validity of the calibration process.
A total of nine K–S tests were performed to compare the overtaking duration distributions of observed and simulated data for each calibration scenario and cyclist group configuration. Only for an individual cyclist was a p-value < 0.05 obtained, indicating that for the other configurations, the distributions of overtaking durations did not present statistically significant differences at the 95% confidence level.
4.3.2. Macroscopic Calibration
The first performance measure used to calibrate the microsimulator was the average travel speed of motorized vehicles.
Figure 4 shows that simulated distribution agrees with the observed data for each calibration scenario.
K–S tests results are shown in
Table 5, indicating there were no statistically significant differences between the average travel speed of motorized vehicles distributions of simulation results and those observed with a 95% confidence level for all calibration scenarios. Motor_ATS mean values were compared by a
t-test (
Table 5), which indicated that there were no differences between the observed and simulated scenarios.
RMSE considering simulated and observed mean average travel speed of motorized vehicles values for the calibration scenarios resulted in 0.76 km/h. Median values and standard deviations were tested, obtaining results that indicated no statistically significant differences between observed and simulated values in each calibration scenario.
To ensure that users entered the studied segment in the same conditions as those which had been observed, a non-passing segment was inserted before the studied segment. The length of this segment was calibrated (
Table 3), therefore the TH and PF simulation results at the start of the segment were close to the observations in the three calibration scenarios (
Figure 5). At the end of the segment, different TH and PF values were obtained than at the entrance, because users traveled the segment with different speeds and overtaking occurring within the segment. The parameters that controlled the maximum desired speed of each type of user and the overtaking manoeuvre (
Table 3) were calibrated until the simulated TH and PF at the end point were close enough to those observed (
Figure 5).
TH distributions were compared by a K–S test, obtaining no statistically significant differences between simulated and observed samples at a 95% confidence level, both at the start and the end of the segment (
Table 6). Mean, median, and standard deviation values were compared as well, obtaining no statistically significant differences with a 5% significance level. The RMSE calculated for TH means at the start of the segment was 1.24 s, and at the end it was 2.08 s.
PF values resulting from the simulations and observations were compared using the RMSE. In both positions, at the start and end of the segment, RMSE values were less than 5%, indicating the quality of the calibration process.
PF is a surrogate measure, easier to measure in the field, to estimate PTSF. HCM methodology proposes equations to calculate the PTSF depending on traffic characteristics and road geometry. PTSF was calculated for each traffic scenario (
Table 7). Results only depended on the motorized vehicle traffic in each direction, because the scenarios had the same geometric characteristics and bicycle traffic was not considered in the calculations. This fact produced no real result for Calmax, it being the scenario with a higher presence of cyclists, although a lower value of PTSF was obtained.
4.3.3. Validation
In the validation process, overtaking durations for the different cyclists’ groups were checked. In all validation scenarios (
Table 2), K–S tests and
t-tests did not present statistically significant differences at a 95% confidence level between simulated and observed samples. These results confirm that the duration of overtaking is a key variable to analyze the overtaking manoeuvre for cyclists, and that the traffic microsimulator correctly represents this phenomenon.
The K–S tests results for Motor_ATS distributions did not present statistically significant differences between observed and simulated samples with a 95% confidence level at all validation scenarios. Average travel speed of motor vehicles simulated and observed means were compared by a
t-test, offering no statistically significant differences with a 5% significance level (
Table 8). The RMSE value for the observed and simulated means of Motor_ATS was 2.57 km/h.
The observed and simulated TH distributions, at the entrance and exit of the study segment, were analyzed by a K–S test, obtaining non statistically significant differences at a 95% confidence level for each validation scenario (
Table 9). The RSME values were calculated at the start and end segment points, obtaining values of 1.40 s and 2.56 s, respectively.
Table 9 shows the PF values calculated at the start and end points of the segment for each validation scenario. PF was reduced during the travel, offering better results for the end point of the segment. The RMSE for PF, at two control points, was less than 5% (4.6% at the entrance and 4.4% at the end), indicating the validity of the model.
4.4. Influence of Sport Cyclists on Narrow Two-Lane Rural Roads
The first result analyzed was the overtaking duration to each cyclist group (
Table 1). The overtaking duration can be considered as a road safety measure, because on narrow roads this represents practically all the time spent in the opposing lane, when extreme hazards are manifested [
30]. Groups formed by higher number of cyclists offer higher durations; for the same number of cyclists, when they ride two-abreast, lower durations than in-line formations are observed. Therefore, considering that on narrow roads 99% of overtaking manoeuvres are performed with opposing lane invasion, the two-abreast configuration is considered safer than in-line. These results agree with López et al. [
21], who concluded that, on narrow roads, cyclists feel safer when riding two-abreast.
The performance measures calculated from field observations were used to determine the influence of cycle traffic on traffic operation. Only traffic scenarios with lower (Calmin) and higher cycle traffic (Calmax) were considered, because in these scenarios the motorized vehicle volume was practically equal and had no influence on the results.
Motorized vehicle average travel speed presented a reduction when cycle traffic increased from Calmin to Calmax (
Table 5 and
Figure 4). Statistical tests showed a significant difference between the means and medians of both scenarios at a 95% confidence level. A K–S test concluded that the two distributions presented statistically significant differences. This reduction was not excessive, due to the higher speed limit restriction in the studied segment. This result was inconsistent with Schaefer et al. [
31], who concluded that cycle traffic has a negligible influence from a practical perspective on motorized vehicle speed when sharing urban roads. This fact can be explained by the reduced differential speed between motorized vehicles and bicycles in urban environments, contrary to interurban ones (
Figure 3).
Time headway, both at the entrance and the exit of the studied segment, presented a reduction when cycle traffic increased from Calmin to Calmax (
Table 6). In the two traffic scenarios, the TH values were higher at the end than at the starting point. However, statistical tests showed no significant differences between the medians and the distributions of both traffic scenarios.
Percent followers increased when cycle traffic increased as well for both positions, the start and end of the segment. For the Calmin scenario, PF presented a slight increase during the travel segment, being 22.2% at the start and 25% at the exit. For the Calmax scenario, PF presented a slight reduction through the segment, from 30.4% to 28%, indicating the improvement for overtaking bicycles within the segment.
Traffic microsimulation offers the possibility to obtain new performance measures which would be difficult to measure in the field. In this study, the delay time of the motor vehicles for the Calmin and Calmax scenarios were obtained from the microsimulator (
Figure 6). Fifteen replications of each traffic scenario were calculated, and the results were compared, obtaining a mean delay Calmin value of 4.49 s, and of 21.35 s for Calmax. Statistical tests performed comparing both scenario results showed significant differences considering means, medians, and standard deviations. K–S test results indicated a statistically significant difference between both distributions at a 95% confidence level. These results indicated that the delay time of motorized vehicles is affected by the presence of cyclists in such a way that more cycle traffic increases the delay.
5. Conclusions
In Spain, two-lane rural roads are shared by cyclists and motor vehicles, and it is common to find cyclists riding both individually and in groups. This fact can influence safety and traffic operation. The effect can be noticeable on narrow rural roads, where cyclists usually ride two-abreast, causing a higher follow-up of the group of cyclists before overtaking them. López et al. [
20] stated that when cyclists ride two-abreast the width of the group is higher; therefore, most overtaking manoeuvres are carried out with opposing lane occupation, and more accelerative overtaking maneuvers are registered.
Traffic operation and cyclists’ safety can be evaluated using microsimulation, which requires the description of the movement for each individual vehicle in the traffic stream. The circulation of cyclists and their interaction with motorized vehicles present some particularities that must be considered when modeling this phenomenon. The most significant of these is the possibility to overtake cyclists even with a solid line, and that overtaking can be performed with a partial invasion of the opposing lane.
Aimsun Next has an overtaking module for two-lane rural roads that was modelled, calibrated, and validated with field data on Spanish roads [
25]. The current overtaking model was developed considering motorized vehicles; however, bicycles were not incorporated. This study aimed to introduce bicycles to the model, incorporating their circulation characteristics and their interaction with motorized vehicles based on observations on a narrow two-lane rural road segment.
To correctly incorporate bicycles into microsimulation studies, it is necessary to collect real data. In this paper, a field experiment using two data collection methodologies is presented. Microscopic data were collected using instrumented bicycles. The equipment on these bicycles enabled recording of the overtaking manoeuvres to cyclists (riding in different configurations). From these data, the overtaking duration to cyclists was analyzed. Results showed that the duration of the overtaking depends on both the number of cyclists that form the group and its configuration. Therefore, a greater number of cyclists has a longer duration, and for the same number of cyclists, the duration is higher when riding in line; whereas the speed of the overtaking vehicle is not affected by the grouping configuration.
Macroscopic level data to characterize the traffic operation were collected by naturalistic video observations from static positions on the studied segment. From this methodology, different traffic scenarios, with both motorized vehicles and bicycles, were selected. The performance measures recommended by the HCM and other variables that can characterize the traffic operation, such as time headways and percent followers, were also calculated.
All these data have been used to calibrate and validate a microsimulator. The calibration started on a microscopic level, comparing the observed and simulated overtaking durations for each cyclist group. Then, the macroscopic level calibration was performed using average travel speed, time headways, and percent followers. Results of statistical analyses indicated that there were no significant differences between observed and simulated samples, indicating a good quality for the calibration process. Finally, the microsimulator was validated on four different traffic scenarios.
The new parameter incorporated to allow vehicles to overtake slower road users even with a solid line allows the representation of the observed behavior during overtaking manoeuvres. Results showed that calibration of the equivalent length of the groups of cyclists, achieving overtaking durations close to those observed, is a good solution to incorporate the effect of the partial invasion of the opposite lane in the microsimulation model. This solution is correct from a safety and operational point of view, because partial invasion of the opposite lane on narrow roads is just as dangerous as total invasion.
However, results showed that it is not possible to use HMC methodology to evaluate the effect on the level of service that implies the cycle traffic. The presence of cyclists implies a reduction in the motorized vehicle average travel speed and an increase in the percent followers. The percent time spent following does not represent the phenomenon correctly because it does not consider the presence of cyclists.
The use of microsimulation tools enables obtaining a higher amount of data than on field observations with a minor cost in both material and time, and facilitates obtaining other performance measures such as motorized vehicle delay time. Microsimulation results showed that cycle traffic increased motorized vehicle delay time on narrow rural roads.
The conclusions of this study cannot be generalized to narrow urban roads due to the different behaviour of drivers in these two environments. Some of these differences are related to the speed of motor vehicles, the presence of cycle lanes, and the place where interactions occur (intersections and roundabouts). However, the proposed methodology can be reapplied to study the phenomenon in urban areas.
As further research, by using traffic microsimulation, it would be possible to study the effect of different types of roads and different traffic scenarios, concerning both motorized vehicles and cyclists. Additionally, new performance measures that better represent the effect of cyclists sharing two-lane rural roads can be obtained to characterize the operation of traffic. Cyclists’ safety can be improved by studying different grouping configurations and proposing measures such as speed reductions for motorized vehicles or introducing bicycle turnouts for safer overtaking. This tool can help road authorities to integrate cyclists as much as vehicular traffic to improve two-lane rural road safety and operation.


