Abstract
Under the India “Housing for all” scheme, 20 million urban houses have to be constructed by 2022, which requires the rate of construction to be around 8000 houses/day. Previous results by the team show that present design methods for affordable buildings and structures in India need improvement. The challenges are the disposal of solid waste generated from agro-industrial activities and the energy peak demand in extremely hot and cold seasons. The development of bio-based urban infrastructure which can adapt to the climatic conditions has been proposed. Inclusion of sustainable materials such as agro-industrial by-products and insulation materials has resulted in effective environmental sustainability and climate change adaptability. Precast components are highlighted as a suitable solution for this purpose as well as to fulfil the need of mass housing. India has a lesser record in implementing this prefab technology when compared to a global view. For the first time, a novel and sustainable prefab housing solution is tested for scale-up using industrial waste of co-fired blended ash (CBA) and the results are presented here. A model house of real scale measuring 3 × 3 × 3 m3 was considered as a base case and is compared with 17 other combinations of model house with varying alignment of prefab panels. Comparison was made with commercially available fly ash brick and CBA brick with a conventional roof slab. A simulation study was conducted regarding cost and energy analysis for all the 18 cases. Various brick and panel compositions with CBA for housing were tried and the superior composition was selected. Similarly, 18 model houses of real scale were simulated, with different combinations of walls made of bricks or panels and different building orientations, to check the impact on energy peak cooling and cost. Results show that peak cooling load can be reduced by six times with bio-based prefab panels. Prefab construction can be considered for mass housing ranging above 100 housing units, each consisting of an area of 25 m2.
1. Introduction
India is the second-most populous country in the world after China, with a population of around 1380 million and a growth rate of about 1% [1]. The country has a population density of 464/km2 and 35% of its population resides in urban areas. Growth of the country’s urban population compared to the total population over the past six years is shown in Figure 1. The need for urban housing led the government to initiate the “Housing for all” scheme in 2015, under which 20 million urban houses have to be constructed by 2022. This brings to around 8000 the number of units to be constructed per day. Indian housing units were categorized into four sectors, namely economically weaker section (EWS), low income group (LIG), middle income group (MIG), and high income group (HIG). The scheme mainly focuses on providing housing for the EWS and LIG groups residing in the urban areas [2].
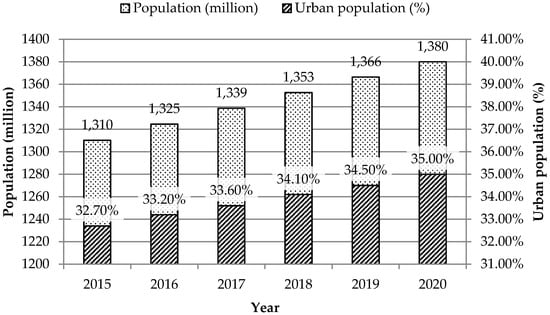
Figure 1.
Growth of Indian urban population with respect to the total population.
Currently, the construction sector is the second largest industry in the country after agriculture. Despite the growth in industrialization and urbanization, the construction industry faces many challenges regarding delays, cost overruns, and risks involved in projects [3]. Advancement in technology, and the requirement of efficient construction practices, have led to novel methods of construction, and prefabrication is one of them. Prefabrication, also referred to as prefab, can be defined as the manufacturing and assembly of construction components off-site in a controlled industrial environment and installation of these at the on-site location [4].
Modern construction activities are accountable for 30% of CO2 emissions, 32% of energy consumption, and 30–40% of waste generation globally, which creates an impact on the economy, environment, and society [5]. According to a report submitted by the UN Climate Action summit 2019, nations have been asked to reduce their CO2 emissions by about 45% by 2030 and reach net zero by 2050 [6]. The environmental impact regarding the CO2 emissions caused by major construction products such as steel, cement, and bricks, is summarized in Table 1. Promotion of low-cost, low-energy, and sustainable techniques can help in attaining the housing targets set by the government [7] and this was emphasized by the results of an industry focus group meeting with the Indian Concrete Institute (ICI) and industrial associates [8].

Table 1.
Annual production of construction products and their environmental effects.
The need for the cities to be smart, sustainable, green, and low carbon has increased the opportunities for sustainable urban growth [15]. Sustainable infrastructure that can be adaptable to different climatic conditions is being considered for the long-term perspective [16,17]. Maintaining environmental sustainability in the cities that have rapid population growth is considered as one of the major challenges [18]. Thus cometh the involvement of the materials that are conducive to this sustainability as well as climate-resilient. Poor maintenance of solid waste management can also lead to drastic changes in climatic conditions [19]. Thus, utilization of sustainable materials such as by-products of various agro-industrial activities is being tested for their suitability in the construction sector, as their disposal is quite challenging. The inclusion of microsilica, sugarcane bagasse ash (SBA), bio-briquette ash (BBA), and co-fired blended ash (CBA) in the construction process has improved the performance of construction products [20,21,22,23,24]. Insertion of insulation materials into construction products has also resulted in making structures energy efficient, thermal resistant, cost effective, and reduced dead loads. Typical insulating materials such as extruded polystyrene (XPS), expanded polystyrene (EPS), vacuum insulation, polyurethane foam (PUF), and polyisocyanurate (PIR) have been used for making insulated precast concrete sandwich wall panels [25,26,27].
Urban housing built with conventional methods has to be constructed in densely populated areas with cost and resource constraints [28]. Prefab technology comes with many advantages, resulting in reduced on-site construction waste, noise and dust pollution; time and cost savings; consistent quality; and better safety and resource management [3,5,29]. Yet this technology has some limitations, such as the requirement of high initial investment, low market demand, site access, and lack of standard codes, designs, and expertise. According to research conducted in some case studies, prefabrication resulted in reduction of construction waste by 65% and on-site labor requirement by 16%, and time savings of 15% [30]. The construction cost slightly increased, by 1.4% on average, but the rate of on-site accidents dropped by 63% when compared to conventional construction. However, when considering economic, environmental and social benefits, the limitations of this technology are found to be minimal and can be overcome through efficient use of resources and proper design.
As with conventional construction, costs of prefabrication have to be determined to analyze the feasibility of a project. The costs for masonry, plastering, measurement works, and labor requirements were less in comparison with on-site conventional construction [31], whereas additional costs for prefabrication regarding manufacture, assembly, and installation—such as setting up of the precast yard, molds, controlled curing, transportation, and erection of the end products at the specified location—have to be considered. According to one study, construction of an individual double-story residential building with prefab resulted in a 21% increase in cost but a 49% decrease in duration when compared to conventional methods [32]. The sub-structure part was found to be similar in both the cases. Prefab was found to be feasible for large-scale constructions like mass housing rather than individual buildings.
Concomitantly, in India, electricity consumption patterns across states exhibit significant inequity at the household level. Sixty percent of current space cooling energy consumption is by 10% of the population and the increasing demand for sustainable and affordable housing needs to be taken into consideration. The increasing demand for sustainable and affordable housing, the disposal of solid waste generated from agro-industrial activities, and the energy peak demand in extremely hot and cold seasons are the challenges. The Indian government launched the 20-year India Cooling Action Plan (ICAP) in March 2019 to address cooling requirements in buildings. So far buildings’ energy efficiency policies have focused largely on making cooling and heating technologies more efficient energy-wise. The enormous environmental, energy, and cost impact could be reduced by innovative building design with sustainable clean materials to improve comfort, and reduce mechanical cooling in buildings. This could be a game-changer for the way buildings are designed.
The presented literature explores the necessity of affordable and sustainable urban housing which can be constructed within a limited time interval and with quality control. Prefab housing has been found to be expensive for small-scale projects and hence the economical number of mass housing units has to be determined for any construction project to be feasible. The current study involved the development of sustainable construction products such as bricks, mortar, and concrete for slab panels which utilized industrial waste, namely co-fired blended ash (CBA). Various models were developed in the building information modeling (BIM) software, including CBA-based products with varying alignments of prefab wall panels, and the cost and energy consumption of these models were compared with those of currently available construction techniques. This research work attempts to calculate the number of prefab housing units required for economical construction.
2. Methodology
2.1. Materials and Product Development
CBA (as shown in Figure 2a) is a locally available industrial by-product in the city of Nagpur, India, and construction products such as bricks, mortar, and concrete were prepared by partially replacing fine aggregate [22]. This raw material is procured from industries where coal, agricultural residues such as rice husk, and wood pellets are co-fired in boilers for heat generation. Physical properties and chemical characterization of CBA are provided in Table 2 and its utilization in developing construction products was presented in the earlier part of the literature study. The specific gravity of raw material was found to be 2.29, determined with the volume displacement method as mentioned in IS 1727: 1967. Similarly, a bulk density test was performed as per IS 2386: Part 3: 1963, which resulted in 1430 kg/m3. The chemical characterization of CBA was determined from the chemical analysis done through an X-ray fluorescence (XRF) scan, which can determine the oxides present in the material.
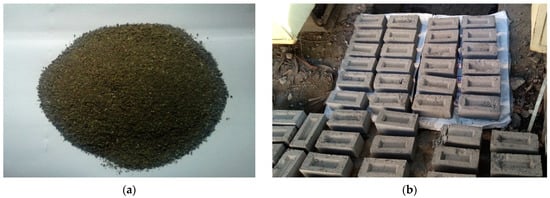
Figure 2.
(a) Co-fired blended ash (CBA); (b) CBA based masonry bricks.
Table 2.
Properties of raw material—CBA.
Various combinations of mix proportions were tried for the bricks, mortar, and concrete, and the optima of these are listed in Table 3. Masonry bricks (as shown in Figure 2b) of size 230 × 100 × 80 mm were cast in the automated brick making machine with a lot size of 12 bricks at once, and then cured. The prefab panel was considered where a 20 mm layer of thermal insulator, polyurethane foam (PUF) sheet, was sandwiched in between two concrete layers of 40 mm each as shown in Figure 3. Tc, Ti, Tp represent the layer thickness of concrete, insulation, and overall panel respectively.
Table 3.
Mix proportions of the masonry and concrete.
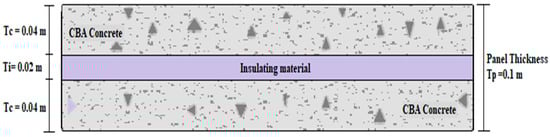
Figure 3.
Cross-section of the prefab panel.
Construction products were developed with the designed mix proportions and were tested for compressive strength, density, water absorption, and thermal conductivity. These test results are reported in Table 4. Density and thermal conductivity of the insulation material, PUF sheet, is also presented. These properties were determined using the standard procedures; i.e., compressive strength, density, water absorption, and thermal conductivity tests were conducted as per IS 3495: 1992 (Part 2), IS 2185: 1979 (Part 1), IS 3495: 1992 (Part 2), and Lee’s disc apparatus test [20].
Table 4.
Properties of construction products.
2.2. Combinations with Conventional Brick-Wall and Prefab Panels
Various combinations were developed which involved two types of bricks; one was commercially available fly ash (FA) brick and the other being the CBA-based brick. Conventional in-situ concrete and prefab panels with different alignment and orientation were also involved in these combinations, as mentioned in Table 5. A model unit of size 3 × 3 × 3 m3 was considered for all the cases (Figure 4). The optimum combination among the developed models was selected using cost and energy analysis. Fly ash and CBA-based bricks with conventional cast in-situ (CC) concrete were made as two base cases to be compared with the rest of the 16 cases. The notations (N, S, E, and W—north, south, east, and west) in Table 5 represent that the prefab panels replaced the brick-wall in the particular direction.
Table 5.
Combinations with bricks, conventional in-situ concrete, and prefab panels.
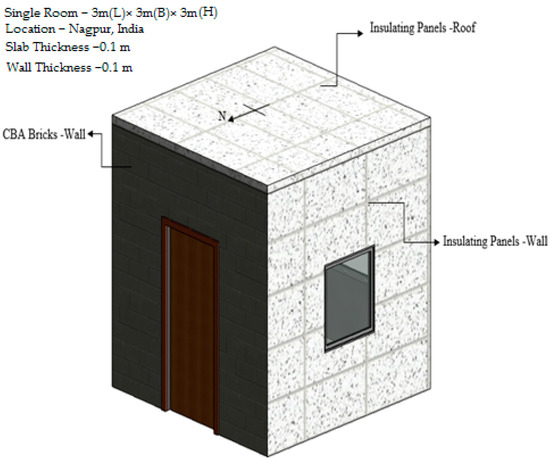
Figure 4.
Model with one-sided insulating wall panel.
The developed combinations were modeled using the building information modeling (BIM) software tool and are presented as shown in Figure 5. The orientations of all the models were kept constant; i.e., north-facing was preferred in all the combinations and an assumption of model exposed to the sunlight without any obstruction was made.
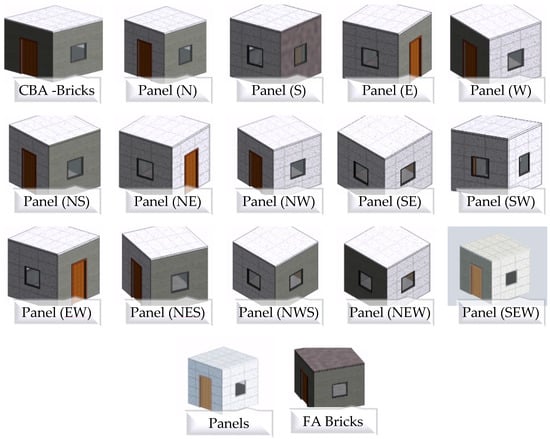
Figure 5.
Combinations with bricks, conventional in-situ concrete, and prefab panels.
3. Economic and Energy Analysis
3.1. Cost Estimation of Conventional Brick-Wall and Prefab Panels
Rate analysis for the brickwork, concrete cast in-situ, and prefab panels was prepared and the estimates of the combinations are as shown in Table 6. The total costs have included material, finishing works, labor, molds, and erection costs in producing one unit of a 3 × 3 × 3 m3 model house.
Table 6.
Cost estimate of the combinations.
The roof of the first two combinations included cast in-situ concrete whereas the rest of the combinations had concrete panels. It was observed that the combinations having brickwork along the north side required less work due to the presence of door opening and hence resulted in less cost. For example, combination of panel (N) (S. no. 3 of Table 6) had a concrete panel on the north side and brickwork on other sides; whereas the other combinations such as panel (S), panel (E), and panel (W) (S. no. 5, 6, and 7 of Table 6) had concrete panels on south, east, and west sides respectively and brickwork on other sides. Therefore, a decrease in the cost was observed for the latter 3 combinations because of the reduced brickwork on north sides. Similarly, the cost difference between other combinations was also of the same pattern (S. nos. 8, 9, and 10 versus S. nos. 11, 12, and 13 of Table 6; and S. nos. 14, 15, and 16 versus S. no. 17 of Table 6).
3.2. Energy Analysis
The peak cooling load was evaluated from the energy analysis conducted using the BIM software tool. As the models were in the Nagpur region (composite climatic zone), inputs were given accordingly. There was not any heat load allocated in the summer season because of the high intensity of solar radiation during that part of the year. External heat gains that entered into the house from the openings, walls, ceiling, and floor were evaluated to determine these peak cooling loads. A base case (S. no. 1 of Table 7) was considered earlier for the calculation of peak cooling load and later on compared with all other 17 combinations to determine the model structure having a lower cooling load, as shown in Table 7.
Table 7.
Peak cooling load of the combinations from the energy analysis.
4. Results and Discussion
4.1. Costing vs. Energy Analysis of Various Combinations
A graph was plotted with cost and peak cooling load on primary and secondary vertical axes, respectively, with the combinations on the horizontal axis as shown in Figure 6. It can be observed that the construction of prefab panels had the least energy load when compared to conventional brick-wall construction. However, the cost of the construction of these prefab panels is too heavy to bear for a single housing unit.
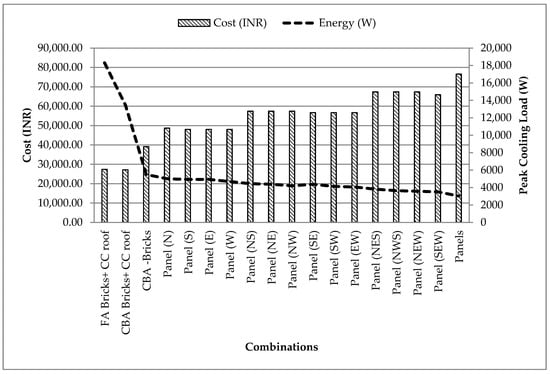
Figure 6.
Graph showing comparison of various combinations regarding cost and energy.
4.2. Determination of Number of Houses for Economical Prefab Construction
The comparative study implied that prefab construction is costlier than conventional construction. As the energy involved was less for the prefab panel-based housing unit, a comparison was drawn to determine the feasibility of a complete prefab housing unit versus the conventional housing unit with a prefab slab panel. A single-story model house with an area of 25 m2 was considered for the feasibility study. The number of houses was kept as a varying factor and the estimate is as shown in Table 8 and Table 9. Material, manpower, manufacture, transport, and erection costs were involved in this study. Percentage increase/decrease in the costing was calculated to determine the feasible break-even point where the prefab construction becomes economical.
Table 8.
Estimate of the conventional brick-wall and prefab slab panel costs for various number of houses.
Table 9.
Estimate of the conventional brick-wall and prefab slab panel costs for various number of houses.
Table 10 shows that by building more houses, the prefabrication technique tends to become more competitive in comparison to conventional brick-wall housing. The negative values indicate that the construction of the specified number of houses is feasible for implementing prefab technology. Thus, prefab construction can be considered for mass housing ranging above 100 housing units, each consisting of an area of 25 m2.
Table 10.
Difference between the costings to determine economical prefab construction.
5. Conclusions and Recommendations
This comparative study was focused on the economic and energy analysis of prefabrication and conventional construction. From the perspective of sustainability, the end products developed were a bio-based solution for their effective impact on solid waste management. A locally available industrial by-product, namely CBA, was used in developing construction products such as bricks and panels. Their composition with CBA for housing was found to be thermally resistant and thus these compositions were tried to find out the superior composition. Eighteen model houses were tested with different combinations of walls made of bricks or panels and different building orientations to check the impact on energy peak cooling and cost. Results of the simulations showed that peak cooling load can be reduced by six times with these bio-based prefab panels, making structures energy efficient. The developed end products resulted in maintaining an adiabatic environment within the model houses, which can be determined as adaptable to various climatic changes. Economically, prefab construction can be considered expensive for a single unit. This is because of the costs relating to the molds, transport, and erection, which are huge for a single unit but can be mitigated when these prefab homes are constructed in mass numbers. Hence the study recommends the feasibility for mass housing ranging above 100 housing units, each consisting of an area of 25 m2. As this study involved a raw material developed into a construction product, its potential environmental impact may be estimated, and hence a proper life cycle analysis may be recommended [33,34].
Author Contributions
R.C.; Conceptualization, Methodology, Formal Analysis, Investigation, Data Curation, Writing—Original draft preparation; H.R.G.; Formal Analysis, Investigation, Data Curation, Writing—Original draft preparation & reviewing; R.V.R.; Conceptualization, Methodology, Investigation, Writing—Original draft preparation & reviewing; M.R.; Methodology, Writing—Original draft preparation & reviewing; A.S.; Methodology, Writing—Original draft preparation & reviewing; A.B.; Conceptualization, Methodology, Investigation, Writing—Original draft preparation & reviewing. All authors have read and agreed to the published version of the manuscript.
Funding
This research was supported by funding under the grant LJMU GCRF fund—271002/S0001/954FET/GCRFFET04.
Data Availability Statement
The data presented in this study are available on request from the corresponding author.
Acknowledgments
This research was supported by funding under the grant LJMU Global Challenge Research Fund 2018–2020.
Conflicts of Interest
The authors declare no conflict of interest.
References
- Department of Economic and Social Affairs, U.N. India Population. 2020. Available online: https://www.worldometers.info/world-population/india-population/ (accessed on 12 March 2020).
- Ministry of Housing & Urban Poverty Alleviation, Government of India, Pradhan Mantri Awas Yojana—Housing for All (Urban)—Credit Linked Subsidy Scheme. Gov. India 2017, 2017, 1–62.
- Krishnanunny, M.; Anoop, K. Prefab technology a solution to existing challenges in construction sector of India—A Kerala perspective. Int. J. Pure Appl. Math. 2018, 119, 1339–1347. [Google Scholar]
- Steinhardt, D.A.; Manley, K. Adoption of prefabricated housing—The role of country context. Sustain. Cities Soc. 2016, 22, 126–135. [Google Scholar] [CrossRef]
- Ferdous, W.; Bai, Y.; Ngo, T.D.; Manalo, A.; Mendis, P. New advancements, challenges and opportunities of multi-storey modular buildings—A state-of-the-art review. Eng. Struct. 2019, 183, 883–893. [Google Scholar] [CrossRef]
- United Nations UN Climate Action Summit. 2019. Available online: https://www.un.org/en/climatechange/un-climate-summit-2019.shtml (accessed on 21 January 2020).
- Tiwari, P. Energy efficiency and building construction in India. Build. Environ. 2001, 36, 1127–1135. [Google Scholar] [CrossRef]
- Bras, A.; Ravijanya, C.; de Sande, V.T.; Rley, M.; Ralegaonkar, R.V. Sustainable and affordable prefab housing systems with minimal whole life energy use. Energy Build. 2020, 110030. [Google Scholar] [CrossRef]
- Ministry of Commerce & Industry; GoI, I. Indian Steel Industry Report; Ministry of Commerce & Industry: New Delhi, India, 2019.
- Van Ruijven, B.J.; Van Vuuren, D.P.; Boskaljon, W.; Neelis, M.L.; Saygin, D.; Patel, M.K. Long-Term model-based projections of energy use and CO2 emissions from the global steel and cement industries. Resour. Conserv. Recycl. 2016, 112, 15–36. [Google Scholar] [CrossRef]
- Ministry of Commerce & Industry; GoI, I. Cement Industry in India; Ministry of Commerce & Industry: New Delhi, India, 2020; Volume 25.
- Gavali, H.R.; Bras, A.; Faria, P.; Ralegaonkar, R.V. Development of sustainable alkali-activated bricks using industrial wastes. Constr. Build. Mater. 2019, 215, 180–191. [Google Scholar] [CrossRef]
- Tibrewal, K.; Maithel, S.; Venkataraman, C. A state-level methodology for estimating present-day emissions of short-lived climate pollutants from fired brick production in India. Clim. Chang. Signals Response 2019, 211–229. [Google Scholar] [CrossRef]
- Riza, F.V.; Rahman, I.A.; Zaidi, A.M.A. A brief review of Compressed Stabilized Earth Brick (CSEB). In Proceedings of the International Conference on Science and Social Research (CSSR 2010), Kuala Lumpur, Malaysia, 5–7 December 2010; pp. 1011–1016. [Google Scholar]
- Sanchez-rodriguez, R.; Urge-Vorsatz, D.; Barau, A.S. Sustainable Development Goals and climate change adaptation in cities. Nat. Clim. Chang. 2018, 98–100. [Google Scholar] [CrossRef]
- Ha, S.; Kim, K.; Kim, K.; Jeong, H.; Kim, H. Reliability approach in economic assessment of adapting infrastructure to climate change. J. Manag. Eng. 2017, 33, 04017022. [Google Scholar] [CrossRef]
- Kim, Y.; Chester, M.V.; Eisenberg, D.A.; Redman, C.L. The infrastructure trolley problem: Positioning safe-to-fail infrastructure for climate change adaptation earth’s future. Earth’s Future 2019, 7, 704–717. [Google Scholar] [CrossRef]
- Chirisa, I.; Bandauko, E.; Mazhindu, E.; Kwangwama, A.N.; Chikowore, G. Building resilient infrastructure in the face of climate change in African cities: Scope, potentiality and challenges. Dev. S. Afr. 2016, 33, 113–127. [Google Scholar] [CrossRef]
- USAID. Solid Waste Management Addressing Climate Change Impacts on Infrastructure: Preparing for Change (Fact Sheet); USAID: Washington, DC, USA, 2012; pp. 1–3.
- Madurwar, M.V.; Mandavgane, S.A.; Ralegaonkar, R.V. Development and feasibility analysis of bagasse ash bricks. J. Energy Eng. 2015, 141, 04014022. [Google Scholar] [CrossRef]
- Sakhare, V.V.; Ralegaonkar, R.V. Use of bio-briquette ash for the development of bricks. J. Clean. Prod. 2016, 112, 684–689. [Google Scholar] [CrossRef]
- Ram, S.; Ralegaonkar, R.V.; Pradhan, K. Use of co-fired blended ash in the development of sustainable construction materials. Proc. Inst. Civ. Eng. Eng. Sustain. 2017, 171, 425–432. [Google Scholar] [CrossRef]
- Gavali, H.R.; Ralegaonkar, R.V. Design of eco-efficient housing with sustainable alkali-activated bricks. J. Clean. Prod. 2020, 254, 120061. [Google Scholar] [CrossRef]
- Khosravani, M.R.; Wagner, P.; Fröhlich, D.; Weinberg, K. Dynamic fracture investigations of ultra-high performance concrete by spalling tests. Eng. Struct. 2019, 201, 109844. [Google Scholar] [CrossRef]
- Naito, C.; Hoemann, J.; Beacraft, M.; Bewick, B. Performance and characterization of shear ties for use in insulated precast concrete sandwich wall panels. J. Struct. Eng. 2012, 138, 52–61. [Google Scholar] [CrossRef]
- O’Hegarty, R.; Kinnane, O. Review of precast concrete sandwich panels and their innovations. Constr. Build. Mater. 2020, 233, 117145. [Google Scholar] [CrossRef]
- Einea, A.; Salmon, D.C.; Fogarasi, G.J.; Culp, T.D.; Tadros, M.K. State-of-the-Art of precast concrete sandwich panels. PCI J. 1991, 36, 78–92. [Google Scholar] [CrossRef]
- Dave, M.; Watson, B.; Prasad, D. Performance and perception in prefab housing: An exploratory industry survey on sustainability and affordability. Procedia Eng. 2017, 180, 676–686. [Google Scholar] [CrossRef]
- Li, Z.; Shen, G.Q.; Xue, X. Critical review of the research on the management of prefabricated construction. Habitat Int. 2014, 43, 240–249. [Google Scholar] [CrossRef]
- Jaillon, L.; Poon, C.S. Sustainable construction aspects of using prefabrication in dense urban environment: A Hong Kong case study. Constr. Manag. Econ. 2008, 26, 953–966. [Google Scholar] [CrossRef]
- Mao, C.; Xie, F.; Hou, L.; Wu, P.; Wang, J.; Wang, X. Cost analysis for sustainable off-site construction based on a multiple-case study in China. Habitat Int. 2016, 57, 215–222. [Google Scholar] [CrossRef]
- Dineshkumar, N.; Kathirvel, P. Comparative study on prefabrication construction with cast in-situ construction of residential buildings. IJISET Int. J. Innov. Sci. Eng. Technol. 2015, 2, 527–532. [Google Scholar]
- Khosravani, M.R.; Reinicke, T. On the environmental impacts of 3D printing technology. Appl. Mater. Today 2020, 20, 100689. [Google Scholar] [CrossRef]
- Malviya, R.K.; Singh, R.K.; Purohit, R.; Sinha, R. Natural fibre reinforced composite materials: Environmentally better life cycle assessment—A case study. Mater. Today Proc. 2019, 26, 3157–3160. [Google Scholar] [CrossRef]


Publisher’s Note: MDPI stays neutral with regard to jurisdictional claims in published maps and institutional affiliations. |
© 2021 by the authors. Licensee MDPI, Basel, Switzerland. This article is an open access article distributed under the terms and conditions of the Creative Commons Attribution (CC BY) license (http://creativecommons.org/licenses/by/4.0/).