
Modeling of an Energy Hybrid System Integrating Several Storage Technologies: The DBS Technique in a Nanogrid Application


 ,
,  , ,
, ,  ,
, 
Abstract
1. Introduction
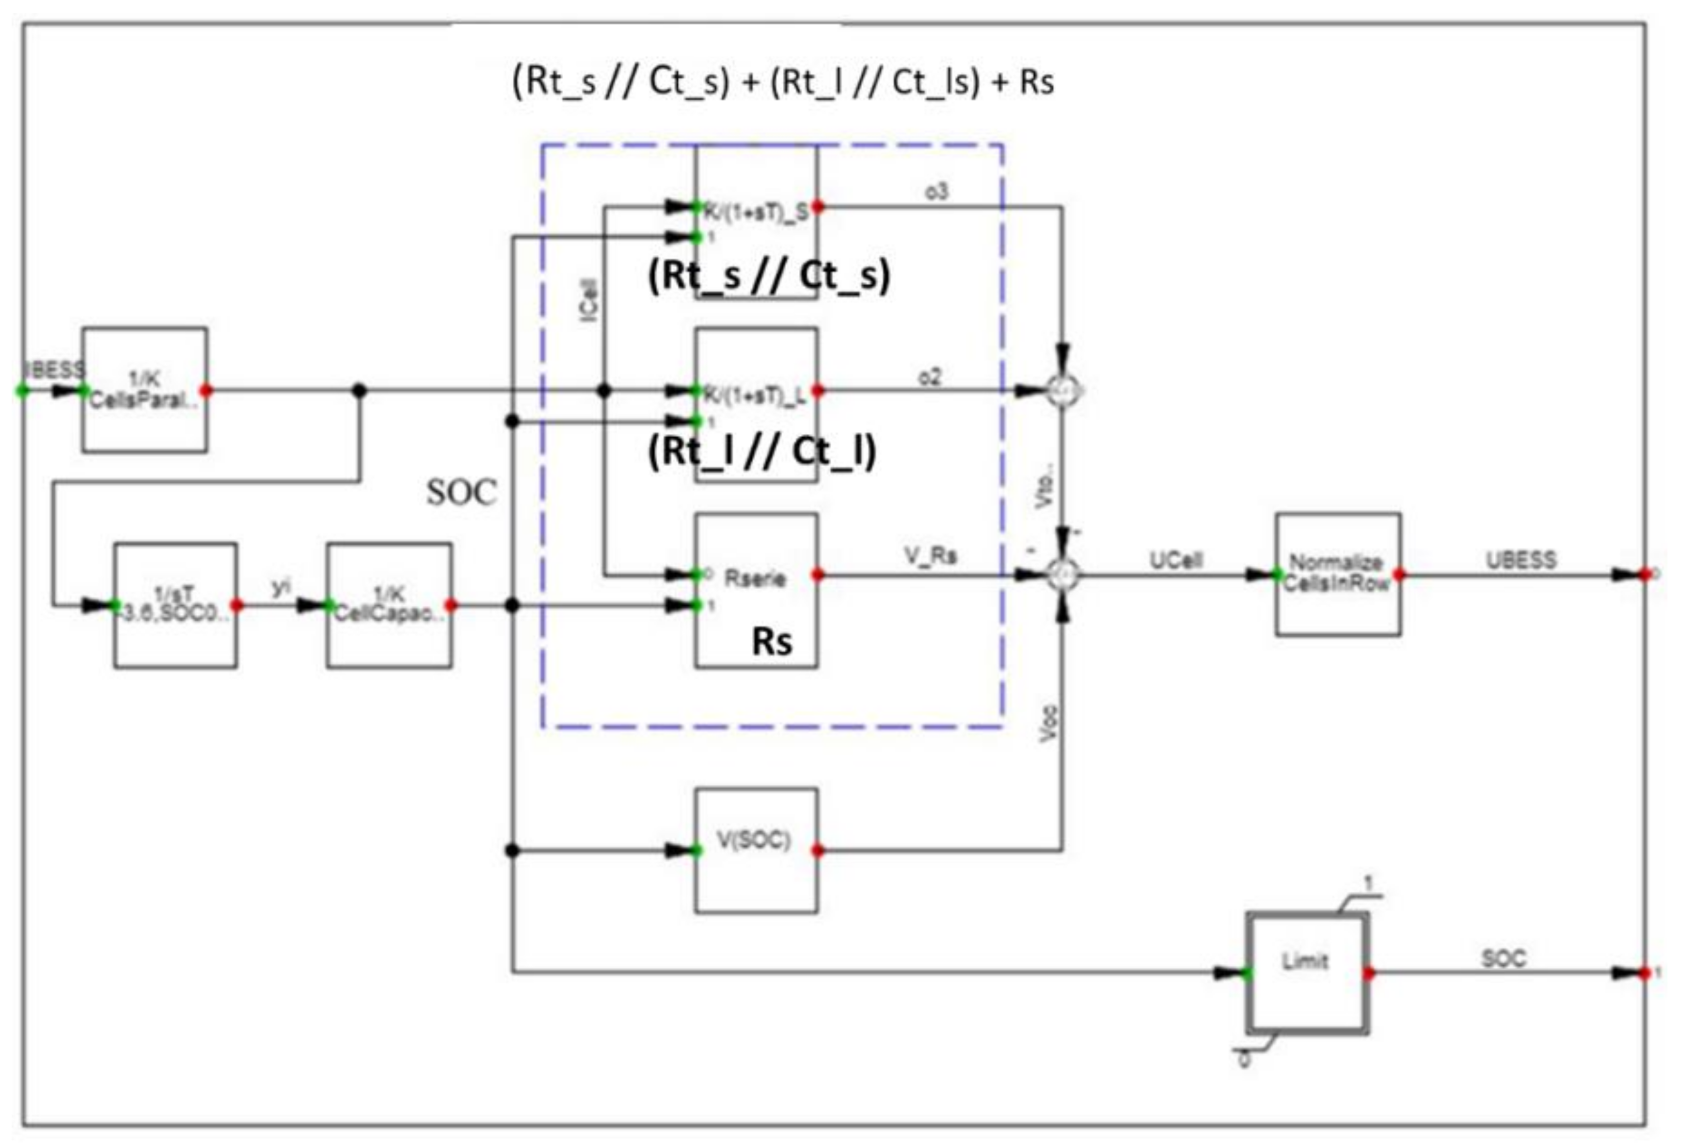
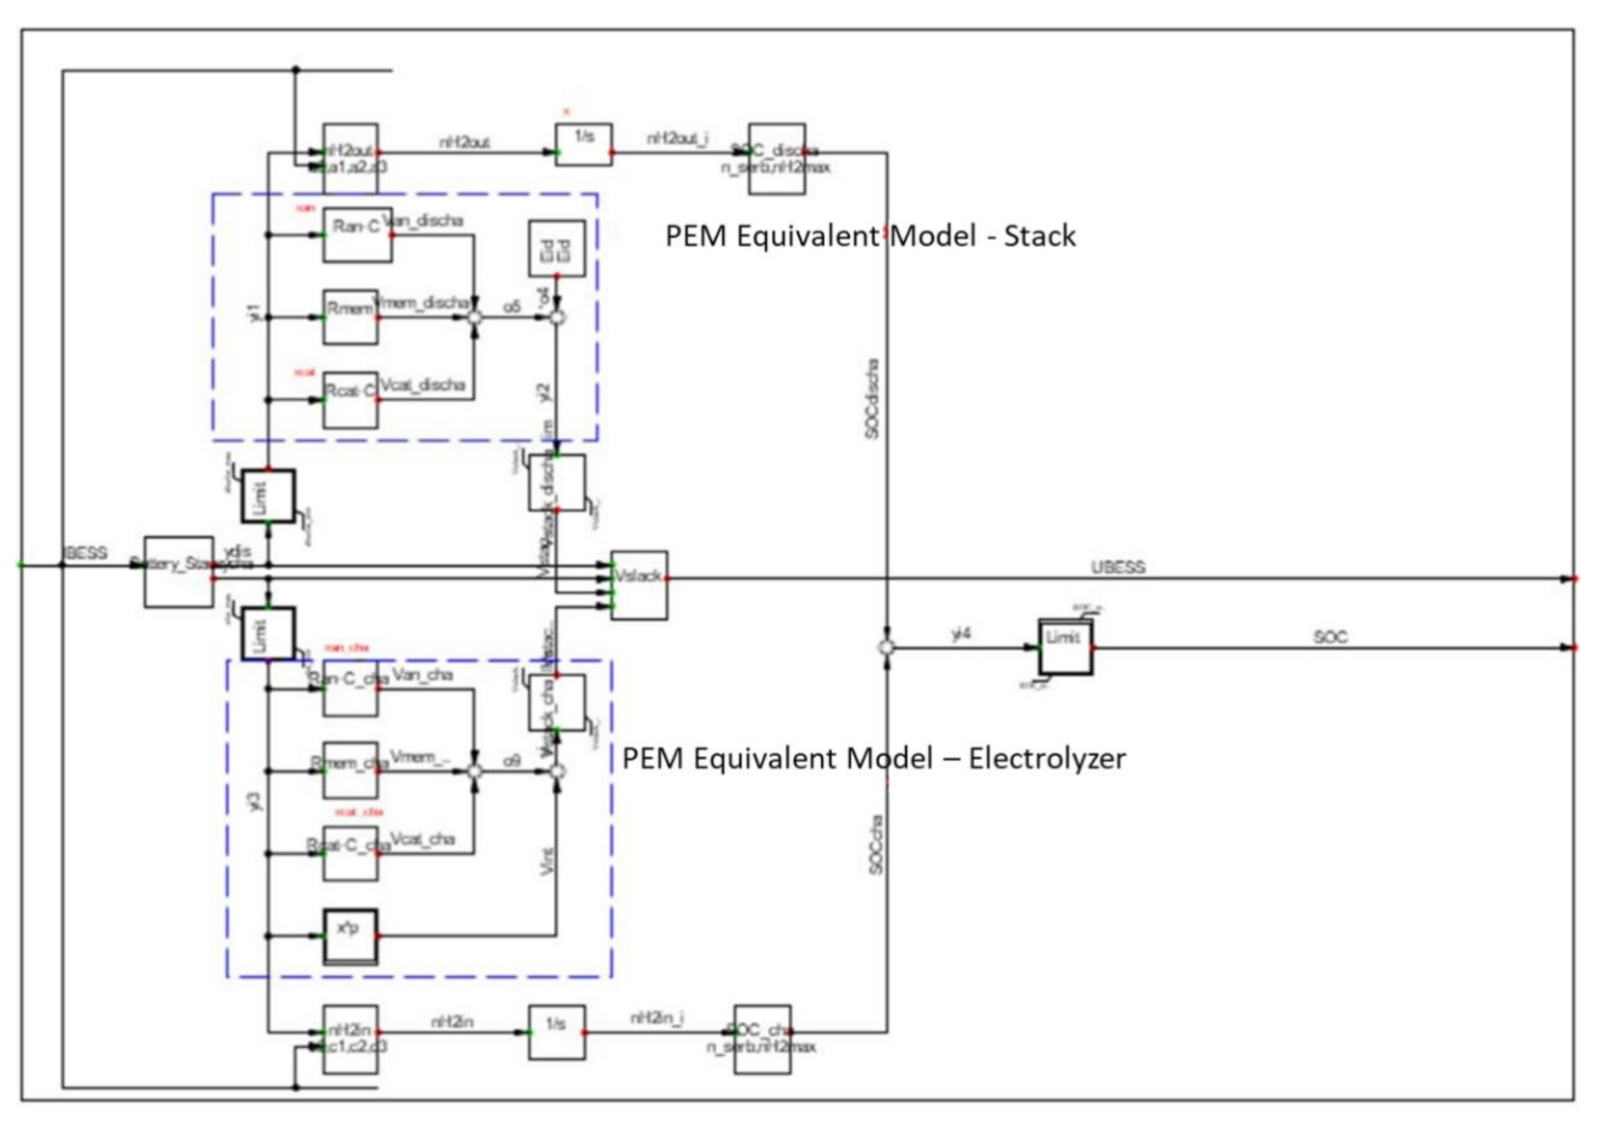
- Several equivalent models and related dynamic models have been added and their control logics has been implemented for each energy storage system.
- Moreover, the power electronic interface control logic has been implemented. For the DBS logic, new DC bus voltage thresholds were defined.
- New test cases have been analyzed to verify the effectiveness of the proposed control logic.
- The Introduction and the literature review have been completely rewritten. For the literature review, the list of references has been updated and an extensive comparison with works focusing on DBS Strategy has been considered as well.
2. Materials and Methods
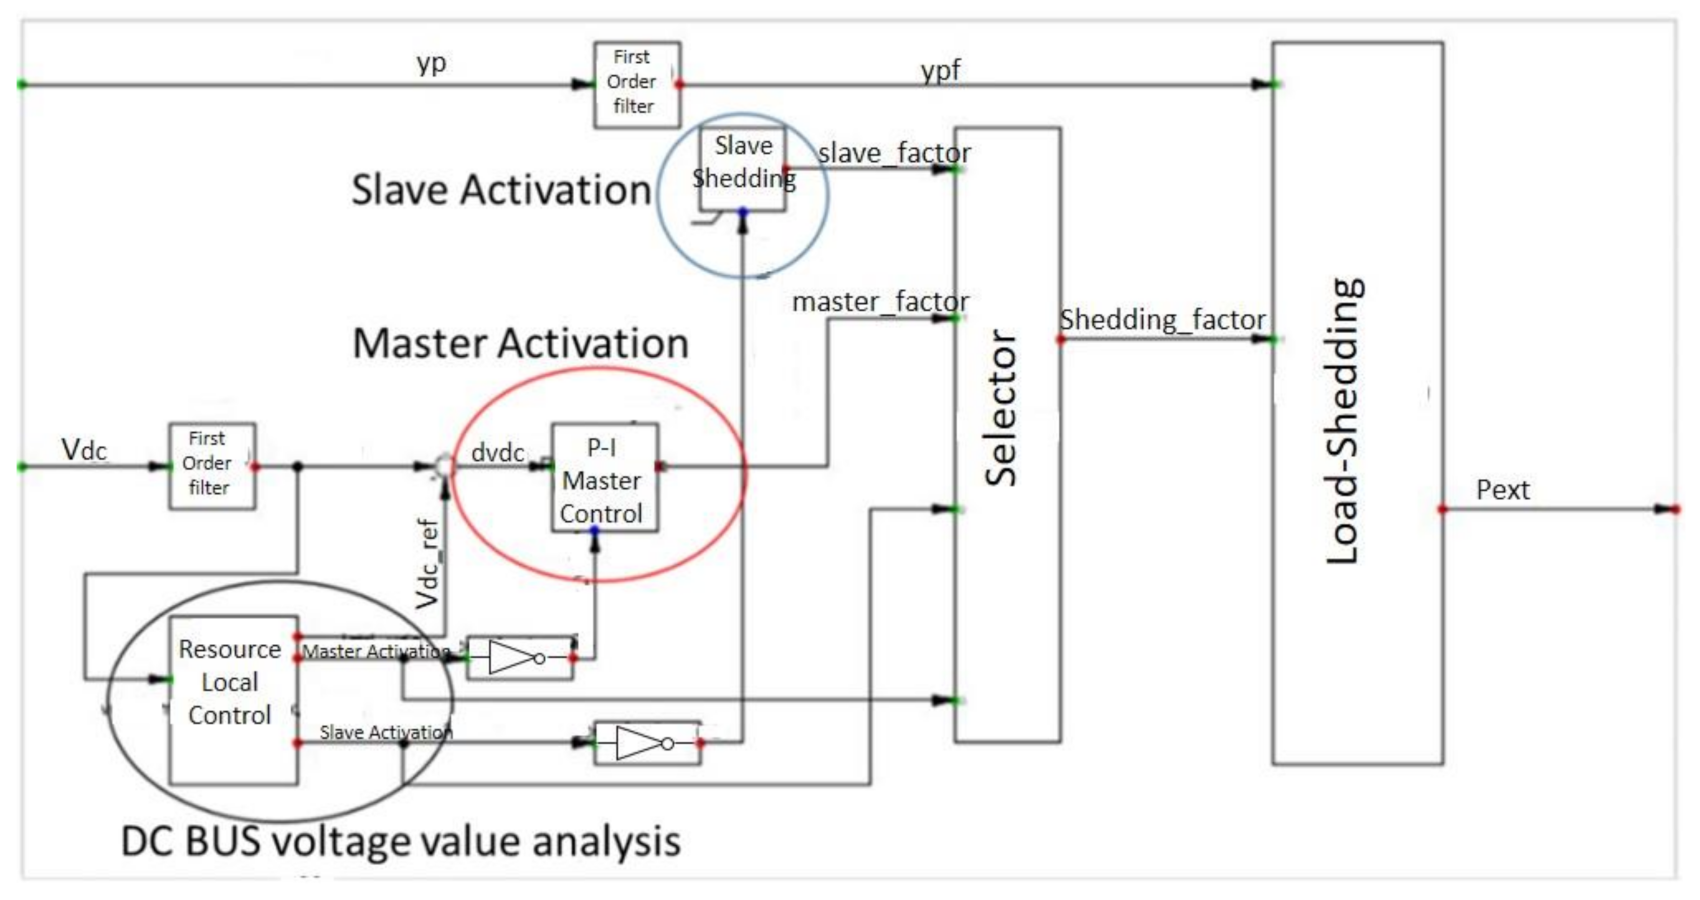
2.1. DBS Control Logic
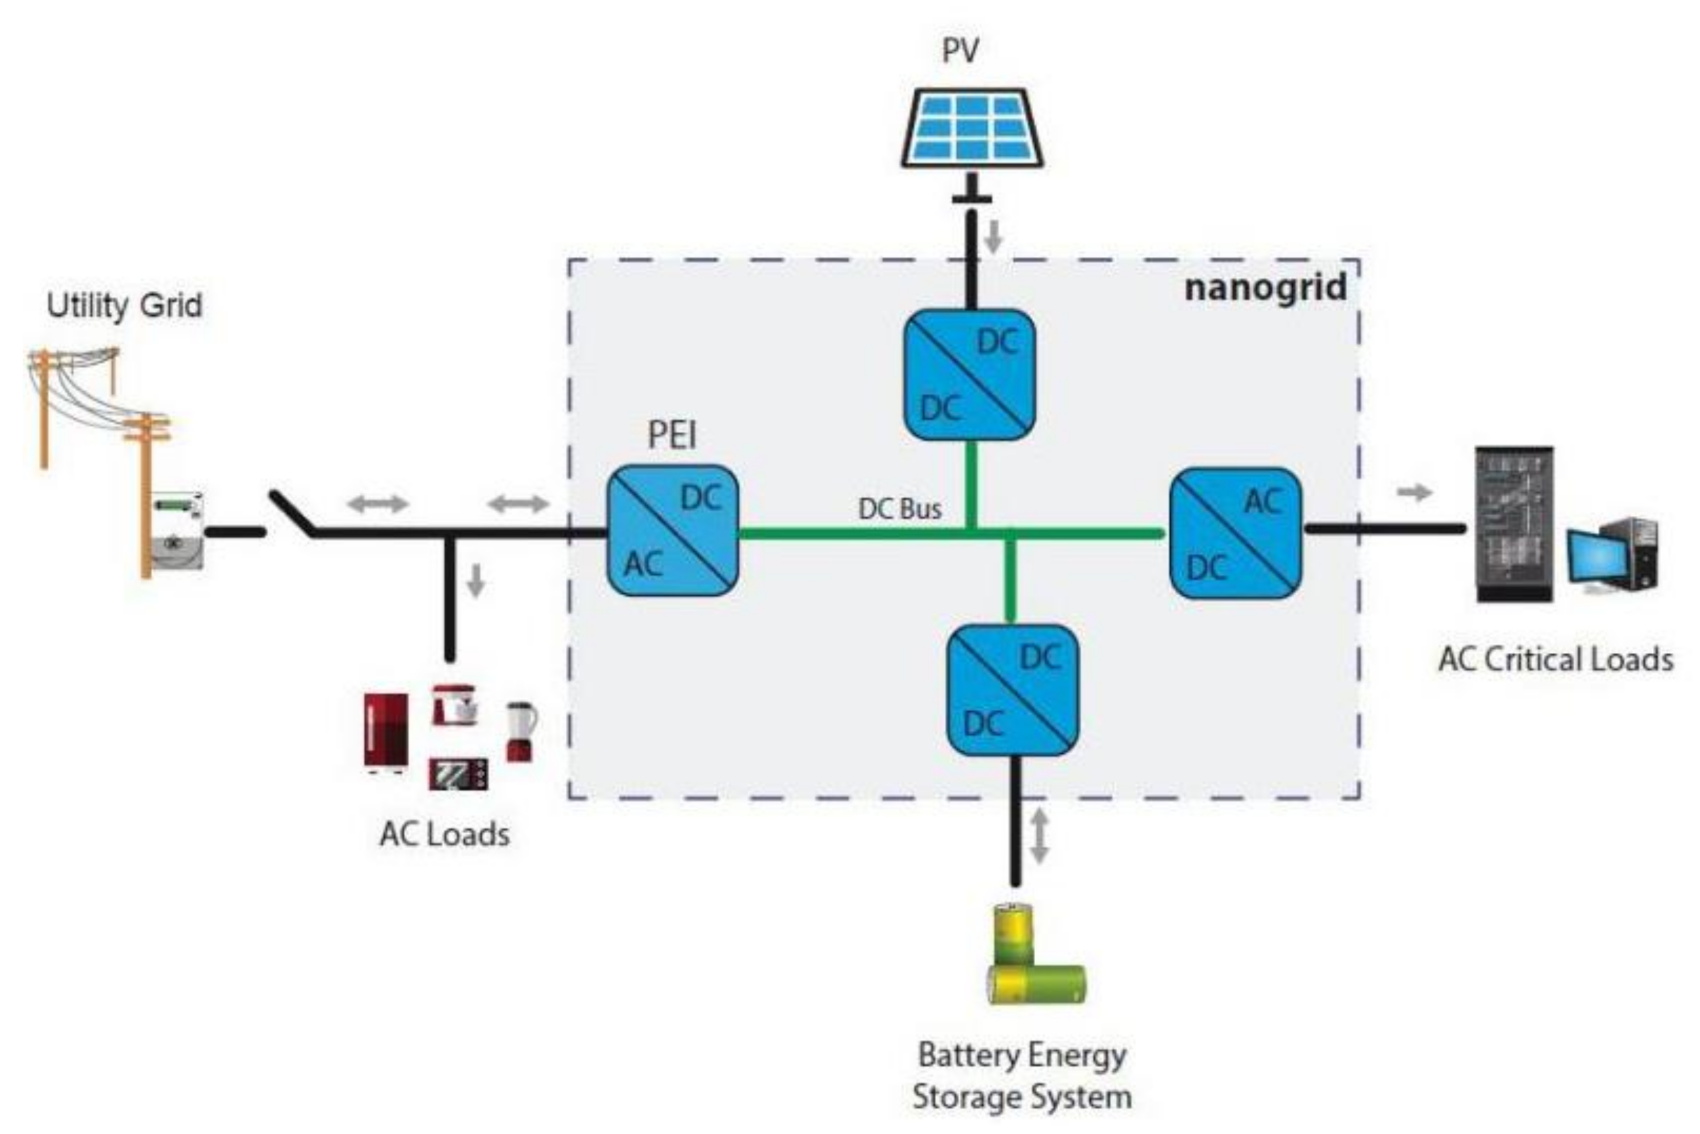
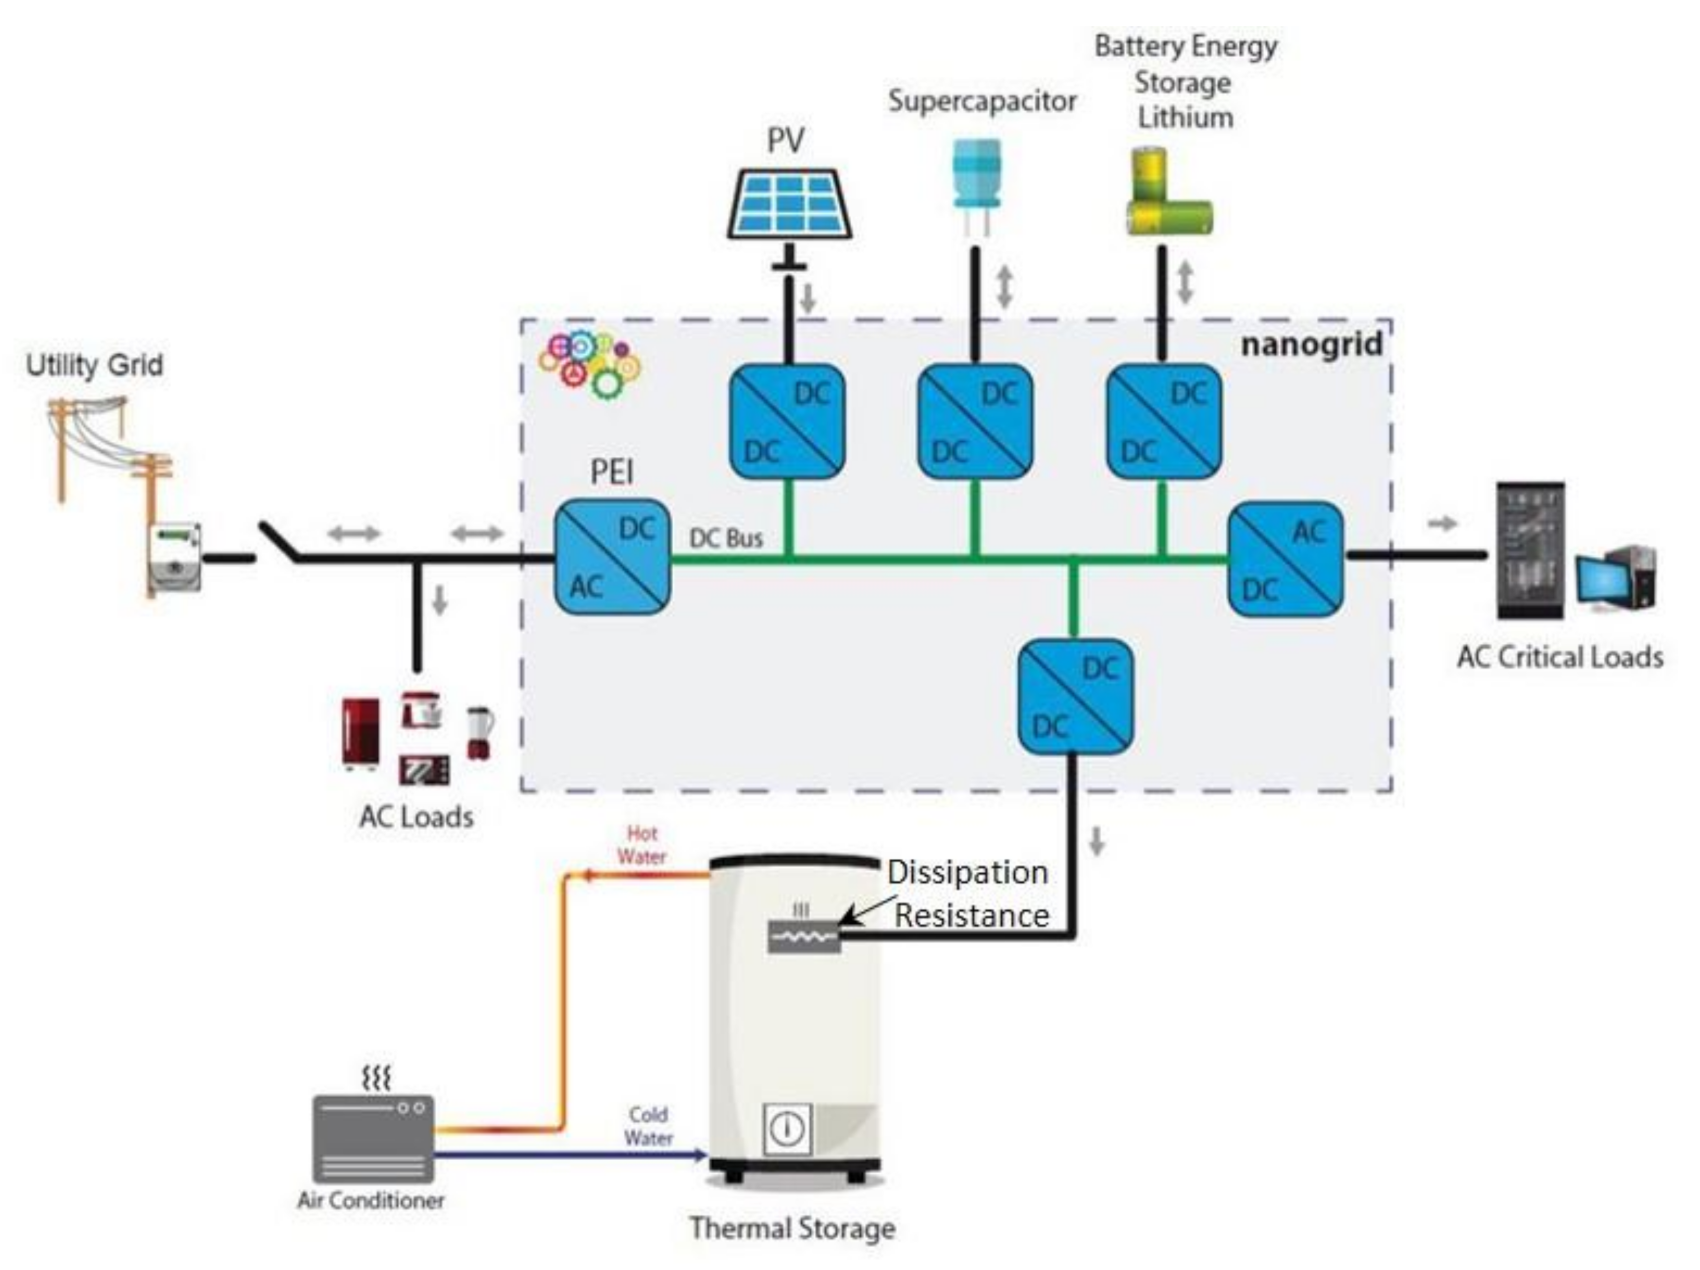
2.2. NG1 Configuration
- A Lithium Battery
- A Photovoltaic system
- Critical Loads
- A Power Electronic Interface (PEI)
- “Master/Slave Activation” defines the resource role (master/slave) based on the DC bus voltage;
- “P-I Master control” calculates the resource’s current, iM (1), during the resource master role;
- “Slave current setting” calculates the resource’s current, iSlave (2), during the resource slave role.
- “Resource current setting” sends the signal to the resource in order to set its current value (i.e., iM or iSlave).
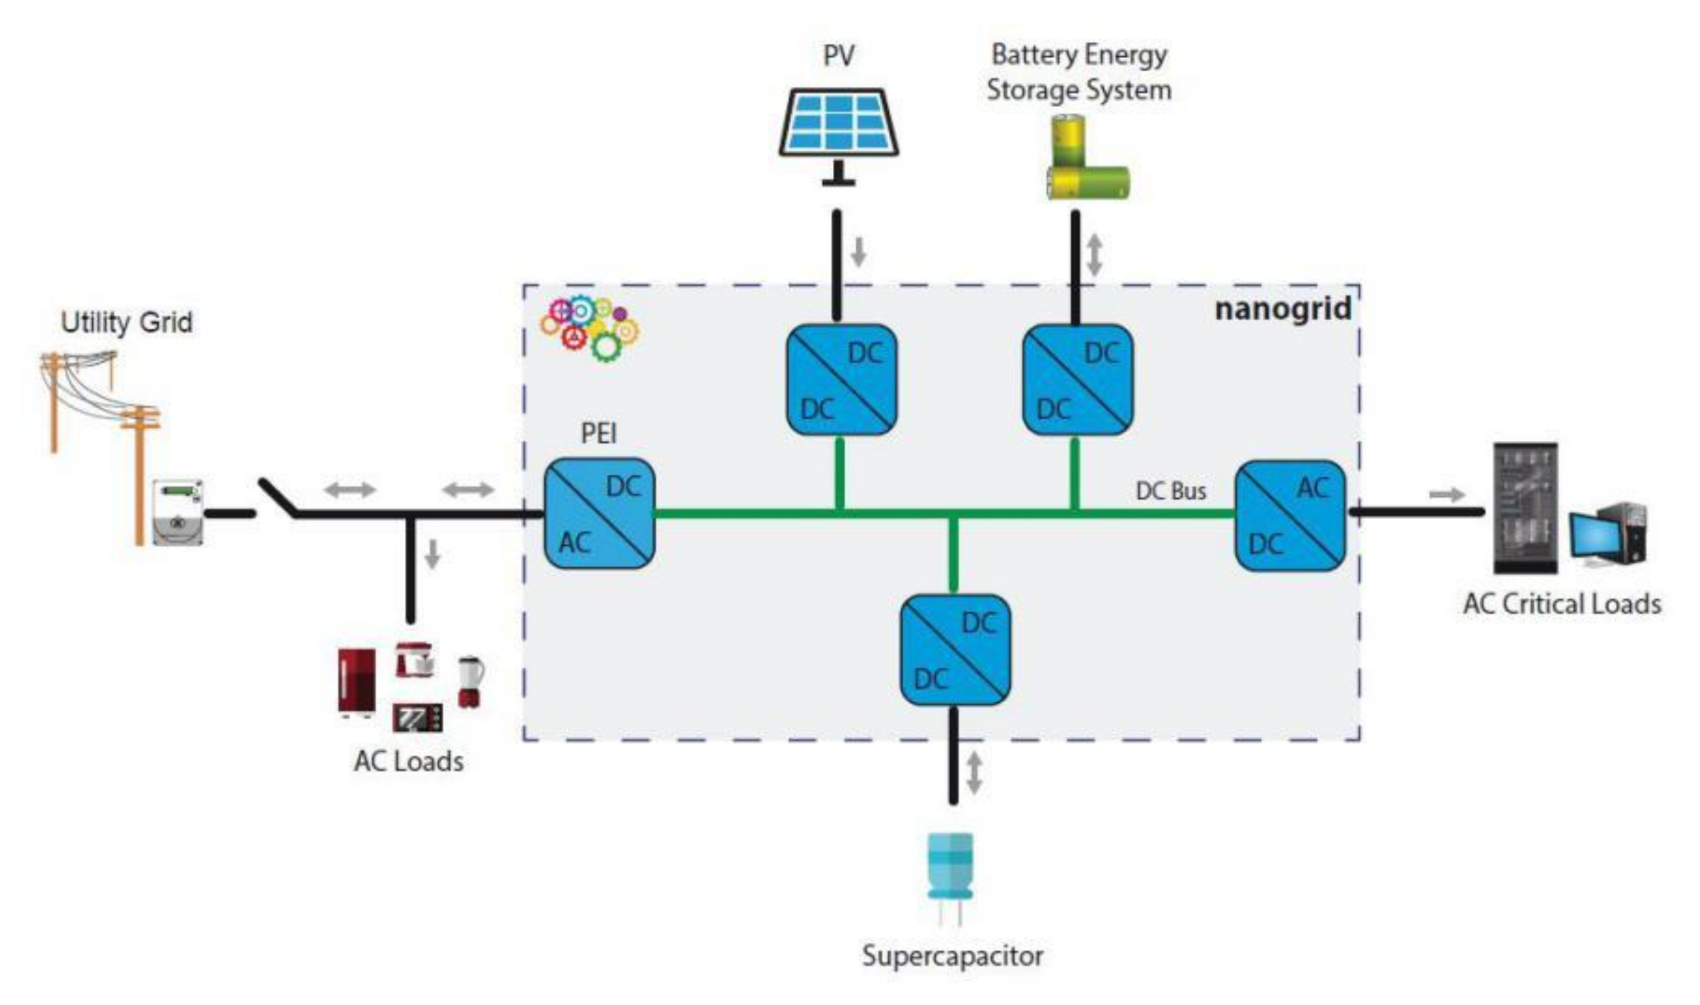
2.3. NG2 Configuration
- It is the fastest storage system;
- It is able to provide a large amount of power in a small period of time.
2.4. NG3 Configuration
2.5. NG4 Configuration
2.6. NG5 & NG6 Configuration
3. Results
- There was no active power surplus/deficit in the DCNG;
- There was no power exchange with the external network;
- The initial DC Busbar voltage value for configuration was considered to be equal to 400 V.
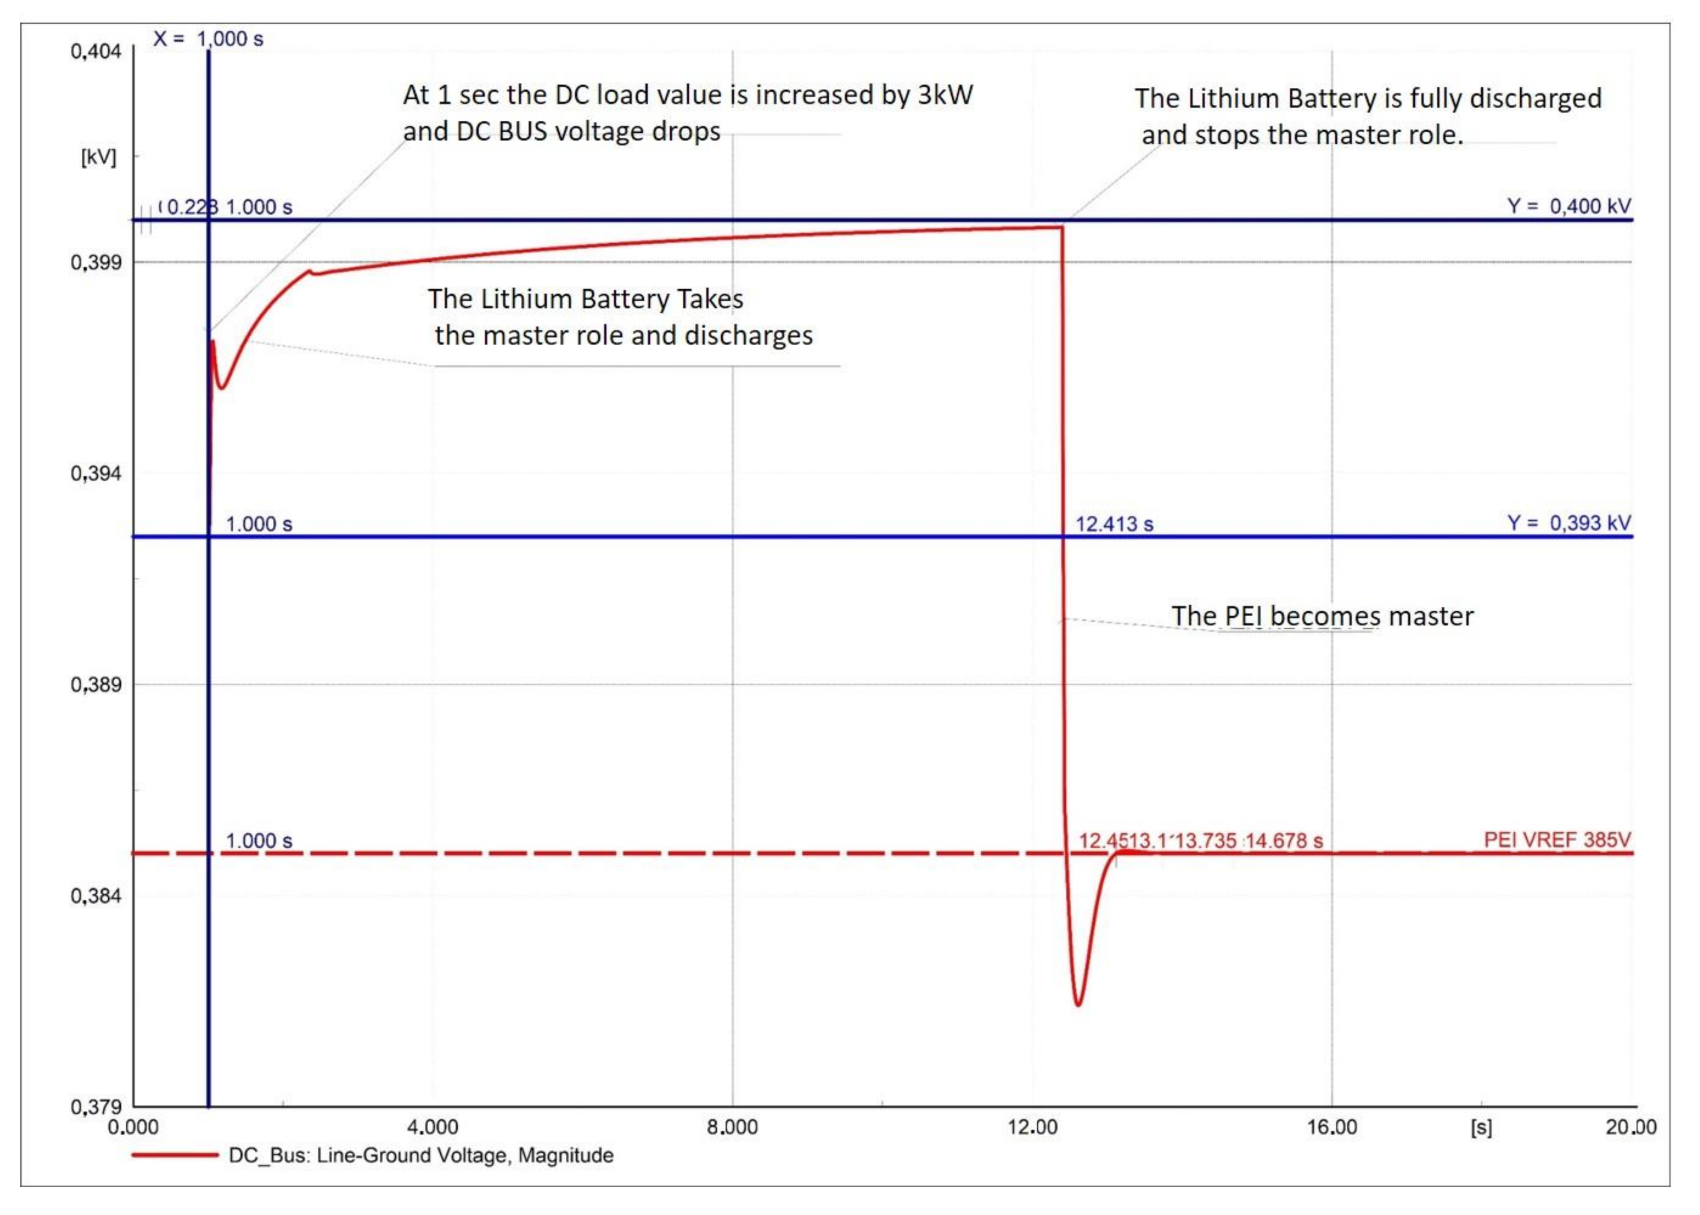
3.1. NG1 Simulation
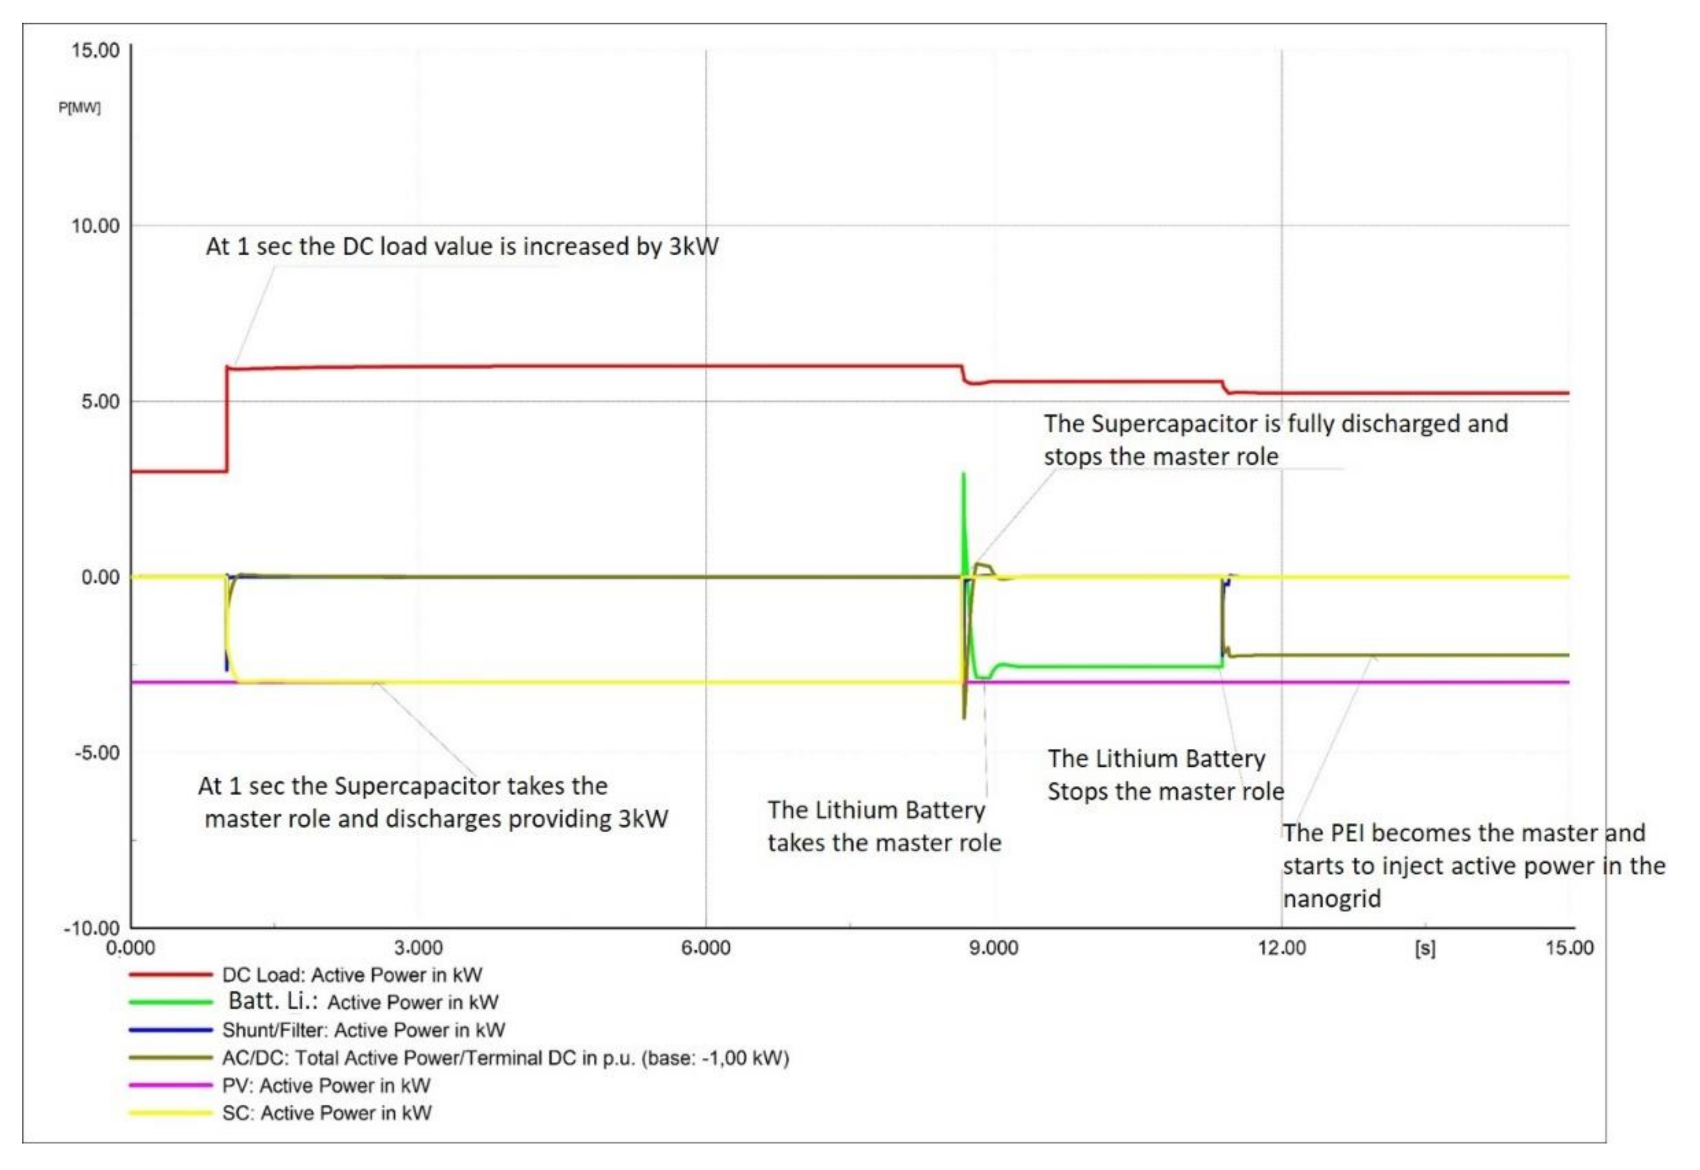
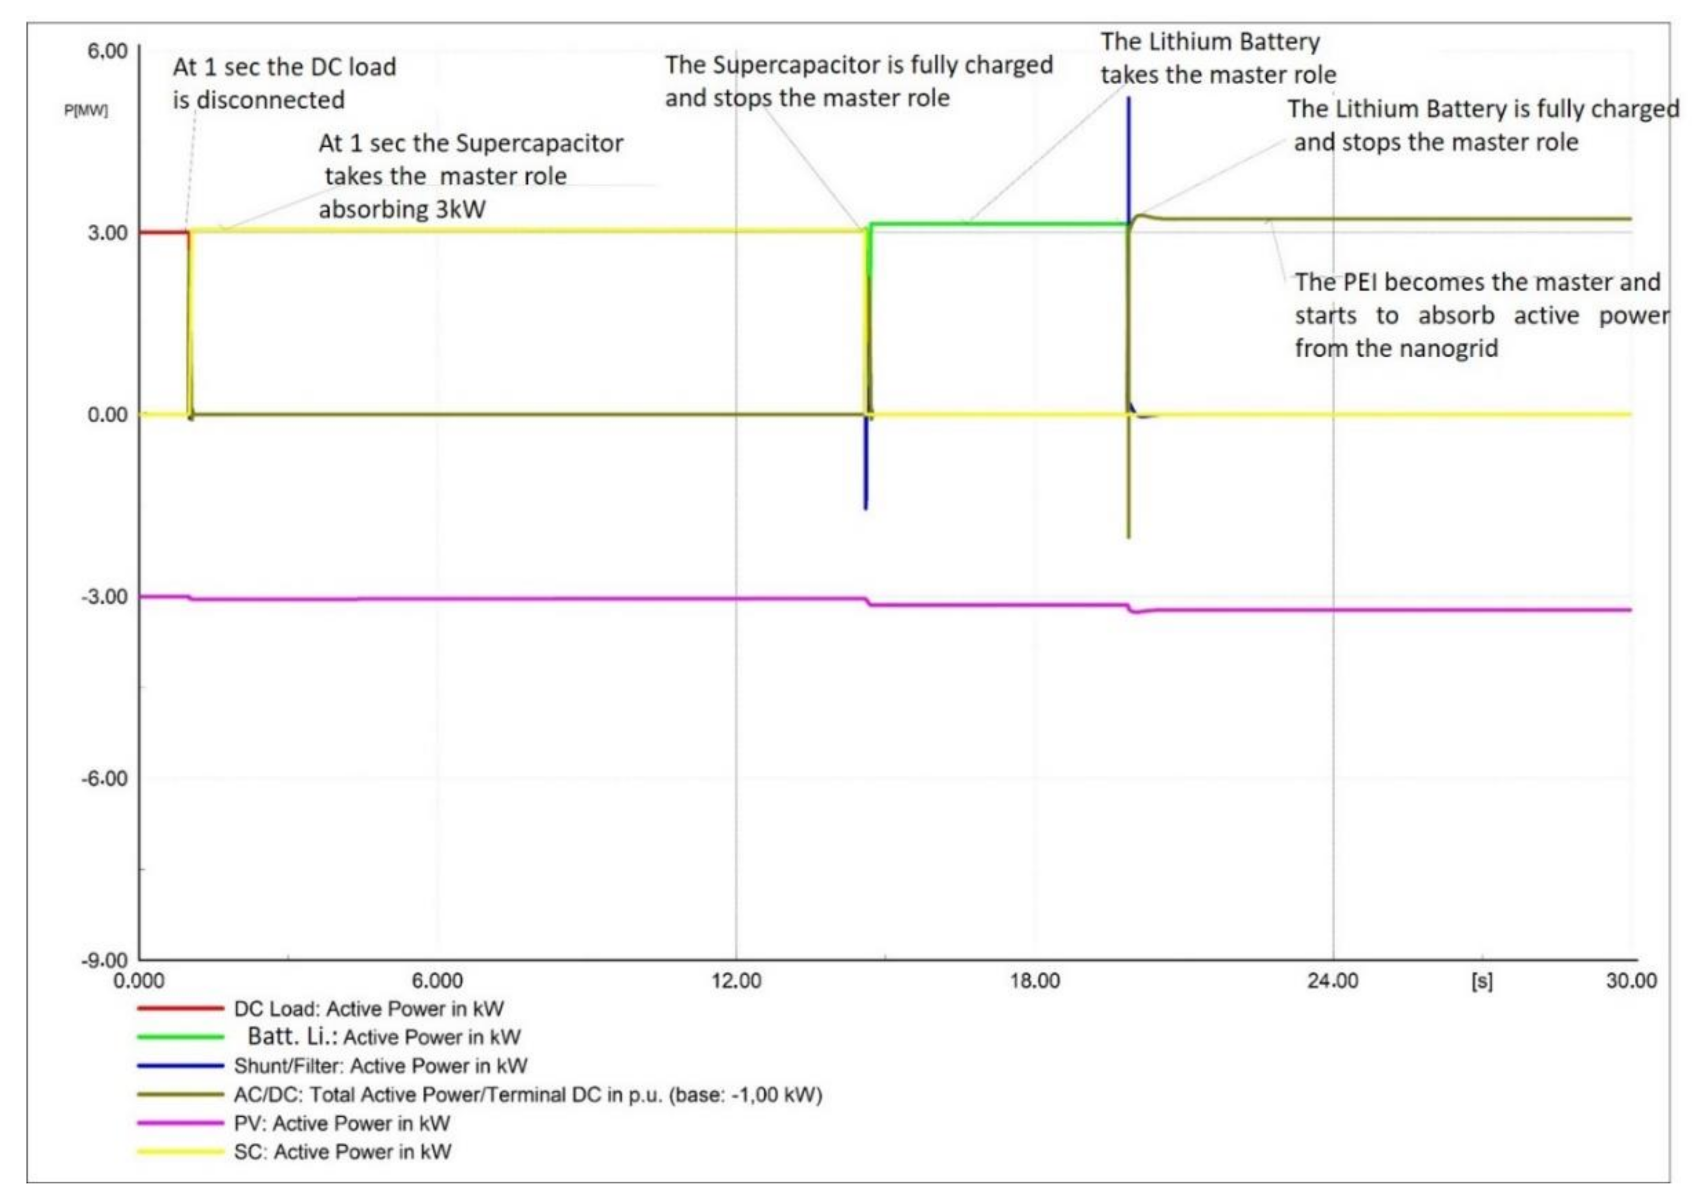
3.2. NG2 Simulation
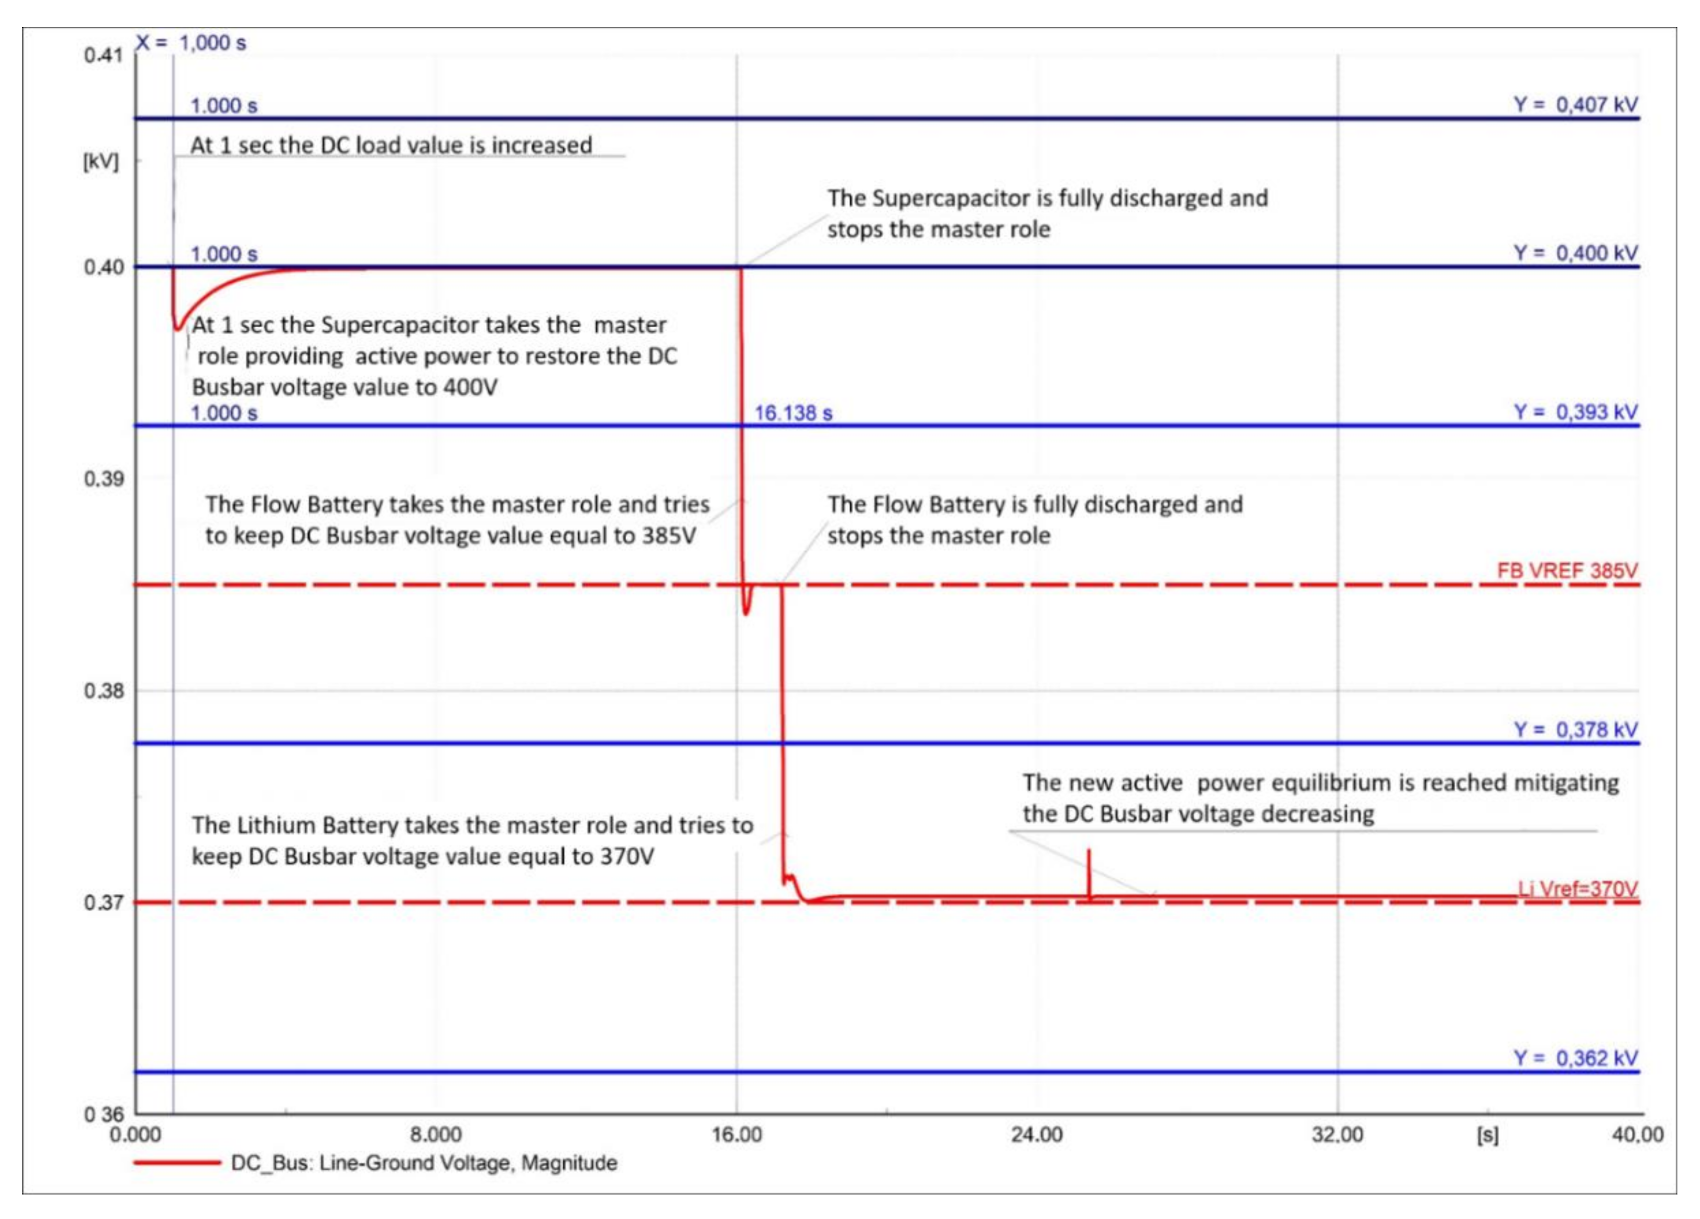
3.3. NG3 Simulation
3.4. NG4 Simulation
3.5. NG5 Simulation
3.6. NG6 Simulation
4. Discussion
5. Conclusions
Author Contributions
Funding
Institutional Review Board Statement
Informed Consent Statement
Data Availability Statement
Conflicts of Interest
Appendix A

| CONVENTIONAL STORAGE | UNCONVENTIONAL STORAGE | ||||||||||
|---|---|---|---|---|---|---|---|---|---|---|---|
| Nanogrid Configuration |  |  |  |  |  |  |  |  |  |  |  |
| NG#1 |  | | | | |||||||
| NG#2 | | | | | | ||||||
| NG#3 | | | | | | | |||||
| NG#4 | | | | | | | |||||
| NG#5 | | | | | | | |||||
| NG#6 | | | | | | | |||||
 | PEI | Lithium Battery | PEI | PV |
|---|---|---|---|---|
 | 385 VDC | 400 VDC | 415 VDC | 430 VDC |
 | Absorb | Inject | Inject Pmax | |
| MPP | MPP | MPP | VCONST |
| Inject Pmax | Absorb Inject | Absorb Pmax | Absorb Pmax |

| PEI | Lithium Battery | Supercap | LithiumBattery | PEI | PV |
|---|---|---|---|---|---|---|
| 370 VDC | 385 VDC | 400 VDC | 415 VDC | 430 VDC | 445 VDC |
| Absorb | Inject | Inject Pmax | |||
| MPP | MPP | MPP | MPP | MPP | VCONST |
| Inject Pmax | Inject | Absorb | Absorb Pmax | Absorb Pmax | |
| Absorb Inject |

| PEI | Lithium Battery | Flow Battery | Supercap | Flow Battery | Lithium Battery | PEI | PV |
|---|---|---|---|---|---|---|---|---|
| 355 VDC | 370 VDC | 385 VDC | 400 VDC | 415 VDC | 430 VDC | 445 VDC | 460 VDC |
| Absorb | Inject | Inject Pmax | |||||
| MPP | MPP | MPP | MPP | MPP | MPP | MPP | VCONST |
| Inject Pmax | Inject | Absorb | Absorb Pmax | Absorb Pmax | |||
| Inject Pmax | Inject Pmax | Inject | Absorb | Absorb Pmax | Absorb Pmax | Absorb Pmax | |
| Absorb Inject |

| PEI | Fuel Cell | Supercap | Fuel Cell | PEI | PV |
|---|---|---|---|---|---|---|
| 355 VDC | 370 VDC | 400 VDC | 415 VDC | 430 VDC | 445 VDC |
| Absorb | Inject | Inject Pmax | |||
| MPP | MPP | MPP | MPP | MPP | VCONST |
| Inject Pmax | Inject | Absorb | Absorb Pmax | Absorb Pmax | |
| Absorb Inject |

| PEI | Lithium Battery | Fuel Cell | Supercap | Fuel Cell | Lithium Battery | PEI | PV |
|---|---|---|---|---|---|---|---|---|
| 355 VDC | 370 VDC | 385 VDC | 400 VDC | 415 VDC | 430 VDC | 445 VDC | 460 VDC |
| Absorb | Inject | Inject Pmax | |||||
| MPP | MPP | MPP | MPP | MPP | MPP | MPP | VCONST |
| Inject Pmax | Inject | Absorb | Absorb Pmax | Absorb Pmax | |||
| Inject Pmax | Inject Pmax | Inject | Absorb | Absorb Pmax | Absorb Pmax | Absorb Pmax | |
| Absorb Inject |

| PEI | Lithium Battery | Supercap | LithiumBattery | Thermal Storage | PEI | PV |
|---|---|---|---|---|---|---|---|
| 370 VDC | 385 VDC | 400 VDC | 415 VDC | 430 VDC | 445 VDC | 460 VDC |
| Absorb | Inject Pmax | Inject | ||||
| MPP | MPP | MPP | MPP | MPP | MPP | VCONST |
| Absorb | Absorb Pmax | Absorb Pmax | ||||
| Inject Pmax | Inject | Absorb | Absorb Pmax | Absorb Pmax | Absorb Pmax | |
| Absorb Inject |

Appendix B
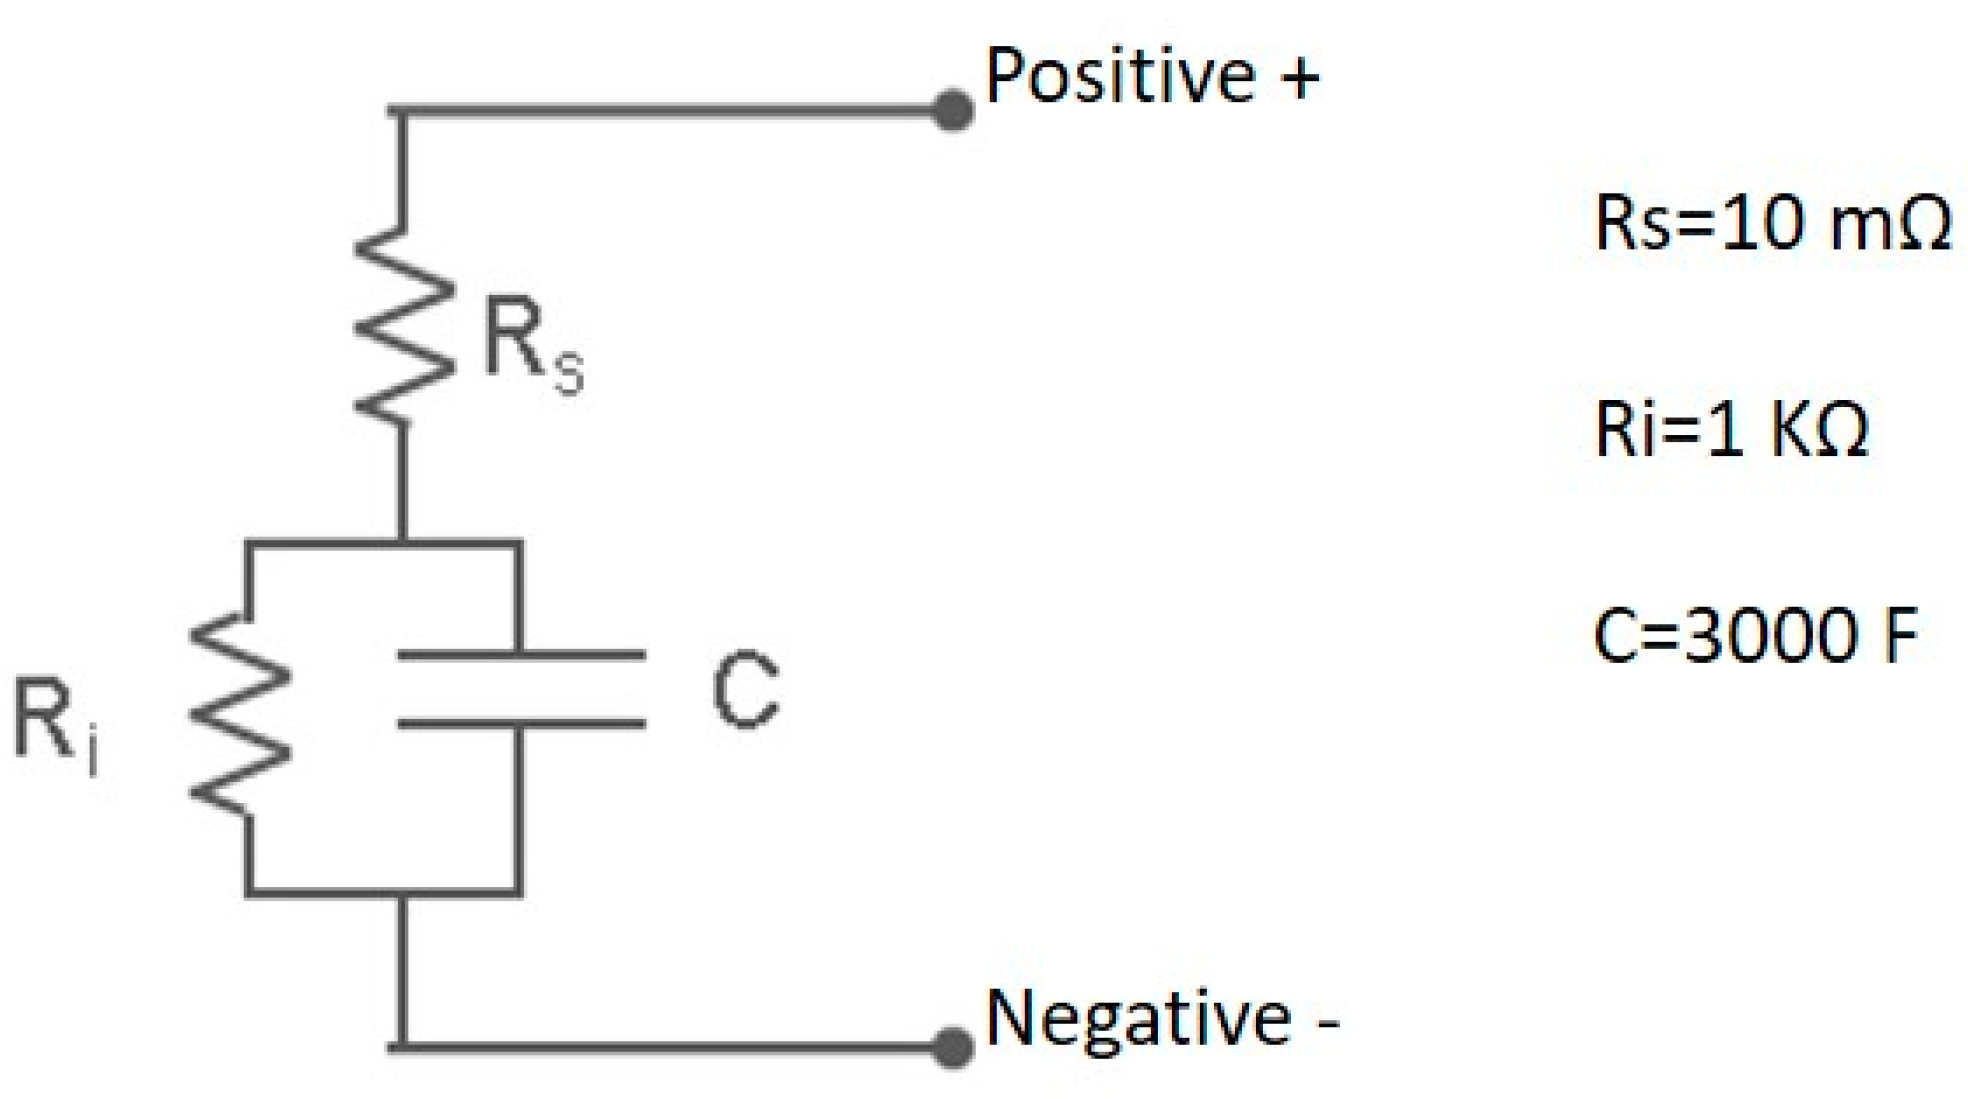
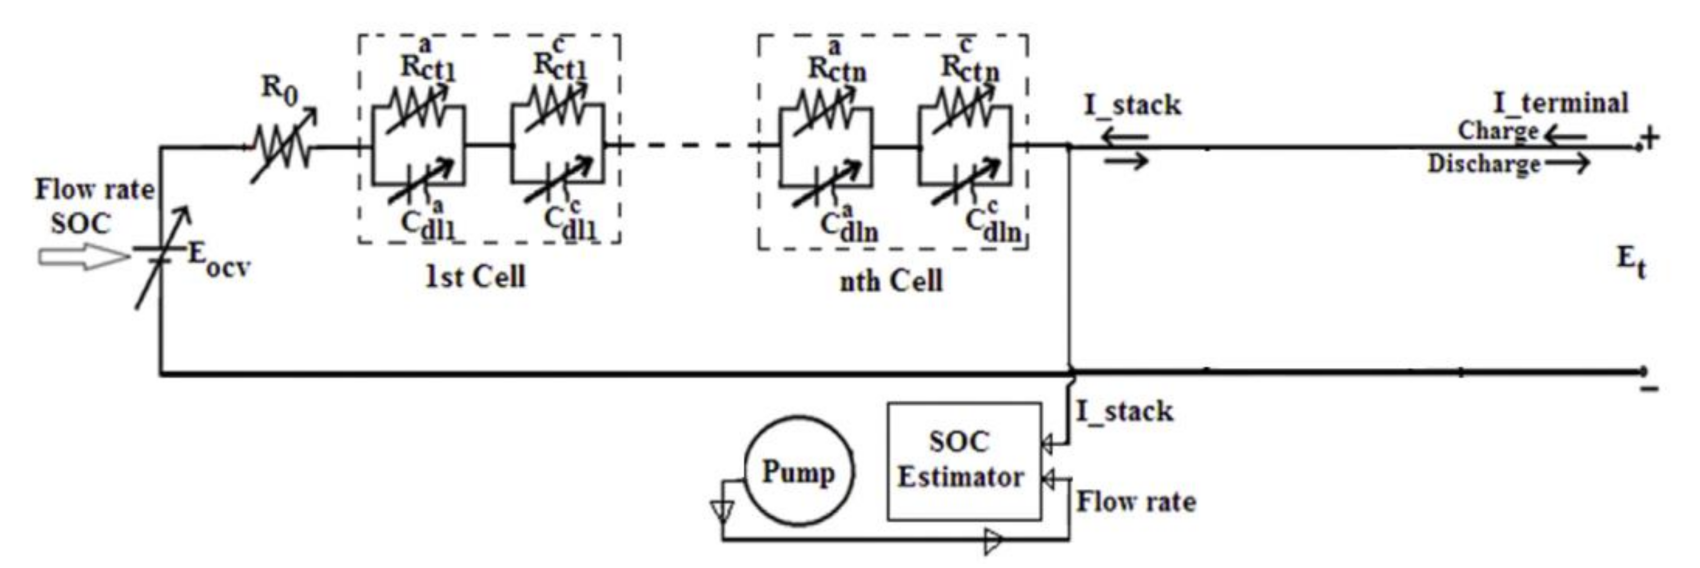
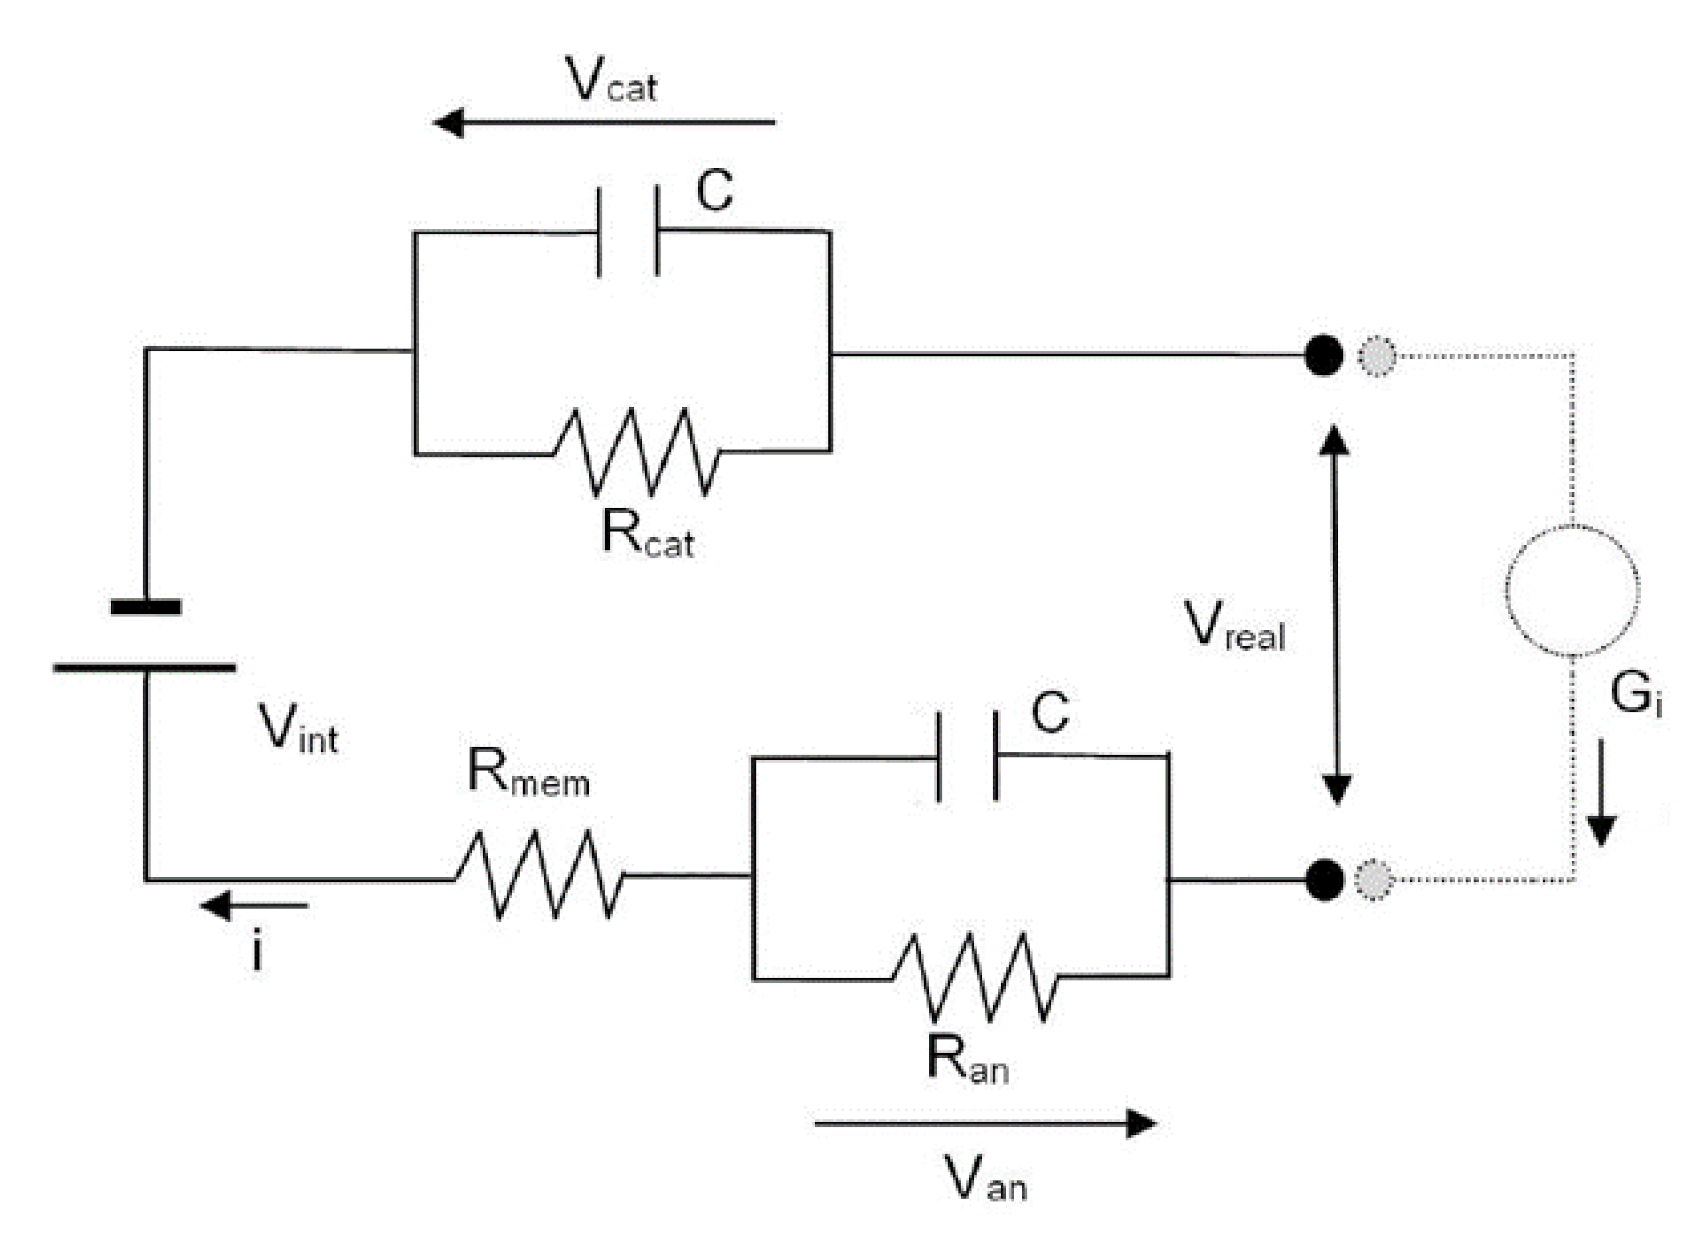
| C | Capacitor value that represents the Double Layer charging during the load variation phase; |
| Ideal stack voltage; | |
| Stack current generator; | |
| i | Stack Current; |
| Anode Resistance; | |
| Cathode Resistance; | |
| Membrane Resistance; | |
| Load; | |
| Anode Voltage Drop(Stack)/Anode Overvoltage(Electrolyzer); | |
| Cathode Voltage Drop(Stack)/Cathode Overvoltage(Electrolyzer); | |
| Stack Voltage; | |
| Ideal stack voltage. |
References
- Hart, E.K.; Stoutenburg, E.D.; Jacobson, M.Z. The potential of intermittent renewables to meet electric power demand: Current methods and emerging analytical techniques. Proc. IEEE 2011, 100, 322–334. [Google Scholar] [CrossRef]
- Herisanu, N.; Marinca, V.; Madescu, G.; Dragan, F. Dynamic response of a permanent magnet synchronous generator to a wind gust. Energies 2019, 12, 915. [Google Scholar] [CrossRef]
- Khatod, D.K.; Pant, V.; Sharma, J. Analytical approach for well-being assessment of small autonomous power systems with solar and wind energy sources. IEEE Trans. Energy Convers. 2009, 25, 535–545. [Google Scholar] [CrossRef]
- Hajiaghasi, S.; Salemnia, A.; Hamzeh, M. Hybrid energy storage system for microgrids applications: A review. J. Energy Storage 2019, 21, 543–570. [Google Scholar] [CrossRef]
- Bocklisch, T. Hybrid energy storage systems for renewable energy applications. Energy Procedia 2015, 73, 103–111. [Google Scholar] [CrossRef]
- Musale, R.; Student, P.G.; Bhusawal, S. A DBS Control Method for Coordinating Multiple Energy Storage Devices in DC Micro grid. Resincap J. Sci. Eng. 2020, 4, 6. [Google Scholar]
- Ciavarella, R.; Graditi, G.; Valenti, M.; Pinnarelli, A.; Barone, G.; Vizza, M. An Advanced DBS Strategy for a DC nanogrid integrating several energy storage technologies. In Proceedings of the International Symposium on Power Electronics, Electrical Drives, Automation and Motion (SPEEDAM), Sorrento, Italy, 24–26 June 2020; pp. 351–356. [Google Scholar]
- Zaid, Z.H.; Lopes, L.A. Control Scheme for a Hybrid Energy Storage System Employed in a Grid-Tied DC Nano-grid. In Proceedings of the IEEE 29th International Symposium on Industrial Electronics (ISIE), Delft, The Netherlands, 17–19 June 2020. [Google Scholar]
- Menniti, D.; Pinnarelli, A.; Sorrentino, N.; Belli, G. A Local Market Model Involving Prosumers Taking Into Account Distribution Network Congestions in Smart Cities. Int. Rev. Electr. Eng. (IREE) 2014, 9, 976–985. [Google Scholar] [CrossRef]
- Asif, A.A.; Singh, R.; Majumder, A.J.A. The Paradigm Shifting Role of Solar Powered DC Nano-Grids in New Electrification and Replacement for Traditional Grid Distribution. In Proceedings of the 2020 Clemson University Power Systems Conference (PSC), Clemson, SC, USA, 10–13 March 2020; pp. 1–6. [Google Scholar]
- Chen, D.; Xu, L.; Yao, L. DC Voltage Variation Based Autonomous Control of DC Microgrids. IEEE Trans. Power Deliv. 2013, 28, 637–648. [Google Scholar] [CrossRef]
- Garg, A.; Joshi, B.M.; Oruganti, R. Modeling a DC Microgrid with real-time Power Management using DC Bus Signalling. In Proceedings of the IEEE Energy Conversion Congress & Expo, Portland, OR, USA, 23–27 September 2018; pp. 46–53. [Google Scholar]
- Xu, L.; Chen, D. Control and Operation of a DC Microgrid with Variable Generation and Energy Storage. IEEE Trans. Power Deliv. 2011, 26, 2513–2522. [Google Scholar] [CrossRef]
- Zubieta, L.E. Power Management and Optimization Concept for DC Microgrids, in DC Microgrids (ICDCM). In Proceedings of the IEEE First International Conference, Atlanta, GA, USA, 7–10 June 2015; pp. 81–85. [Google Scholar]
- Quintana-Barcia, P.; Dragicevic, T.; Garcia, J.; Ribas, J.; Guerrero, J.M. A distributed control strategy for islanded single-phase microgrids with hybrid energy storage systems based on power line signaling. Energies 2019, 12, 85. [Google Scholar] [CrossRef]
- Hwang, P.I.; Jang, G.; Pyo, G.C.; Han, B.M.; Moon, S.I.; Ahn, S.J. Dc microgrid operational method for enhanced service reliability using DC bus signaling. J. Electr. Eng. Technol. (JEET) 2015, 10, 452–464. [Google Scholar] [CrossRef]
- Garg, A.; Tummuru, N.R.; Oruganti, R. Implementation of Energy Management Scenarios in a DC Microgrid using DC Bus Signaling. In Proceedings of the 2020 IEEE International Conference on Power Electronics, Smart Grid and Renewable Energy (PESGRE2020), Cochin, India, 2–4 January 2020. [Google Scholar]
- Papadimitriou, N.; Zountouridou, E.I.; Hatziargyriou, N.D. Review of hierarchical control in DC microgrids. Electr. Power Syst. Res. 2015, 122, 159–167. [Google Scholar] [CrossRef]
- Pinnarelli, A.; Menniti, D.; Sorrentino, N.; Bayod, A.A. Distributed Energy Resources in Local Integrated Energy Systems, Optimal Operation and Planning; Chapter 8; Graditi, G., di Somma, M., Eds.; Elsevier: Amsterdam, The Netherlands, 2021; ISBN 9780128238998. [Google Scholar]
- Jian, Z.; He, Z.; Jia, J.; Xie, Y. A Review of Control Strategies for DC Micro-grid, Intelligent Control and Information Processing (ICICIP). In Proceedings of the 4th International Conference, Beijing, China, 9–11 June 2013; pp. 666–671. [Google Scholar]
- Kumar, J.; Agarwal, A.; Agarwal, V. A review on overall control of DC microgrids. J. Energy Storage 2019, 21, 113–138. [Google Scholar] [CrossRef]
- Bryan, J.; Duke, R.; Round, S. Decentralized generator scheduling in a nanogrid using DC bus signaling. In Proceedings of the IEEE Power Engineering Society General Meeting, Denver, CO, USA, 6–10 June 2004; pp. 977–982. [Google Scholar]
- Schonbergerschonberger, J.; Duke, R.; Round, S.D. DC-Bus Signaling: A Distributed Control Strategy for a Hybrid Renewable Nanogrid. IEEE Trans. Ind. Electron. 2006, 53, 453–1460. [Google Scholar] [CrossRef]
- Zhang, L.; Wu, T.; Xing, Y.; Sun, K.; Guerrero, J.M. Power control of DC microgrid using DC bus signaling. In Proceedings of the IEEE Twenty-Sixth Annual Applied Power Electronics Conference and Exposition (APEC), Fort Worth, TX, USA, 6–11 March 2011; pp. 1926–1932. [Google Scholar]
- Sun, K.; Zhang, L.; Xing, Y.; Guerrero, J. A Distributed Control Strategy Based on DC Bus Signaling for Modular Photovoltaic Generation Systems with Battery Energy Storage. IEEE Trans. Power Electron. 2011, 26, 3032–3045. [Google Scholar] [CrossRef]
- Li, F.; Lin, Z.; Qian, Z.; Wu, J. Active dc bus signaling control method for coordinating multiple energy storage devices in dc microgrid. In Proceedings of the IEEE Second International Conference on DC Microgrids (ICDCM), Nuremburg, Germany, 27–29 June 2017; pp. 221–226. [Google Scholar]
- Jin, C.; Wang, P.; Xiao, J.; Tang, Y.; Choo, F.H. Implementation of Hierarchical Control in DC Microgrids. IEEE Trans. Ind. Electron. 2014, 61, 4032–4042. [Google Scholar] [CrossRef]
- Han, J.X.; Xiao, W. Advanced Control Scheme for DC Microgrid via Dual Active Bridge and Bus Signaling. In Proceedings of the 2019 IEEE 28th International Symposium on Industrial Electronics (ISIE), Vancouver, BC, Canada, 12–14 June 2019. [Google Scholar]
- Chen, M.; Rincon-Mora, G.A. Accurate electrical battery model capable of predicting runtime and I-V performance. IEEE Trans. Energy Convers. 2006, 21, 504–511. [Google Scholar] [CrossRef]
- Bhattacharjee, A.; Roy, A.; Banerjee, N.; Patra, S.; Saha, H. Precision dynamic equivalent circuit model of a Vanadium Redox Flow Battery and determination of circuit parameters for its optimal performance in renewable energy applications. J. Power Sources 2018, 396, 506–518. [Google Scholar] [CrossRef]
- Adinolfi, G.; Ciavarella, R.; Graditi, G.; Merola, A.; Valenti, M. Coordinated Control of Supercapacitor-Battery Tandem by Smart Converters in Microgrid Scenario. Lect. Notes Electr. Eng. 2020, 604, 669–678. [Google Scholar]


| Conventional Storage | Type | Nominal Energy | Nominal Capacity |
|---|---|---|---|
| Li-Ion Battery | Lithium Iron Phosphate | 4.1 kWh | 80 Ah |
| Load | Type | Power | |
| Load1 | Non Critical | 1.5 kW | |
| Load2 | Critical | 1.5 kW | |
| Microgeneration | Power | ||
| PV | 3 kW |
| Conventional Storage | Type | Nominal Energy | Nominal Capacity | Max. Peak Current (A) |
|---|---|---|---|---|
| Li-Ion Battery | Lithium Iron Phosphate | 4.1 kWh | 80 Ah | |
| Supercapacitor | SPSCAP Series_2017-2_EN 3000F | 3.04 Wh | 2165 | |
| Load | Type | Power | ||
| Load1 | Non Critical | 1.5 kW | ||
| Load2 | Critical | 1.5 kW | ||
| Microgeneration | Power | |||
| PV | 3 kW |
| Current | Flow Rate (L·min−1) | R0(Ω) | Rct_a(Ω) | Rct_c(Ω) | Cdl_a(Ω) | Cdl_c(Ω) |
|---|---|---|---|---|---|---|
| 40 A | 3 6 12 18 | 0.120 0.102 0.075 0.045 | 2.89 × 10⁻² 0.98 × 10⁻² 0.92 × 10⁻² 0.85 × 10⁻² | 5.99 × 10⁻³ 2.04 × 10⁻³ 2.10 × 10⁻³ 2.04 × 10⁻³ | 0.24 × 10³ 0.66 × 10³ 3.98 × 10³ 11.6 × 10³ | 0.94 × 10³ 2.62 × 10³ 15.7 × 10³ 45.6 × 10³ |
| 45 A | 3 6 12 18 | 0.126 0.106 0.078 0.048 | 2.89 × 10⁻² 0.98 × 10⁻² 0.92 × 10⁻² 0.85 × 10⁻² | 5.99 × 10⁻³ 2.04 × 10⁻³ 2.10 × 10⁻³ 2.04 × 10⁻³ | 0.24 × 10³ 0.66 × 10³ 3.98 × 10³ 11.6 × 10³ | 0.94 × 10³ 2.62 × 10³ 15.7 × 10³ 45.6 × 10³ |
| 50 A | 3 6 12 18 | 0.129 0.109 0.081 0.049 | 2.89 × 10⁻² 0.98 × 10⁻² 0.92 × 10⁻² 0.85 × 10⁻² | 5.99 × 10⁻³ 2.04 × 10⁻³ 2.10 × 10⁻³ 2.04 × 10⁻³ | 0.24 × 10³ 0.66 × 10³ 3.98 × 10³ 11.6 × 10³ | 0.94 × 10³ 2.62 × 10³ 15.7 × 10³ 45.6 × 10³ |
| Current | Flow Rate (L·min−1) | R0(Ω) | Rct_a(Ω) | Rct_c(Ω) | Cdl_a(Ω) | Cdl_c(Ω) |
|---|---|---|---|---|---|---|
| −40 A | 3 6 12 18 | 0.141 0.128 0.105 0.070 | 2.89 × 10⁻² 0.98 × 10⁻² 0.92 × 10⁻² 0.85 × 10⁻² | 5.99 × 10⁻³ 2.04 × 10⁻³ 2.10 × 10⁻³ 2.04 × 10⁻³ | 0.24 × 10³ 0.66 × 10³ 3.98 × 10³ 11.6 × 10³ | 0.94 × 10³ 2.62 × 10³ 15.7 × 10³ 45.6 × 10³ |
| −45 A | 3 6 12 18 | 0.159 0.144 0.118 0.0080 | 2.89 × 10⁻² 0.98 × 10⁻² 0.92 × 10⁻² 0.85 × 10⁻² | 5.99 × 10⁻³ 2.04 × 10⁻³ 2.10 × 10⁻³ 2.04 × 10⁻³ | 0.24 × 10³ 0.66 × 10³ 3.98 × 10³ 11.6 × 10³ | 0.94 × 10³ 2.62 × 10³ 15.7 × 10³ 45.6 × 10³ |
| −50 A | 3 6 12 18 | 0.176 0.161 0.131 0.090 | 2.89 × 10⁻² 0.98 × 10⁻² 0.92 × 10⁻² 0.85 × 10⁻² | 5.99 × 10⁻³ 2.04 × 10⁻³ 2.10 × 10⁻³ 2.04 × 10⁻³ | 0.24 × 10³ 0.66 × 10³ 3.98 × 10³ 11.6 × 10³ | 0.94 × 10³ 2.62 × 10³ 15.7 × 10³ 45.6 × 10³ |
| SOC p.u. | Eocv [V] |
|---|---|
| 0.0001 | 18.0933803 |
| 0.0085 | 22.5910457 |
| 0.05 | 24.42474933 |
| 0.1 | 25.17978286 |
| 0.2 | 25.99919895 |
| 0.3 | 26.5438357 |
| 0.4 | 26.99029196 |
| 0.5 | 27.4 |
| 0.6 | 27.80970804 |
| 0.75 | 28.51010857 |
| 0.9 | 29.62021714 |
| 0.95 | 30.37525067 |
| 0.99 | 32.04320487 |
| 0.9999 | 36.7066197 |
Publisher’s Note: MDPI stays neutral with regard to jurisdictional claims in published maps and institutional affiliations. |
© 2021 by the authors. Licensee MDPI, Basel, Switzerland. This article is an open access article distributed under the terms and conditions of the Creative Commons Attribution (CC BY) license (http://creativecommons.org/licenses/by/4.0/).
Share and Cite
Ciavarella, R.; Graditi, G.; Valenti, M.; Pinnarelli, A.; Barone, G.; Vizza, M.; Menniti, D.; Sorrentino, N.; Brusco, G. Modeling of an Energy Hybrid System Integrating Several Storage Technologies: The DBS Technique in a Nanogrid Application. Sustainability 2021, 13, 1170. https://doi.org/10.3390/su13031170
Ciavarella R, Graditi G, Valenti M, Pinnarelli A, Barone G, Vizza M, Menniti D, Sorrentino N, Brusco G. Modeling of an Energy Hybrid System Integrating Several Storage Technologies: The DBS Technique in a Nanogrid Application. Sustainability. 2021; 13(3):1170. https://doi.org/10.3390/su13031170
Chicago/Turabian StyleCiavarella, Roberto, Giorgio Graditi, Maria Valenti, Anna Pinnarelli, Giuseppe Barone, Maurizio Vizza, Daniele Menniti, Nicola Sorrentino, and Giovanni Brusco. 2021. "Modeling of an Energy Hybrid System Integrating Several Storage Technologies: The DBS Technique in a Nanogrid Application" Sustainability 13, no. 3: 1170. https://doi.org/10.3390/su13031170
APA StyleCiavarella, R., Graditi, G., Valenti, M., Pinnarelli, A., Barone, G., Vizza, M., Menniti, D., Sorrentino, N., & Brusco, G. (2021). Modeling of an Energy Hybrid System Integrating Several Storage Technologies: The DBS Technique in a Nanogrid Application. Sustainability, 13(3), 1170. https://doi.org/10.3390/su13031170