Abstract
Globally a huge amount of municipal solid waste (MSW) is being produced which is very difficult to dispose. Composting of MSW is one of the options of solid waste recycling, but its use by the farmers is limited because of its low nutrient status. This study has considered some organic amendments to increase nutrient status of MSW compost for its potential use as an organic fertilizer in rice cultivation. We prepared three types of amended compost by mixing 20% mustard oil cake (MOC) and 30% poultry manure (PM) or cow dung (CD) or sugarcane press mud (SPM) with 50% MSW compost. The inoculum of Trichoderma viride was used to accelerate the composting process. The use of different amendments improved the nutrient level of MSW compost. A field experiment was conducted to evaluate the performances of amended MSW composts alone and in combination with chemical fertilizers on yield, nutrient content and balance in rice (var. BRRI dhan28). The experiment was conducted in 2018 at Bangladesh Agricultural University (BAU) farm, Mymensingh having silt loam texture, pH in water of 6.7 and 2.79% organic matter; the soil was Aeric Haplaquept under the order Inceptisols. There were 10 treatments consisting of chemical fertilizers (urea, triple superphosphate, muriate of potash, gypsum and zinc sulphate) and four types of MSW compost (three amended and one unamended). Based on the results of yield and N, P, K and S concentration of rice grain, the treatment containing 50% fertilizers +10 t ha−1 of amended compost (MSW + MOC + SPM in a ratio of 5:2:3) performed the best. There were apparent negative balances for N (11–45 kg ha−1) and K (6–48 kg ha−1), and positive balances for P (8–71 kg ha−1) and S (4–46 kg ha−1) in soils, across the treatments. Results of this study have significant value in fertilizer management strategies for rice cultivation in sub-tropical countries.
1. Introduction
Among the cereals, rice (Oryza sativa L.), is one of the leading staple crops for half of the world’s population and in Bangladesh rice is the main food crop, covering about 75% of agricultural land use. Fertilizer use accounts for 20% of input costs in rice production [1]. To reduce fertilizer cost, environmental degradation and restore soil fertility, organic amendment has a significant value. To achieve agricultural sustainability, the use of organic amendment has achieved prime importance in recent years, particularly under intensive cropping system in tropical and sub-tropical countries [2].
Composting of municipal solid waste (MSW) has recently gained good attention from the point of protection of environmental degradation, saving of landfilling area, cost of incineration and scope of its use for crop production. However, the use of MSW compost is limited since MSW compost is generally poor in essential plant nutrients and the crops do not respond to its exclusive addition. Scope exists to enhance the nutrient value of compost by addition of some organic amendments viz green manure, cow dung and mustard oil cake [3]. MSW compost amendment may result in a significant enhancement of heavy metal loadings in the amended topsoils. As reported by Achiba et al. [4], a 5-year application of MSW compost increased the organic matter and N content, while increasing the heavy metal concentration in the soil. Thus, mixing of some organic materials (e.g., mustard oil cake, poultry manure and sugar press mud) with MSW compost would increase the nutrient value and decrease the heavy metal contents due to dilution for the addition of amendments the heavy metals (e.g., Pb, Cd and Ni) concentration of MSW compost. Thus, some organic materials such as mustard oil cake, poultry manure and sugarcane press mud could be appropriate materials for the production of nutrient-enriched MSW compost with lesser impact to the environment, lower in cost operation and reduction in the weight of compost easily transportable to the farmer’s field.
Nevertheless, single manure or fertilizer cannot sustain soil health and crop yield, thus, the combined use of organic manure and mineral fertilizers is essential. The benefits of integrated use of compost and fertilizers in improving crop yield, crop quality and soil fertility are widely reported [5,6,7,8]. Moe et al. [9] observed that the integrated 50% estimated mineralizable nitrogen (EMN) with poultry manure, cow manure or compost and 50% of the recommended chemical fertilizer was effective in terms of growth parameters and yields indica (var. Manawthukha) and japonica (var. Genkitsukushi) rice compared with fertilizer alone. Sustainable agriculture requires the use of organic fertilizers for steady nutrients supply and improving soil organic matter, soil physical and chemical properties and crop productivity [10,11,12].
The present study aimed at nutrient enrichment of MSW compost using locally available nutrient rich materials in a suitable proportion and evaluating the influence of nutrient enriched MSW compost on yield, nutrient content, soil properties and nutrient balance in rice.
2. Materials and Methods
2.1. Production of Nutrient-Enriched MSW Compost
We had procured marketable MSW compost from the organization Grameen Manobic Unnayan Sangstha (“GRAMAUS”). This organization is producing and marketing compost with solid wastes collected from the Mymensingh City, Bangladesh. They separate plastics, glasses and metals at source point of collection. Thus, the MSW compost contained mainly kitchen wastes (vegetables, fruits, fishes, etc.).
MSW compost was mixed with four different types of organic materials in a suitable proportion (50% MSW + 20% mustard oil cake (MOC) + 30% poultry manure (PM)/cow dung (CD)/sugarcane press mud (SPM)) to upgrade the nutrient level of MSW compost. MOC, PM, CD and SPM were used as amended materials. These five organics were analysed for N, P, K and S contents; the results being shown in Table 1.

Table 1.
Nutrient status of municipal solid waste (MSW) compost, mustard oil cake, cow dung, poultry manure and sugar press mud.
The N, P, K and S levels in four different types of amended compost are given in Table 2. Trichoderma was used for every MSW compost treatment (T3–T10) to accelerate the composting process [13]. The treatments were replicated thrice in a randomized block design which has been made clear in Section 2.2.3. The C:N ratio of the amended composts varied from 12:1–20:1 and pH from 6.5–7.0. T. viride inoculum was added to the amended and unamended MSW compost at a rate of 1 litre broth (liquid media) per ton compost, the fungal count being 106 cfu mL−1 (platelet count). The concentration of N and P in the amended MSW compost had manifold increased over unamended MSW compost. The procedure for determining nutrient contents of different organic materials and MSW composts is stated in nutrient analysis section under field experiment.
Table 2.
Nutrient level of different types of compost.
2.2. Field Experiment
2.2.1. Location and Site
The field trial with rice was conducted at Bangladesh Agricultural University (BAU) research farm, Mymensingh (24°56.11′ N, 89°55.54′ E) which belongs to Old Brahmaputra Floodplain agro-ecological zone [14] with non-calcareous dark grey floodplain soil characteristics. According to US Soil Taxonomy, the soil is AericHaplaquept under the Order Inceptisols and as per FAO Soil Unit it is Chromic-EutricGleysols. The location has a subtropical humid climate and is characterized by hot and humid summer and cold winter. The research field was medium high land.
2.2.2. Soil Characteristics
The soil (0–15 cm) was silt loam (14% sand, 70% silt and 16% clay) having a 6.7 pH (water), 2.79% organic matter [15], 0.17% Kjeldahl N [16], 4.1 mg kg−1 Olsen P [17], 0.089 cmol (+) kg−1 NH4OAc extractable K [18], 17.1mg kg−1 CaCl2 extractable S [19], 0.65 mg kg−1 DTPA extractable Zn [20] and 0.24 mg kg−1 Ca(H2PO4)2 extractable B [21].
2.2.3. Treatments and Design
There were 10 treatments with different combinations of chemical fertilizers (urea, triple superphosphate (TSP), muriate of potash (MoP), gypsum and ZnSO4.7H2O) and four compost types. Trichoderma inoculum was added to the MSW compost one month ahead of its field application. The details of the treatments are depicted in Table 3. The aim of the experiments was to reduce the use of chemical fertilizers by 50% through supplementing with MSW compost (50%) + MOC (20%) + PM/CD/SPM (30%). Amount of nutrient addition through fertilizers and compost is given in Table 3. The 100% fertilizer dose for urea, TSP, MoP, gypsum and ZnSO4.7H2O was 300, 100, 180, 65 and 14 kg ha−1, respectively. The experiment was laid out in a randomized complete block design (RCBD), with three replications.
Table 3.
Nutrient addition through fertilizers and compost (kg ha−1).
2.2.4. Crop Management
The plots received nutrient enriched compost and/or fertilizers as per treatments. Fertilizers such as urea, TSP, MoP, gypsum and zinc sulphate (ZnSO4.7H2O) were used as sources of N, P, K, S and Zn, respectively. The one-third dose of urea and the full dose of all other fertilizers were applied as basal to the individual plots after layout preparation. The second split of urea was applied after 30 days of transplanting (active tillering stage) and the third split was after 60 days (panicle initiation stage).
The 40-day old rice seedlings (variety BRRI dhan28) were transplanted on 15 February 2018 at 3 seedlings hill−1 with 50 × 20 cm spacing. The crop was irrigated whenever required to maintain 3–5 cm water height almost throughout the crop period, irrigation was stopped 10 days before harvesting. Weeding was done twice over the season to keep the plots free from weeds and it was done two days ahead of urea top dressing. Plant protection measures viz insecticide and fungicide spraying was done to keep the crop free from any insect and pathogen attack.
The crop was harvested after 110 days of transplanting on 7 June 2019. Various growth and yield characters of the crop for each plot were recorded. The characters included plant height (cm), tillers hill−1, panicle length (cm), 1000-grain weight, grain yield (kg plot−1, converted to t ha−1) and straw yield (kg plot−1, converted to t ha−1). The grain and straw samples from every plot were chemically analysed for N, P, K and S concentrations.
2.2.5. Nutrient Analysis
For N determination, H2SO4 digestion (Kjeldahl method) and for P, K and S determination HNO3−H2O2 digestion procedures were followed [22]. The amount of N, P, K and S in the acid digest was measured by the methods as used for soil analysis. Nitrogen in the digest was estimated by distillation with 10N NaOH followed by titration of the distillate trapped in H3BO3 indicator solution with 0.01N H2SO4 [16]. The K concentration in the acid digest was determined by flame photometer. The amount of P in the digest was determined colorimetrically, and the S determined turbidmetrically, as indicated in the soil characteristics section.
2.2.6. Statistical Analysis
All the data (plant growth, yield, yield components, grain and straw nutrient contents and soil analysis after harvest) were statistically analysed by “R”, version 3.4.3 software. The analysis of variance for every parameter was performed by F-test and mean comparisons of the treatments were done by Duncan’s multiple range test (DMRT), where p < 0.05 was considered as the threshold value for significance [23].
3. Results
The growth and yield components, grain and straw yields, nutrient concentrations, nutrient uptake, nutrient balance and changes in soil properties were examined as the treatment effects.
3.1. Crop Yield
The grain yield of rice (cv. BRRI dhan28) increased significantly due to the application of compost and chemical fertilizers applied either alone or in combinations. The yield varied from 3.48 to 7.09 t ha−1 over the treatments (Figure 1). Like other parameters, the T10 treated plots (50% fertilizer + MSW 50% + MOC 20% + SPM 30%) produced the highest grain yield, showing 104% yield benefits over control. All the combined treatments (T7–T10) had a better influence on grain yield compared to single fertilizer or compost treatments showing the values of 6.21, 6.21, 6.66 and 7.09 t ha−1, respectively. Treatment T2 having only mineral fertilizers produced significantly higher grain yield compared to T3 treatment containing only MSW compost. The treatments in respect of grain yield can be ranked in the order of T10 > T9 > T8 = T7 > T6 > T4 > T5 > T2 > T3 > T1. The straw yield of rice due to different treatments ranged from 4.18 to 7.80 t ha−1. Similar to grain yield, treatment T10 recorded the highest straw yield, which was statistically identical with T9 having a yield record of 7.33 t ha−1 (Table 4). The control treatment (T1) had the lowest straw yield. Treatments T4, T6, T7, T8 and T9 produced identical straw yields with the values of 6.29, 6.51, 6.83, 6.83 and 7.33 t ha−1, respectively. The treatments followed the order: T10 > T9 > T8 = T7 > T6 > T4 > T5 > T2 >T3 > T1, in terms of straw yield. The T10 treatment produced 95% yield increase over control.
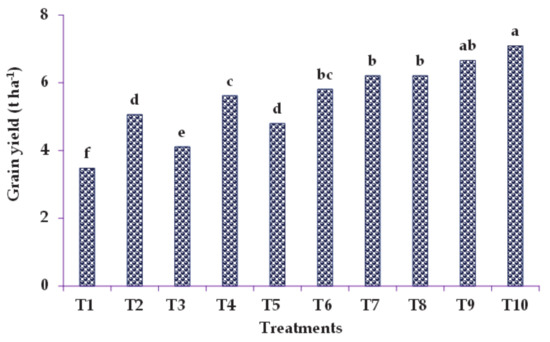
Figure 1.
Effects of different treatments on the grain yield of rice; treatment details are mentioned in Table 3. The bars having same letters are not significantly different at 5% level by Duncan’s multiple range test (DMRT).
Table 4.
Effects of different compost and fertilizer treatments on the growth and yield contributing characters of rice (cv. BRRI dhan 28).
3.2. Growth and Yield Parameters
The growth and yield contributing characters such as plant height ranged from 72.7–100.7 cm, tillers hill−1 from 11.3–17.7, panicle length 19.1–24.1 cm, grains panicle−1 59.0–84.2 and 1000-grain weight from 21.5–26.3 g over the treatments (Table 4). For all parameters except 1000-grain weight, the T10 treatment which contained 50% dose of chemical fertilizers and compost type 4 (50% MSW + 20% MOC + 30% SPM) demonstrated the highest performances. The T8 treatment where 30% poultry manure was used instead of 30% SPM showed the maximum 1000-grain weight; however, that was statistically identical with that of T10 treatment.
3.3. Nutrient Concentrations of Rice Grain and Straw
The N, P, K and S concentrations of rice grains were significantly influenced by the different treatments (Table 5). The N concentration of grain varied from 1.08%–1.35% (6.75%–8.44% protein, calculated as %N × 6.25) across the treatments. The T10 treatment showed the highest grain N concentration, which was statistically similar to that observed with all treatments except T1 (control) and T2 (only fertilizers), the latter two were identical. The P, K and S concentrations of rice grain depending on the treatments significantly ranged from 0.195–0.366%, 0.129–0.243% and 0.110–0.127%, respectively. For grain P concentration T4 treatment and for K and S concentrations, the T10 treatment gave the highest results. The T1 treatment i.e., control treatment always showed the lowest grain N, P, K and S concentrations.
Table 5.
Effects of compost and fertilizer treatments on N, P, K and S concentrations of rice grain and straw.
As seen in Table 5, the rice straw N, P, K and S concentrations significantly varied from 0.280%–0.933%, 0.050%–0.098%, 0.672%–2.239% and 0.021%–0.077%, respectively. The T9 (50% CF + T5) treatment recorded the highest value (0.933%) which was alike with T4 (compost −2) and T10 (50% CF + T6) treatments. Similar P concentrations were observed with T4 (0.098%), T6 (0.080%), T8 (0.079%), T4 (0.067%) and T10 (0.082%) treatments. For straw K, the highest result was noted with T9 treatment (50% CF + T5), although they were not significantly different from T8 (50% CF + T4) and T10 (50% CF + T6) treatments. The T5–T10 treatments (except T7) performed equally in respect of straw S concentrations, although T10 showed the highest straw S concentration. The lowest result was noted for control treatment (T1).
3.4. Nutrient Level of Post-Harvest Soil
The soils from every plot after the harvest of rice were analysed for N, P, K and S contents. Total N content in soil was the highest (0.195%) in T10 treated plot which was statistically similar to the T2, T6 T8 and T9 treatments with the values of 0.178%, 0.190%, 0.169% and 0.174%, respectively (Table 6). Except in control plot, the total N content of soil had increased after compost-fertilizer treatments, in comparison with initial soil N value (0.12%). The P availability in soil had increased in all treated soils including control plot (Table 6). The IPNS treatments i.e., T7–T10 were statistically identical. The T4 and T6 treatments showed lower and similar effects on soil P content. Application of manure and fertilizers added alone or in combination increased the available K content of soils (Table 6), the values being 3.13–12.86 mg kg−1. The highest K availability was noted with the press mud-based compost (T10) and it was similar to other IPNS treatments, except T9. The 2nd category of higher K availability was demonstrated by T5, T6 and T9 treatments having the values of 8.41, 9.78 and 9.78 mg kg−1, respectively. All the treatments showed higher S availability over control and all differences were significant. Again, the highest S availability (10.1 mg kg−1) was noted for T10 treatment and it was significantly superior to all other treatments. Statistically similar values of available S were due to the treatments T4, T5, T8 and T9 with the values of 7.59, 6.85, 6.79 and 6.67 mg kg−1, respectively (Table 6). The lowest value of 0.114% was found in the treatment T1 (control) which was statistically inferior to the rest nine treatments. The soils of control plots (T1) had the lowest values showing 0.114% N, 6.12 mg kg−1 P, 3.13 mg kg−1 K and 4.81 mg kg−1 S against the initial levels of 0.12%, 4.08 mg kg−1, 3.47 mg kg−1 and 7.10 mg kg−1, respectively. The soil of the experimental field had 2.79% organic matter and 0.17% N.
Table 6.
Nutrient status of soils after crop harvest.
3.5. Nutrient Balance
An apparent N balance is calculated as the difference between nutrient addition (input) to soil and nutrient removal (output) from soil. In estimating N balance along with manure and fertilizer, the other sources of N input viz irrigation water and BNF and the plant uptake (main produce and by-product) and physical losses as sources of N output are considered. In this calculation, a 60% N loss (through leaching, denitrification and volatilization) was taken into account [24]. In performing P and K balance calculation, apart from manure and fertilizer the irrigation water as an input source is only applicable, and apart crop uptake, no other source was considered.
The apparent N balance was found negative for all treatments indicating that the removal of N from soil was higher than the addition of N to soil. The values for N balance over the treatments were −45 to −11 kg ha−1 (Figure 2). The nutrient balance (NB) values were comparatively higher in T9 and T10 treatments. The balance for P was positive in all the treatments except T1 treatment (control). The P balance for all the treatments except T1 varied from 8 to 71 kg ha−1, the highest value being observed with T8 which was poultry manure based combined treatment (Figure 2). Regarding K balance, the balance was negative for seven treatments and the values of K mining from soil ranged from 6 to 48 kg ha−1. The highest K mining was noted for T9 and the lowest for T8 (Figure 2). The control treatment (T1) showed K mining of 22 kg ha−1. Like P balance, the values for S balance were positive in all the treatments except T1 (control) and the values varied from 4 to 46 kg ha−1 (Figure 2). The T8 treatment demonstrated the highest value which was very close to the value (42 kg ha−1) showed by T4 treatment. The positive balance for P and S indicates that a considerable amount of P and S may accumulate in the manure and fertilized plots.
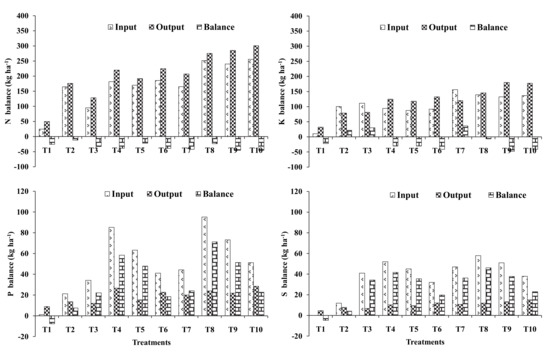
Figure 2.
Apparent N, P, K and S balance in soil (contribution of irrigation water—4.6 kg N ha−1, 1.2 kg P ha−1 and 10.6 kg K ha−1; biological N2 fixation—20 kg N ha−1); treatment details are mentioned in the above tables.
4. Discussion
4.1. Effects of Amended Composts on Rice Yield
The combined fertilizer-manure treatments (T7–T10) produced markedly higher grain yield with the values of 6.21, 6.21, 6.66 and 7.09 t ha−1 respectively, showing 22–40% yield benefits over exclusive fertilizers (T2) and 51–73% benefits over exclusive compost (T3) use. Higher rice yield and quality due to the integrated use of chemical and organic fertilizers were also reported [25]. In the present study, the yield benefits due to compost with and without fertilizers were 10.9–71.7% over exclusive fertilizer application.
The press mud-based fertilizer-compost treatment (T10) performed the highest yield (7.09 t ha−1) which could be due its higher nitrogen content (3.52% N, 140 kg N ha−1 addition, Table 2) and also could be higher capacity of this compost to increase the availability of native soil nutrients through higher biological activity [26]. As stated by Eghball et al. [27], manure having higher total N content had more N readily available for plants.
4.2. Relationship of Grain Yield With Yield Components
The yield of a crop is a complex character which is influenced by several component crop characters. Thus, the increase in grain yield can be attributed to the increase in yield attributes as evidenced by a good correlation of grain yield with tillers hill −1 (r = 0.917; p < 0.001), grains panicle−1 (r = 0.922; p < 0.001) and 1000-grain weight (r = 0.501; p < 0.05). The increase in tiller number due to enough nutrition can be explained in terms of a possible increase in nutrient absorption capacity of the plant as a result of better root development and increased translocation of carbohydrates from source to growing points [28].
Muhammad et al. [29] observed that the application of organic manure and compost increased plant height, tillers hill−1, grain yield and 1000-grain weight of rice. The grain yield was strongly associated with straw yield (r = 0.996, p < 0.001). This result agrees well with Mamun et al. [30] who reported linear and positive relationship of rice grain yield with biomass production at maturity.
4.3. Effects of Amended Composts on Grain Nutrient Concentrations
The grain N concentration varied from 1.08–1.35%, the grain P from 0.195–0.366%, the grain K from 0.129–0.243% and the grain S from 0.110–0.127% across the treatments. The grain N concentrations due to compost with or without fertilizer treatments i.e., T3–T10 were all higher than that of T2 (100% fertilizer) and T1 (control) treatments, and they themselves were statistically identical. For grain P concentration, the T4 treatment and for K and S concentrations, the T10 treatment gave the highest results. The T1 treatment i.e., control treatment had the lowest grain N, P, K and S concentrations.
There exists a significant positive correlation between grain N with other nutrients, strongly with K (r = 0.893, p < 0.01) and moderately with P (r = 762, p < 0.05) and S (r = 0.665, p < 0.05). Plants maintain a fairly constant nutrient ratio in its body. In the present study we found a N:P ratio of 4.31–5.70 (mean 4.93), N:K ratio of 5.43–6.39 (mean 6.24) and N:S ratio of 9.8–11.7 (mean 10.9) in rice grain.
4.4. Effects of Amended Compost on Changes in Soil Properties
The results indicate that the N, K and S contents of soils in control plots (no fertilizer or compost added) decreased after rice cropping while the soil P content had little increased. The T10 treatment (50% fertilizer + press mud-based compost) showed the best positive effect on soil nutrients. This can be related to higher N content (3.52% N) of press mud-based compost. Thus, it is likely that the residual effects of organic amendment would have a positive contribution to the next crop(s). Malik and Chauhan [31] stated that integrated treatment (organic and inorganic) gave the higher values for soil N, P and K contents whereas the inorganic treatment gave significantly lower values for those nutrients. At the present research location (BAU farm), Bilkis [32] and Haque [33] also observed increased OM, N, P and S contents of soil after two crop cycles due to integrated use of manure and fertilizers. Rekaby et al. [11] reported a higher availability of nutrients in Egypt soils after organic amendment (biochar, humic acid and compost).
4.5. Effects of Amended Composts on Nutrient Balance
The apparent N balance (nutrient addition minus nutrient removal) was found negative for all treatments indicating that the removal of N from the soil was higher than the addition of N to soil. The nutrient balance (NB) values varied from −45 to −11 kg ha−1, the values being higher in T9 and T10 treatments which are cow dung and press mud-based combined treatments, respectively. Timsina et al. [34] reported a negative N balance of between −37 to –62 kg ha−1 for N-containing treatments, and between −64 to –55 kg ha−1 for the control treatments in the rice-wheat system. The balance for P and S was positive for all treatments except T1 treatment (control), the values being 8 to 71 kg ha−1 for P and 4 to 46 kg ha−1 for S. The positive P balance was also reported by Saleque et al. [35] showing 9–49 kg ha−1 in fertilized plots and 13–50 kg ha−1 in control plots. Unlike others, the K balance was negative for 7 out of 10 treatments, the values of K mining ranged 6 to 48 kg ha−1, the highest K mining noted for T6 (singly press mud-based treatment) and the lowest for T10 (fertilizer + press mud-based compost treatment). It is noted that the K removal by crop took place mainly through rice straw since straw K concentration was six to eight times higher the grain K concentration. Thus, rice straw retention is encouraging to restore K status of soil and reduce K fertilizer dose for the next crop. As reported by Panaullah et al. [36], there was a large negative apparent K balance in both fertilized and unfertilized plots with a range of −25 to −212 kg ha−1 over the sites. Such results indicate a considerable P and S accumulation in manure and fertilized plots, but for N and K there is a marked nutrient mining in soils. Applying fertilizer alone may result in N loss and low N recovery [37] and increases the risk of environmental pollution by eutrophication [38].
To achieve sustainability, the quantity of nutrient inputs and outputs should be equal. Nutrient mining may eventually cause soil fertility degradation and affect crop production. On the other hand, excess nutrient accumulation may lead to soil and water pollution. Although the nutrient balance value tells us a little about available nutrient status of a soil, it has important implications when considering the future long-term total status of a nutrient in soils. To minimize nutrient depletion, it is not justified to just increase the use of inorganic fertilizers, instead it is important to increase the use of organic sources of plant nutrients such as cow dung, poultry manure and compost.
5. Conclusions
Mixing of 20% mustard oilcake and 30% sugarcane press mud or poultry manure or cow dung with 50% MSW compost had markedly improved the nutrient value of MSW compost. The use of amended compost resulted in better yield with higher nutrient (N, P, K and S) concentration of rice grain. The integrated use of 50% chemical fertilizers and 50% compost mixture (50% MSW + 20% MOC + 30% SPM at a rate of total 10 t ha−1) produced the best result. The apparent nutrient balance for N and K was negative and that for P and S was positive across the treatments. This study has promising implications for fertilizer management and recommendation strategies for different crops and soils.
Author Contributions
Conceptualization and experimental design, M.J., M.R.I., M.M.R.; research and data collection, M.S.; data analyses, M.S., M.J., M.A.A.; writing—original draft preparation, M.J.; writing—review and editing: M.R.I., M.M.R., M.A.A., Z.M.S.; supervision, M.J.; funding, M.J., M.M.R. All authors have read and agreed to publish the final version of the manuscript.
Funding
This research was supported by the World Bank (WB) funded Higher Education Quality Enhancement Project (HEQEP) implemented by the University Grants Commission (UGC), Bangladesh.
Data Availability Statement
Not applicable
Conflicts of Interest
The authors declare no conflict of interest.
References
- Clayton, S. 50 Years of Rice Science for a Better World—and It’s Just the Start! Rice Today; International Rice Research Institute (IRRI): Los Baños, Philippines, 2016. [Google Scholar]
- Eissa, M.A. Phosphate and organic amendments for safe production of okra from metal-contaminated soils. Agron. J. 2016, 108, 540–547. [Google Scholar] [CrossRef]
- Torkashvand, A.M. Improvement of compost quality by addition of some amendments. Aust. J. Crop. Sci. 2010, 4, 252–257. [Google Scholar]
- Achiba, W.B.; Gabteni, N.; Lakhdar, A.; Laing, G.D.; Verloo, M.; Jedidi, N.; Gallali, T. Effects of 5-year application of municipal solid waste compost on the distribution and mobility of heavy metals in a Tunisian calcareous soil. Agric. Ecosyst. Environ. 2009, 130, 156–163. [Google Scholar] [CrossRef]
- Jahiruddin, M.; Rahman, M.A.; Haque, M.A.; Rahman, M.M.; Islam, M.R. Integrated nutrient management for sustainable crop production in Bangladesh. Acta Hortic. 2012, 958, 85–90. [Google Scholar] [CrossRef]
- Kanton, R.A.L.; Prasad, P.V.V.; Mohammed, A.M.; Bidzakin, J.K.; Ansoba, E.Y.; Asungre, P.A.; Lamini, S.; Mahama, G.; Kusi, F.; Sugri, I. Organic and inorganic fertilizer effects on the growth and yield of maize in a dry agro-ecology in northern Ghana. J. Crop. Improv. 2016, 30, 1–16. [Google Scholar] [CrossRef]
- Youssef, M.A.; Eissa, M.A. Comparison between organic and inorganic nutrition for tomato. J. Plant. Nutr. 2017, 40, 1900–1907. [Google Scholar] [CrossRef]
- Aktar, S.; Islam, M.S.; Hossain, M.S.; Akter, S.; Maula, S.S.; Hossain, S.S.F. Effects of municipal solid waste compost and fertilizers on the biomass production and yield of BRRI dhan 50. Progress. Agric. 2018, 29, 82–90. [Google Scholar] [CrossRef]
- Moe, K.; Mohi, S.M.; Htwei, A.Z.; Kajihara, Y.; Yamakawa, T. Effects of integrated organic and inorganic fertilizers on yield and growth parameters of rice varieties. Rice Sci. 2019, 26, 309–318. [Google Scholar] [CrossRef]
- Liu, M.; Hu, F.; Chen, X.; Huang, Q.; Jiao, J.; Zhang, B.; Li, H. Organic amendments with reduced chemical fertilizer promote soil microbial development and nutrient availability in a subtropical paddy field: The influence of quantity, type and application time of organic amendments. Appl. Soil Ecol. 2009, 42, 166–175. [Google Scholar] [CrossRef]
- Rekaby, S.A.; Mahrous, Y.M.A.; Hegab, S.A.; Eissa, M.A. Effect of some organic amendments on barley plants under saline condition. J. Plant. Nutr. 2020, 43, 12. [Google Scholar] [CrossRef]
- Chen, X.; Yaa, O.; Wu, J. Effects of different organic materials application on soil physicochemical properties in a primary saline-alkali soil. Eurasian Soil Sci. 2020, 53, 798–808. [Google Scholar] [CrossRef]
- Oluwa, O.E.A.; AdeOluwa, O.O.; Aduramigba-Modupe, V.O. Nutrient release dynamics of an accelerated compost: A case study in an Alfisol and Ultisol. Eurasian J. Soil Sci. 2017, 6, 350–356. [Google Scholar]
- FAO/UNDP. Land Resources Appraisal of Bangladesh for Agricultural Development; FAO: Rome, Italy, 1988; Volume 2, pp. 1–570. [Google Scholar]
- Nelson, D.W.; Sommer, L.E. Total carbon, organic carbon and organic matter. In Methods of Soil Analysis; Page, A.L., Miller, R.H., Keeney, D.R., Eds.; Part 2; ASA and SSSA: Madison, WI, USA, 1982; pp. 539–579. [Google Scholar]
- Bremner, J.M.; Mulvaney, C.S. Nitrogen-total. In Methods of Soil Analysis; Page, A.L., Miller, R.H., Keeney, D.R., Eds.; Part 2; ASA and SSSA: Madison, WI, USA, 1982; pp. 595–624. [Google Scholar]
- Olsen, S.R.; Sommer, L.E. Phosphorus. In Methods of Soil Analysis; Page, A.L., Miller, R.H., Keeney, D.R., Eds.; Part 2; ASA and SSSA: Madison, WI, USA, 1982; pp. 403–430. [Google Scholar]
- Knudsen, D.; Peterson, G.A.; Pratt, P.F. Lithium, sodium and potassium. In Methods of Soil Analysis; Page, A.L., Miller, R.H., Keeney, D.R., Eds.; Part 2; ASA and SSSA: Madison, WI, USA, 1982; pp. 225–245. [Google Scholar]
- Fox, R.L.; Olson, R.A.; Rhoades, H.F. Evaluating the sulfur status of soils by plants and soil tests. Soil Sci. Soc. Am. Proc. 1964, 28, 243–246. [Google Scholar] [CrossRef]
- Lindsay, W.L.; Norvell, W.A. Development of a DTPA soil test for Zn, Fe, Mn and Cu. Soil Sci. Soc. Am. J. 1978, 42, 421–428. [Google Scholar] [CrossRef]
- Bingham, F.T. Boron. In Methods of Soil Analysis; Page, A.L., Miller, R.H., Keeney, D.R., Eds.; Part 2; ASA and SSSA: Madison, WI, USA, 1982; pp. 431–448. [Google Scholar]
- Page, A.L.; Miller, R.H.; Keeney, D.R. Chemical and Microbiological Properties. In Methods of Soil Analysis; Part 2; Agronomy Series No 9; ASA and SSSA: Madison, WI, USA, 1982. [Google Scholar]
- Gomez, K.A.; Gomez, A.A. Statistical Procedures for Agricultural Research; John Wiley and Son: New York, NY, USA, 1984. [Google Scholar]
- Saleque, M.A.; Abedin, M.J.; Bhuiyan, N.I.; Zaman, S.K.; Panaullah, G.M. Long-term effects of inorganic and organic fertilizer sources on yield and nutrient accumulation of lowland rice. Field Crops Res. 2004, 86, 3–65. [Google Scholar] [CrossRef]
- Masarirambi, M.T.; Mandisodza, F.C.; Ashingaidze, A.B.; Bhebhe, E. Influence of plant population and seed tuber size on growth and yield components of potato (Solanum tuberosum). Int. J. Agr. Biol. 2012, 14, 545–549. [Google Scholar]
- Pengthamkeerati, P.; Motavalli, P.P.; Kremer, R.J. Soil microbial activity and functional diversity changed by compaction, poultry litter and cropping in a claypan soil. Appl. Soil Ecol. 2011, 48, 71–80. [Google Scholar] [CrossRef]
- Eghball, B.; Wienhold, B.J.; Gilley, J.E.; Eigenberg, R.A. Mineralization of manure nutrients. J. Soil Water Conserv. 2002, 57, 470–473. [Google Scholar]
- Singh, R.; Agarwal, S.K. Analysis of growth and productivity of wheat in relation to levels of FYM and nitrogen. Indian J. Plant Physiol. 2001, 6, 279–283. [Google Scholar]
- Muhammad, I.; Hassan, A.U.; Muhammad, I.; Ehsan, E.V. Response of wheat growth and yield to various levels of compost and organic manure. Pak. J. Bot. 2008, 40, 2135–2141. [Google Scholar]
- Mamun, M.A.A.; Haque, M.M.; Saleque, M.A.; Khaliq, Q.A.; Karim, A.J.M.S.; Karim, M.A. Evaluation of different fertilizer management guidelines for boro rice cultivation in south central coastal region of Bangladesh. Ann. Agrar. Sci. 2018, 16, 466–475. [Google Scholar] [CrossRef]
- Malik, S.S.; Chauhan, R.C. Impact of organic farming on soil chemical properties. J. Int. Acad. Res. Multidiscip. 2014, 2, 349–360. [Google Scholar]
- Bilkis, S. Mineralization of Different Types of Manure and Their Field Performances in the Potato-Mungbean-Rice and Rice-Fallow-Rice Cropping Patterns. Ph.D. Thesis, Department of Soil Science, Bangladesh Agricultural University, Mymensingh, Bangladesh, 2015. [Google Scholar]
- Haque, M.A. Mineralization of Bioslurry and Its Integrated Use with Fertilizers in the Rice Based Cropping Systems. Ph.D. Thesis, Department of Soil Science, Bangladesh Agricultural University, Mymensingh, Bangladesh, 2014. [Google Scholar]
- Timsina, J.; Panaullah, G.M.; Saleque, M.A.; Ishaque, M.; Pathan, A.B.M.B.U.; Connor, D.J.; Saha, P.K.; Quayyum, M.A.; Humphreys, H.; Meisner, C.A. Nutrient uptake and apparent balances for rice-wheat sequences. I. Nitrogen. J. Plant Nutr. 2006, 29, 137–155. [Google Scholar] [CrossRef]
- Saleque, M.A.; Timsina, J.; Panaullah, G.M.; Ishaque, M.; Pathan, A.B.M.B.U.; Connor, D.J.; Saha, P.K.; Quayyum, M.A.; Humphreys, H.; Meisner, C.A. Nutrient uptake and apparent balances for rice-wheat sequences. II. Phosphorus J. Plant. Nutr. 2006, 29, 157–172. [Google Scholar] [CrossRef]
- Panaullah, G.M.; Timsina, J.; Saleque, M.A.; Ishaque, M.; Pathan, A.B.M.B.U.; Connor, D.J.; Saha, P.K.; Quayyum, M.A.; Humphreys, H.; Meisner, C.A. Nutrient uptake and apparent balances for rice-wheat sequences. III. Potassium. J. Plant. Nutr. 2006, 29, 173–187. [Google Scholar] [CrossRef]
- Liu, X.U.; Wang, H.Y.; Zhou, J.M.; Hu, F.Q.; Zhu, D.J.; Chen, Z.M.; Liu, Y.Z. Effect of N fertilization pattern on rice yield, N use efficiency and fertilizer-N fate in the Yangtze River basin, China. PLoS ONE 2016, 11, e0166002. [Google Scholar] [CrossRef]
- Akoumianakis, K.A.; Karapanos, I.C.; Giakoumaki, M.; Alexopoulos, A.A.; Passam, H.C. Nitrogen, season and cultivar affect radish growth, yield, sponginess and hollowness. Int. J. Plant. Prod. 2011, 5, 111–120. [Google Scholar]


Publisher’s Note: MDPI stays neutral with regard to jurisdictional claims in published maps and institutional affiliations. |
© 2021 by the authors. Licensee MDPI, Basel, Switzerland. This article is an open access article distributed under the terms and conditions of the Creative Commons Attribution (CC BY) license (http://creativecommons.org/licenses/by/4.0/).