Abstract
High-energy internal failures of transformers are catastrophic events which are hardly predictable. For this reason, a full-scale controlled experiment represents a valuable learning opportunity to gather accurate information about sequence of events during the very short time in which the failure occurs. Controlled parameters include tank design, material properties, experimental load and measurements. In this paper, we present a detailed investigation using nonlinear finite-element analysis of a 210-MVA transformer high-pressure experiment. We begin by evaluating the relationship between internal arcing pressure rise and tank expansion characteristics. Since this relationship is not linear due to geometric and material nonlinearities, an iterative process is proposed to ensure result accuracy. Stress–strain material properties are retrieved by tension experiments of specimens extracted from the tested tank to enable accurate comparison of numerical and experimental results. It is shown in this paper that nonlinear material parameters have a small influence on the tank pressure rise, but a significant one on large strain prediction and therefore the true stress-strain curve is recommended. In addition, the ductile rupture criterion based on the ultimate plastic strain of the material correlates with the experimental and explicit dynamic analysis results. This can ensure a certain design margin for tank rupture prevention.
1. Introduction
Despite numerous advances in electrical protection to reduce internal arc duration, transformers are still vulnerable to potential major failures, which can require significant repairs or even recycling of the transformer. The frequency of such failures is estimated at around 1% per service year [1], but the consequences can be catastrophic for personal safety and failures can also have environmental threat, such as soil and water contamination and toxic smoke produced by fire.
According to a Hydro-Québec survey of 74 major failures in their 735 kV network, the main cause of oil spills is tank rupture, which represents 68% of cases. Bushing failures cause 24% of spills and the remaining 8% are due to failure of other components (valves, radiators, pressure vents or gaskets) [2]. Bushing failures can be reduced significantly by using an oil-free bushing with a polymer insulator on the airside such as a Resin-Impregnated Synthetic (RIS) bushing, which has been shown to be more resilient than traditional Oil Impregnated Paper (OIP) made of brittle materials (e.g., porcelain) [1]. Polymer bushing technology is relatively new and therefore static failure events are rare, but an arcing test on a 100 kVA station service voltage transformer has shown its ability to withstand a fault current of 40 kA for 300 milliseconds [3].
In respect of tank rupture, the principal cause of major oil spills, two investigations in the mid-20th century recommended increasing tank flexibility for further design improvement [4,5]. In 2011, Hitachi ABB Power Grids and Hydro-Québec launched an extensive numerical and experimental program to evaluate transformer tank resistance. One major outcome of the program was test validation of a full-scale 330 kV, 210-MVA transformer tank, which withstood the pressure effects of a 20 MJ, three-cycle low-impedance fault [6]. This paper presents a detailed nonlinear finite-element analysis based on experimental measurements recorded during this test. Tension tests are also performed with specimens produced from the walls and weld of the experimental tank and extracted during the manufacturing process. The proposed numerical approach aims to provide a design tool to help prevent major oil spills and extensive fires in cases of internal arcing.
2. Tank Pressure Rise
A tank strength and flexibility analysis needs to input accurate mechanical loads generated by the internal arc, during which most of the energy is transformed into heat. The physics of an arc in oil have been studied widely and researchers have generally agreed that a temperature around 2000 K surrounds the electrical arc [1]. A large-scale investigation comparing destructive experiments and numerical simulations on distribution transformers concluded that arcs vaporize the surrounding oil to create a gas bubble volume of 85 cm3/kJ at a standard temperature and pressure [7,8]. This high-pressure and high-temperature gas expansion generates the mechanical energy pushing on the tank walls and represents 24% of the total electrical energy. The internal tank pressure PD for a given fault energy level E can be estimated by the simplified Equation (1) [9,10].
- PD
- Tank design pressure (kPa);
- E
- Fault energy level (kJ);
- k
- Arc energy conversion factor (5.8 × 10⁻⁴ m3/kJ) (@ 2000 K);
- C
- Tank expansion coefficient (m3/kPa);
- F
- Dynamic amplification factor;
- PH
- Hydrostatic pressure (kPa).
The formula above has been used to design a full-scale 210-MVA power transformer [6] and gives higher values than the measured pressures, thus providing a conservative applied load for finite-element analyses. The success of the finite-element approach depends on the following:
- Nonlinear material properties.
- Ability to increase tank volume as a function of pressure.
- Ability to obtain a tank expansion coefficient by an iterative process.
2.1. Nonlinear Material Properties
The finite-element analysis includes nonlinear or plastic deformation model fitted on a uniaxial tension testing of the material obtained. Figure 1 shows typical engineering and true stress–strain curves, each of which is divided into five regions. The engineering curve is based on the original section of the sample, while the true curve considers the true section which is smaller in the large strain region. Using the true stress–strain curve gives more accurate results when dealing with large strain problems such as transformer tank rupture due to internal arcing.
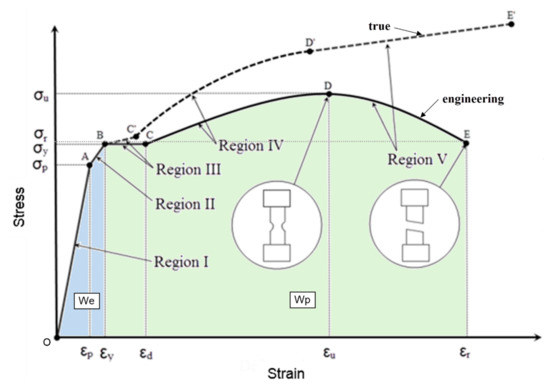
Figure 1.
Comparison between engineering and true uniaxial stress–strain curves. The stress-stain steps are identified as follows; plastic work initiate (σp, εp), yield (σy, εy), ultimate stress (σu, εu) and rupture (σr, εr). The blue area represents the dissipation of elastic work We and green plastic work Wp.
Region I of the curve corresponds to the linear elastic range where the Young’s modulus gives a linear relationship between stress and strain. Region II is the nonlinear portion of the elastic domain to the elastic limit, which corresponds to 0.2% of strain. Some steels have a plateau at yield that is also known as a Piobert–Lüders plateau [11], and this is represented by region III. These values are converted from engineering (σeng, εeng) to true (σtrue, εtrue) value by Equation (2) for the regions II to IV.
Region V is characterized by drastic thinning or necking of the sample cross-section. The distribution of stresses and strains in this region is more complex due to the growth of micro-voids and micro-cracks in the material. The weighted-average method is used with Equation (3) where w is the unknown weighting constant [12]. The constants w and n can be established in an iterative manner by numerical simulation of the experimental tension test.
The mathematical relationships between the stress and strain increments in the plastic regions III to V are governed by a yield criterion for defining the initial yield surface, a flow rule for the stress strain relationship in the plastic range and a hardening rule for defining how the yield surface changes during plastic straining [13].
We use the three most common theories of plasticity: (1) the von Mises yield criterion, (2) the flow rule relating the vector of the plastic strain increment to the outward and normal directions to the yield surface and (3) the isotropic hardening that assumes that the yield surface changes its size without translation, as illustrated in Figure 2 (left). Figure 2 also illustrates the kinematic hardening theory, which assumes that the yield surface translates without changing size and introduces more parameters, including the stress coordinates of the translated yield surface. The latter theory is the most appropriate for describing the Bauschinger effect when dealing with reverse loading [14]. Without reverse loading, both the isotropic and kinematic hardening theories give practically the same results, as shown in Table 1.
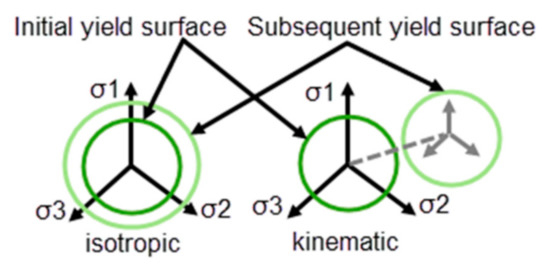
Figure 2.
Graphic representation of the isotropic and kinematic hardening rules.

Table 1.
Tank displacement and volume increase for finite-element analysis and test.
During the manufacturing process of the tested tank [6], specimens were extracted from a wall and sent for laboratory tension tests. The engineering stress–strain curve was plotted from these test results and is labeled “Tension test” in Figure 3.
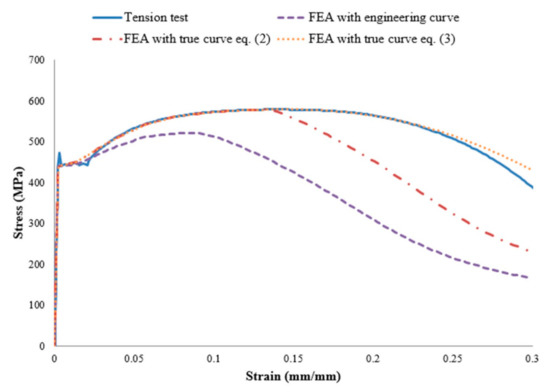
Figure 3.
Engineering stress–strain curves from tank wall material tension test and Finite-Element Analysis (FEA).
A simple way to validate the nonlinear finite-element analysis was to replicate the laboratory tension test. The model of the specimen was meshed by 3D solid elements, an imposed vertical displacement load was applied and the boundary condition of tree symmetry planes. The simulation was repeated three times by applying different material properties as follows.
- Engineering curve: tension test engineering stress–strain curve for regions I to IV.
- True curve (Equation (2)): tension test true stress–strain curve calculated using Equation (2) up to region IV.
- True curve (Equation (3)): tension test true stress–strain curve calculated using Equation (2) for region IV and Equation (3) for region V.
The force and displacement values were then retrieved from the simulation results to calculate the engineering stress–strain curve in the same manner as for the laboratory tension test. The comparison in Figure 3 confirms that finite-element analysis using an engineering stress–strain curve as a material property did not reproduce the plastic deformation of the laboratory tension test. In addition, the simulation with the true curve calculated using Equation (3) gave the best results up until failure of the specimen.
The tension test was performed using the Dynamic Mechanics of Materials Laboratory at Ohio State University with a three-dimensional commercial digital image correlation camera (VIC-3D). This technology provided strain color contours such as those shown in Figure 4 an instant before rupture of the specimen. Comparison with the three finite-element analyses described above confirmed that the true curve calculated with Equation (3) was closer to the experimental result.
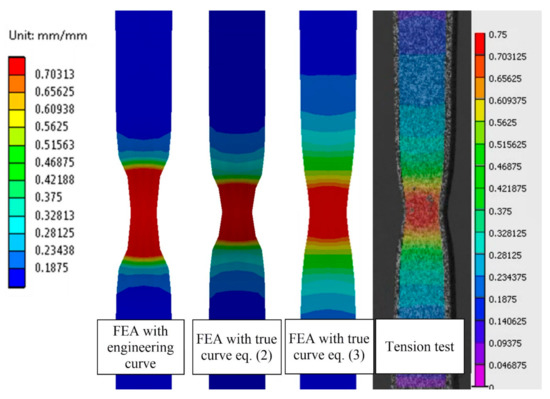
Figure 4.
Tension specimen strain results from finite-element analysis and test.
2.2. Tank Volume Increase in Function of the Pressure
The experimental full-scale 330-kV, 210-MVA transformer tank [6] measured a maximum average tank pressure rise of 430 kPa and pressure was relieved through a spring-activated valve. The tested tank inner dimensions are 4.9 m length × 2.4 m width × 4.2 m height. A maximum tank wall displacement of 108 mm and volume creation of 2.2 m3 were calculated from the 3D scan measurements performed before and after the test. The results of the nonlinear finite-element analyses performed on the transformer tank are shown in Table 1.
Transformer tank walls are made of welded steel plates of 10 mm thick that are submitted to a bending load during an internal fault. For this reason, the finite-element model was meshed using solid-shell element types because these accounted for out-of-plane stress stiffening changes due to structural in-plane stress by using five or more integration points throughout the thickness of the element.
In this study it was important to consider activation of the large deflection effect, because the out-of-plane displacements of the structure exceeded 10% of its thickness. When the large deflection effect is activated, the software updates the stiffness of the structure when large displacements occur the geometric shape changes. A tank simulation performed without the large deflection effect activated did not converge and showed unrealistic tank displacement over 3 m for an internal pressure of 413 kPa.
The finite-element analysis was performed in three load steps. The first step involved the application of an average hydrostatic pressure of 21 kPa to the tank walls, which was calculated using standard gravitational acceleration of 9.81 m/s2 and water density of 997 kg/m3. In the second step, a uniform static pressure was applied inside the tank up to 430 kPa. The third step was complete relief of the pressure load in order to reflect the experimental conditions and the spring back of the tank.
A previous study [15] has shown the importance of material properties, which were investigated in this study through a series of simulations and are summarized in Table 1. As expected, a linear material could not predict the test results because the tank returned to its initial shape after pressure relief. In addition, the maximum wall displacement when the tank was still under pressure of 430 kPa was 100 mm, while the result from the true stress–strain curve calculated using Equation (3) was 156 mm, which is a significant difference. The finite-element analyses that used nonlinear material properties correlated well with the test results.
The finite-element analysis results in Figure 5 with true stress–strain curves calculated using Equation (3) show a tank maximum displacement of 156 mm and volume creation of 3.32 m3 under a pressure of 430 kPa. After pressure relief, values reduced to 110 mm and 2.11 m3. This case highlights the importance of plastic deformation, which represents 64% of the tank volume increase.
Figure 5.
(a) Tank displacement at 430 kPa; (b) tank displacement after pressure relief.
2.3. Calculation of the Tank Expansion Coefficient
Transformer pressure rises during internal arcing in oil depend on the amount of electrical energy and on tank expansion characteristics. The importance of tank flexibility was first observed during experiments on oil-filled rectangular transformer tanks [16], and has since been confirmed by ABB–Hydro-Québec investigations to mitigate the risk of tank rupture [4] and an Electric Power Research Institute report [5]. The role of the tank expansion coefficient is well known in the power industry and Equation (1) is mentioned in CIGRÉ [1] and IEEE [17] documents. However, the correct use of this coefficient is not well described, and some might consider it a constant value, which is not the case for material plastic deformation as it will be shown in this section. As explained in [18], a tank expansion coefficient is the result of an iterative process.
The tank expansion coefficient C of Equation (1) was calculated from the nonlinear finite-element analysis results presented in the previous section. It should be noted that the tank expansion coefficient is related to arcing energy only and does not include the initial tank volume deformation VH due to hydrostatic pressure PH. PH is added to the arcing pressure in Equation (1) to give the design pressure PD. For this reason, the tank expansion coefficient C (m3/kPa) reflects the increase in volume Vi and pressure Pi at any instant of the simulation due to the arcing load calculated using Equation (4).
In order to evaluate the tank pressure PD that provides arc energy, the iterative process shown in Figure 6 is used. First, fault energy level E and arbitrary initial tank pressure PDi values are set. Next, the tank expansion coefficient C and tank design pressure PDc are calculated from Equations (1) and (4). If PDc is equal to PDi, then the value of the arcing energy is found. If PDc is not equal to PDi, the initial tank pressure is increased or decreased to start a new iteration.
Figure 6.
Iterative calculation process for tank design pressure for a fault energy level.
3. Tank Rupture
Traditional mechanical structural engineering does not allow a material to exceed its yield limit. However, most internal high-energy arcing in transformers creates plastic tank deformation. Conversely, plastic tank deformation can be used to absorb and contain energy generated by arcing. Under loading, ductile materials such as mild steel dissipate most of their energy through plastic work Wp rather than elastic work We, as illustrated by the areas under the curve in Figure 1. Therefore, a transformer design that can absorb arc energy by plastic tank deformation while still providing enough strength could become a designated safety approach. For this reason, tank rupture calculation is particularly important. The ABB–Hydro-Québec research program included development of a strain-based failure criterion for transformers, validated by experiments on a pressurized large steel plate [19] and on a full-size 210-MVA transformer tank [6]. In this section, the ductile failure criterion from that program is compared with other approaches found in the literature.
The ductile failure criteria studied here needed to be defined by experimental data. This was done by using uniaxial tension test results for an all-welded electrode specimen produced during the manufacture of a tank cover welding [6]. Numerical simulations were then performed to replicate the specimen tension test. The force and displacement results were extracted to plot the engineering stress–strain curve in the same manner as for the experimental data, and the comparison is shown in Figure 7. The ductile failure criteria were mesh-dependent and therefore the criteria were not valid if the element type or size changed. This step was performed for each of the ductile failure criteria presented below.
Figure 7.
Engineering stress–strain curves from all-welded electrode material tension test and numerical simulations using the following ductile failure criteria; Equivalent Plastic Strain (EPS), Johnson–Cook (J–C), Gurson–Tvergaard–Needleman (GTN) and Ultimate Plastic Strain (UPS).
3.1. Equivalent Plastic Strain (EPS) Criterion
Equivalent plastic strain is one of the simplest ductile failure criteria, and for this reason it is widely used and integrated into explicit dynamic commercial software. A rupture is obtained when the equivalent plastic strain of the numerical simulation reaches the plastic strain at failure as shown in Equation (5) [20].
At failure, the element’s deviatoric stress will be automatically set and kept at zero, which means it can carry compression but no tension load. Replication of the tension test was performed with several explicit dynamic simulations and by sequentially adjusting the plastic strain failure value of the material until it coincided with the laboratory result. The result of this calibration process (presented in Figure 7) was obtained with low-order 3D solid elements of 2 mm size and a plastic strain value at failure of 100%.
The 210-MVA transformer tank was modeled using shell elements, because the solid-shell used in Section 2 was not available to the explicit solver. The tank was meshed with a 20 mm mesh size, with a steel nonlinear material true stress–strain curve calculated using Equation (3). As shown in Figure 8, a section of the cover had 3D solid elements of 2 mm with nonlinear weld material properties including the EPS failure criterion. This specific location around the tank cover was chosen because it was the first point of rupture observed in the video recording of the experiment [6]. The numerical model had two symmetry planes for a total of 257k nodes.
Figure 8.
210-MVA transformer tank mesh and material used for the dynamic explicit simulation.
The steel supplier mill test reports for each plate of the 210-MVA transformer tank were retrieved and analyzed. It was observed that even if all parts were compliant with the standard material specifications, thicker plates had a lower yield strength than thinner plates. In order to reflect this reality, the stress–strain curve for each part was adjusted to match its mill test report and can be identified in Figure 8 by the part’s mill heat number.
The explicit dynamic simulation was performed in five load steps of 0.1 s duration in order to reflect the overall loading during the two experiments [6]. The first step applied an average hydrostatic pressure load, then static pressure inside the tank increased to 430 kPa. A third load step removed internal tank pressure and marked the end of the first experiment. For the second test an average hydrostatic pressure was applied, followed by a static pressure increased to 1500 kPa.
The simulation results in Figure 9 show that all elements of the tank cover weld cross-section eroded when the internal arcing tank pressure reached 820 kPa. This result was also in the range of the measurements performed during the 210-MVA transformer tank failure experiment [6], where an average pressure of 486 kPa was recorded and unfiltered sensor signals revealed short time duration peaks over 1000 kPa.
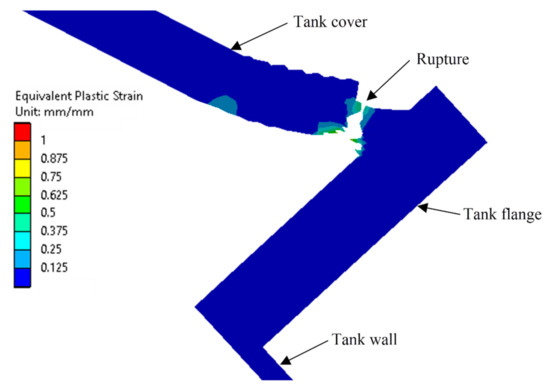
Figure 9.
Rupture of the tank cover weld determined by the EPS criterion.
A finer mesh size model was not completed due to limited computing resources, thus it was not possible to confirm convergence of the EPS criterion. This type of simulation is demanding on computational resources, and this solution took 29 days to compute with 32 processors on a high-performance server. This could be worst when the failure location is unknown because the refinement of the entire cover weld will dramatically increase the number of elements. In conclusion, the EPS ductile failure criterion might be a useful approach for relatively small models, but it is not recommended for tank rupture prevention in power transformers due to excessive computation time.
3.2. Johnson–Cook (J–C) Criterion
The Johnson–Cook ductile failure criterion is more elaborate: it considers large strains, high strain rates and high temperature effects [20]. However, the high strain rate phenomenon is not involved in transformer internal arcing because the gas bubble expansion pressure responsible for the mechanical stresses typically rises in few tens of milliseconds. This sudden pressure rise is in the range of a quasi-static strain rate (0.001 to 1 s−1) which has no significant impact on the material’s plastic deformation. High temperature effects are also negligible; even if the temperature surrounding the arc is about 2000 K, it is assumed that the time needed to transfer heat to the tank walls is too long to affect material properties. After simplification, only the large strain effect parameter remains for transformer internal arcing and the Johnson–Cook simplified expression becomes Equation (6).
- σe Equivalent stress (kPa);
- Stress triaxiality.
Similar to the EPS criterion, the J–C criterion is also based on an explicit solver. From several dynamic explicit simulations of the weld specimen tension test, the following parameter values were obtained: D1 = 0.3, D2 = 0.65 and D3 = 0.3. The results presented in Figure 7 are almost identical to the EPS criterion stress–strain curve.
The explicit dynamic simulation detailed in Section 3.1 with the 210-MVA transformer tank was repeated with the J–C ductile failure criterion applied to the weld. Erosion of the tank cover weld cross-section occurred at an internal arcing tank pressure of 743 kPa and the simulation took 24 days to compute. Again, explicit dynamic simulation is not recommended for tank rupture prevention in power transformers due to the excessive computation time.
3.3. Gurson–Tvergaard–Needleman (GTN) Criterion
The Gurson–Tvergaard–Needleman model includes the microscopic damage evolution of the material, from the initial microdefects fo in the form of void growth up to nucleation fN and then coalescence fc leading to material failure. This microscopic phenomenon is governed by a series of GTN parameters as shown in Table 2. The values in the first row were taken from a microstructure study on steel specimen S235JR [21], and these data were the starting point of the present analysis on the weld material. The GTN parameters q1, q2 and q3 were adjusted through several nonlinear finite-element analyses of an all-welded electrode specimen tension test in order to fit the experimental engineering stress–strain curve shown in Figure 7. The rupture was achieved when the modified void volume fraction f* of the nonlinear finite-element analysis reached the material failure void volume fraction fF, as expressed by Equation (7).
Table 2.
Gurson–Tvergaard–Needleman parameters.
Because the simulation results were dependent on element type and size, a different value of fF was calculated and is presented in Table 3 for element sizes of 2, 1 and 0.5 mm.
Table 3.
Summary of finite-element analysis with GTN criterion.
The 210-MVA transformer tank was modeled using solid-shell elements and the stress–strain curve of each part was adjusted according to its mill test report and identify with colors of Figure 10. The nonlinear finite-element analysis replicated the pressure load steps of the experiment in [6]. It is known that a high strain gradient in a small region requires a fine mesh size to converge [19] which is achieved by using the submodeling technique. In addition, a convergence study of GTN results at rupture was achieved through the four simulations shown in Figure 10, where subsequent submodels were created out of a previous submodel.
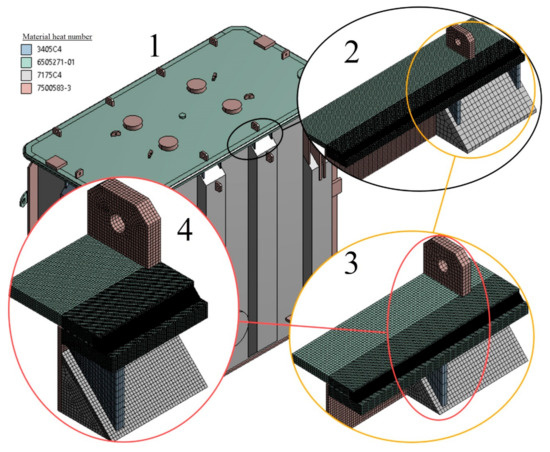
Figure 10.
210-MVA transformer tank finite-element model and subsequent submodels.
The finite-element analysis results for each model are summarized in Table 3. Despite the fact that submodels were dimensionally smaller, the computation time (which used 32 processors) was driven by the number of nodes.
For each submodel, the void volume fraction f* of a selected weld high strain element was manually extracted. The nonlinear finite-element analysis with the GTN model and 1 mm mesh size correlated with the transformer tank failure experiment where the sensor’s unfiltered signals revealed short time duration peaks over 1000 kPa [6]. In addition, the convergence of the pressure at rupture was observed from a mesh size of 1 mm. However, result analysis could be influenced by the user through selection of the high strain element located along the weld. For submodel 2, a tank pressure difference of 50 kPa was observed after retrieving the result of an element in the same area. In conclusion, application of the GTN criterion for tank rupture prevention in power transformers is complex, because material parameters need to be established and results are recorded manually.
3.4. Ultimate Plastic Strain (UPS) Criterion
The strain-based failure criterion was developed during the ABB–Hydro-Québec research program and validated by experiments on a pressurized large steel plate [19] and on a full-size 210-MVA transformer tank [6]. Ductile failure is predicted when the equivalent plastic strain exceeds the material’s ultimate plastic strain throughout the thickness of the part under consideration, as expressed by Equation (8).
One of the reasons behind ABB–Hydro-Québec’s research was to provide engineers with an accurate and more user-friendly ductile failure criterion for transformer tank design, based on nonlinear finite-element analysis rather than explicit dynamic simulation. Another advantage of this approach is that it only considers the material stress–strain curve up to the ultimate stress calculated using Equation (2), which avoids the complexity of establishing properties above this limit. Moreover, in contrast to other criteria, the UPS is not dependent on element size and keeps ultimate plastic strain at a constant limit. This ultimate plastic strain limit for the material is determined by the all-welded electrode specimen tension test result shown in Figure 7.
The 210-MVA transformer tank nonlinear finite-element analysis performed above for the GTN failure criterion was repeated with UPS weld material properties replacing the GTN properties. For each submodel of a different element size, the rupture occurred when the equivalent plastic strain , represented by the purple area in Figure 11, exceeded the ultimate plastic strain through all the cross section of the weld.
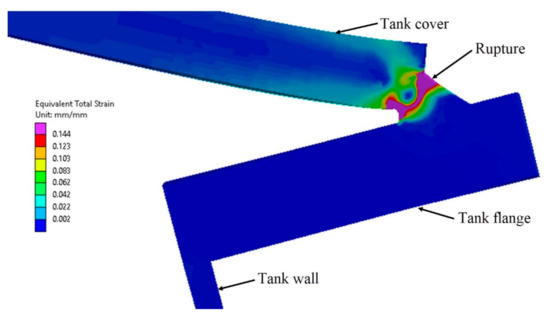
Figure 11.
Rupture of the tank cover weld determined by the UPS criterion.
The nonlinear finite-element analysis results of each model are summarized in Table 4. The submodel simulations were performed using six processors instead of 32 but still significantly reduced the computation time compared to the other criteria. The results for tank pressure at rupture were stable and converged for a mesh size of 1 mm. The pressure of 790 kPa show good agreement with the J–C and EPS criteria results and is in the same pressure range as that measured during the 210-MVA transformer tank failure experiment [6].
Table 4.
Summary of finite-element analysis with UPS criterion.
4. Advantages of Tank Rupture Prevention Using Numerical Simulation
Transformers tank rupture is a threat to people’s safety in and around power substations. It is an environmental concern because oil spills can cause soil and water contamination and potential fire hazard with toxic smoke. It has a financial impact by the loss of the transformer itself, collateral damages to surrounding equipment, loss of revenue and costly cleanup.
Therefore, tank rupture is a concern for the industry and several protective techniques have been proposed over the years in order to prevent catastrophic consequences. A mitigation technique with a conservator expansion volume connected by a pipe of 900 mm in diameter has demonstrated from experimental results that it gives a pressure reduction of more than 20% [9]. Another proposed technique is venting the pressure with rupture discs for which a numerical study on a 100-MVA transformer has showed a possible pressure reduction up to 30% for an aperture diameter of at least 1.4 m. However, the solution efficiency muchly depends on the arc energy level and the vicinity of the fault to the rupture disc [10]. Furthermore, we are not aware of any experiments with the rupture discs in the literature so that they may still be a technical challenge in the future.
The numerical simulation technique using Finite Element Method such as presented in this paper has demonstrated good correlation with test results for two different real size transformers: the first one is a 210-MVA transformer [6] and the second one is a 100-kVA transformer [3]. As previously mentioned, these two experimental validations demonstrate that the developed numerical technique could be applied to predict the rupture pressure of a wide range, in terms of size and rating, of transformer. There are many advantages of this numerical technique compared to the one mentioned above: design simplicity, solution efficiency, low cost, no extra footprint and maintenance. The tank rupture prevention based on this numerical tool will help to increase personal safety, mitigate environmental threat and reduce financial lost.
5. Conclusions
This numerical study demonstrates that nonlinear finite-element analysis can be an accurate design tool for transformers tank rupture prevention and can limit catastrophic damages. The arcing pressure rise accuracy is crucial and calculated by the following steps. First, it is suggested to use a nonlinear material property with true stress-strain curve up to the ultimate stress calculated using Equation (2). The material plastic model, up to failure, used in the finite-element analysis has been validated by comparison with tensile experiments. Then, the tank expansion coefficient is calculated by nonlinear finite-element analysis including the large deflection effect. The reliability of the numerical result is confirmed by comparison with the 210-MVA tested tank measurements and both shows a maximum tank wall displacement of 108 mm and a good correlation of the tank volume increases. This simulation also highlights the importance of plastic deformation, which is responsible for 64% of the tank expansion volume increase. Finally, this nonlinear tank expansion coefficient is used in an iterative process to calculate the tank design pressure for a given fault energy level.
The maximum load a tank can withstand is primordial for a rupture prevention design because it will ensure resistance within a safety margin. This evaluation is challenging for a large power transformer with a small, localized, high-strain region at risk of potential rupture. The investigation shows results of widely used ductile failure criteria EPS and J–C based on an explicit solver, where the tank pressure at rupture is respectively 820 kPa and 743 kPa. These results are in the range of measurements performed during the 210-MVA transformer tank failure experiment. However, these explicit dynamic simulations show excessive computation time, up to 29 days, and therefore are not recommended for transformer applications. The strain-based failure criterion UPS developed by ABB–Hydro-Québec for transformer application gives a tank pressure at rupture of 790 kPa correlates the explicit dynamic failure models and tested tank results. This UPS model show convergence of the results for a mesh size of 1 mm and involves much shorter computational times (at least 8 times faster). In addition, it can predict rupture of the cover weld and can be applied to all other tank locations at risk such as corner junctions, middle or bottom of walls to ensure a design safety criterion. For all these reasons mention above the UPS model is recommended for transformers tank rupture prevention in case of high-energy internal arc.
Author Contributions
Conceptualization, S.B., V.N.L. and H.C.; methodology, S.B.; validation, S.B., V.N.L. and H.C.; formal analysis, S.B.; investigation, S.B.; writing—original draft preparation, S.B.; writing—review and editing, V.N.L. and H.C.; visualization, V.N.L., H.C.; supervision, V.N.L. and H.C. All authors have read and agreed to the published version of the manuscript.
Funding
This research received no external funding.
Conflicts of Interest
The authors declare no conflict of interest.
References
- Working Group A2.33. Guide for Transformer Fire Safety Practices; CIGRÉ Technical Brochure 537; CIGRÉ: Paris, France, 2013. [Google Scholar]
- Foata, M. Power Transformer Fire Risk Assessment. In Proceedings of the CIGRÉ Transformer Technology Conference, Sydney, Australia, 31 March 2008. [Google Scholar]
- Brodeur, S.; Dinh, H. A Station Service Voltage Transformer Designed and Tested to Withstand a Severe Internal Arc Fault. In Proceedings of the CIGRÉ Transformer Technology Conference, Montréal, QC, Canada, 16–19 September 2019. [Google Scholar]
- Foata, M.; Khouzam, G. Power Transformer Tank Rupture; Canadian Electrical Association, Engineering and Operating Division: Toronto, ON, Canada, 1994. [Google Scholar]
- Kothmann, R.E.; Thompson, D.G. Power Transformer Tank Rupture: Risk Assessment and Mitigation; EPRI, Technical Report TR-104994; EPRI: Washington, DC, USA, 1995. [Google Scholar]
- Brodeur, S.; Dastous, J.-B. Design and Testing of an Arc Resistant Power Transformer Tank. IEEE Trans. Power Deliv. 2020, 35, 699–706. [Google Scholar] [CrossRef]
- Cuk, N.P. Oil Tank Explosion Resistance; CEA 149D491; Canadian Electricity Association: Surrey, BC, Canada, 1990. [Google Scholar]
- Dastous, J.-B.; Foata, M. Analysis of Faults in Distribution Transformers with MSC/PISCES-2DELK. In Proceedings of the MSC World Users Conference, Los Angeles, CA, USA, 11–15 March 1991. [Google Scholar]
- Kawamura, T.; Ueda, M.; Ando, K.; Maeda, T.; Abiru, Y.; Watanabe, M.; Moritsu, K. Prevention of Tank Rupture Due to Internal Fault of Oil-Filled Transformer; CIGRÉ: Paris, France, 1988. [Google Scholar]
- Foata, M.; Dastous, J.-B. Power Transformer Tank Rupture Prevention. In Proceedings of the CIGRÉ Transformer Technology Conference, Paris, France, 22–27 August 2010. [Google Scholar]
- Baïlon, J.-P.; Dorlot, J.-M. Des Matériaux, 3rd ed.; Presses Internationales Polytechnique: Montréal, QC, Canada, 2000; p. 768. [Google Scholar]
- Arasaratnam, P.; Sivakumaran, K.S.; Tait, M.J. True Stress-True Strain Models for Structural Steel Elements. ISRN Civ. Eng. 2011, 2011, 11. [Google Scholar] [CrossRef]
- Khan, A.S.; Huang, S. Continuum Theory of Plasticity, 1st ed.; John Wiley & Sons Inc.: New York, NY, USA, 1995; p. 440. [Google Scholar]
- Lee, H.-H. Finite Element Simulations with ANSYS Workbench 12, 1st ed.; Schroff Development Corporation: Kansas City, MO, USA, 2010; p. 586. [Google Scholar]
- Hackl, A.; Hamberger, P. Predict the rupture of transformer tanks with static FEM analysis. In Proceedings of the IEEE XXth International Conference on Electrical Machines, Marseille, France, 2–5 September 2012. [Google Scholar]
- Ringlee, R.J.; Roberts, N.W. Tank Pressures Resulting from Internal Explosions. AIEE Trans. 1959, 78, 1705–1710. [Google Scholar] [CrossRef]
- IEEE. IEEE Guide for Tank Rupture Mitigation of Liquid-Immersed Power Transformers and Reactors; IEEE Standard C57.156-2006; IEEE: Piscataway, NJ, USA, 2016. [Google Scholar]
- Tamez, G.; Payan, L.; Amador, L. A more accurate numerical method to calculate pressure rise due to internal electrical faults in oil-filled power transformer tanks. In Proceedings of the IEEE PESGM Conference, Portland, OR, USA, 5–9 August 2018. [Google Scholar]
- Bélanger, S.; Brodeur, S.; Dastous, J.B.; Soucy, N. Experimental and Numerical Studies of Large Steel Plates Subjected to High Pressure Loading. In Proceedings of the World Congress on Computational Mechanics Session, Barcelona, Spain, 20–25 July 2014. [Google Scholar]
- Corona, E.; Reedlunn, B. A Review of Macroscopic Ductile Failure Criteria; Sandia National Laboratories: Albuquerque, NM, USA, 2013. [Google Scholar]
- Kossakowski, P.G. An analysis of the Tvergaard parameters at low initial stress triaxiality for S235JR steel. Pol. Marit. Res. 2014, 21, 100–107. [Google Scholar] [CrossRef]


Publisher’s Note: MDPI stays neutral with regard to jurisdictional claims in published maps and institutional affiliations. |
© 2021 by the authors. Licensee MDPI, Basel, Switzerland. This article is an open access article distributed under the terms and conditions of the Creative Commons Attribution (CC BY) license (http://creativecommons.org/licenses/by/4.0/).