Article

The Spatial Effect of Shared Mobility on Urban Traffic Congestion: Evidence from Chinese Cities

The Glorious Sun School of Business and Management, Donghua University, Shanghai 200051, China
*
Author to whom correspondence should be addressed.
Sustainability 2021, 13(24), 14065; https://doi.org/10.3390/su132414065
Submission received: 17 October 2021 / Revised: 28 November 2021 / Accepted: 7 December 2021 / Published: 20 December 2021
(This article belongs to the Special Issue Shared Mobility and Sustainable Transportation)

Abstract

:
This paper explores the spatial spillover effect of shared mobility on urban traffic congestion by constructing spatial econometric models. Based on panel data of 94 Chinese cities from 2016 to 2019, this study analyses the spatial correlation of shared mobility enterprise layout and geographical correlation of urban transport infrastructure and examines their influence mechanism. From the perspective of geographic spatial distribution, congestion has positive spatial correlation among Chinese cities, and it has different directions and centripetal forces across regions. The shared mobility enterprises in a region have same direction distribution with traffic congestion, but the centripetal forces of the aggregation effect are different. The econometric results include the fact that bike-sharing has reduced congestion significantly, but the overall impact of car-sharing is not clear. Neither bike-sharing nor car-sharing can offset the traffic congestion caused by economic activities and income growth. From the perspective of spillover effects, congestion has been influenced by bike-sharing, economic development, population, and public passengers in surrounding areas. In terms of spatial heterogeneity, bike-sharing relieves congestion in the Pearl River Delta region while having no significant effect in other regions. Meanwhile, car-sharing has aggravated congestion in the Yangtze River Delta but eased traffic jams in the Pearl River Delta.

1. Introduction

The development of intelligent urban transportation, the use of information technology and the application of artificial intelligence are transforming traffic use. In particular, shared mobility is the intelligent tool most extensively used by commuters and travelers. Various forms of shared mobility have flooded the urban roads and streets to cater to the demand for public mobility [1]. However, with the rapid growth of shared mobility, a series of undesirable problems has emerged, for example, the excessive allocation of shared bikes has caused resources to be wasted and has seriously harmed the sustainability of public transportation. As such, the reliance on shared mobility to solve traffic problems has faced challenges in large cities [2]. Whether the development of shared mobility in China can reduce urban traffic congestion and improve the sustainability of transportation is a topic worthy of discussion.
The emergence of shared mobility has been witnessed around the world in recent decades thanks to big data and internet technology. Shared mobility is an important application field that connects intelligent technology, markets, and citizens, and is considered a set of disruptive mobility services and an innovative transportation concept [3,4,5]. Bike-sharing (“BS”) and car-sharing (“CS”) are the two main shared mobility modes in China (The reasons why we excluded ridesharing are as follows. Ridesharing in China is mainly based on individual behaviors carried out on a comprehensive bilateral platform (such as the Didi platform), as a peer-to-peer transaction. The transactions involving shared bicycles and shared cars are based on a separate company, as a business-to-customer transaction. Thus, the data on ridesharing or peer to peer carsharing cannot match with the enterprise-level data on shared bicycles and shared cars. In addition, because ridesharing in China is regulated by the government and the transaction scale is relatively small, being excluded does not affect the basic conclusions of this article.). BS is committed to solving the “last mile” problem of urban commutes through offering a variety of pick-up and drop-off locations. CS provides a convenient, green, and diverse traffic mode, satisfying commuters ‘needs at a much lower cost than car ownership [6,7]. According to the statistics, shared mobility expenditure in China accounted for 11.3% of urban residents’ transportation expenditure by the end of 2020. In first-tier cities such as Beijing and Shanghai, approximately 92% of shared bikes can work in conjunction with public transportation (such as subways) faster than cars can for trips shorter than 5 km, demonstrating that BS can effectively improve the transportation efficiency of short-distance travel. In addition, the number of trips by private cars has decreased by 55% (as reported in China’s Sharing Economy Report 2021 by the National Information Centre, and the White Paper on China’s bike-sharing and urban development in 2017). However, due to the excessive expansion and discretionary allocation of CS and BS, some social problems have appeared that generate dissatisfaction and controversy. A large number of bicycles have been parked, and even discarded, without planning. Unpredictable intervals between borrowing and returning shared cars, together with difficulties finding parking space, have dented people’s enthusiasm for using these services.
As people’s willingness to use shared transport has gradually flagged in the face of so many negative issues, the outbreak of Coronavirus in 2020 seemed to have reignited people’s desire to choose this type of traffic service. Considering that coronavirus radically affected people’s travel behavior [8], some researchers found that the number of people who have continued to choose public transportation since the outbreak of Coronavirus disease 2019 (COVID-19) has dropped significantly, while shared mobility has been less affected [9]. A survey in Lahore, Pakistan showed that since the outbreak of COVID-19, people have been more inclined to choose a solo mode of travel rather than public transportation [10]. It can be seen that since the start of the pandemic, people have given new meaning to shared mobility, and they may choose this mode of travel more often.
Traffic congestion has always been the most straightforward means to reflect the efficiency of urban transportation. Continued congestion will seriously affect the sustainable development of transportation. According to the China’s Urban Transport Report 2020, (which selected 100 cities with serious traffic congestion as the research object; the list can be seen at: https://jiaotong.baidu.com/cms/reports/traffic/2020annualtrafficreport/index.htm) (accessed on 6 April 2021), 52% of Chinese cities have witnessed a significant increase in congestion that takes a toll on both individuals and society. A report released by Baidu Map in 2018 showed that the economic loss due to traffic congestion in Beijing in 2017 was 4013.31 yuan per capita, ranking first in the country (Data source: China Urban Research Report 2017. http://huiyan.baidu.com/reports/2017Q4_niandu.html) (accessed on 15 October 2020). According to statistics from the Ministry of Transport of China, the economic loss caused by traffic congestion in China is as high as 250 billion yuan every year (Data source: Shenzhen Kutuo Technology Co., Ltd., http://www.szkutuo.com/gongsixinwen/548.html, accessed on 15 November 2021). In the spirit of sharing and sustainability, it is important to alleviate traffic congestion and to promote optimization of the industrial transport structure.
Many scholars and industry experts have focused on speeding up the construction of transportation power and promoting the energy revolution in an intelligent way. Electric power has been selected as the main source of energy in the transportation industry. As China has planned to reach its carbon peak by 2030 and be carbon neutral by 2060, new methods based on smart technology and big data algorithms for transportation have appeared in recent years [11,12]. As an application of an intelligent transportation system, the question of whether shared mobility can relieve urban traffic congestion is of critical concern. Considering the impact of shared mobility on city transportation from a psycho-social aspect, it might be combined with the spatial spillover effect of the industry.
First, there is a spatial correlation between transportation industries in geographically adjacent cities. That is, the convenience of a central city will affect its own transportation efficiency as well as the efficiency of surrounding cities [13]. Therefore, it is argued that the convenience of transportation in a certain city will have an impact on its own transportation efficiency as well as that of the surrounding areas [14]. The spatial connections between cities are becoming increasingly close. Hence, there is a natural geographic linkage in transportation, especially when large cities such as Beijing and Shanghai act as transportation hubs. High-efficiency transportation will not only promote local economic growth but also boost economic development in surrounding areas through spatial spillover effects [15,16].
Second, there is a spatial correlation between the layouts of shared mobility enterprises in geographically adjacent cities. In a city both national operators (such as Harrow Bike and EVCARD) and local operators (such as Renmin shared bicycles in Xiamen city) exist, both of which provide similar shared mobility services. The layout of shared mobility enterprises exhibits spatial agglomeration in cities, especially in megacities and their surrounding areas. Operating shared car or bike enterprises in different cities may also have spatial spillover and spatial correlation. Thus, shared mobility brings about spatial changes in the overall urban transportation structure.
These spatial correlation characteristics provide the basis for the spatial measurement models in this study, which investigates whether shared mobility will affect traffic efficiency in local areas and surrounding areas through spatial spillover effects. Therefore, this paper uses a generalized spatial econometric model (“GSEM”) to examine the spatial correlation between shared mobility and urban transportation. This model will also be used to delve into the internal mechanisms that describe BS’s and CS’s influence on urban traffic congestion, in order to theorize ways to achieve more sustainable transportation. This paper’s unique contributions are as follows: (1) We have systematically collected dynamic data amassed by shared companies from 94 cities that experience heavy traffic every quarter so as to understand the operating status of shared companies in cities. (2) We explore the spatial correlations and spillover effects between traffic congestion and the number of shared mobility companies by constructing a generalized spatial econometric model, both from geographic and econometric perspectives.

2. Literature Review

The existing literature on shared mobility mainly focuses on three aspects: the changes in people’s travel patterns brought about by shared mobility, the relationship between shared mobility and urban traffic congestion, and research methods related to both of these topics.
(1)
Shared mobility has impacted users’ travel choices. BS has flourished since 2015 and 2016 and provided people with brand-new green traffic modes [17], which have the potential to become an indispensable part of public transportation [18]. Yang et al. [19] found that shared bicycles can reduce transfer time and mileage; Campbell and Brakewood [20] noticed that the placement of shared bicycles along a traveler’s route reduced bus trips by approximately 2.42%; Macioszek et al. [21] utilized questionnaires to analyze the operation of shared bicycles and the factors that affected the use of shared bicycles in Warsaw, with results showing that the number of BS system users increases every year and that the users are mainly between 19–45 years old. Moreover, the use of BS is directly related to satisfaction with BS. In comparing the two travel modes (public transportation and BS), the use of BS has increased by 21–35%. People are more willing to use BS for their daily commute. Jin et al. [22], Cheng et al. [23], and Fan and Zheng [24] reached the conclusion that because BS has replaced private cars, road congestion levels around subway stations during peak hours have decreased by 4%. However, Radzimski and Dzicielski, found a positive correlation between the number of bike-sharing trips over short distances (under 1500 m) and medium distances (1500 to 3000 m) and the frequency of public transportation usage, while the number of bike-sharing trips over long distances (3000 m or more) was not related to the frequency of public transportation usage [25]. Shared bicycles emerged under the influence of new technologies and thus triggered an upgrade of the entire transportation industry. This unique mode also led people to change their travel choices to alternative, more sustainable modes of transportation [26]. Similar research has also been conducted by Noland and Ishaque [27], Fishman et al. [28], and Ahillen et al. [29].
The studies related to CS focus primarily on the cases of established enterprises. For example, Zhang and Zhang [30] found that Uber usage has a significant positive correlation with public transport passenger volume. Jochem et al. [31] analyzed the influence of shared mobility on the travel frequency of cars in 11 European countries. The results showed that one shared car led to a reduction of up to 20 private cars on the road, and this trend increased significantly with higher frequency and travel mileage of CS.
(2)
In studying the impact of shared mobility on urban traffic congestion, Hamilton and Wichman [32] reported that a shared bicycle could reduce traffic congestion by approximately 4% in Washington, DC, and this effect is especially noticeable during peak hours in highly congested areas. Wang and Zhou [33] adopted a difference-in-difference model to achieve similar results by using panel data from 96 cities in the United States. However, with the rapid development of shared bicycles in China, a series of unsustainable issues have been exposed in Chinese cities, including oversupply of BS, discretionary parking and illegal cycling; and inadequate regulations and market supervision [34]. Mitra et al. [35] also found that the presence of public bicycles has not changed the mode of transportation for most people, and it is very unlikely that young people will switch from automobiles to bicycle riding. In addition, Chevalier et al. [36] found that the rapid expansion of BS improved peoples’ cycling activities but it also caused a series of public environmental problems, such as crowding of parking spaces. Therefore, the question of how BS impacts traffic congestion is as of yet unsettled.
In research on CS, Jacobson and King [37] estimated that if one passenger were added in every 10 vehicles, the potential fuel savings worldwide would be 7.54–7.74 billion gallons per year. Li et al. [38] found that from 1982 to 2014, Uber’s entry effectively lessened traffic congestion in 101 cities in US through fewer cars, less rush hour traffic and less carbon emissions. Hang et al. [39] demonstrated that the subsidies distributed by CS enterprises led to an increase in Shanghai’s comprehensive travel index by 0.068–0.078 because CS provides more convenient and economical ride services. In addition, Yuan et al. [40] utilized big data from the Didi platform and discovered that the rapid increase in the number of CS enterprises reduced travel efficiency on the road, engendering serious traffic congestion and air pollution. In general, both positive and negative effects exist concerning shared mobility and traffic congestion.
(3)
With regards to research methods, most studies have adopted the traffic congestion fee model and the spatial spillover effect of congestion on the economy. Wang et al. [41] and Xu and Ou [42] analyzed the impact of traffic congestion fees on residents’ traffic demand using a traffic congestion fee model and found that congestion fees mainly encourage residents to choose public transportation. Wang and Li [43] and Li et al. [44] combined the spatial Durbin model and spatial lag model to study the spatial spillover effects of transportation accessibility on the growth of the manufacturing industry. Jia et al. [
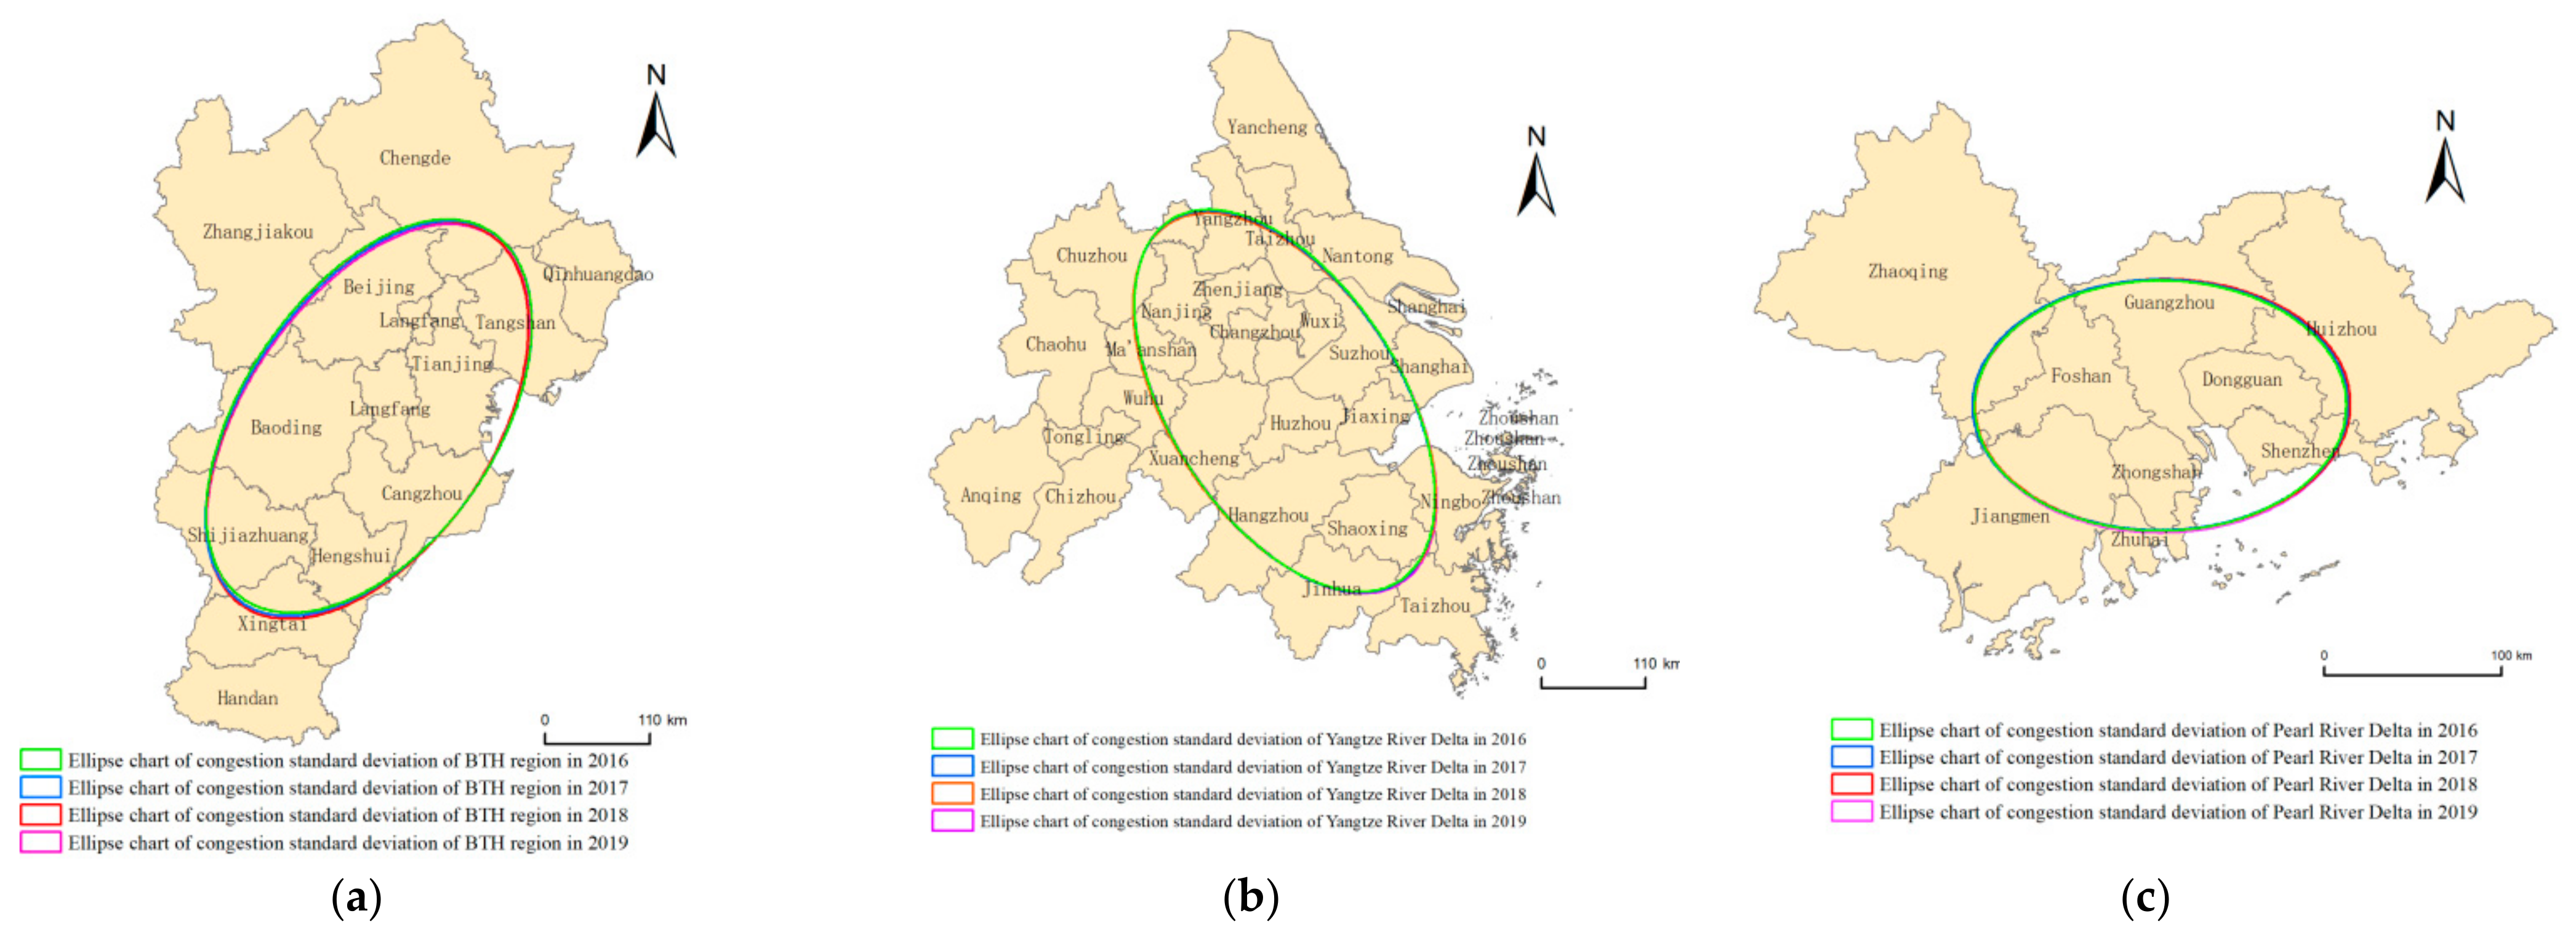
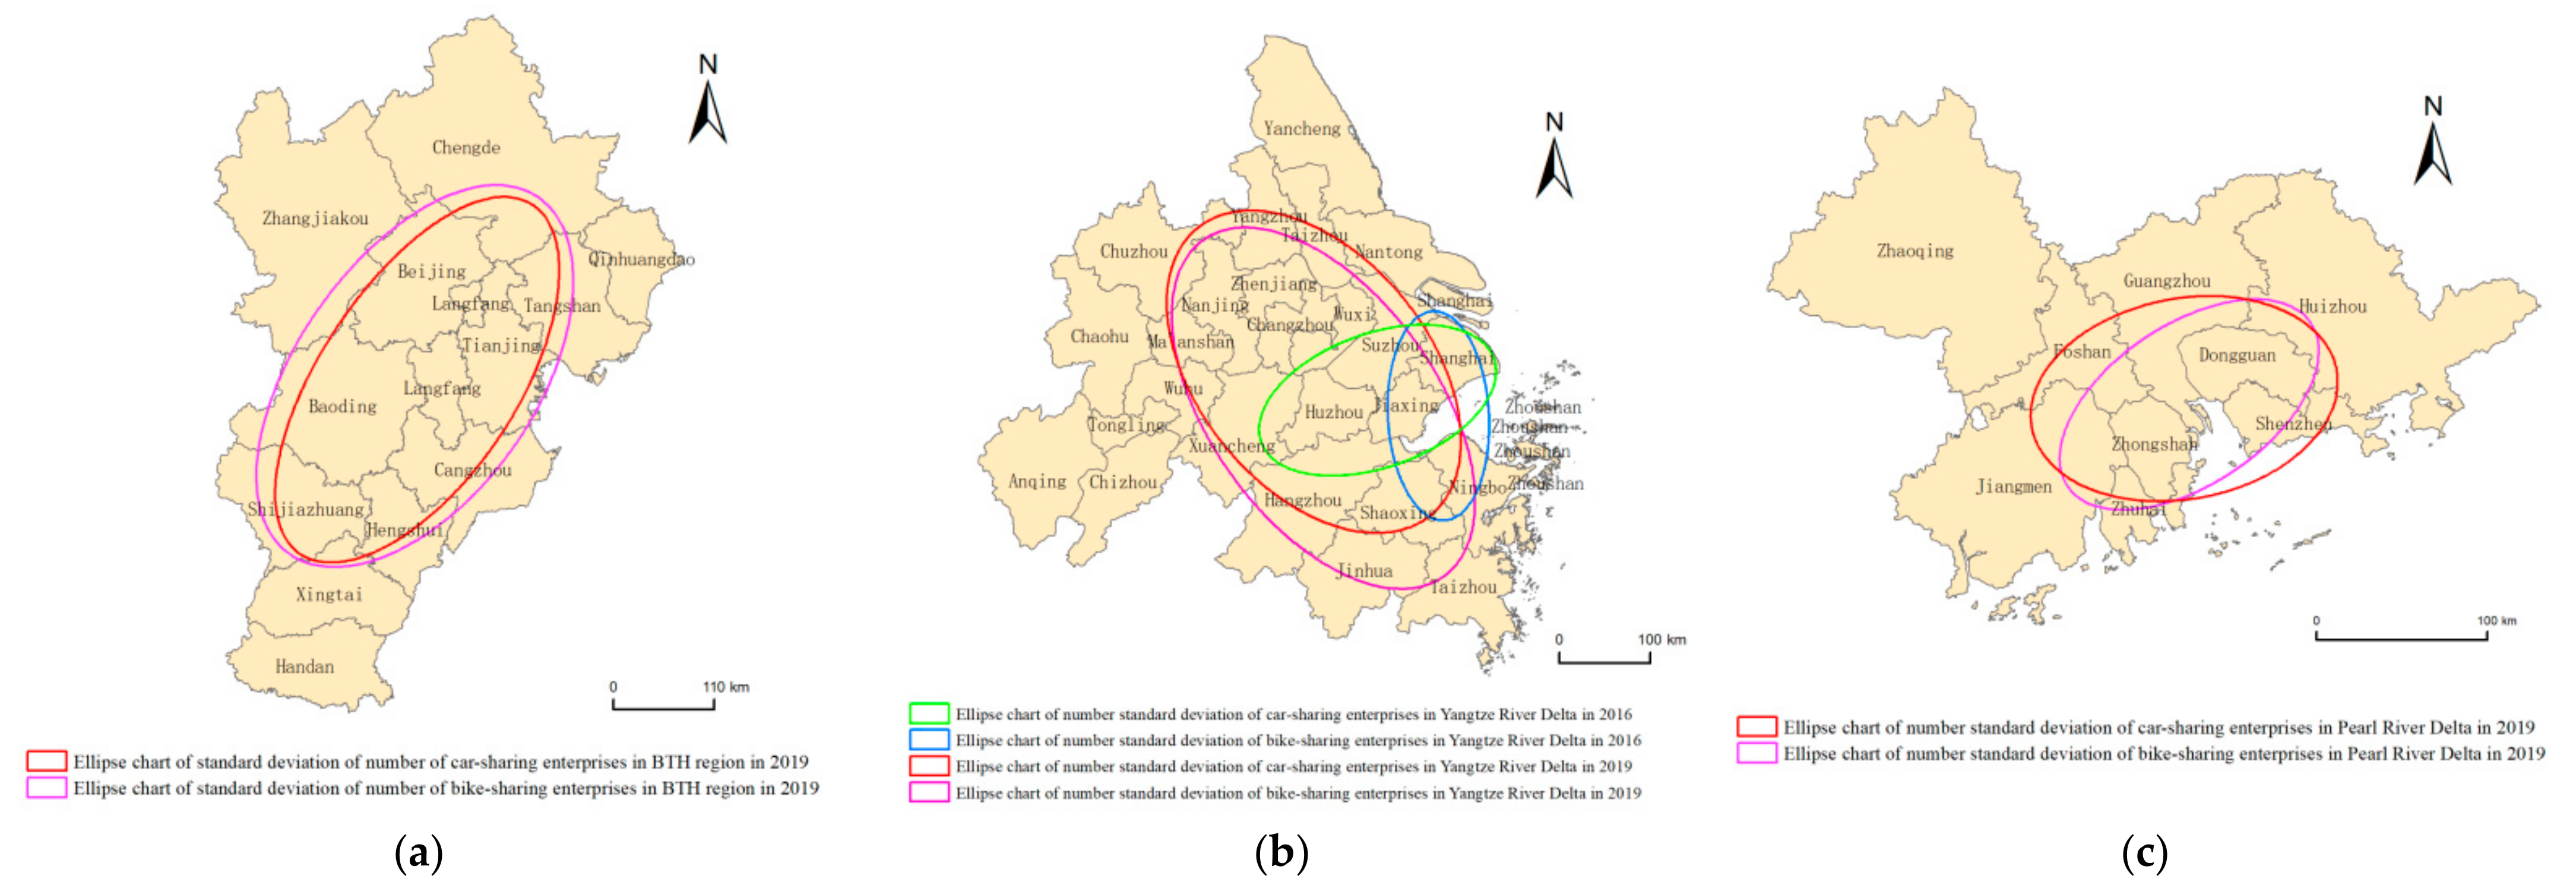
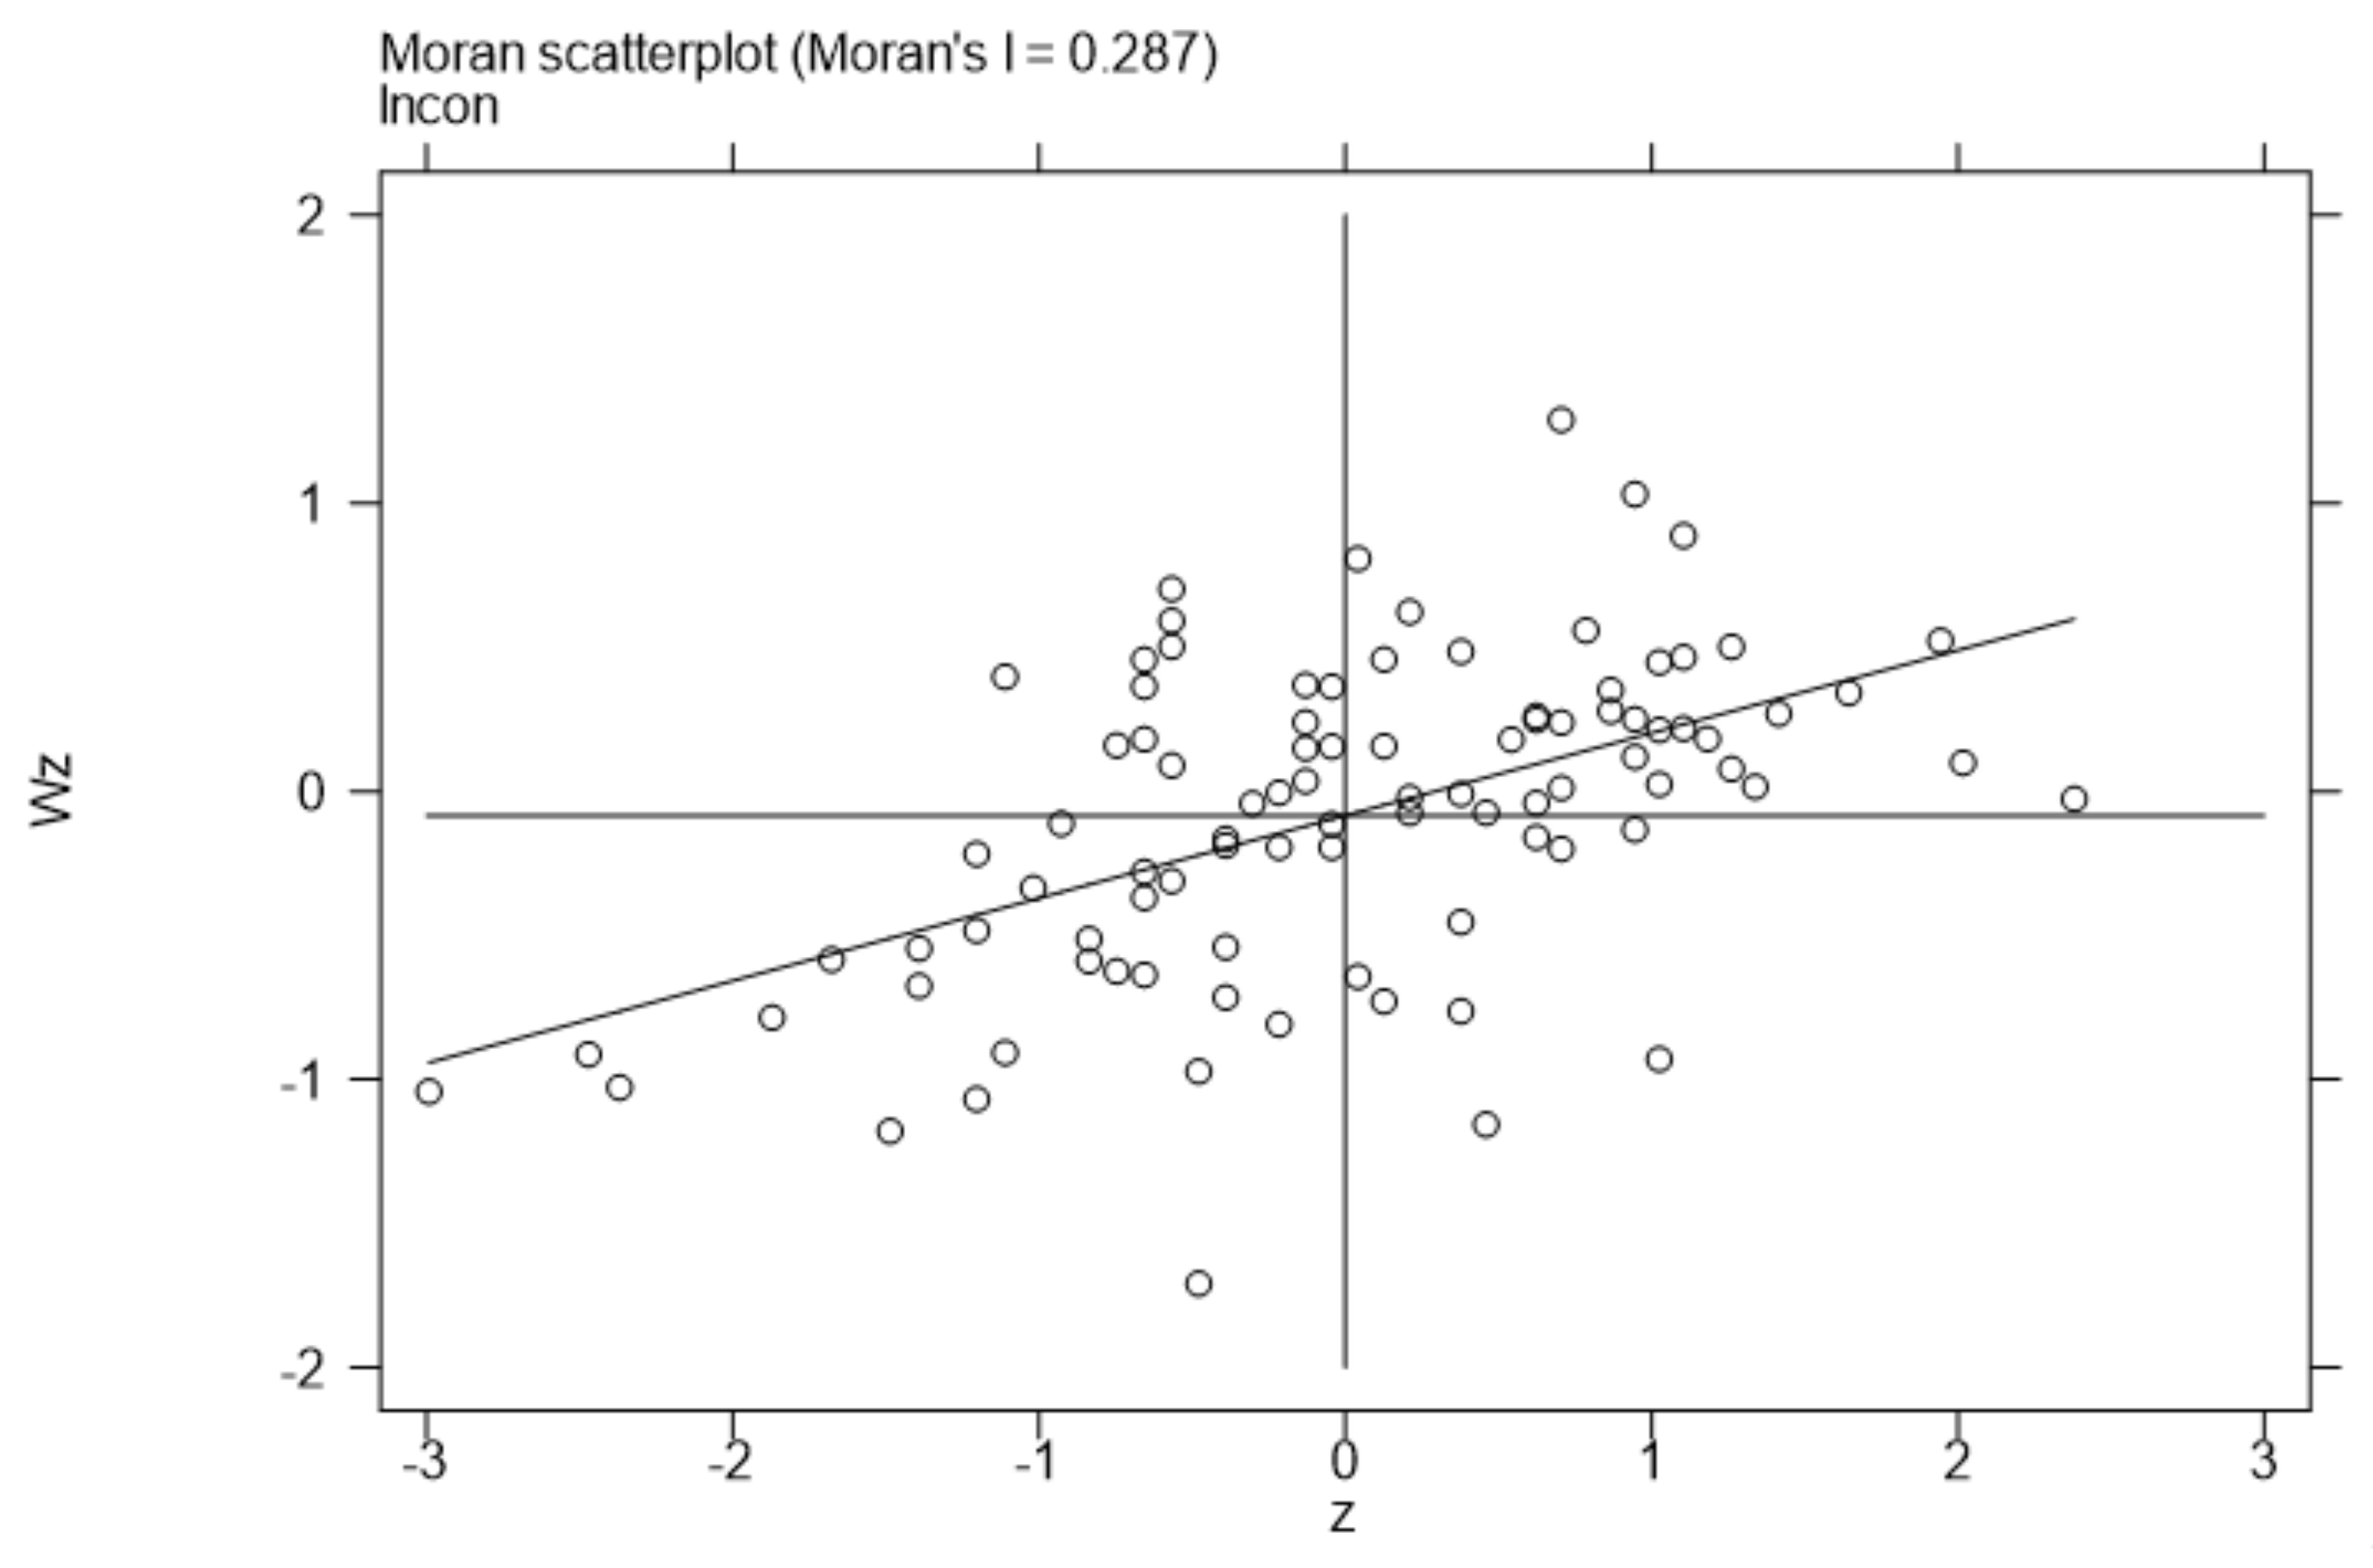
45], by calculating the Moran index, established that there has been a significant spatial spillover effect of integrated transport efficiency in recent years. Existing studies have proved that no single city is responsible for traffic congestion. The infrastructure and economic development of surrounding cities are also held accountable for congestion through spatial spillover effects, especially when economically integrated urban agglomeration is present. In China, these urban agglomerations are mainly the Beijing-Tianjin-Hebei(BTH) region, the Yangtze River Delta (YRD) region and the Pearl River Delta (PRD) region. These regions have high traffic accessibility and obvious spatial spillover effects. Meanwhile, the congestion problems in these regions are also prominent. Therefore, this paper uses these three regions as the research scope to explore the heterogeneity of relationships between traffic congestion and shared mobility in urban agglomerations.
In summary, even though CS and BS change commuting patterns for citizens, the question of whether CS and BS can alleviate urban traffic congestion has not reached a consensus in previous research. Moreover, previous research on BS and CS is primarily based on a single city or single enterprise, with few studies covering larger regions. In addition, the research on transportation by GSEM regarding the effect of change in the internal structure of the transportation industry on traffic congestion and efficiency is insufficient. Therefore, this study intends to adopt the GSEM comprehensively, to consider the operation of two types of shared mobility services, and to evaluate the spatial spillover effects of shared mobility on urban traffic congestion in Chinese cities.
Table 1 and Table 2 summarize the effects of shared mobility on traffic congestion and the research methods.

3. Materials and Methods

The main purpose of this research was:
  • analysis of the spatial characteristics of urban traffic congestion in Chinese cities.
  • analysis of the spatial characteristics of urban shared traffic enterprises.
  • research on the relationship between shared mobility and urban traffic congestion.

3.1. Variable Selection

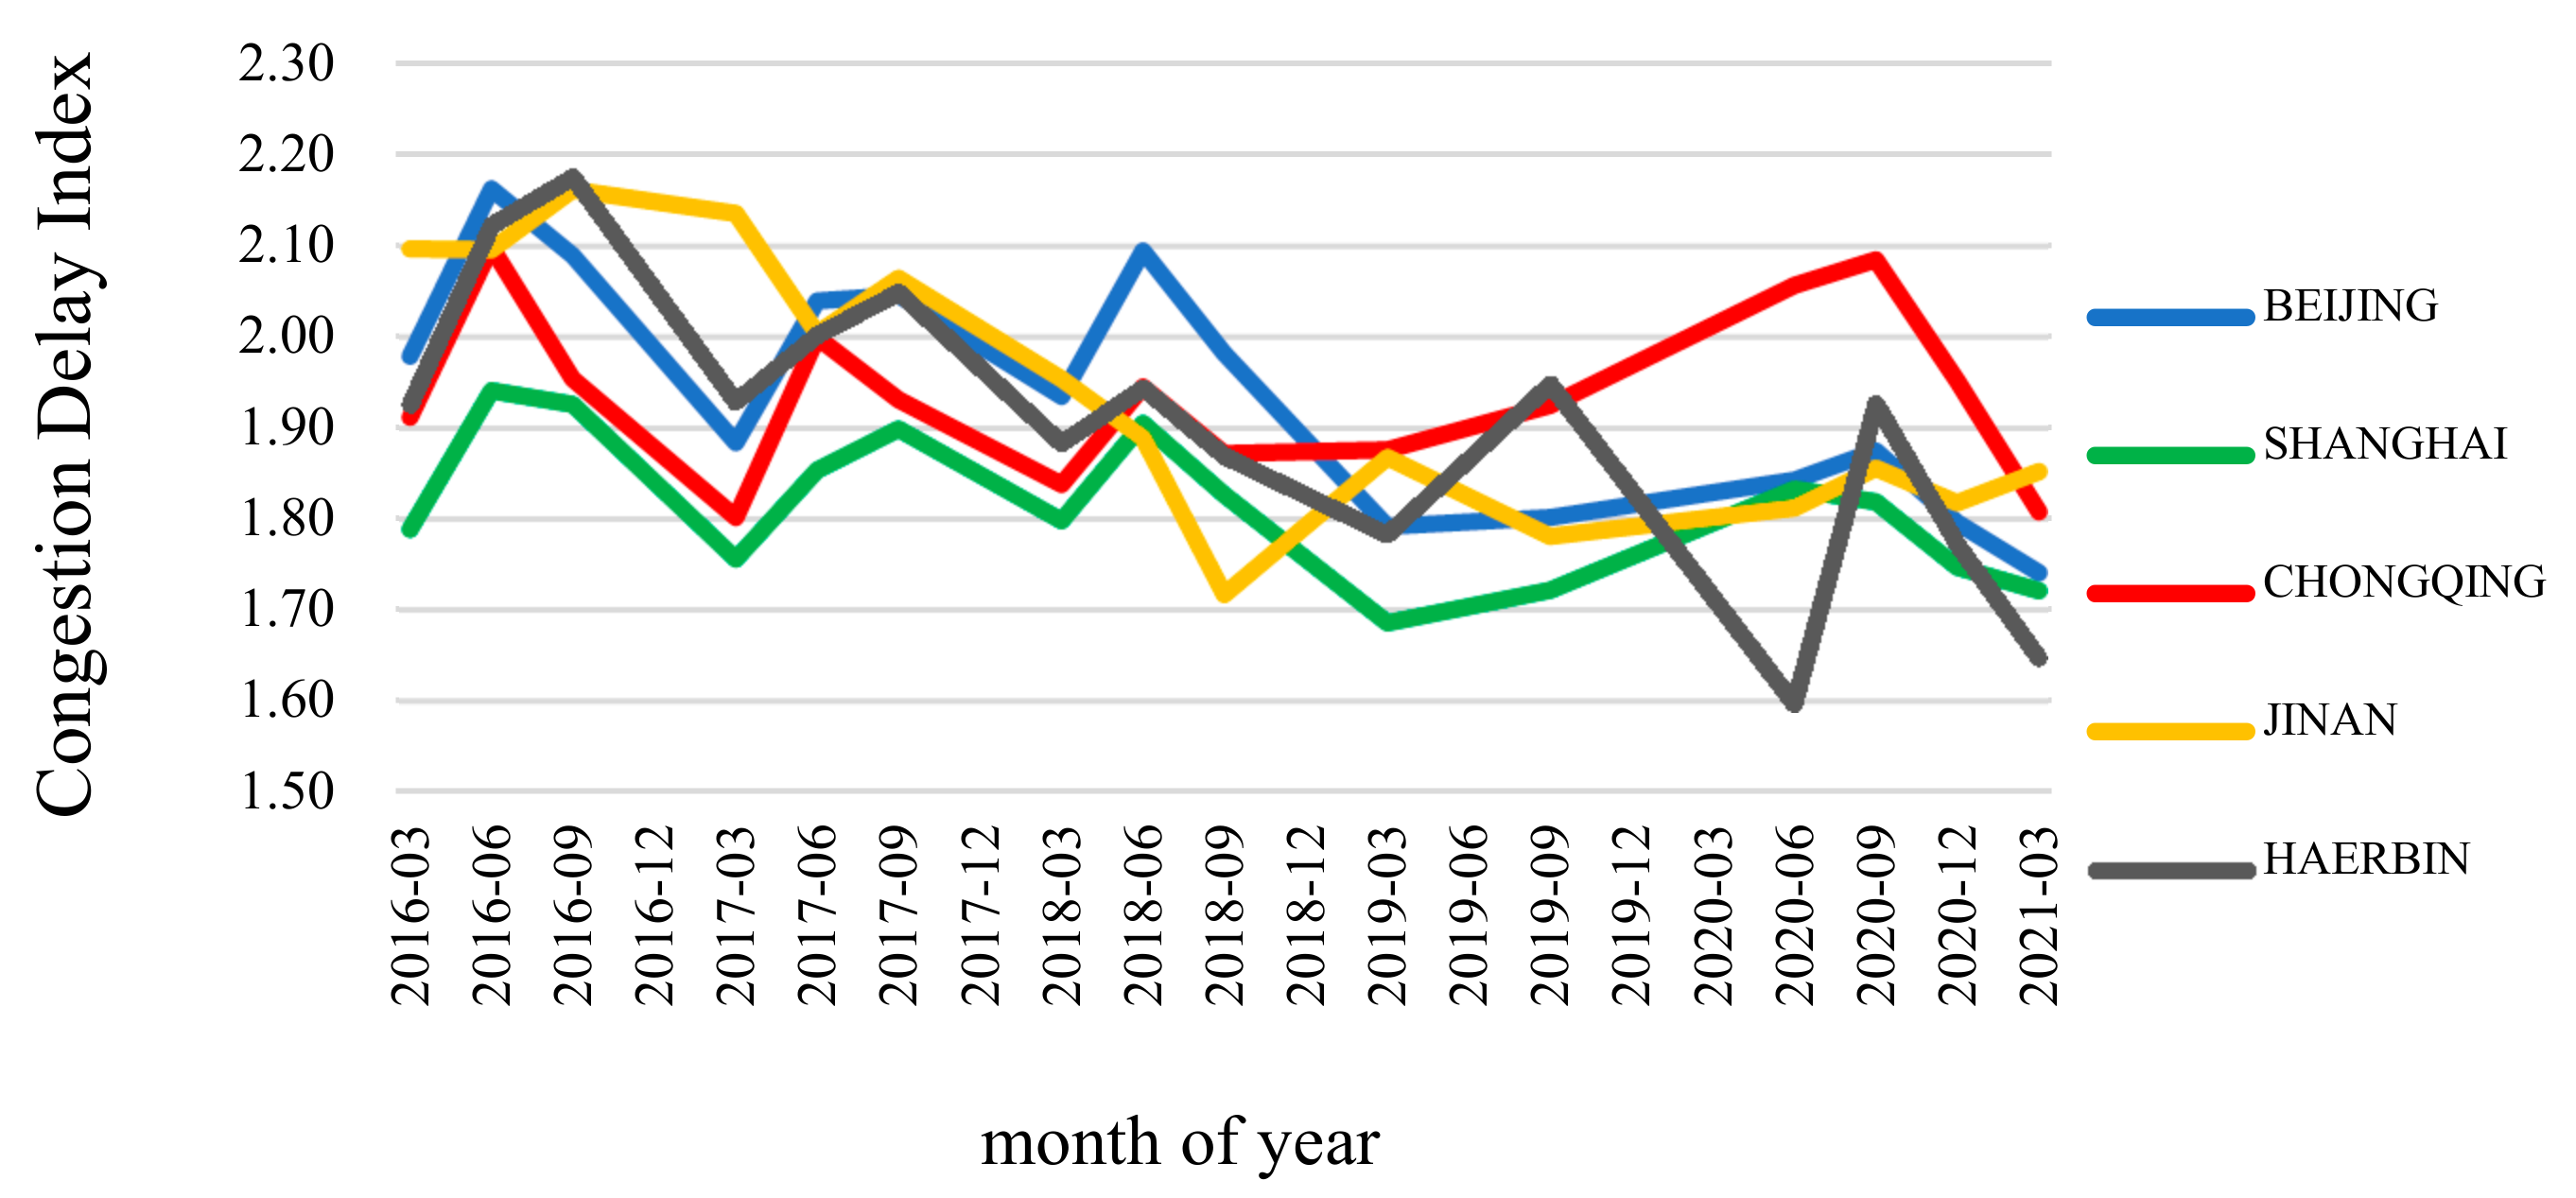
The dependent variable reflecting traffic congestion used in this article is the congestion delay index (CDI). This index can evaluate the degree of urban congestion in cities, and it is expressed as a ratio of the actual travel time to the travel time in the free flow state. The higher the CDI, the more serious is the congestion. Figure 1 shows that the top five highest CDIs of Chinese cities all exceed 1.5, demonstrating that the commuting time of citizens is 1.5–2 times that of free flow.
The independent variable for “BS” and “CS” is the number of operating enterprises in cities, which intuitively reflects the number of shared bicycle and shared car enterprises in operation. If an enterprise went bankrupt in the sample time period, it was excluded accordingly. There are two reasons why the number of BS and CS are not used as independent variables in this paper. First, it is hard to obtain accurate allocation data at the panel level, and it is prohibitive to measure the number of and the usage time of bicycles and cars. (Shared bicycles and shared cars in China belong to independent private enterprises. Those enterprises are unwilling to share data on public platforms to avoid vicious market competition and ethical issues. The total numbers of rentals, customers and vehicles are announced once a year by each shared enterprises but the quarterly data for each city is not released). Second, there is a large discrepancy between the number of allocations and the actual usage of shared mobility, and this makes the effect on traffic congestion inaccurate (The number of allocations refers to the number of shared bicycles and shared cars that are allocated by shared mobility companies in each city; the actual usage of shared mobility means the number of bicycles and cars actually used by riders/commuters, not including the number of idle cars and bicycles). Fortunately, we can obtain the entry and exit times of each shared mobility company in different cities from the company’s official website and city networks in China, so we can assess how many shared mobility companies are in operation each city in each quarter. This is the basic data for our panel data regression.
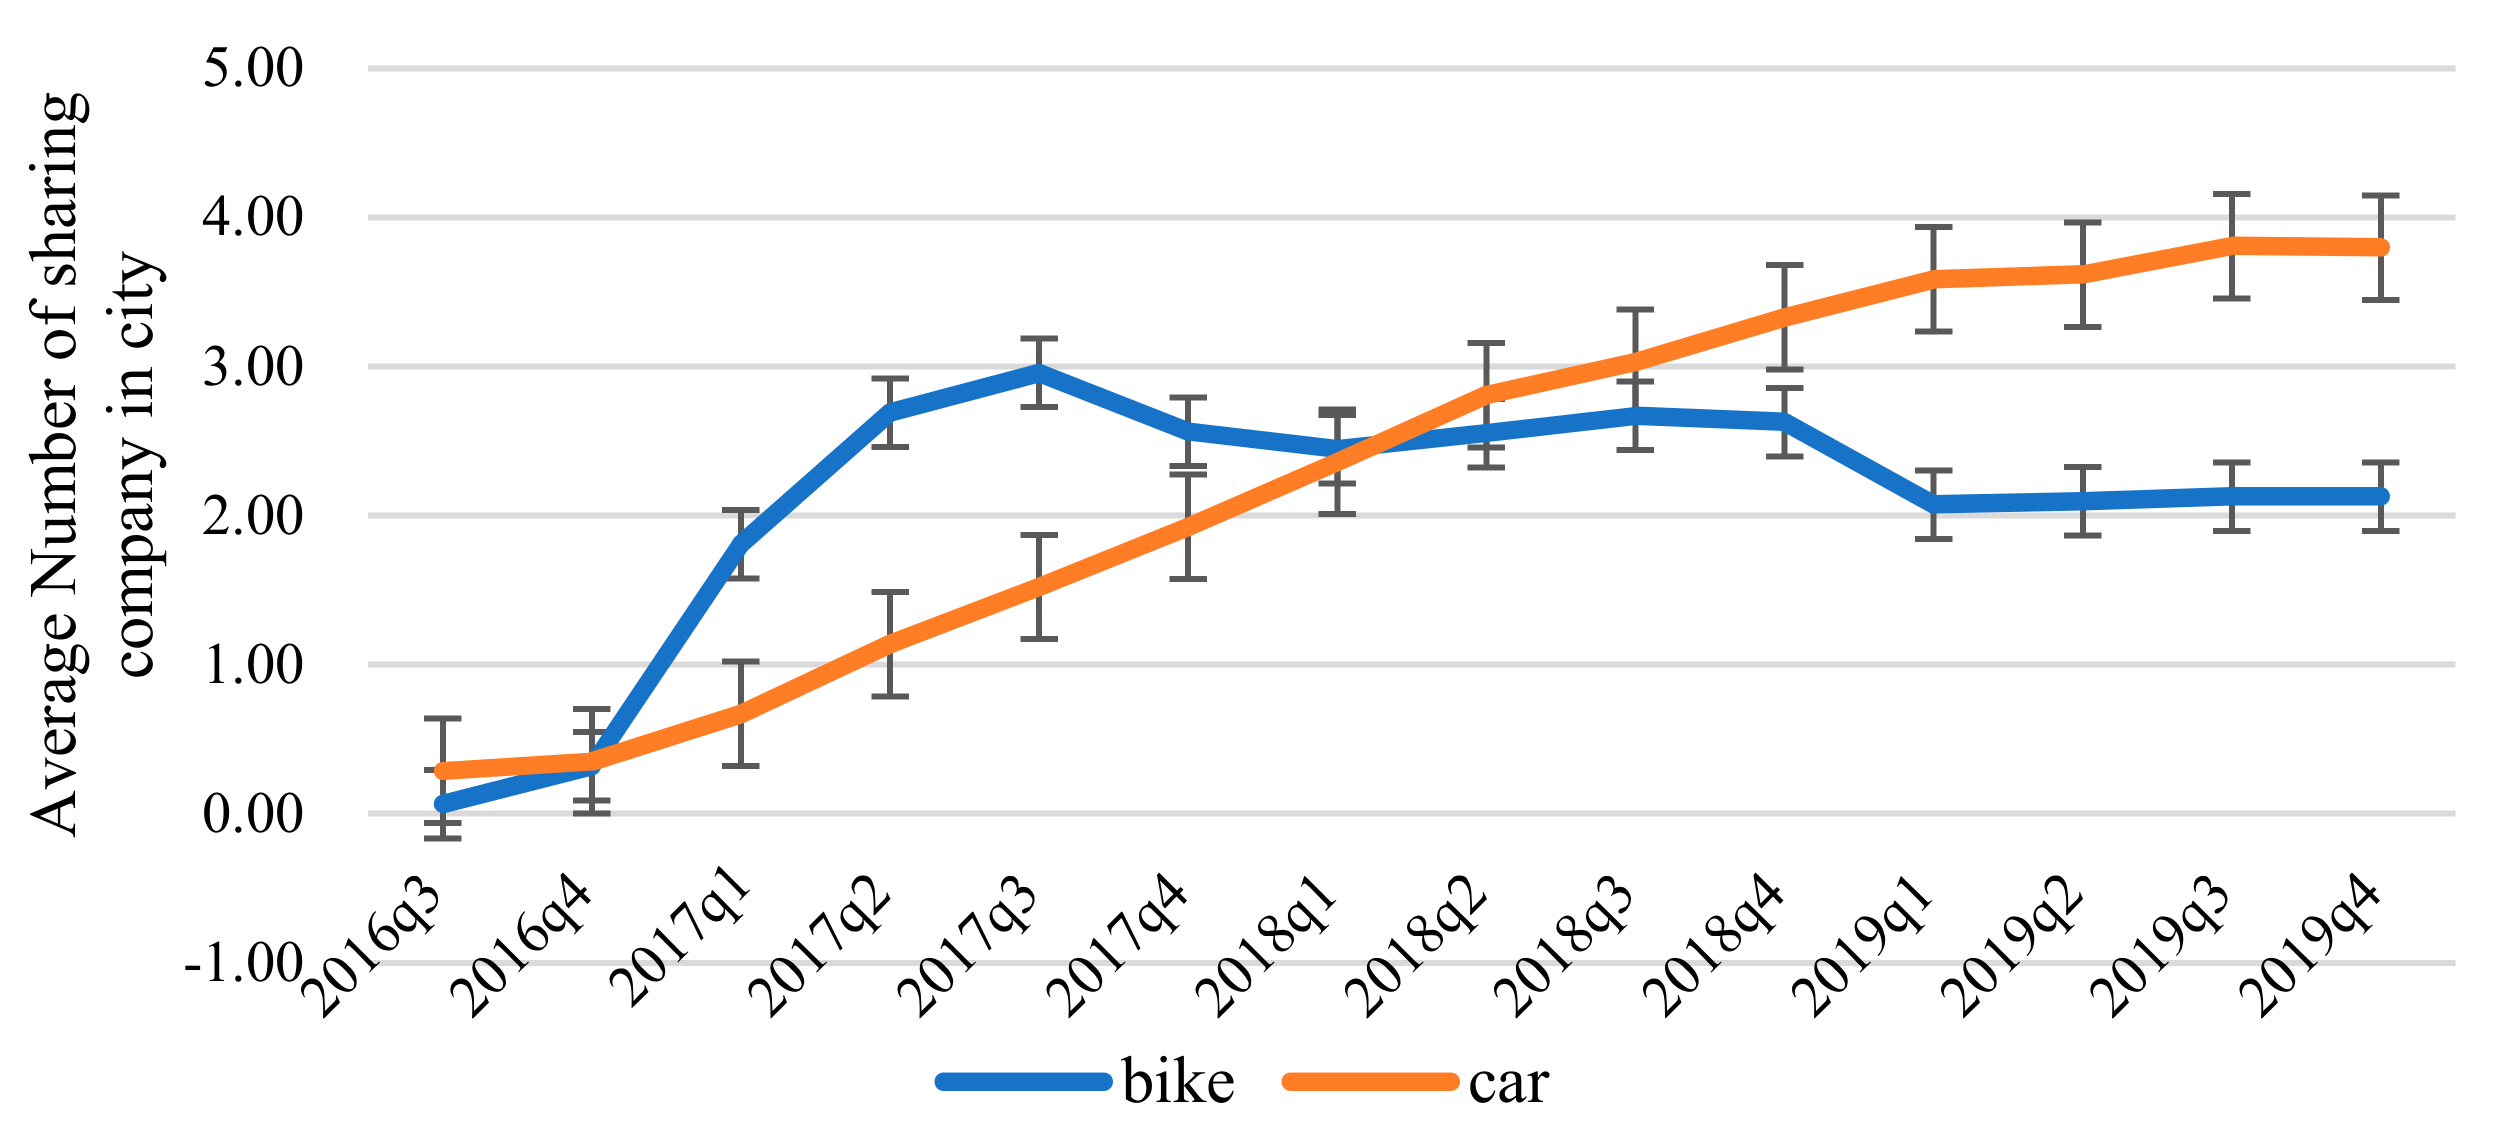
Figure 2 shows that the number of bike-sharing enterprises increased rapidly and then declined. There are on average more than two shared bicycle enterprises in operation in each city. Shared cars started operating later than shared bicycles, but they have experienced a steady growth. At present, there are on average more than three CS enterprises in operation in each city (The sample source of the data in Figure 1 and Figure 2 is consistent with the later econometric model). It can be seen from the length of the error bar in Figure 2 that the difference in the distribution of shared cars in different cities is larger than that of shared bicycles; and shared mobility has begun to reshape the overall transportation industry in China.
For control variables, drawing on previous studies and considering the availability of data, we found that the factors that affect congestion were multitudinous and complicated. As such, we select seven control variables that have already been proved by previous research as an effective impactor on traffic congestion: (1) The gross regional domestic product (GDP) reflects the development level of the city economy; (2) the regional resident population (RRP) reflects residents’ actual mobility demand; (3) the income of employees on the job (INC) measures the income level in different cities; (4) public mobility passengers (PMP) reflects the scale of public transportation, including the passenger volume of buses, trams and rail transit (subway); (5) the regional vehicle ownership quantity (VOQ) reflects the number of private cars in the city; (6) the regional temperature (TEM) reflects the dependence of climate change on transportation; and (7) the length of the road (LEN) reflects the area’s traffic infrastructure. It is worth noting that road construction, as a kind of infrastructure, is a prerequisite for the capacity of the road network. There are many technical factors, such as road network density and control methods, which will also affect the road network capacity, but this article focuses on the change of traffic mode, so other technical factors have not been considered for the time being. We will briefly discuss these technical factors in the last chapter.
The data used in this paper are collected from China’s Urban Statistical Yearbook, Wind Database, internet news and reports. We use the list of 94 congested cities published by AutoNavi Maps (Amap—China’s leading digital map content, navigation and location service solution provider) as a cross-sectional sample, and this list covers 21 provinces, #four municipalities and three autonomous regions of China, with a time series of 14 seasons from the third quarter of 2016 to the fourth quarter of 2019. Choosing the quarter as data time unit is for the following three main reasons. First, the number of shared travel enterprise layouts changes little at a lower frequency; second, due to the limitations on research conditions, the specific city layout time disclosed by many enterprises is only accurate to the level of month or season; third, seasonal factors may affect people’s use of car-sharing and bike-sharing. For example, the frequency of bike-sharing behavior may be reduced in northern China in winter, so the quarterly frequency can reflect the time fixing effect. The total sample size is 1316. To keep the analysis consistent, a small number of missing values are processed by the moving average method. In addition, to eliminate the influence of heteroscedasticity and dimensional units, this paper performed logarithmic processing for CDI and control variables.

3.2. Model Establishment

Compared with the traditional econometric regression model, the spatial econometric model incorporates the spatial geographical relationship into the model construction and measures the influence of independent variables on the dependent variables under the hypothesis of spatial correlation. Currently, many studies have primarily used the spatial autoregressive model (“SAR”), spatial error model (“SEM”) and spatial Durbin model (“SDM”) [46]. As the spatial effect of urban transportation may have both spatial autoregressive and random error impacts, this paper adopts a generalized spatial econometric model that includes both the spatial autoregressive effect and random error effect, namely, the spatial autocorrelation model (SAC model). The SAC model is the SARAR model considering time effect. On the one hand, the model reduces endogeneity; on the other hand, it also includes the general situation that the SARAR model considers both spatial autoregressive and spatial error effects. This model comprehensively reflects the spatial effects constructed using spatial autocorrelation and spatial error terms under the condition of panel data. The SAC model is constructed as follows:
l n C o n g t i t = β 0 + ρ W l n C o n g t i t + β 1 B S i t + β 2 C S i t + β k l n X c o n t r o l i t , k + ε i t
W i j = 0 , i = j 1 d 2 ,   i j
ε i t = γ W ε i t + μ i t ,       μ i t ~ N 0 , 2 I n
In Equation (1), ρ represents the spatial autoregressive coefficient that measures the spatial lag effect; and X c o n t r o l i t , k are k control variables. Equation (2) shows the selection of spatial weight (“ W i j ”). Considering that traffic congestion is greatly affected by geographical location, geographical distance is selected as the measurement for the spatial matrix and the square reciprocal of spatial geographical distance after row standardization is used as the spatial weight matrix in this paper. Equation (3) shows the generation process of the disturbance term. γ represents the spatial error coefficient that measures the spatial correlation effect of the error term.
Typically, B S i t   a n d   C S i t , as the core independent variables, represent the number of brands of shared bikes and cars in operation in city i at time t. We differentiate the numbers of shared bikes and shared cars because the service forms and the influence mechanisms of the two shared mobility services on urban traffic are quite different.
In addition, we choose the spatial Durbin model (“SDM”) to reflect the spatial effect from neighboring cities, and this model can avoid endogeneity issues. Equation (4) shows the SDM, and W X B S and W X C S indicate the influence of neighbors’ shared bicycles and car enterprises. Variable δ 1 and δ 2 reflect the spatial proximity effect of shared bicycles and cars.
l n C o n g t i t = β 0 + ρ W l n C o n g t i t + β 1 B S i t + β 2 C S i t + β k l n X c o n t r o l i t , k + δ 1 W X B S + δ 2 W X C S + δ k W l n X c o n t r o l i t , k + ε i t
To address the heteroscedasticity in this model, we adopted generalized spatial two-stage least squares to estimate the parameters so as to improve the robustness of the estimation results. Using Haussmann’s test, we selected a double fixed effects model to eliminate the estimation bias caused by individual effects and time effects.

4. Results

4.1. Descriptive Statistics

The descriptive statistics of the variables are shown in Table 3. The average value of the city’s congestion index is 1.6, indicating that the commuting time of the sample cities is generally 1.6 times that of free flow, and the highest value is 2.19. The average number of shared bikes and car enterprises is approximately two, but there is a large disparity among cities, with more than 10 times the difference for some cases.
According to the distribution agglomeration of the congested cities, we extracted variables in the BTH region, the YRD region and the PRD region from among the 94 cities and obtained descriptive statistical results in detail. The results are shown in Table 4. Compared with the BTH region and PRD region, the YRD region has the lowest congestion index, but the average value is also over 1.5. The BTH region has the highest number of shared bicycles, and shared cars are most distributed in the PRD region.
To reveal the spatial distribution of city congestion and shared mobility, we use the standard deviation ellipse method to report the differences among the BTH region, YRD region and PRD region from the perspective of geographic elements. Using the changes in the major axis, minor axis, and azimuth, this study preliminarily explored the direction, concentration, and spread of the spatial geographic distribution. Figure 3 shows the spatial distribution change of traffic congestion. From 2016 to 2019, the congestion in the three regions did not show obvious spatial changes. The congestion in the BTH region is primarily concentrated in the area of Beijing, Tianjin, and Langfang. The congestion in the YRD region is primarily concentrated in the area of Nanjing, Changzhou, Huzhou and Shaoxing. Both BTH regions of the YRD region have a strong centripetal force. The standard deviation ellipse of the PRD region has a shorter long axis that is closer to a circle, indicating that the directional concentration is not obvious when compared to that in the other two regions, and the centripetal force is weaker.
Figure 4 shows the spatial distribution change of shared mobility. The shared bicycles and cars in the BTH region are basically the same as the congestion distribution in terms of direction, but the centripetal force of the shared cars is stronger. The shared cars and bicycles in the YRD region area have changed significantly in time and space. In 2016, the distribution direction of shared bicycles was from Shanghai to Ningbo city, and the distribution direction of shared cars was from Shanghai to Hangzhou. In 2019, the distribution direction of shared bicycles and cars rotated counterclockwise, which is basically consistent with the congestion index. The distribution range significantly expanded in 2019. The distribution of shared bicycles in the PRD region is concentrated in Dongguan and Zhongshan, and the centripetal force of shared bicycles is stronger than that of shared cars.

4.2. Spatial Correlation Test

The standard deviation and ellipses discussed above show intuitive spatial relationships. Next, the spatial correlation is precisely tested before estimating parameters. Moran’s I is widely adopted to analyze the global spatial correlation, and we calculated Moran’s I of CDI in 94 cities to reflect the spatial autocorrelation. The calculation formula is as follows:
I = i = 1 n i n w i j Y i Y ¯ Y j Y ¯ s 2 i = 1 n j = 1 n w i j
where s 2 = i = 1 n Y i Y ¯ 2 n is the sample variance; n indicates the total number of samples; Y i represents the traffic CDI of cityi, and w i j represents the spatial weight matrix. The results show that the estimated values of the Moran Index for traffic congestion in various cities in China from the third quarter of 2016 to the fourth quarter of 2019 are all positive and pass the 1% significance test, indicating that traffic congestion in Chinese cities has a significant positive spatial autocorrelation, that is, a significant spatial dependence feature (Table 5).
To further explore the spatial agglomeration near a single city, we select the second quarter of 2018 with the highest concentration in the global Moran Index as a representative and draw a Moran scatter plot of urban traffic congestion in the second quarter of 2018, as shown in Figure 5. Traffic congestion has significant spatial agglomeration, and cities are primarily concentrated in the first quadrant (HH) and third quadrant (LL), which also intuitively proves that there is an obvious positive spatial correlation among traffic congestion in various cities in China. Specifically, the cities located in the first quadrant (HH) include Zhanjiang, Yinchuan, Chongqing, Liuzhou, Nanning, Lanzhou, Xianyang, Xian, Qingyuan, Foshan, Guilin, et al. These cities are mostly located in China’s Sichuan Basin, Yunnan-Guizhou region, showing a spatial agglomeration of high–high positive correlation. The cities located in the third quadrant (LL) include Nantong, Yancheng, Zhenjiang, Huzhou, Taizhou, Suzhou, Wuxi, Xiamen, Chuzhou, Quanzhou, Shaoxing, Hangzhou, Jiaxing, Wuhu. These cities are mainly located in the eastern region of China, demonstrating a spatial agglomeration of low–low positive correlation. In addition, a few cities are located in the second and fourth quadrants, such as Sanya, Baoding, Deyang, Zhaoqing, and Ordos.
Before we determine the final estimation method of the model, LM and robust LM are used to test whether the model has a spatial lag effect and spatial error effect statistically. As shown in Table 6, both the spatial lag effect and the spatial error effect passed the significance test, which proves the feasibility and rationality of selecting the SAC model and SDM.

4.3. Results Discussion

4.3.1. Overall Analysis

The regression results are shown in Table 7. The significant spatial lag effect ( ρ in the SAR model) reflects that traffic congestion in a city will be badly influenced by the congestion level in the surrounding area. The significant spatial error effect ( γ in the SEM model) means that traffic congestion in a city also has a spatial spillover effect on the surrounding area. The result of the SAC model shows that the more congested the surrounding cities are, the greater congestion a city will experience. At the same time, the spatial spillover effect caused by its own congestion shows a negative polarization effect. The SDM results illustrate that the layout of shared bicycles in a city will affect the traffic congestion in itself and the surrounding cities.
In these four models, the regression results of BS and CS are always stable, which indirectly proves the robustness of the model construction. Among them, BS has significantly alleviated traffic congestion in the city, and each additional bicycle-sharing company layout will cause a 0.2% reduction in traffic congestion. However, the CS currently operated in each city has no significant impact on traffic congestion.
For control variables, economic development and population growth will always aggravate traffic congestion, and its influence coefficient is higher than that of shared bicycles. This result indicates that the use of shared bicycles does not sufficiently compensate for the traffic congestion caused by economic development. In particular, cities with more public transport passengers have less traffic congestion, so encouraging the use of public transport is a good move. Comparing the results of our study and the literature, we have found that some control variables have consistent influence on traffic congestion, such as GDP, RRP, and LEN. Meanwhile, VOQ [39] and INC in the literature [33,38] have a significant positive effect on traffic congestion, while the coefficients are not significant in our research. PMP and TEM have no significant effect on traffic congestion in the literature, but these two variables have significant negative effect on traffic congestion in our study.

4.3.2. Decomposition of Spatial Effect

To evaluate the spillover effect of shared mobility on CDI, we decomposed the total spatial effect into direct effects and indirect effects by using the SAC and SDM models. The results are shown in Table 8. The coefficient of car sharing does not pass the test, which is consistent with the above results.
The model results of SAC and SDM both show that the direct effect of shared bicycles is negative, but the indirect effect is positive, which indicates that shared bicycles alleviated the traffic congestion in the local city to a certain extent, but significantly increased the congestion in adjacent areas, which is consistent with the WX-BS parameter in SDM (Table 7). According to LeSage and Pace (2009) [47], the direct effect represents the influence of the independent variable in one local area on the dependent variable of the same area, while the indirect effect represents the influence of the independent variable of the neighboring area on the dependent variable in the local area. From Table 7 and Table 8, the traffic congestion in a local region will be reduced because of the layout of bicycle-sharing enterprises in that region, but shared bicycles in this area will increase traffic congestion in neighboring areas through spatial spillover effects, while shared bicycles in neighboring cities will in turn increase traffic congestion in the area. This finding is very interesting. Considering China’s transportation industry development, it may be explained by the following reasons: (1) when a city deploys shared bicycles to effectively alleviate traffic congestion, surrounding cities may follow suit; (2) in order to expand market share quickly, shared bicycle companies will also choose the strategy of rapid expansion to the surrounding cities. Therefore, it is risky to launch shared bicycles considering the above two reasons, as cities tend to over-supply transportation resources because of inadequate assessment of their own traffic situation, and these idle resources will bring about many problems. Many Chinese cities have witnessed city streets covered with piles of dusty idling bikes that blocked the way of crosswalks. This not only fails to take technical advantage of shared bicycles, but also exacerbates the inefficiency of transportation. The coefficient of car-sharing does not pass the test, which is consistent with the above results.
In terms of the control variables, the direct effect coefficient of the urban economic development level is 0.013, and the indirect effect coefficient is −0.004. GDP has significantly increased traffic congestion in the local city, but the negative coefficient indicates that it will play a certain role in alleviating congestion in adjacent areas through the spatial spillover effect. A city with a relatively high GDP will increase the traffic operation burden of the local city, but the adsorption effect may reduce the population and industrial activity of the surrounding cities to a certain extent, thereby reducing the traffic pressure on the city and reducing the traffic jams in surrounding cities. Population growth has a similar effect to GDP.
The passenger volume of public transportation can directly alleviate traffic congestion in the area, and at the same time it has a slight positive spatial spillover effect on the surrounding area. The more passenger traffic in urban public transportation, the more people are willing to use public transportation to travel in the city, thereby alleviating traffic congestion directly. However, cities with highly developed transportation systems gather a large amount of technology and resources, which may lead to the relatively backward development of public transportation systems in surrounding cities and inevitably increase the current pressure on roads, causing congestion. Therefore, in the future, government should attach great importance to the linkage of urban transportation infrastructure and the driving effect on surrounding areas to prevent excessive absorption of resources in a central city and negative impact on surrounding cities.
Under the SAC model, the spatial decomposition effects of the four variables of INC, VOQ, TEM, LEN are not significant.

4.3.3. Heterogeneity Analysis of Spatial Effects

The above analysis has verified the effect of shared mobility on reducing urban traffic congestion from the perspective of the entire region. However, according to the standard deviation ellipse in Figure 3 and Figure 4, and the scatter plot distribution in Figure 5, the characteristics of spatial dependence are significantly different in various regions, and the economic development level of different urban areas in China is also diverse. Therefore, in this sector, the weight matrix of the spatial geographical distance is further divided into three regions to analyze the spatial heterogeneity of the impact of shared mobility on traffic congestion. The results are shown in Table 9.
BS performed best in the PRD region and significantly reduced the congestion problem in the region. However, this effect was not significant in the YRD region and BTH region. CS has no significant impact on the BTH region, but it has aggravated congestion in the YRD region and eased congestion in the PRD region. These results show that there are large differences in the performance of shared cars in different regions.
In addition, the congestion in the YRD region and PRD region presents a significant spatial lag effect, which means that it is greatly affected by traffic congestion in the surrounding area.

4.4. Robustness Test

To verify the robustness of the results, we adopted two methods, i.e., replacing the spatial matrix, and tailing test.
The spatial weight matrix W changes from the reciprocal matrix of the distance squared to the spatial adjacency matrix. That is, using the city as the unit, if the cities are adjacent or bordering, the value of the unit is 1, otherwise, it is 0; row standardization is also conducted. In the tailing test, we narrowed the tail to 98% to judge the influence of the outlier’s value.
Due to the limited space of this paper, we use SDM as an example to report the robustness results. The adjusted SDM model results are shown in Table 10. It can be seen that the coefficient and significance level of shared bikes and cars exhibited little change, and the coefficient and significance level of other control variables also experienced a small change range in two robust tests. These observations prove the robustness of the aforementioned results.

5. Conclusions and Recommendation

5.1. Conclusions

Based on the spatial linkage of shared mobility and transportation, this paper aims to examine the relationship between shared mobility and traffic congestion, expanding the scope of previous studies from a single city or a single service to 94 cities in China. According to references [32,33], bike sharing has a mixed effect on traffic congestion, and Uber, as a shared car enterprise, significantly decreases traffic congestion [38]. Our research has different findings. In addition, previous research investigates perspectives on the spatial mobility of transport itself [13,14,15,16]. However, the spatial relevance of economic development between different cities directly depends on the local transport infrastructure. As such, this paper fully considers the spatial linkage of regional traffic congestion and the spatial layout of shared mobility enterprises.
The conclusions are as follows:
  • Traffic congestion has significant spatial agglomeration, and there is an obvious positive spatial correlation in various cities in China. The congestion in different regions is primarily concentrated in different directions and centripetal forces, and it did not show obvious spatial changes from 2016 to 2019. The shared bicycles and cars in the same region are basically the same as the congestion distribution in terms of direction, but the centripetal force of the shared cars and shared bicycles are different in each region.
  • Of the two primary services of shared mobility, only shared bicycles currently play a significant role in alleviating traffic congestion in Chinese cities. However, this positive effect of bike sharing is not strong enough to offset the congestion problems caused by rising incomes and flourishing economic activities. Hence, there is still considerable room for improvement in regard to shared mobility. Although the car sharing services have relied on new energy vehicles, internet technology and big data algorithms, the spirit of sharing is not fully embodied if there is no essential difference between shared cars and private cars, taxis and other traditional rental cars.
  • As for direct and indirect effects, the brand layout of bike sharing has a significant spillover effect. Thus, traffic congestion in cities is affected not only by local bike sharing itself but also by the layout of bike sharing in the surrounding area. GDP and RRP significantly aggravate traffic congestion in local areas, while to some extent reducing significantly the traffic congestion in adjacent areas through the spatial spillover effect. The passenger volume of public transportation can directly alleviate traffic congestion in the area, and at the same time it has a slight positive spatial spillover effect on the surrounding area.
  • From the viewpoint of spatial heterogeneity, bike sharing performed best in the PRD region and helped to alleviate the congestion in the region, but this effect was not obvious in the YRD region and BTH region. Car sharing has aggravated congestion in the YRD region and eased congestion in the PRD region. These results demonstrate that there are disparities in the performance of shared cars among different regions. In addition, the congestion of the YRD region and PRD region presents a significant spatial lag effect, which means that it is greatly affected by traffic congestion in the surrounding area.

5.2. Recommendation

In light of the status quo of shared mobility, the following recommendations are proposed according to the conclusions of this study:
(1)
For the sustainable development of the shared mobility industry, it is imperative to avoid the over-supply of shared bicycles and cars. The effective operation of shared transport tools relies on new energy vehicles and internet technology to refine the transportation structure. Shared transportation enterprises are suggested to put greater emphasis on improving the quality of shared services and offering reliable user-experience for customers.
(2)
To regulate the shared mobility industry, governments can issue mandates for the healthy growth of shared bicycles and cars in order to optimize the layout of the sharing company. If cities and regions have inadequate transportation infrastructures, the rapid growth of shared transport tools will worsen transportation congestion, which will take a toll on the traffic efficiency of a city. This study proves that the emergence of shared bicycles has effectively reduced urban congestion within a certain range, which also helps surrounding areas. Therefore, it is suggested that governments establish a targeted entry barrier based on the development of cities in various regions and promote the orderly operation of the shared industry to utilize its advantages of convenience and green-economy.
(3)
More attention in traffic efficiency should be given to the links between neighboring regions, and efforts should focus on strengthening technical cooperation among cities. Because of the existence of multiple spatial correlations in neighboring cities, governments in neighboring cities can make joint plans to alleviate traffic congestion and further promote green and coordinated development among cities. The cities in central and western urban regions should strengthen cooperation with the eastern regions and learn from their advanced experience.
This study takes the initial step in elucidating the spatial effect of the number of shared mobility enterprises at the city level and exploring the overall impact mechanism and regional heterogeneity of shared mobility on traffic congestion using the SAC and SDM models. The results provide a basis for the optimal layout and sustainable development of the shared mobility industry and offer references for local government. The spatial econometric method used in this article can also potentially be replicated and applied to other sustainable transportation issues. As a new type of transportation form based on artificial intelligence and the Internet, shared mobility is a topic of global concern. Therefore, managers of other cities can also analyze the spatial relationship between shared mobility and traffic congestion to find new spatial planning paths for the green and sustainable development of the local transportation industry.
From a technical perspective, the capacity of a road network depends on the network density, the redundancy of the network, the frequency of signal lights, the density of bus and streetcar lines, etc. For example, Wang and Kwan found that increase in road network density shortened the average length of road section and the overall driving distance [48]; Maecki and Iwan and Krylato, Puzach and Shatalova found that adjusting the operation cycle of urban traffic lights greatly improved the utilization efficiency of road network capacity [49,50,51]. These factors make measuring the relationship between congestion and shared mobility more difficult, so we hope that these technical factors will be addressed in future research.
One of the major limitations of this article is that data have not been obtained from all Chinese cities, and the number of shared mobility companies cannot fully reflect the scale of shared mobility. Because shared bicycles and shared cars in China belong to independent private enterprises, the services they provide are classified as a kind of business-to-customer transaction. The total numbers of rentals, customers and vehicles are announced once a year, but the quarterly data for each city is not released. These enterprises are unwilling to release data to public platforms for fear of competition. We hope to use personal behavioral data in future research on shared mobility, such as ridesharing orders, shared bicycle use times, shared car mileage, etc.

Author Contributions

Conceptualization, J.L.; methodology, J.L.; software, M.M. and W.R.; validation, M.M. and W.R.; formal analysis, J.L. and X.X.; investigation, M.M.; resources, J.L.; data curation, J.L. and M.M.; writing—original draft preparation, J.L.; writing—review and editing, X.X.; visualization, J.L.; supervision, J.L.; project administration, J.L.; funding acquisition, J.L. All authors have read and agreed to the published version of the manuscript.

Funding

This research was funded by The National Natural Science Foundation of China (No. 71903025).

Institutional Review Board Statement

Not applicable.

Informed Consent Statement

Not applicable.

Data Availability Statement

All data generated or analyzed during this study are included in this published article. The data presented in this study are available on request from the corresponding author.

Conflicts of Interest

The authors declare no conflict of interest.

Nomenclature

SymbolExplanationQuantity
BSThe number of bike-sharing enterprisesnumber
CSThe number of car-sharing enterprisesnumber
COVID-19Corona Virus Disease 2019-
GSEMGeneralized spatial econometric model-
BTH regionBeijing-Tianjin-Hebei region-
YRD regionYangtze River Delta region-
PRD regionPearl River Delta region-
CDICongestion delay index-
GDPGross regional domestic product100 million yuan
RRPRegional resident populationTen Thousand of people
INCIncome of employees on the jobRMB yuan
PMPPublic mobility passengersTen Thousand of people
VOQRegional vehicle ownership quantitynumber
TEMRegional temperature°C
LENLength of the roadkilometer
SARSpatial autoregressive model-
SEMSpatial error model-
SDMSpatial Durbin model-
SACSpatial autocorrelation model-

References

  1. Min, Y.A.; Baek, Y.T. A Study on the Application of Block Chain Ethereal Technology to Activate Digital Contents Trading as sharing economy. J. Korean Soc. Comput. Inf. Inf. Technol. 2018, 23, 73–80. [Google Scholar]
  2. Machado, C.; Hue, N.; Berssaneti, F.T.; Quintanilha, J.A. An Overview of Shared Mobility. Sustainability 2018, 10, 4342. [Google Scholar] [CrossRef] [Green Version]
  3. Millar, C.; Lockett, M.; Ladd, T. Disruption: Technology, innovation and society. Technol. Forecast. Soc. Chang. 2018, 129, 254–260. [Google Scholar] [CrossRef]
  4. Dias, F.F.; Lavieri, P.S.; Garikapati, V.M.; Astroza, S.; Pendyala, R.M.; Bhat, C.R. A behavioral choice model of the use of car-sharing and ride-sourcing services. Transportation 2017, 44, 1307–1323. [Google Scholar] [CrossRef]
  5. Storey, V.C.; Song, I.-Y. Big data technologies and Management: What conceptual modeling can do. Data Knowl. Eng. 2017, 108, 50–67. [Google Scholar] [CrossRef]
  6. Shaheen, S.; Chan, N.; Bansal, A.; Cohen, A. Shared Mobility: A Sustainability and Technologies Workshop—Definitions, Industry Developments, and Early Understanding; Transportation Sustainability Research Center, University of California, Berkeley and California Department of Transportation: Richmond, CA, USA, 2015; p. 30. [Google Scholar]
  7. Shaheen, S.; Cohen, A.; Zohdy, I. Shared Mobility: Current Practices and Guiding Principles; U.S. Department of Transportation, Federal Highway Administration: Washington, DC, USA, 2016; p. 120.
  8. Muley, D.; Shahin, M.; Dias, C.; Abdullah, M. Role of transport during outbreak of infectious diseases: Evidence from the past. Sustainability 2020, 12, 7367. [Google Scholar] [CrossRef]
  9. Torrisi, V.; Campisi, T.; Inturri, G.; Ignaccolo, M.; Tesoriere, G. Continue to share? An overview on Italian travel behavior before and after the COVID-19 lockdown. In AIP Conference Proceedings; AIP Publishing LLC.: Melville, NY, USA, 2021; Volume 2343, p. 090010. [Google Scholar]
  10. Abdullah, M.; Ali, N.; Javid, M.A.; Dias, C.; Campisi, T. Public Transport versus Solo Travel Mode Choices during the COVID-19 Pandemic: Self-reported Evidence from a Developing Country. Transp. Eng. 2021, 5, 100078. [Google Scholar] [CrossRef]
  11. Wang, Z. Research on the Construction of Intelligent Transportation Integrated Management Information Service Platform. Innov. Sci. Technol. 2019, 19, 79–82. [Google Scholar]
  12. Wei, Y.; Wang, Y.; Chang, Y.; Shi, B.; Shao, K. Research on the construction of “u-smart transportation system” under Artificial Intelligence technology. IOP Conf. Ser. Mater. Sci. Eng. 2018, 490, 042002. [Google Scholar] [CrossRef]
  13. Fang, F.; Tian, G.; Xiao, H. The impact and the mechanism of infrastructure on China’s economic growth—An extended Barro Growth Model. Econ. Theor. Bus. Manag. 2020, 12, 13–27. (In Chinese) [Google Scholar]
  14. Lu, B.; Zhou, X.; Song, D.; Wang, S. The Spatial Effect of Highway Traffic Accessibility in Northeast China. Manage. Rev. 2019, 31, 3–17. (In Chinese) [Google Scholar]
  15. Hu, Y.; Li, H.C. Measurement of the level of transportation hub and its spatial spillover effect—Spatial econometric analysis based on panel data of Chinese cities. Chin. Ind. Econ. 2015, 5, 32–43. (In Chinese) [Google Scholar]
  16. Wang, Z.; Li, M.; Jiang, J. The impact of traffic accessibility improvement on urban economic growth—Spatial econometric analysis based on DMSP/OLS night satellite lighting data of 283 cities. Chin. Econ. Stud. 2020, 5, 84–97. (In Chinese) [Google Scholar]
  17. Guo, P.; Lin, X.; Huang, Y.; Tu, S.; Bai, X.; Yang, Y.; Ye, L. Bike-sharing: Collaborative governance in Internet technology and public services. J. Public Manag. 2017, 14, 1–10. (In Chinese) [Google Scholar]
  18. Zhang, L.; Zhang, J.; Duan, Z.-Y.; Bryde, D. Sustainable bike-sharing systems: Characteristics and commonalities across cases in urban China. J. Clean. Prod. 2015, 97, 124–133. [Google Scholar] [CrossRef]
  19. Yang, X.-H.; Cheng, Z.; Chen, G.; Wang, L.; Ruan, Z.-Y.; Zheng, Y.-J. The impact ofa public bicycle-sharing system on urban public transport networks. Transp. Res. Part A Policy Pract. 2018, 107, 246–256. [Google Scholar] [CrossRef]
  20. Campbell, K.B.; Brakewood, C. Sharing riders: How bike sharing impacts bus ridership in New York City. Transp. Res. Part A Policy Pract. 2017, 100, 264–282. [Google Scholar] [CrossRef]
  21. Macioszek, E.; Świerk, P.; Kurek, A. The Bike-Sharing System as an Element of Enhancing Sustainable Mobility—A Case Study based on a City in Poland. Sustainability 2020, 12, 3285. [Google Scholar] [CrossRef] [Green Version]
  22. Jin, F.; Cheng, Y.; Li, X.; Hu, Y.-J. The Effect of Dockless Bike-Sharing on Public Transportation: An Empirical Study. SSRN Electron. J. 2018, 18–81. [Google Scholar] [CrossRef]
  23. Cheng, L.; Mi, Z.; Coffman, D.; Meng, J.; Liu, D.; Chang, D. The Role of Bike Sharing in Promoting Transport Resilience. Netw. Spat. Econ. 2021, 4, 1–19. [Google Scholar] [CrossRef]
  24. Fan, Y.; Zheng, S. Dockless bike sharing alleviates road congestion by complementing subway travel: Evidence from Beijing. Cities 2020, 107, 102895. [Google Scholar] [CrossRef]
  25. Radzimski, A.; Dzicielski, M. Exploring the relationship between bike-sharing and public transport in Poznań, Poland. Transp. Res. Part A Policy Pract. 2021, 145, 189–202. [Google Scholar] [CrossRef]
  26. Lan, J.; Zhu, D. Study on the acceptance and use behaviour of sustainable transportation consumption-based on the investigation of Shanghai car sharing. China Popul. Resour. Environ. 2016, 26, 98–105. (In Chinese) [Google Scholar]
  27. Noland, R.B.; Ishaque, M.M. Smart Bicycles in an Urban Area: Evaluation of a Pilot Scheme in London. J. Public Transp. 2006, 9, 71–95. [Google Scholar] [CrossRef]
  28. Fishman, E.; Washington, S.; Haworth, N. Bike share’s impact on car use: Evidence from the United States, Great Britain, and Australia. Transp. Res. Part D Transp. Environ. 2014, 31, 13–20. [Google Scholar] [CrossRef] [Green Version]
  29. Ahillen, M.; Mateo-Babiano, D.; Corcoran, J. Dynamics of bike-sharing in Washington, D.C. and Brisbane, Australia: Implications for policy and planning. Int. J. Sustain. Transp. 2016, 10, 441–454. [Google Scholar] [CrossRef]
  30. Zhang, Y.; Zhang, Y. Exploring the Relationship between Ridesharing and Public Transit Use in the United States. Int. J. Environ. Res. Public Health 2018, 15, 1–23. [Google Scholar] [CrossRef] [PubMed] [Green Version]
  31. Jochem, P.; Ewald, D.L.; Ensslen, A.; Fromm, H. Does free-floating car sharing reduce private vehicle ownership? The case of SHARE NOW in European cities. Transp. Res. Part A Policy Pract. 2020, 141, 373–395. [Google Scholar] [CrossRef] [PubMed]
  32. Hamilton, T.L.; Wichman, C.J. Bicycle infrastructure and traffic congestion: Evidence from DCs Capital Bikeshare. J. Environ. Econ. Manage. 2018, 87, 72–93. [Google Scholar] [CrossRef]
  33. Wang, M.; Zhou, X. Bike-sharing systems and congestion: Evidence from US cities. J. Transp. Geogr. 2017, 65, 147–154. [Google Scholar] [CrossRef]
  34. Yang, T.; Li, Y.; Zhou, S.; Zhang, Y. Dynamic Feedback Analysis of Influencing Factors and Challenges of Dockless Bike-Sharing Sustainability in China. Sustainability 2019, 11, 4674. [Google Scholar] [CrossRef] [Green Version]
  35. Mitra, R.; Ziemba, R.A.; Hess, P.M. Mode Substitution Effect of Urban Cycle Tracks: Case Study of a Downtown Street in Toronto, Canada. Int. J. Sustain. Transp. 2016, 11, 248–256. [Google Scholar] [CrossRef]
  36. Chevalier, A.; Charlemagne, M.; Xu, L. Bicycle acceptance on campus: Influence of the built environment and shared bikes. Transp. Res. Part D Transp. Environ. 2019, 76, 211–235. [Google Scholar] [CrossRef]
  37. Jacobson, S.H.; King, D.M. Fuel saving and ridesharing in the US: Motivations, limitations, and opportunities. Transp. Res. Part D Transp. Environ. 2009, 14, 14–21. [Google Scholar] [CrossRef]
  38. Li, Z.; Hong, Y.; Zhang, Z. Do On-demand Ride-sharing Services Affect Traffic Congestion? Evidence from Uber Entry. SSRN Electron. J. 2016, 1–55. [Google Scholar]
  39. Hang, C.; Liu, Z.; Wang, Y.; Hu, C.; Su, Y.; Dong, Z. Sharing diseconomy: Impact of the subsidy war of ride-sharing companies on urban congestion. Int. Logistics Res. Appl. 2019, 22, 491–500. [Google Scholar] [CrossRef]
  40. Yuan, Y.; Xu, G.; Chen, X.; Jia, J. Study on the interactive mechanism of urban traffic congestion and air pollution: A big data analysis based on DiDi Chuxing. J. Manage. Sci. Eng. 2020, 23, 54–73. (In Chinese) [Google Scholar]
  41. Wang, J.; Hu, Y.; An, S. Analysis of Traffic Demand in Urban Road Congestion Pricing. J. Quantitative Tech. Econ. 2003, 7, 44–49. (In Chinese) [Google Scholar]
  42. Xu, C.; Ou, G.L. Theoretical Basis and Policy Analysis on Congestion Charge. China Ind. Econ. 2012, 12, 18–30. (In Chinese) [Google Scholar]
  43. Wang, F.; Li, S. The Effect of Transport Accessibility on Regional Specialization of Manufacturing: Empirical Research Based on Panel Data of Chinese Prefecture-level Cities. Manag. Rev. 2019, 31, 3–13. (In Chinese) [Google Scholar]
  44. Li, L.; Yan, L.; Huang, J. Transportation Infrastructure Connectivity and Manufacturing Industries in Peripheral Cities in China: Mark up, Productivity and Allocation Efficiency. Econ. Res. 2019, 54, 182–197. (In Chinese) [Google Scholar]
  45. Jia, P.; Hu, Y.; Yuan, S.; Kuang, H. A research on the comprehensive transportation efficiency and its spatial relevancy in China’s provinces. Sci. Res. Manag. 2020, 41, 219–229. (In Chinese) [Google Scholar]
  46. Chen, Q. Advanced Econometrics and STATA Application, 2nd ed.; Higher Education Press: Beijing, China, 2014; pp. 575–598. [Google Scholar]
  47. LeSage, J.; Pace, R.K. Introduction to Spatial Econometrics; CRC Press: Boca Raton, FL, USA, 2009. [Google Scholar]
  48. Wang, S.; Yu, D.; Kwan, M.P.; Zheng, L.; Miao, H.; Li, Y. The impacts of road network density on motor vehicle travel: An empirical study of Chinese cities based on network theory. Transp. Res. Part A Policy Pract. 2020, 132, 144–156. [Google Scholar] [CrossRef]
  49. Maecki, K.; Iwan, S. Modeling traffic flow on two-lane roads with traffic lights and countdown timer. Transp. Res. Procedia 2019, 39, 300–308. [Google Scholar] [CrossRef]
  50. Krylatov, A.; Puzach, V.; Shatalova, N.; Asaul, M. Optimization of traffic lights operation using network load data. Transp. Res. Procedia 2020, 50, 321–329. [Google Scholar] [CrossRef]
  51. Jiang, R.; Chen, J.-Y.; Ding, Z.-J.; Ao, D.-C.; Hu, M.-B.; Gao, Z.-Y.; Jia, B. Network operation reliability in a Manhattan-like urban system with adaptive traffic lights. Transp. Res. Part C 2016, 69, 527–547. [Google Scholar] [CrossRef]
Figure 1. Congestion Delay Index (CDI) of top 5 congestion cities in China (Data source: Wind database in China).
Sustainability 13 14065 g001
Figure 2. Operating trends of shared mobility enterprises in Chinese city.
Sustainability 13 14065 g002
Figure 3. (a) Standard deviation ellipse of traffic congestion in BTH Region; (b) Standard deviation ellipse of traffic congestion in YRD region; (c) Standard deviation ellipse of traffic congestion in PRD region, In this paper, the three base maps of BTH region, YRD region, and PRD region are all extracted from the entire map of China. The map of China comes from the standard map service website of the National Bureau of Surveying, Mapping and Geographic Information of China. The standard map service website is: http://bzdt.ch.mnr.gov.cn/ (accessed on 15 November 2021); the data used to draw the maps of BTH region, the YRD region, and the PRD region are all derived from the total data.
Sustainability 13 14065 g003
Figure 4. (a) Standard deviation ellipse of shared mobility in BTH Region; (b) Standard deviation ellipse of shared mobility in YRD region; (c) Standard deviation ellipse of shared mobility in PRD region (Note: The BTH Region and the PRD region do not form an elliptical distribution because most of the data in 2016 are 0).
Sustainability 13 14065 g004
Figure 5. Scatter plot of local Moran Values of CDI 2018q2.
Sustainability 13 14065 g005
Table 1. References to Bike-sharing and Car-sharing’s influence on traffic congestion.
EffectsBike-SharingCar-Sharing
Positive[34,35,36][39]
Negative[32][37,38]
Mixed/Unsure[33]-
Table 2. Summary of model methods in the literature.
ClassificationSpecific MethodsReferences
Econometric empirical researchSpatial regression model[19,25,35,43,44,45]
General regression model[20,22,23,24,30,32,33,37,38,39]
Other quantitative researches[26,29,31,40,42]
Other methodsCase study[21,27,28,36]
Qualitative analysis[17,18,34,41]
Table 3. Descriptive statistics of variables.
SymbolQuantityMeanStandard DeviationMinimum Maximum
CDI%1.600.131.272.19
BSnumber2.081.92015
CSnumber2.302.65012
GDP100 million yuan1629.691582.6495.1410,705.73
RRPTen Thousand of people719.60451.0275.303124.32
INCRMB yuan19,522.334377.0511,059.2561,366.00
PMPTen Thousand of people17,433.3130,360.04665.25183,738.30
VOQnumber386,985.80265,213.8038,424.501,475,800.00
TEM°C17.348.94−13.2029.90
LENkilometer2466.542251.64316.0414,027.95
Table 4. Descriptive statistics by regions.
RegionsVariableSampleMeanStandard DeviationMinimumMaximum
BTH regionCDI1261.600.121.402.00
BS1262.992.72015
CS1262.793.48012
YRD regionCDI2941.510.111.271.86
BS2942.102.03012
CS2942.192.3009
PRD regionCDI1261.620.121.381.93
BS1262.552.1009
CS1263.473.14012
Table 5. Global Moran Index Values of CDI from 2016 Q3 to 2019 Q4.
TimeMoran’s ITimeMoran’s I
2016Q30.216 ***2018Q20.287 ***
2016Q40.131 ***2018Q30.247 ***
2017Q10.148 ***2018Q40.267 ***
2017Q20.266 ***2019Q10.221 ***
2017Q30.239 ***2019Q20.218 ***
2017Q40.207 ***2019Q30.170 ***
2018Q10.184 ***2019Q40.223 ***
Note: *** means significant at the levels of 1%, p value less than 0.01.
Table 6. LM and Robust LM Test of spatial econometric model.
Test MethodTest MethodStatisticp Value
LM test
R-LM test
LMERR303.1460.000
LMLAG440.7590.000
R_LMERR5.8250.016
R_LMLAG143.438 0.000
Table 7. Results of Spatial Econometric Models.
VariableSARSEMSACSDM
BS−0.002 *−0.002 **−0.002 **−0.002 **
CS0.00060.00060.0005−0.0003
GDP0.010 *0.011 *0.012 *0.014 **
RRP0.0800.121 *0.130 *0.092
INC0.0090.004−0.001−0.024
PMP−0.021 **−0.022 **−0.021 **−0.025 ***
VOQ0.0040.0040.0009−0.004
TEM−0.001 **−0.001 **−0.0008−0.0003
LEN−0.004−0.002−0.003−0.003
WX-BS---0.006 **
WX-CS---0.0004
ρ 0.169 ***-−0.426 ***0.161 ***
γ -0.195 ***0.538 ***-
R20.0040.0010.0020.116
N1316131613161316
Log-L2515.8572517.1042523.1832542.2110
AIC−5009.713−5012.208−5022.365−5044.422
BIC−4952.707−4955.202−4960.177−4940.775
Note: *, **, *** are significant at the levels of 10%, 5% and 1%, respectively, and the following Table 8, Table 9 and Table 10 are the same.
Table 8. Spatial effect decomposition based on SAC model.
VariableSACSDM
Direct EffectIndirect EffectTotal EffectDirect EffectIndirect EffectTotal Effect
BS−0.002 **0.0007 **−0.001 **−0.002 **0.008 **0.006 *
CS0.0004−0.00010.00030.00020.0030.003
GDP0.013 **−0.004 *0.009 **0.014 **−0.023−0.009
RRP0.133 **−0.041 *0.092 **−0.023−0.686 ***−0.682 ***
INC−0.0010.0003−0.00070.0060.121 *0.127 *
PMP−0.021 ***0.007 **−0.015 **−0.026 ***−0.04−0.066 **
VOQ0.0009−0.00020.00070.0020.103 **0.105 **
TEM−0.00080.0002−0.00060.001−0.003 *−0.002 ***
LEN−0.0020.001−0.001−0.0060.0001−0.006
ρ −0.426 ***0.161 ***
γ 0.538 ***-
Note: *, **, *** are significant at the levels of 10%, 5% and 1%, respectively.
Table 9. Spatial heterogeneity analysis based on SAC and SDM model.
ModelRegionVariableDirect EffectIndirect EffectTotal Effect γ ρ
SACBTH regionBS−0.0040.001−0.003−0.2720.023
CS0.0007−0.00020.0005
YRD regionBS0.0020.00020.0020.028−0.174
CS0.004 *0.00030.004
PRD regionBS−0.010 ***0.001−0.009 ***−0.107−0.256
CS−0.006 *0.0005−0.005 *
SDMBTH regionBS−0.0040.003−0.0001−0.135-
CS0.0020.00010.002-
YRD regionBS0.0020.010 **0.012 **−0.302 **-
CS0.003−0.011 **−0.008-
PRD regionBS−0.007 ***−0.004−0.011 ***−0.329 **-
CS−0.0050.021 **0.015 *-
Note: *, **, *** are significant at the levels of 10%, 5% and 1%, respectively.
Table 10. Robustness test of SDM model.
VariableSDM with 0–1 MatrixSDM with 98%Tailing Test
Direct Effect Indirect Effect Total Effect Direct Effect Indirect Effect Total Effect
BS−0.002 *0.005 ***0.003 *−0.002 **0.008 ***0.006 *
CS0.00001−0.001−0.0010.00050.0020.003
GDP0.019 ***−0.021 ***−0.0020.010 *−0.023−0.013
RRP−0.021−0.343 ***−0.364 ***0.012−0.724 ***−0.712 ***
INC0.0030.0060.009−0.0150.207 **0.192 *
PMP−0.024 **−0.001−0.025 *−0.022 **−0.017−0.038
VOQ0.0030.0180.0220.0020.104 **0.106 **
TEM−0.0002−0.001 ***−0.001 **0.0001−0.002−0.002 ***
LEN−0.007−0.01−0.017−0.011−0.008−0.019
ρ 0.135 ***0.174 ***
Note: *, **, *** are significant at the levels of 10%, 5% and 1%, respectively.
Publisher’s Note: MDPI stays neutral with regard to jurisdictional claims in published maps and institutional affiliations.

