
Public Perception of Tourism Cities before and during the COVID-19 Pandemic through the Lens of User-Generated Content


Abstract
:1. Introduction
- This paper first examines the evolution in the CI of major tourism cities from before the pandemic to during the pandemic;
- It then surveys the cues in UGC about three tourism cities posted on social media to identify the cues that most resonated with the public before and during the pandemic.
2. Literature Review
2.1. City-Related Features and Urban Communities
2.2. CI and UGC
3. Research Hypotheses
3.1. City Perception and UGC Cues
3.2. Negative Intervention and UGC Cues
4. Research Methodology
4.1. Selecting UGC on Instagram
4.2. Data Collection
4.3. Keywords and Interactivity Analysis
5. Data Analysis and Results
5.1. Reliability and Validity
5.2. Hypothesis Testing and Data Verification
5.3. Cue Characteristics of City-Related UGC
5.3.1. Changes in Pre-Pandemic and Peri-Pandemic City-Related Cues
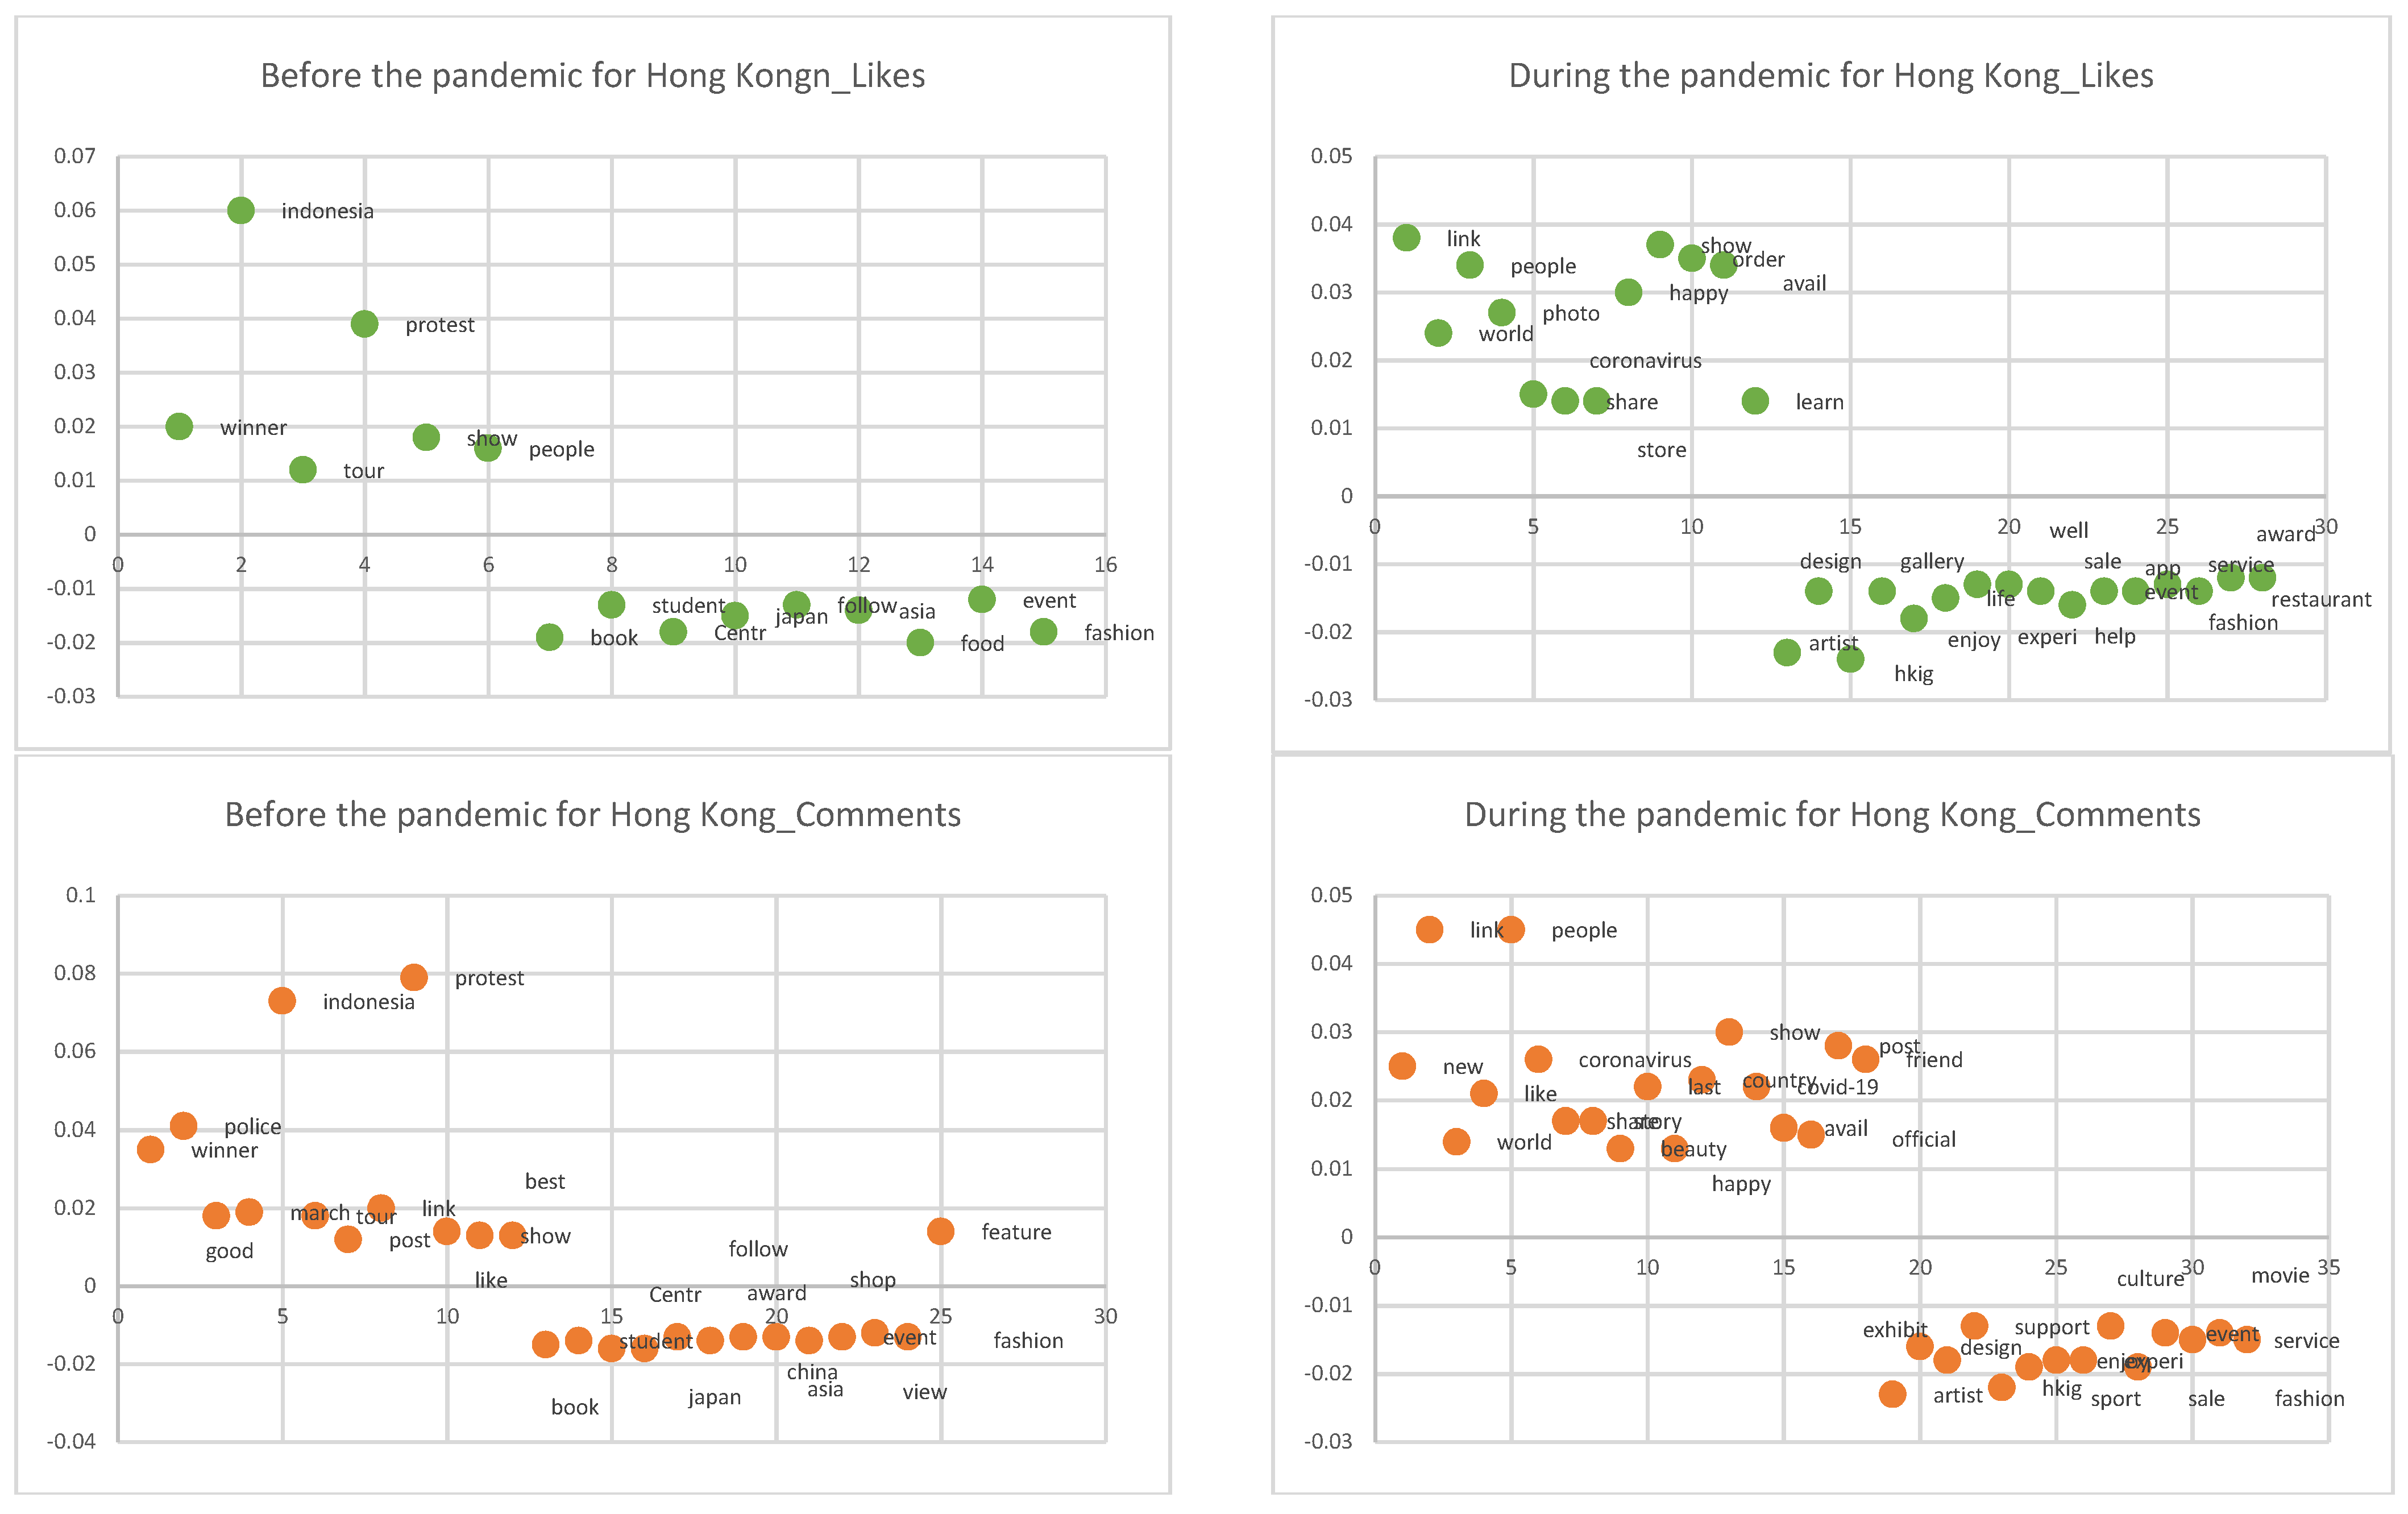
Hong Kong
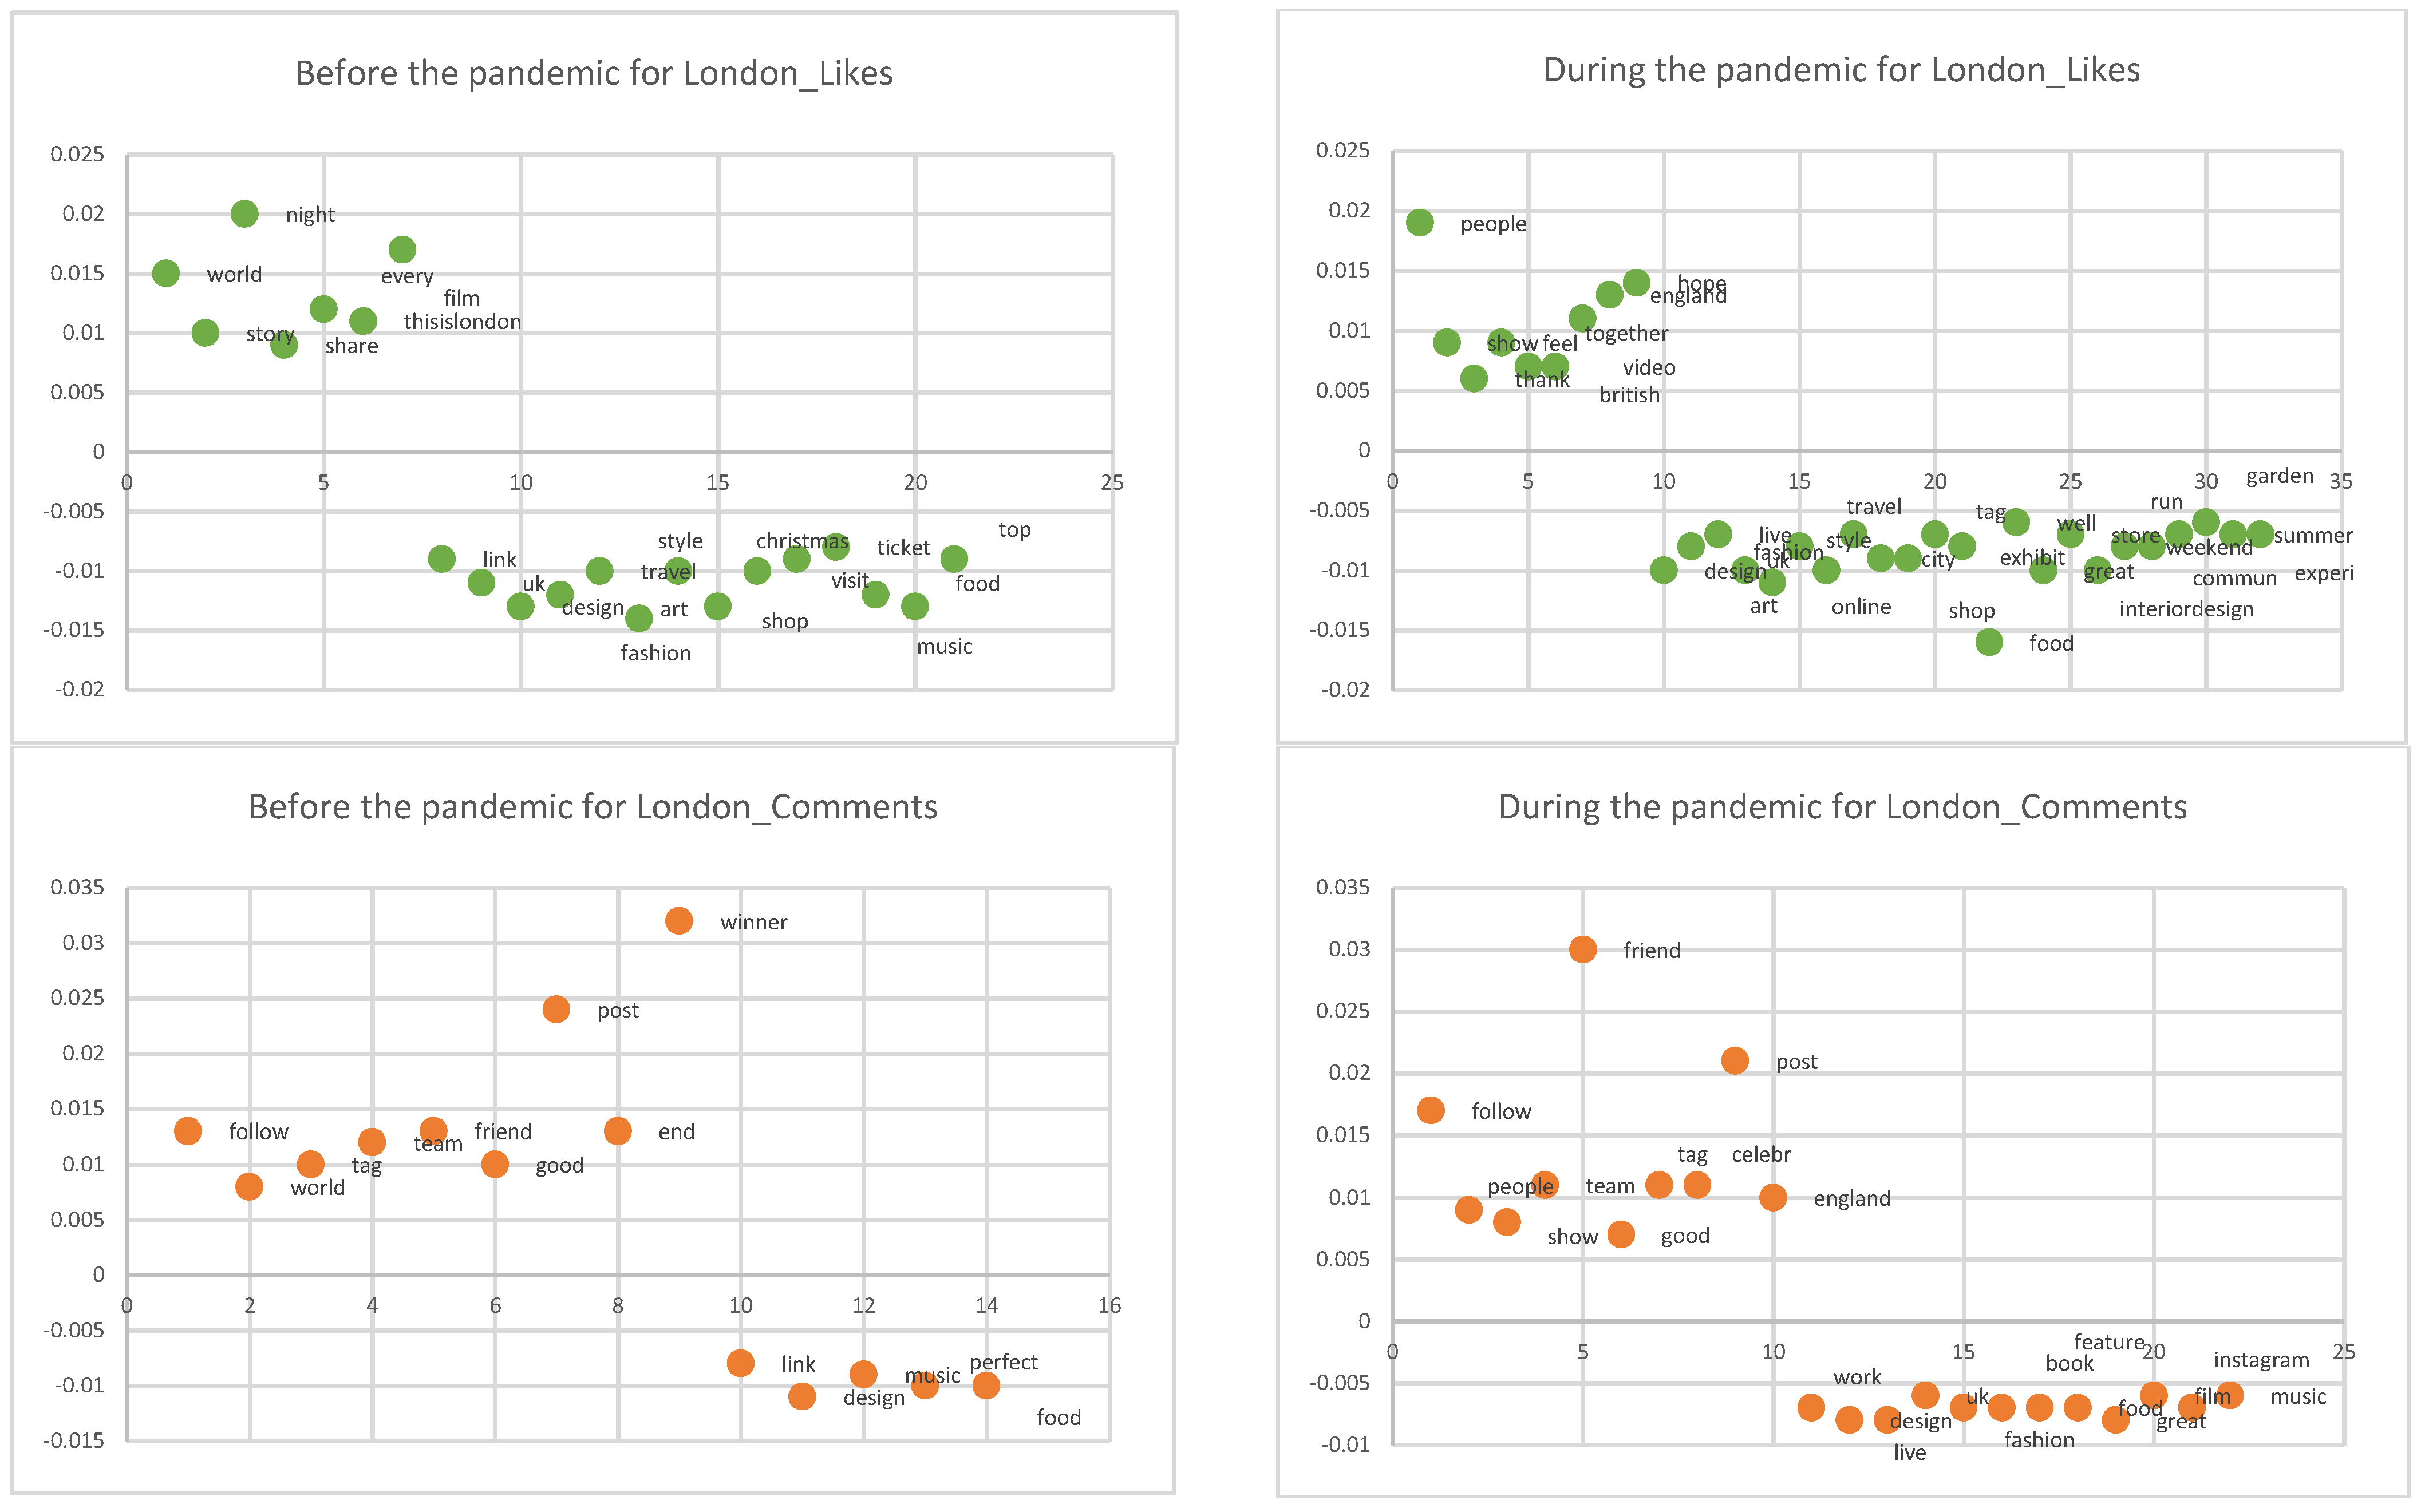
London
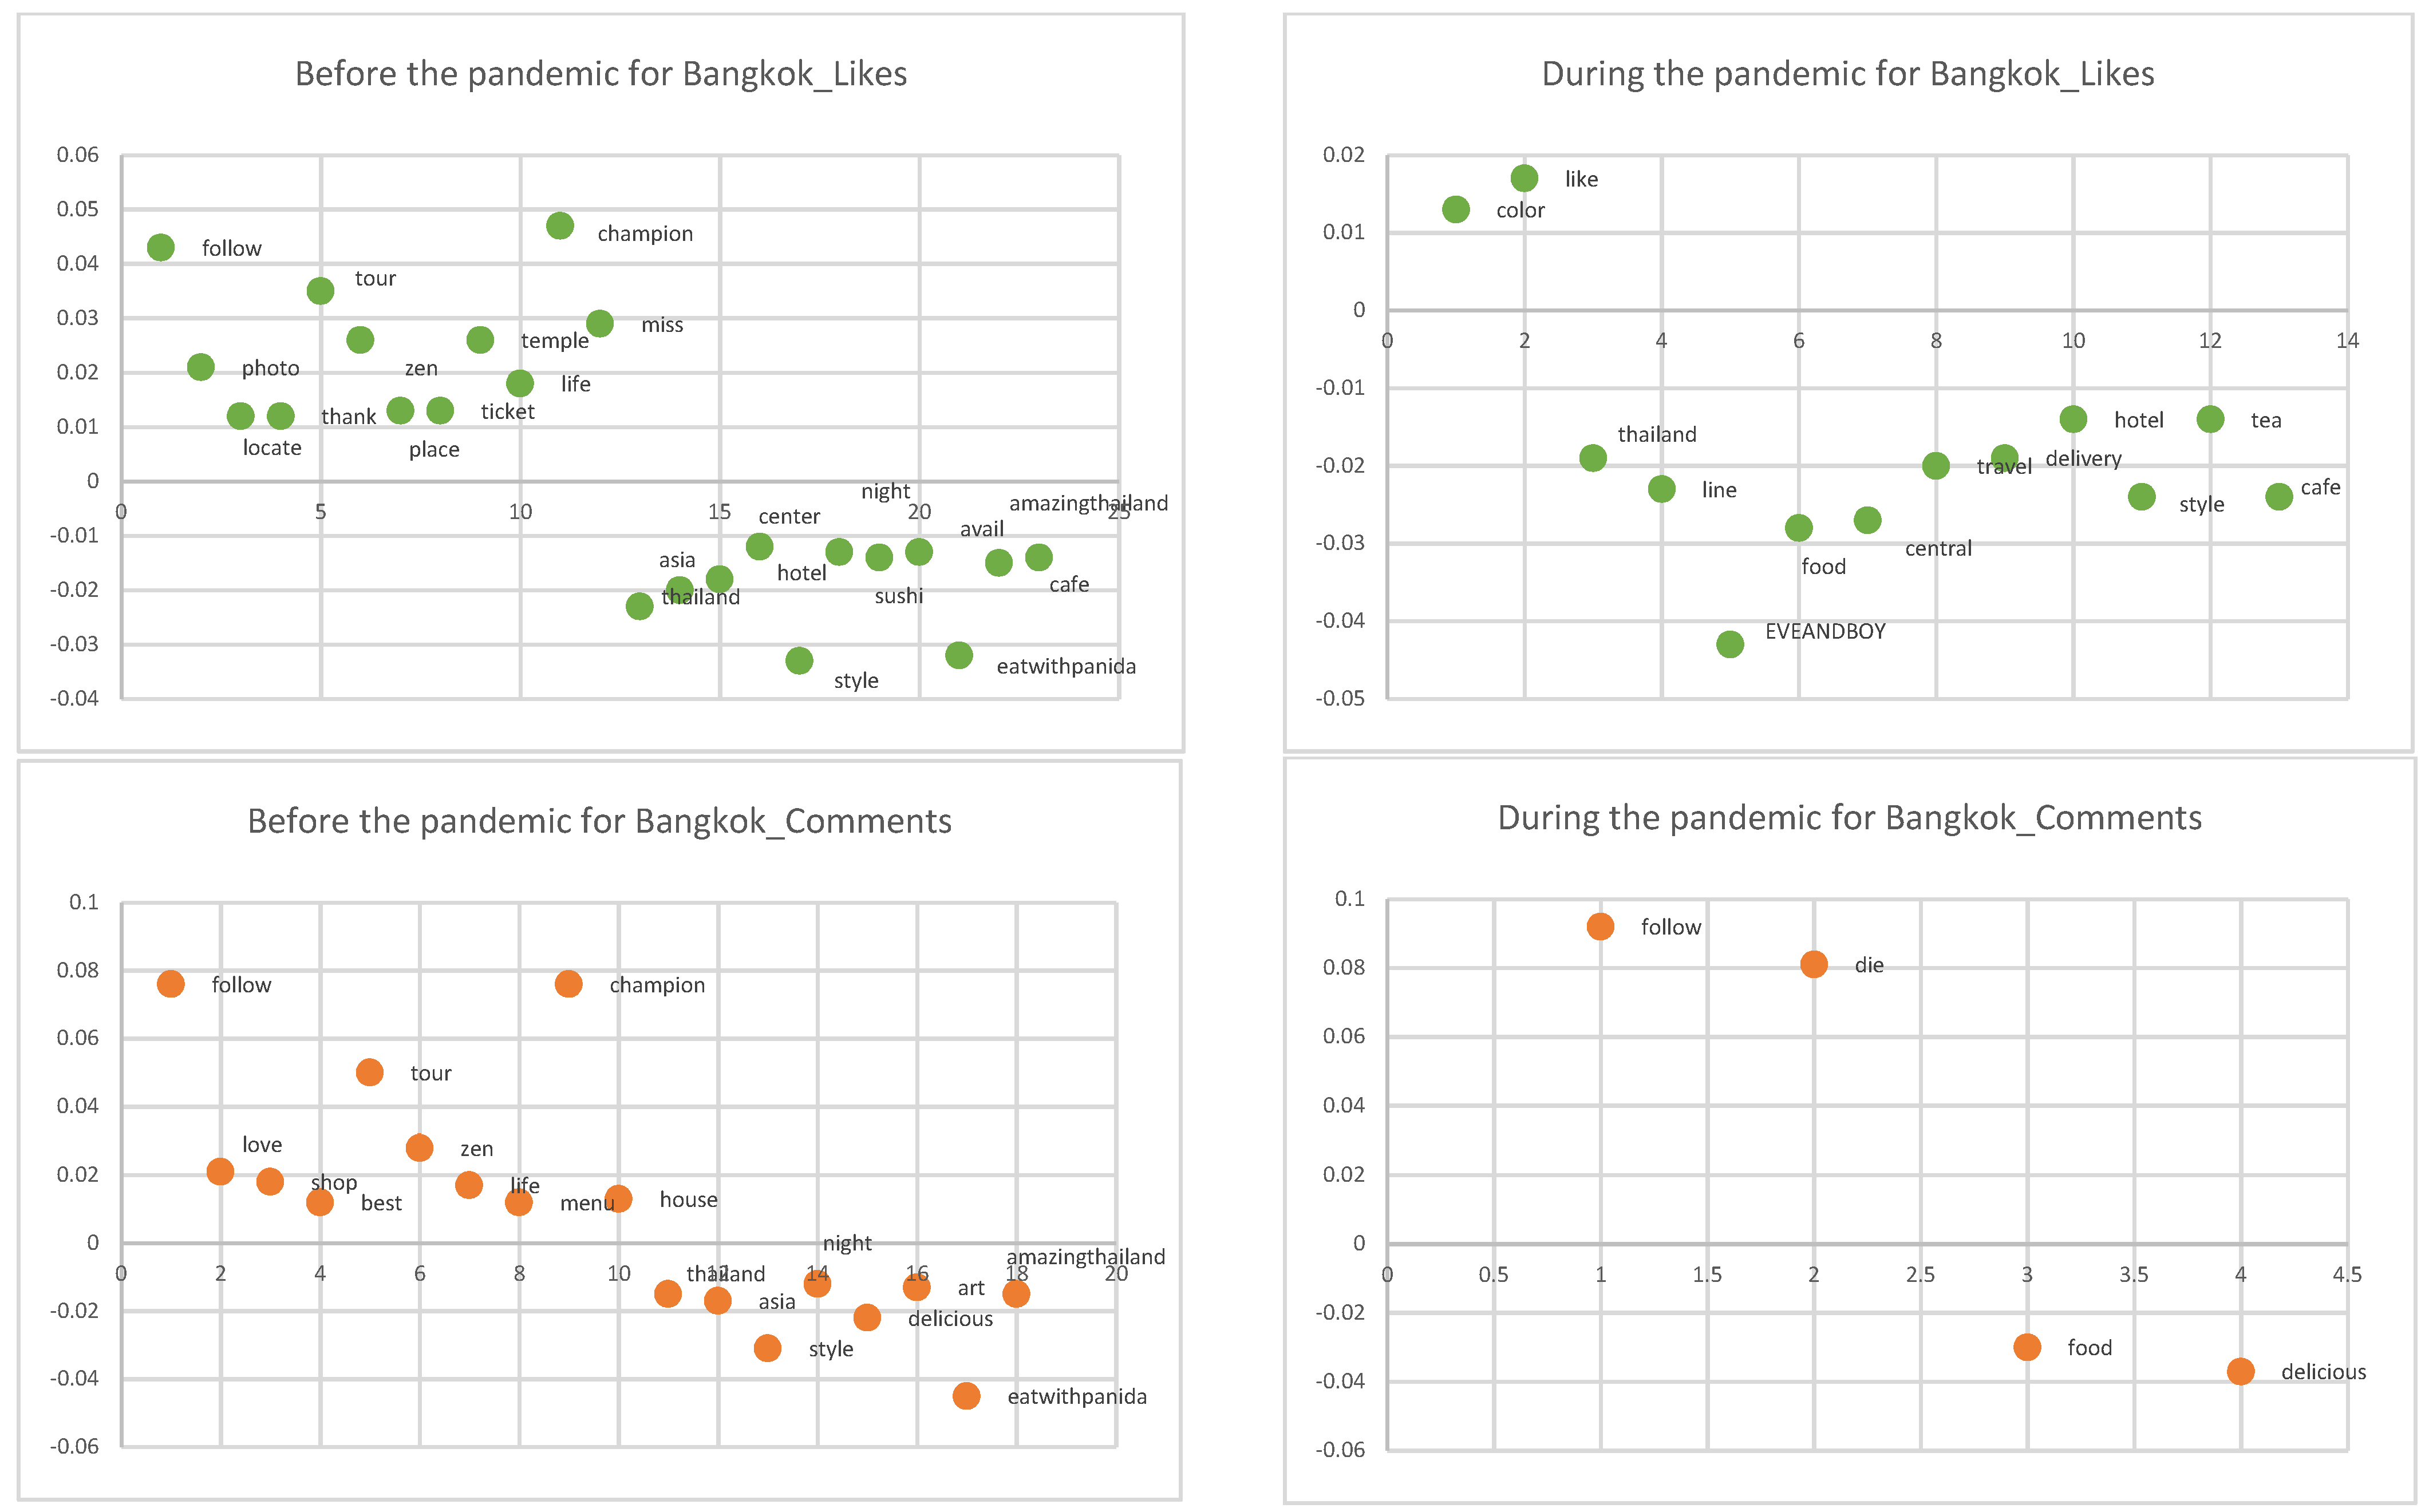
Bangkok
6. Conclusions
6.1. Results
6.1.1. Hong Kong
6.1.2. London
6.1.3. Bangkok
6.2. Hypothesis Verification
6.3. Discussion
6.4. Limitations of the Research and Suggestions
Funding
Conflicts of Interest
References
- Freire, J.R. Local People a Critical Dimension for Place Brands. J. Brand Manag. 2009, 16, 420–438. [Google Scholar] [CrossRef]
- Ye, H.; Tussyadiah, I. Destination Visual Image and Expectation of Experiences. J. Travel Tour. Mark. 2011, 28, 129–144. [Google Scholar] [CrossRef]
- Hunter, W.C. The social construction of tourism online destination image: A comparative semiotic analysis of the visual representation of Seoul. Tour. Manag. 2016, 54, 221–229. [Google Scholar] [CrossRef]
- Katsoni, V. The Strategic Role of Virtual Communities and Social Network Sites on Tourism Destination Marketing. e-J. Sci. Technol. 2014, 5, 107–117. [Google Scholar]
- Kavoura, A.; Sakas, D.P.; Tomaras, P.; Kiralova, A.; Pavlicek, A. Development of Social Media Strategies in Tourism Destination. Procedia Soc. Behav. Sci. 2015, 175, 358–366. [Google Scholar]
- Bruhn, M.; Schoenmueller, V.; Schäfer, D.B. Are Social Media Replacing Traditional Media in Terms of Brand Equity Creation? Manag. Res. Rev. 2012, 35, 770–790. [Google Scholar] [CrossRef] [Green Version]
- Boon-Long, S.; Wongsurawat, W. Social media marketing evaluation using social network comments as an indicator for identifying consumer purchasing decision effectiveness. J. Direct Data Digit. Mark. Pr. 2015, 17, 130–149. [Google Scholar] [CrossRef] [Green Version]
- Lu, W.; Stepchenkova, S. User-Generated Content as a Research Mode in Tourism and Hospitality Applications: Topics, Methods, and Software. J. Hosp. Mark. Manag. 2015, 24, 119–154. [Google Scholar] [CrossRef]
- Lin, P.M.; Fan, D.X.; Zhang, H.Q.; Lau, C. Spend less and experience more: Understanding tourists’ social contact in the Airbnb context. Int. J. Hosp. Manag. 2019, 83, 65–73. [Google Scholar] [CrossRef]
- Eginli, A.T.; Tas, N.O. Interpersonal Communication in Social Networking Sites: An Investigation in the Framework of Uses and Gratification Theory. Online J. Commun. Media Technol. 2018, 8, 81–104. [Google Scholar] [CrossRef]
- Dafonte-Gómez, A.; Míguez-González, M.I.; Corbacho-Valencia, J.M. Viral Dissemination of Content in Advertising: Emotional Factors to Reach Consumers. Commun. Soc. 2020, 33, 107–120. [Google Scholar] [CrossRef] [Green Version]
- Peters, B. The New Facebook Algorithm: Secrets Behind How It Works and What You Can Do to Succeed. The new Facebook algorithm: Secrets behind how it works and what you can do to succeed. Buffer Soc. Blog 2018, 26. [Google Scholar]
- Sigala, M. Social Networks and Customer Involvement in New Service Development (Nsd): The Case of Www.Mystarbucksidea.Com. Int. J. Contemp. Hosp. Manag. 2012, 24, 966–990. [Google Scholar] [CrossRef]
- Sigala, M. Social Media and the Co-Creation of Tourism Experiences. Manag. Mark. Tour. Exp. Issues Chall. Approaches 2017, 85–111. [Google Scholar]
- Zehrer, A. Service experience and service design: Concepts and application in tourism SMEs. Manag. Serv. Qual. Int. J. 2009, 19, 332–349. [Google Scholar] [CrossRef]
- Tussyadiah, I.P.; Park, S. When guests trust hosts for their words: Host description and trust in sharing economy. Tour. Manag. 2018, 67, 261–272. [Google Scholar] [CrossRef]
- Fesenmaier, R.D.; Xiang, Z. Introduction to Tourism Design and Design Science in Tourism. In Design Science in Tourism; Springer: Cham, Switzerland, 2017; pp. 3–16. [Google Scholar]
- Jabreel, M.; Moreno, A.; Huertas, A. Do Local Residents and Visitors Express the Same Sentiments on Destinations through Social Media? In Information and Communication Technologies in Tourism; Springer: Cham, Switzerland, 2017; Volume 2017, pp. 655–668. [Google Scholar]
- Marine-Roig, E. Destination Image Analytics through Traveller-Generated Content. Sustainability 2019, 11, 3392. [Google Scholar] [CrossRef] [Green Version]
- Lee, M.Y.; Hitchcock, M.; Lei, J.W. Mental mapping and heritage visitors’ spatial perceptions. J. Heritage Tour. 2017, 13, 305–319. [Google Scholar] [CrossRef]
- Park, H.; Seo, S.; Kandampully, J. Why post on social networking sites (SNS)? Examining motives for visiting and sharing pilgrimage experiences on SNS. J. Vacat. Mark. 2015, 22, 307–319. [Google Scholar] [CrossRef]
- Uysal, M.; Jurowski, C. Testing the push and pull factors. Ann. Tour. Res. 1994, 21, 844–846. [Google Scholar] [CrossRef]
- Kim, J.; Fesenmaier, D.R. Sharing Tourism Experiences: The Posttrip Experience. J. Travel Res. 2017, 56, 28–40. [Google Scholar] [CrossRef]
- Baloglu, S.; Henthorne, T.L.; Sahin, S. Destination Image and Brand Personality of Jamaica: A Model of Tourist Behavior. J. Travel Tour. Mark. 2014, 31, 1057–1070. [Google Scholar] [CrossRef]
- Chen, K.; He, Y.; Zhong, G. The Transformation of Information Literacy Connotation in Artificial Intelligence (Ai) Perspective and Target Positioning of Artificial Intelligence (Ai) Education: Also on the Implementation Path of Artificial Intelligence Course and Teaching in Basic Education. J. Distance Educ. 2018, 36, 61–71. [Google Scholar]
- Prayag, G.; Hosany, S.; Muskat, B.; del Chiappa, G. Understanding the Relationships between Tourists’ Emotional Experiences, Perceived Overall Image, Satisfaction, and Intention to Recommend. J. Travel Res. 2017, 56, 41–54. [Google Scholar] [CrossRef] [Green Version]
- Chen, F.C.; Phou, S. A Closer Look at Destination: Image, Personality, Relationship and Loyalty. Tour. Manag. 2013, 36, 269–278. [Google Scholar] [CrossRef]
- Huang, Y.; Wu, J.; Shi, W. The impact of font choice on web pages: Relationship with willingness to pay and tourism motivation. Tour. Manag. 2018, 66, 191–199. [Google Scholar] [CrossRef]
- Reitsamer, B.F.; Brunner-Sperdin, A.; Stokburger-Sauer, N.E. Destination attractiveness and destination attachment: The mediating role of tourists’ attitude. Tour. Manag. Perspect. 2016, 19, 93–101. [Google Scholar] [CrossRef]
- Herrero-Prieto, C.L.; Gómez-Vega, M. Cultural Resources as a Factor in Cultural Tourism Attraction: Technical Efficiency Estimation of Regional Destinations in Spain. Tour. Econ. 2017, 23, 260–280. [Google Scholar] [CrossRef]
- Zhang, H.; Fu, X.; Cai, L.A.; Lu, L. Destination image and tourist loyalty: A meta-analysis. Tour. Manag. 2014, 40, 213–223. [Google Scholar] [CrossRef]
- Huang, B.X.; Peng, J.F. Research on the Evaluation of Undergraduate Information Literacy under the New Environment. Res. Libr. Sci. 2019, 19, 12–20. [Google Scholar]
- Zhang, H.; Wu, Y.; Buhalis, D. A Model of Perceived Image, Memorable Tourism Experiences and Revisit Intention. J. Destin. Mark. Manag. 2018, 8, 326–336. [Google Scholar] [CrossRef]
- Pantano, E.; Priporas, C.V.; Stylos, N. ‘You Will Like It!’ Using Open Data to Predict Tourists’ Response to a Tourist Attraction. Tour. Manag. 2017, 60, 430–438. [Google Scholar] [CrossRef]
- García, B.B.; Carreras, A.O.; Royo, E.R. User generated content in destination marketing organisations’ websites. Int. J. Web Based Communities 2012, 8, 103. [Google Scholar] [CrossRef]
- De Sausmarez, N. Crisis Management, Tourism and Sustainability: The Role of Indicators. J. Sustain. Tour. 2007, 15, 700–714. [Google Scholar] [CrossRef]
- Gstaettner, M.A.; Rodger, K.; Lee, D. Visitor Perspectives of Risk Management in a Natural Tourism Setting: An Application of the Theory of Planned Behaviour. J. Outdoor Recreat. Tour. 2017, 19, 1–10. [Google Scholar] [CrossRef]
- Pappas, N. Hotel decision-making during multiple crises: A chaordic perspective. Tour. Manag. 2018, 68, 450–464. [Google Scholar] [CrossRef]
- Pappas, N. UK Outbound Travel and Brexit Complexity. Tour. Manag. 2019, 72, 12–22. [Google Scholar] [CrossRef]
- Aliperti, G.; Rizzi, F.; Frey, M. Cause-Related Marketing for Disaster Risk Reduction in the Tourism Industry: A Comparative Analysis of Prevention- and Recovery-Related Campaigns. J. Hosp. Tour. Manag. 2018, 37, 1–10. [Google Scholar] [CrossRef]
- Scott, K. Measuring Wellbeing: Towards Sustainability? Routledge: London, UK, 2012; pp. 1–212. [Google Scholar]
- Scott, K. Happiness on Your Doorstep: Disputing the Boundaries of Wellbeing and Localism. Geogr. J. 2015, 181, 129–137. [Google Scholar] [CrossRef]
- Weber, R. Constrained Agency in Corporate Social Media Policy. J. Tech. Writ. Commun. 2013, 43, 289–315. [Google Scholar] [CrossRef]
- Mariani, M.M.; Mura, M.; di Felice, M. The Determinants of Facebook Social Engagement for National Tourism Organ-izations’ Facebook Pages: A Quantitative Approach. J. Destin. Mark. Manag. 2018, 8, 312–325. [Google Scholar]
- Hays, S.; Page, S.; Buhalis, D. Social media as a destination marketing tool: Its use by national tourism organisations. Curr. Issues Tour. 2013, 16, 211–239. [Google Scholar] [CrossRef]
- Hochman, N.; Manovich, L. Zooming into an Instagram City: Reading the local through social media. First Monday 2013, 18. [Google Scholar] [CrossRef]
- Sanchez, D.; Batet, M.; Isern, D.; Valls, A. Ontology-based semantic similarity: A new feature-based approach. Expert Syst. Appl. 2012, 39, 7718–7728. [Google Scholar] [CrossRef]
- Slimani, T. Description and Evaluation of Semantic Similarity Measures Approaches. Int. J. Comput. Appl. 2013, 80, 25–33. [Google Scholar] [CrossRef]
- Usakli, A.; Koç, B.; Sönmez, S. How ‘social’ are destinations? Examining European DMO social media usage. J. Destin. Mark. Manag. 2017, 6, 136–149. [Google Scholar] [CrossRef]
- Dickinger, A.; Lalicic, L. Tourist-Driven Innovations in Social Media: An Opportunity for Tourism Organizations. In Advances in Social Media for Travel, Tourism and Hospitality: New Perspectives, Practice and Cases; Routledge: London, UK, 2017; pp. 41–53. [Google Scholar]
- So, F.K.K.; King, C.; Sparks, B. Customer Engagement with Tourism Brands: Scale Development and Validation. J. Hosp. Tour. Res. 2014, 38, 304–329. [Google Scholar] [CrossRef]
- So, K.K.F.; King, C.; Sparks, B.A.; Wang, Y. The Role of Customer Engagement in Building Consumer Loyalty to Tourism Brands. J. Travel Res. 2014, 55, 64–78. [Google Scholar] [CrossRef]
- Mariani, M. Web 2.0 and Destination Marketing: Current Trends and Future Directions. Sustainability 2020, 12, 3771. [Google Scholar] [CrossRef]
- Önder, I.; Gunter, U.; Gindl, S. Utilizing Facebook Statistics in Tourism Demand Modeling and Destination Marketing. J. Travel Res. 2019, 59, 195–208. [Google Scholar] [CrossRef]
- Gartner, W.C. Image Formation Process. J. Travel Tour. Mark. 1994, 2, 191–216. [Google Scholar] [CrossRef]
- Oliveira, E.; Panyik, E. Content, Context and Co-Creation: Digital Challenges in Destination Branding with References to Portugal as a Tourist Destination. J. Vacat. Mark. 2015, 21, 53–74. [Google Scholar] [CrossRef] [Green Version]
- Költringer, C.; Dickinger, A. Analyzing destination branding and image from online sources: A web content mining approach. J. Bus. Res. 2015, 68, 1836–1843. [Google Scholar] [CrossRef]
- Sanz, I.; Museros, L.; González-Abril, L. Exploring the Cognitive-Affective-Conative Image of a Rural Tourism Destination Using Social Data. In Proceedings of the Paper Presented at the JARCA Workshop on Qualitative Systems and Applications in Diagnosis, Robotics and Ambient Intelligence, Almería, Spain, 23–29 June 2016. [Google Scholar]
- Michaelidou, N.; Siamagka, N.T.; Christodoulides, G. Usage, barriers and measurement of social media marketing: An exploratory investigation of small and medium B2B brands. Ind. Mark. Manag. 2011, 40, 1153–1159. [Google Scholar] [CrossRef] [Green Version]
- Michaelidou, N.; Siamagka, N.T.; Moraes, C.; Micevski, M. Do Marketers Use Visual Representations of Destinations That Tourists Value? Comparing Visitors’ Image of a Destination with Marketer-Controlled Images Online. J. Travel Res. 2013, 52, 789–804. [Google Scholar] [CrossRef] [Green Version]
- Ángeles Oviedo-García, M.; Muñoz-Expósito, M.; Castellanos-Verdugo, M.; Sancho-Mejías, M. Metric Proposal for Cus-tomer Engagement in Facebook. J. Res. Interact. Mark. 2014, 8, 327–344. [Google Scholar] [CrossRef]
- Kabadayi, S.; Price, K. Consumer–brand engagement on Facebook: Liking and commenting behaviors. J. Res. Interact. Mark. 2014, 8, 203–223. [Google Scholar] [CrossRef]
- Den Eijnden, V.R.; Koning, I.; Doornwaard, S.; van Gurp, F.; Bogt, T.T. The Impact of Heavy and Disordered Use of Games and Social Media on Adolescents’ Psychological, Social, and School Functioning. J. Behav. Addict. 2018, 7, 697–706. [Google Scholar] [CrossRef]
- Dolnicar, S. A review of research into paid online peer-to-peer accommodation: Launching the Annals of Tourism Research Curated Collection on peer-to-peer accommodation. Ann. Tour. Res. 2019, 75, 248–264. [Google Scholar] [CrossRef]
- Volgger, M. The End of Tourism through Localhood and Overtourism? An Exploration of Current Destination Governance Challenges. In Overtourism: Tourism Management and Solutions; Routledge: Oxfordshire, UK, 2019. [Google Scholar]
- Volgger, M.; Taplin, R.; Pforr, C. The evolution of ‘Airbnb-tourism’: Demand-side dynamics around international use of peer-to-peer accommodation in Australia. Ann. Tour. Res. 2019, 75, 322–337. [Google Scholar] [CrossRef]
- Hong, H.; Xu, D.; Wang, A.; Fan, W. Understanding the determinants of online review helpfulness: A meta-analytic investigation. Decis. Support Syst. 2017, 102, 1–11. [Google Scholar] [CrossRef]
- Xiang, Z.; Fesenmaie, D.R. Big Data Analytics, Tourism Design and Smart Tourism. In Analytics in Smart Tourism Design; Springer: Cham, Switzerland, 2017; pp. 299–307. [Google Scholar]
- Xiang, Z.; Gretzel, U. Role of social media in online travel information search. Tour. Manag. 2010, 31, 179–188. [Google Scholar] [CrossRef]


| ID | Hypothesis | Hypothesis Verification |
|---|---|---|
| Hypothesis 1 | Before the pandemic, user-generated posts that frequently and actively provided city-related cues affected the public’s post interactivity. | Established |
| Hypothesis 1a | Before the pandemic, user-generated posts that frequently and actively provided city-related cues affected post likes. | Established |
| Hypothesis 1b | Before the pandemic, user-generated posts that frequently and actively provided city-related cues affected post comments. | Not established |
| Hypothesis 2 | During the pandemic, user-generated posts that frequently and actively provided city-related cues affected the public’s post interactivity. | Established |
| Hypothesis 2a | During the pandemic, user-generated posts that frequently and actively provided city-related cues affected post likes. | Established |
| Hypothesis 2b | During the pandemic, user-generated posts that frequently and actively provided city-related cues affected post comments. | Established |
| R | R2 | Adj. R2 | ∆F | F Change | Durbin Watson | Original Regression Coefficient | SE | Beta | T | p | R | R2 | |
|---|---|---|---|---|---|---|---|---|---|---|---|---|---|
| Before the pandemic | |||||||||||||
| Hypothesis 1 | 0.031 | 0.001 | 0.001 | 38403.838 | 0.001 | 118.445 | 0.000 | 0.711 | −282.410 | 25.949 | −0.031 | −10.883 | 0.000 |
| Hypothesis 1a | 0.031 | 0.001 | 0.001 | 38124.226 | 0.001 | 120.689 | 0.000 | 0.714 | −282.998 | 25.760 | −0.031 | −10.986 | 0.000 |
| Hypothesis 1b | 0.003 | 0.000 | 0.000 | 722.954 | 0.000 | 1.446 | 0.229 | 1.690 | 0.587 | 0.488 | 0.003 | 1.203 | 0.229 |
| During the pandemic | |||||||||||||
| Hypothesis 2 | 0.032 | 0.001 | 0.001 | 34050.859 | 0.001 | 180.580 | 0.000 | 0.777 | −215.623 | 16.046 | −0.032 | −13.438 | 0.000 |
| Hypothesis 2a | 0.032 | 0.001 | 0.001 | 33729.102 | 0.001 | 181.600 | 0.000 | 0.781 | −214.188 | 15.894 | −0.032 | −13.476 | 0.000 |
| Hypothesis 2b | 0.008 | 0.000 | 0.000 | 933.181 | 0.000 | 10.655 | 0.001 | 1.726 | −1.435 | 0.440 | −0.008 | −3.264 | 0.001 |
| Hong Kong before the Pandemic | Hong Kong during the Pandemic | ||||||||||||||
|---|---|---|---|---|---|---|---|---|---|---|---|---|---|---|---|
| Cues of Post Likes | β | T | p | Cues of Post Comments | β | T | p | Cues of Post Likes | β | T | p | Cues of Post Comments | β | T | p |
| winner | 0.020 | 2.887 | 0.004 | winner | 0.035 | 5.122 | 0.000 | link | 0.038 | 6.127 | 0.000 | new | 0.025 | 3.917 | 0.000 |
| Indonesia | 0.060 | 9.194 | 0.000 | police | 0.041 | 5.777 | 0.000 | world | 0.024 | 3.74 | 0.000 | link | 0.045 | 7.243 | 0.000 |
| tour | 0.012 | 2.023 | 0.043 | good | 0.018 | 2.849 | 0.004 | people | 0.034 | 5.549 | 0.000 | world | 0.014 | 2.248 | 0.025 |
| protest | 0.039 | 4.988 | 0.000 | march | 0.019 | 2.992 | 0.003 | photo | 0.027 | 4.254 | 0.000 | like | 0.021 | 3.247 | 0.001 |
| show | 0.018 | 2.888 | 0.004 | Indonesia | 0.073 | 11.253 | 0.000 | coronavirus | 0.015 | 2.041 | 0.041 | people | 0.045 | 7.369 | 0.000 |
| people | 0.016 | 2.512 | 0.012 | tour | 0.018 | 2.958 | 0.003 | share | 0.014 | 2.365 | 0.018 | coronavirus | 0.026 | 3.401 | 0.001 |
| book | −0.019 | −2.899 | 0.004 | post | 0.012 | 2.016 | 0.044 | store | 0.014 | 2.213 | 0.027 | share | 0.017 | 2.87 | 0.004 |
| student | −0.013 | −2.191 | 0.028 | link | 0.020 | 3.234 | 0.001 | happy | 0.030 | 4.774 | 0.000 | story | 0.017 | 2.91 | 0.004 |
| Central | −0.018 | −2.777 | 0.005 | protest | 0.079 | 10.18 | 0.000 | show | 0.037 | 6.058 | 0.000 | beauty | 0.013 | 2.253 | 0.024 |
| Japan | −0.015 | −2.4 | 0.016 | like | 0.014 | 2.278 | 0.023 | order | 0.035 | 4.856 | 0.000 | last | 0.022 | 3.666 | 0.000 |
| follow | −0.013 | −2.059 | 0.039 | show | 0.013 | 2.007 | 0.045 | avail | 0.034 | 5.58 | 0.000 | happy | 0.013 | 2.077 | 0.038 |
| Asia | −0.014 | −2.21 | 0.027 | best | 0.013 | 2.203 | 0.028 | learn | 0.014 | 2.354 | 0.019 | country | 0.023 | 2.925 | 0.003 |
| food | −0.020 | −3.041 | 0.002 | book | −0.015 | −2.229 | 0.026 | artist | −0.023 | −2.922 | 0.003 | show | 0.030 | 5.029 | 0.000 |
| event | −0.012 | −1.992 | 0.046 | student | −0.014 | −2.277 | 0.023 | design | −0.014 | −1.996 | 0.046 | COVID-19 | 0.022 | 3.78 | 0.000 |
| fashion | −0.018 | −2.896 | 0.004 | Central | −0.016 | −2.565 | 0.010 | hkig | −0.024 | −3.325 | 0.001 | avail | 0.016 | 2.66 | 0.008 |
| Japan | −0.016 | −2.653 | 0.008 | gallery | −0.014 | −2.089 | 0.037 | official | 0.015 | 2.464 | 0.014 | ||||
| award | −0.013 | −2.087 | 0.037 | enjoy | −0.018 | −2.913 | 0.004 | post | 0.028 | 4.585 | 0.000 | ||||
| follow | −0.014 | −2.328 | 0.020 | life | −0.015 | −2.227 | 0.026 | friend | 0.026 | 4.275 | 0.000 | ||||
| China | −0.013 | −2.222 | 0.026 | experi | −0.013 | −2.112 | 0.035 | artist | −0.023 | −2.96 | 0.003 | ||||
| Asia | −0.013 | −2.147 | 0.032 | well | −0.013 | −2.13 | 0.033 | design | −0.016 | −2.33 | 0.020 | ||||
| shop | −0.014 | −2.1 | 0.036 | sale | −0.014 | −2.237 | 0.025 | exhibit | −0.018 | −2.626 | 0.009 | ||||
| event | −0.013 | −2.113 | 0.035 | help | −0.016 | −2.624 | 0.009 | support | −0.013 | −2.16 | 0.031 | ||||
| view | −0.012 | −2.054 | 0.040 | event | −0.014 | −2.214 | 0.027 | hkig | −0.022 | −3.065 | 0.002 | ||||
| fashion | −0.013 | −2.066 | 0.039 | app | −0.014 | −2.192 | 0.028 | sport | −0.019 | −2.688 | 0.007 | ||||
| feature | 0.014 | 2.25 | 0.024 | service | −0.013 | −2.074 | 0.038 | enjoy | −0.018 | −2.987 | 0.003 | ||||
| fashion | −0.014 | −2.376 | 0.018 | experi | −0.018 | −2.905 | 0.004 | ||||||||
| restaurant | −0.012 | −2 | 0.045 | culture | −0.013 | −2.201 | 0.028 | ||||||||
| award | −0.012 | −2.049 | 0.040 | sale | −0.019 | −3.078 | 0.002 | ||||||||
| event | −0.014 | −2.24 | 0.025 | ||||||||||||
| service | −0.015 | −2.44 | 0.015 | ||||||||||||
| movie | −0.014 | −2.107 | 0.035 | ||||||||||||
| fashion | −0.015 | −2.411 | 0.016 | ||||||||||||
| R | R2 | Adj. R2 | ∆F | F Change | Durbin Watson | Original Regression Coefficient | SE | Beta | T | p | R | R2 | |
|---|---|---|---|---|---|---|---|---|---|---|---|---|---|
| Before the pandemic for Hong Kong | |||||||||||||
| Likes | 0.026 | 0.001 | 0.001 | 18190.934 | 0.001 | 19.183 | 0.000 | 0.300 | −118.288 | 270.007 | −0.026 | −4.380 | 0.000 |
| Comments | 0.006 | 0.000 | 0.000 | 258.992 | 0.000 | 0.947 | 0.330 | 0.937 | −0.374 | 0.385 | −0.006 | −0.973 | 0.330 |
| During the pandemic for Hong Kong | |||||||||||||
| Likes | 0.019 | 0.000 | 0.000 | 12560.377 | 0.000 | 10.261 | 0.001 | 0.554 | −52.482 | 16.384 | −0.019 | −3.203 | 0.001 |
| Comments | 0.009 | 0.000 | 0.000 | 171.925 | 0.000 | 2.460 | 0.117 | 10.040 | 0.352 | 0.224 | 0.009 | 1.568 | 0.117 |
| London before the Pandemic | London during the Pandemic | ||||||||||||||
|---|---|---|---|---|---|---|---|---|---|---|---|---|---|---|---|
| Cues of Post Likes | β | T | p | Cues of Post Comments | β | T | p | Cues of Post Likes | β | T | p | Cues of Post Comments | β | T | p |
| world | 0.015 | 3.538 | 0.000 | follow | 0.013 | 3.080 | 0.002 | people | 0.019 | 5.915 | 0.000 | follow | 0.017 | 5.559 | 0.000 |
| story | 0.010 | 2.422 | 0.015 | world | 0.008 | 2.035 | 0.042 | show | 0.009 | 3.064 | 0.002 | people | 0.009 | 2.778 | 0.005 |
| night | 0.020 | 4.851 | 0.000 | tag | 0.010 | 2.151 | 0.032 | thank | 0.006 | 2.002 | 0.045 | show | 0.008 | 2.489 | 0.013 |
| share | 0.009 | 2.137 | 0.033 | team | 0.012 | 2.953 | 0.003 | feel | 0.009 | 2.876 | 0.004 | team | 0.011 | 3.638 | 0.000 |
| every | 0.012 | 2.821 | 0.005 | friend | 0.013 | 2.771 | 0.006 | together | 0.007 | 2.319 | 0.020 | friend | 0.030 | 9.515 | 0.000 |
| thisislondon | 0.011 | 2.450 | 0.014 | good | 0.010 | 2.342 | 0.019 | British | 0.007 | 2.489 | 0.013 | good | 0.007 | 2.392 | 0.017 |
| film | 0.017 | 4.183 | 0.000 | post | 0.024 | 5.951 | 0.000 | video | 0.011 | 3.616 | 0.000 | tag | 0.011 | 3.046 | 0.002 |
| link | −0.009 | −2.259 | 0.024 | end | 0.013 | 2.731 | 0.006 | England | 0.013 | 4.456 | 0.000 | celebr | 0.011 | 3.539 | 0.000 |
| U.K. | −0.011 | −2.604 | 0.009 | winner | 0.032 | 7.525 | 0.000 | hope | 0.014 | 4.538 | 0.000 | post | 0.021 | 6.950 | 0.000 |
| design | −0.013 | −2.993 | 0.003 | link | −0.008 | −1.982 | 0.047 | design | −0.010 | −2.763 | 0.006 | England | 0.010 | 3.446 | 0.001 |
| fashion | −0.012 | −2.540 | 0.011 | design | −0.011 | −2.676 | 0.007 | art | −0.008 | −2.385 | 0.017 | work | −0.007 | −2.209 | 0.027 |
| travel | −0.010 | −2.356 | 0.018 | music | −0.009 | −2.079 | 0.038 | live | −0.007 | −2.413 | 0.016 | design | −0.008 | −2.249 | 0.025 |
| art | −0.014 | −3.041 | 0.002 | perfect | −0.010 | −2.484 | 0.013 | U.K. | −0.010 | −3.347 | 0.001 | live | −0.008 | −2.573 | 0.010 |
| style | −0.010 | −2.090 | 0.037 | food | −0.010 | −2.471 | 0.013 | fashion | −0.011 | −3.399 | 0.001 | U.K. | −0.006 | −2.085 | 0.037 |
| shop | −0.013 | −3.287 | 0.001 | travel | −0.008 | −2.506 | 0.012 | fashion | −0.007 | −2.012 | 0.044 | ||||
| Christmas | −0.010 | −2.508 | 0.012 | style | −0.010 | −3.022 | 0.003 | book | −0.007 | −2.168 | 0.030 | ||||
| visit | −0.009 | −2.217 | 0.027 | online | −0.007 | −2.309 | 0.021 | feature | −0.007 | −2.254 | 0.024 | ||||
| ticket | −0.008 | −1.973 | 0.049 | city | −0.009 | −2.770 | 0.006 | food | −0.007 | −2.096 | 0.036 | ||||
| music | −0.012 | −2.838 | 0.005 | shop | −0.009 | −2.892 | 0.004 | great | −0.008 | −2.567 | 0.010 | ||||
| food | −0.013 | −3.166 | 0.002 | tag | −0.007 | −2.011 | 0.044 | film | −0.006 | −1.987 | 0.047 | ||||
| top | −0.009 | −2.275 | 0.023 | exhibit | −0.008 | −2.483 | 0.013 | −0.007 | −1.969 | 0.049 | |||||
| food | −0.016 | −5.085 | 0.000 | music | −0.006 | −2.100 | 0.036 | ||||||||
| well | −0.006 | −2.078 | 0.038 | ||||||||||||
| great | −0.010 | −3.185 | 0.001 | ||||||||||||
| store | −0.007 | −2.225 | 0.026 | ||||||||||||
| interiordesign | −0.01 | −2.768 | 0.006 | ||||||||||||
| weekend | −0.008 | −2.671 | 0.008 | ||||||||||||
| commun | −0.008 | −2.669 | 0.008 | ||||||||||||
| run | −0.007 | −2.294 | 0.022 | ||||||||||||
| garden | −0.006 | −2.036 | 0.042 | ||||||||||||
| summer | −0.007 | −2.496 | 0.013 | ||||||||||||
| experi | −0.007 | −2.229 | 0.026 | ||||||||||||
| R | R2 | Adj. R2 | ∆F | F Change | Durbin Watson | Original Regression Coefficient | SE | Beta | T | p | R | R2 | |
|---|---|---|---|---|---|---|---|---|---|---|---|---|---|
| Before the pandemic for London | |||||||||||||
| Likes | 0.047 | 0.002 | 0.002 | 500570.076 | 0.002 | 141.872 | 0.000 | 0.542 | −511.315 | 42.928 | −0.047 | −11.911 | 0.000 |
| Comments | 0.004 | 0.000 | 0.000 | 968.522 | 0.000 | 10.005 | 0.316 | 1.709 | −0.833 | 0.831 | −0.004 | −10.003 | 0.316 |
| During the pandemic for London | |||||||||||||
| Likes | 0.037 | 0.001 | 0.001 | 39709.626 | 0.001 | 156.173 | 0.000 | 0.793 | −308.512 | 24.687 | −0.037 | −12.497 | 0.000 |
| Comments | 0.009 | 0.000 | 0.000 | 10320.027 | 0.000 | 8.713 | 0.003 | 1.690 | −1.894 | 0.642 | −0.009 | −2.952 | 0.003 |
| Bangkok before the Pandemic | Bangkok during the Pandemic | ||||||||||||||
|---|---|---|---|---|---|---|---|---|---|---|---|---|---|---|---|
| Cues of Post Likes | β | T | p | Cues of Post Comments | β | T | p | Cues of Post Likes | β | T | p | Cues of Post Comments | β | T | p |
| follow | 0.043 | 5.627 | 0.000 | follow | 0.076 | 9.866 | 0.000 | color | 0.013 | 1.976 | 0.048 | follow | 0.092 | 8.672 | 0.000 |
| photo | 0.021 | 3.165 | 0.002 | love | 0.021 | 3.353 | 0.001 | like | 0.017 | 2.228 | 0.026 | die | 0.081 | 8.877 | 0.000 |
| locate | 0.012 | 2.139 | 0.032 | shop | 0.018 | 2.880 | 0.004 | Thailand | −0.019 | −2.697 | 0.007 | food | −0.030 | −3.782 | 0.000 |
| thank | 0.012 | 2.042 | 0.041 | best | 0.012 | 2.021 | 0.043 | line | −0.023 | −2.557 | 0.011 | delicious | −0.037 | −3.945 | 0.000 |
| tour | 0.035 | 5.777 | 0.000 | tour | 0.050 | 8.161 | 0.000 | EVEANDBOY | −0.043 | −3.073 | 0.002 | ||||
| zen | 0.026 | 4.340 | 0.000 | zen | 0.028 | 4.803 | 0.000 | food | −0.028 | −3.465 | 0.001 | ||||
| place | 0.013 | 2.201 | 0.028 | life | 0.017 | 2.269 | 0.023 | central | −0.027 | −2.454 | 0.014 | ||||
| ticket | 0.013 | 2.303 | 0.021 | menu | 0.012 | 1.991 | 0.046 | travel | −0.020 | −2.374 | 0.018 | ||||
| temple | 0.026 | 4.341 | 0.000 | champion | 0.076 | 12.943 | 0.000 | delivery | −0.019 | −2.420 | 0.016 | ||||
| life | 0.018 | 2.406 | 0.016 | house | 0.013 | 2.245 | 0.025 | hotel | −0.014 | −2.316 | 0.021 | ||||
| champion | 0.047 | 7.970 | 0.000 | Thailand | −0.015 | −2.179 | 0.029 | style | −0.024 | −2.763 | 0.006 | ||||
| miss | 0.029 | 4.781 | 0.000 | Asia | −0.017 | −2.758 | 0.006 | tea | −0.014 | −2.384 | 0.017 | ||||
| Thailand | −0.023 | −3.325 | 0.001 | style | −0.031 | −3.386 | 0.001 | cafe | −0.024 | −2.715 | 0.007 | ||||
| Asia | −0.020 | −3.220 | 0.001 | night | −0.012 | −1.997 | 0.046 | ||||||||
| hotel | −0.018 | −2.893 | 0.004 | delicious | −0.022 | −2.815 | 0.005 | ||||||||
| center | −0.012 | −2.016 | 0.044 | art | −0.013 | −2.046 | 0.041 | ||||||||
| style | −0.033 | −3.665 | 0.000 | eatwithpanida | −0.045 | −5.292 | 0.000 | ||||||||
| night | −0.013 | −2.197 | 0.028 | amazingthailand | −0.015 | −2.322 | 0.020 | ||||||||
| sushi | −0.014 | −2.216 | 0.027 | ||||||||||||
| avail | −0.013 | −2.120 | 0.034 | ||||||||||||
| eatwithpanida | −0.032 | −3.764 | 0.000 | ||||||||||||
| cafe | −0.015 | −2.286 | 0.022 | ||||||||||||
| amazingthailand | −0.014 | −2.269 | 0.023 | ||||||||||||
| R | R2 | Adj. R2 | ∆F | F Change | Durbin Watson | Original Regression Coefficient | SE | Beta | T | p | R | R2 | |
|---|---|---|---|---|---|---|---|---|---|---|---|---|---|
| Before the pandemic for Bangkok | |||||||||||||
| Likes | 0.030 | 0.001 | 0.001 | 13353.962 | 0.001 | 27.101 | 0.000 | 0.394 | −122.145 | 23.463 | −0.030 | −5.206 | 0.000 |
| Comments | 0.004 | 0.000 | 0.000 | 201.920 | 0.000 | 0.472 | 0.492 | 1.240 | −0.244 | 0.355 | −0.004 | −0.687 | 0.492 |
| During the pandemic for Bangkok | |||||||||||||
| Likes | 0.046 | 0.002 | 0.002 | 19709.181 | 0.002 | 64.127 | 0.000 | 0.585 | −1390.001 | 17.358 | −0.046 | −80.008 | 0.000 |
| Comments | 0.014 | 0.000 | 0.000 | 966.943 | 0.000 | 60.018 | 0.014 | 1.912 | −20.089 | 0.852 | −0.014 | −2.453 | 0.014 |
Publisher’s Note: MDPI stays neutral with regard to jurisdictional claims in published maps and institutional affiliations. |
© 2021 by the author. Licensee MDPI, Basel, Switzerland. This article is an open access article distributed under the terms and conditions of the Creative Commons Attribution (CC BY) license (https://creativecommons.org/licenses/by/4.0/).
Share and Cite
Chen, Y. Public Perception of Tourism Cities before and during the COVID-19 Pandemic through the Lens of User-Generated Content. Sustainability 2021, 13, 14046. https://doi.org/10.3390/su132414046
Chen Y. Public Perception of Tourism Cities before and during the COVID-19 Pandemic through the Lens of User-Generated Content. Sustainability. 2021; 13(24):14046. https://doi.org/10.3390/su132414046
Chicago/Turabian StyleChen, Yulin. 2021. "Public Perception of Tourism Cities before and during the COVID-19 Pandemic through the Lens of User-Generated Content" Sustainability 13, no. 24: 14046. https://doi.org/10.3390/su132414046
APA StyleChen, Y. (2021). Public Perception of Tourism Cities before and during the COVID-19 Pandemic through the Lens of User-Generated Content. Sustainability, 13(24), 14046. https://doi.org/10.3390/su132414046