
The Contribution of Online Reviews for Quality Evaluation of Cultural Tourism Offers: The Experience of Italian Museums


Abstract
1. Introduction
- RQ1: Which museum quality dimensions are identified following a ‘top-down’ approach for the analysis of online reviews?
- RQ2: Which museum quality dimensions are identified following a ‘bottom-up’ approach for the analysis of online reviews?
- RQ3: To what extent do the museum quality dimensions evaluated from online reviews using a ‘bottom-up’ approach differ from those identified through a ‘top-down’ approach?
2. Literature Review
3. Materials and Methods
3.1. The Empirical Context of Italian Museums
3.2. Data Collection
3.3. Online Reviews of Museums
3.4. Data Analytics Approaches to Online Reviews
3.4.1. ‘Top-Down’ Approach
3.4.2. ‘Bottom-Up’ Approach
3.4.3. Comparison of the ‘Top-Down’ and ‘Bottom-Up’ Approaches
4. Results
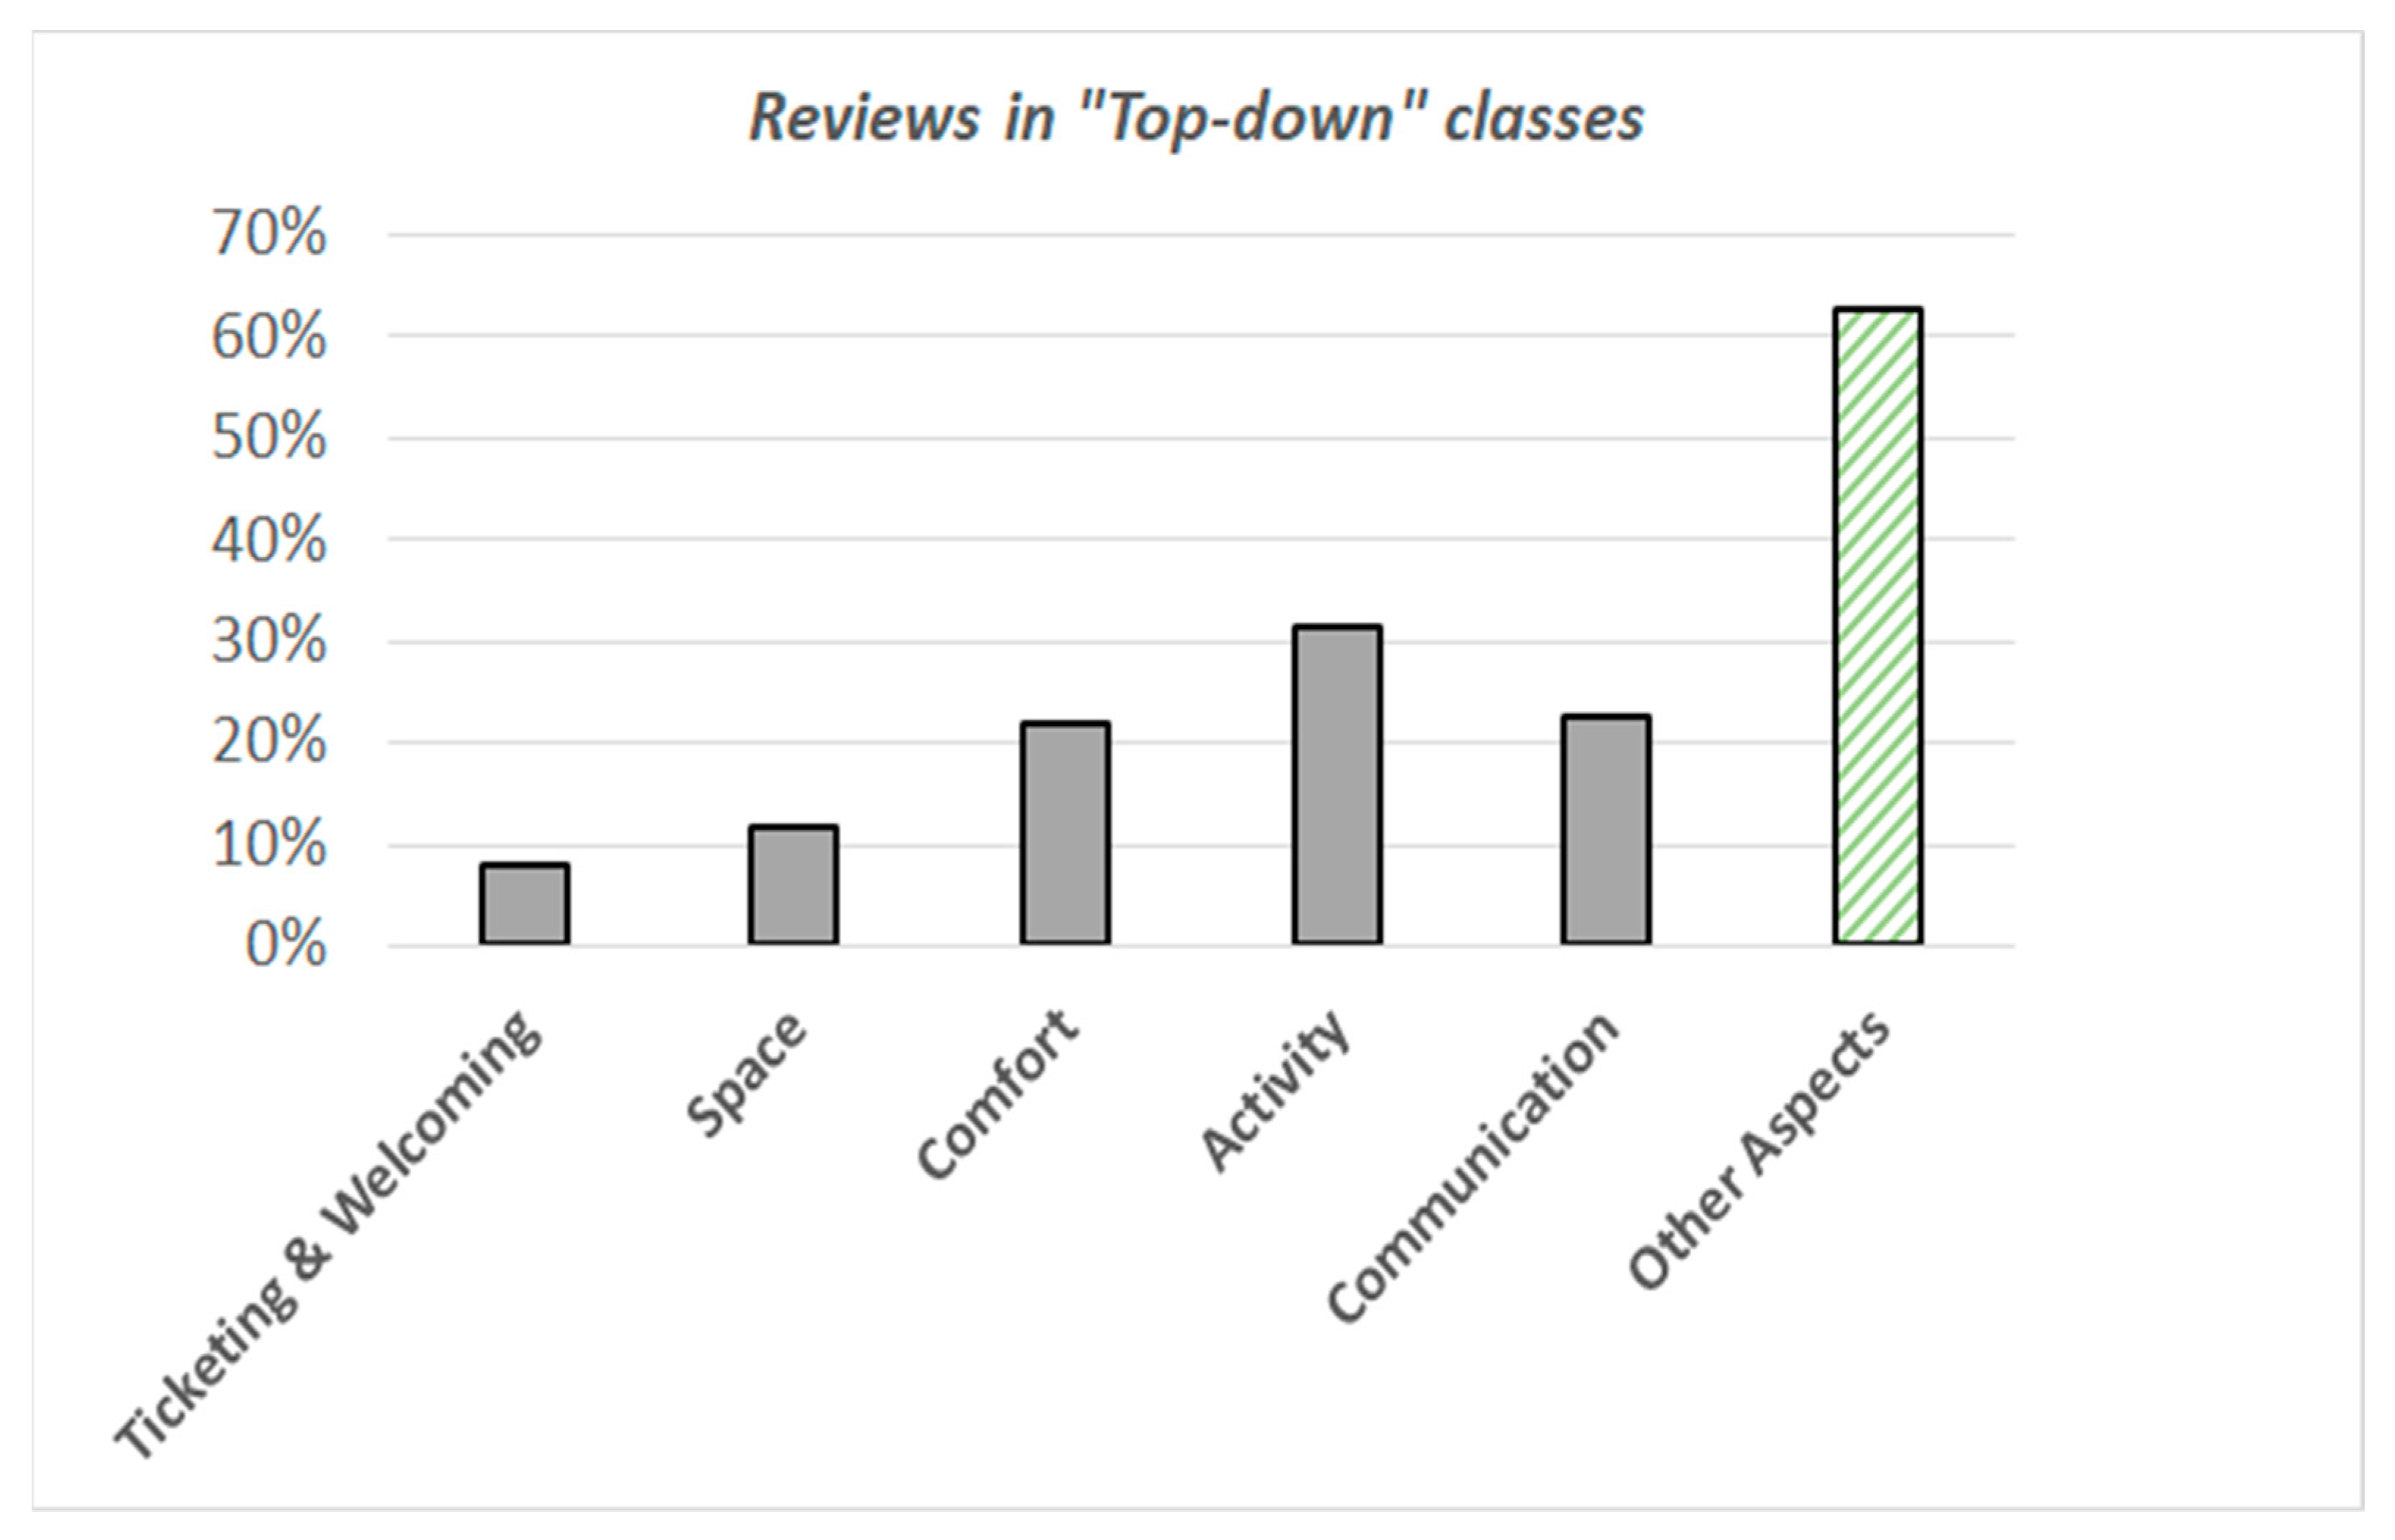
4.1. RQ1: Which Museum Quality Dimensions Are Identified following a ‘Top-Down’ Approach for the Analysis of Online Reviews?
4.2. RQ2: Which Museum Quality Dimensions Are Identified following a ‘Bottom-Up’ Approach for the Analysis of Online Reviews?
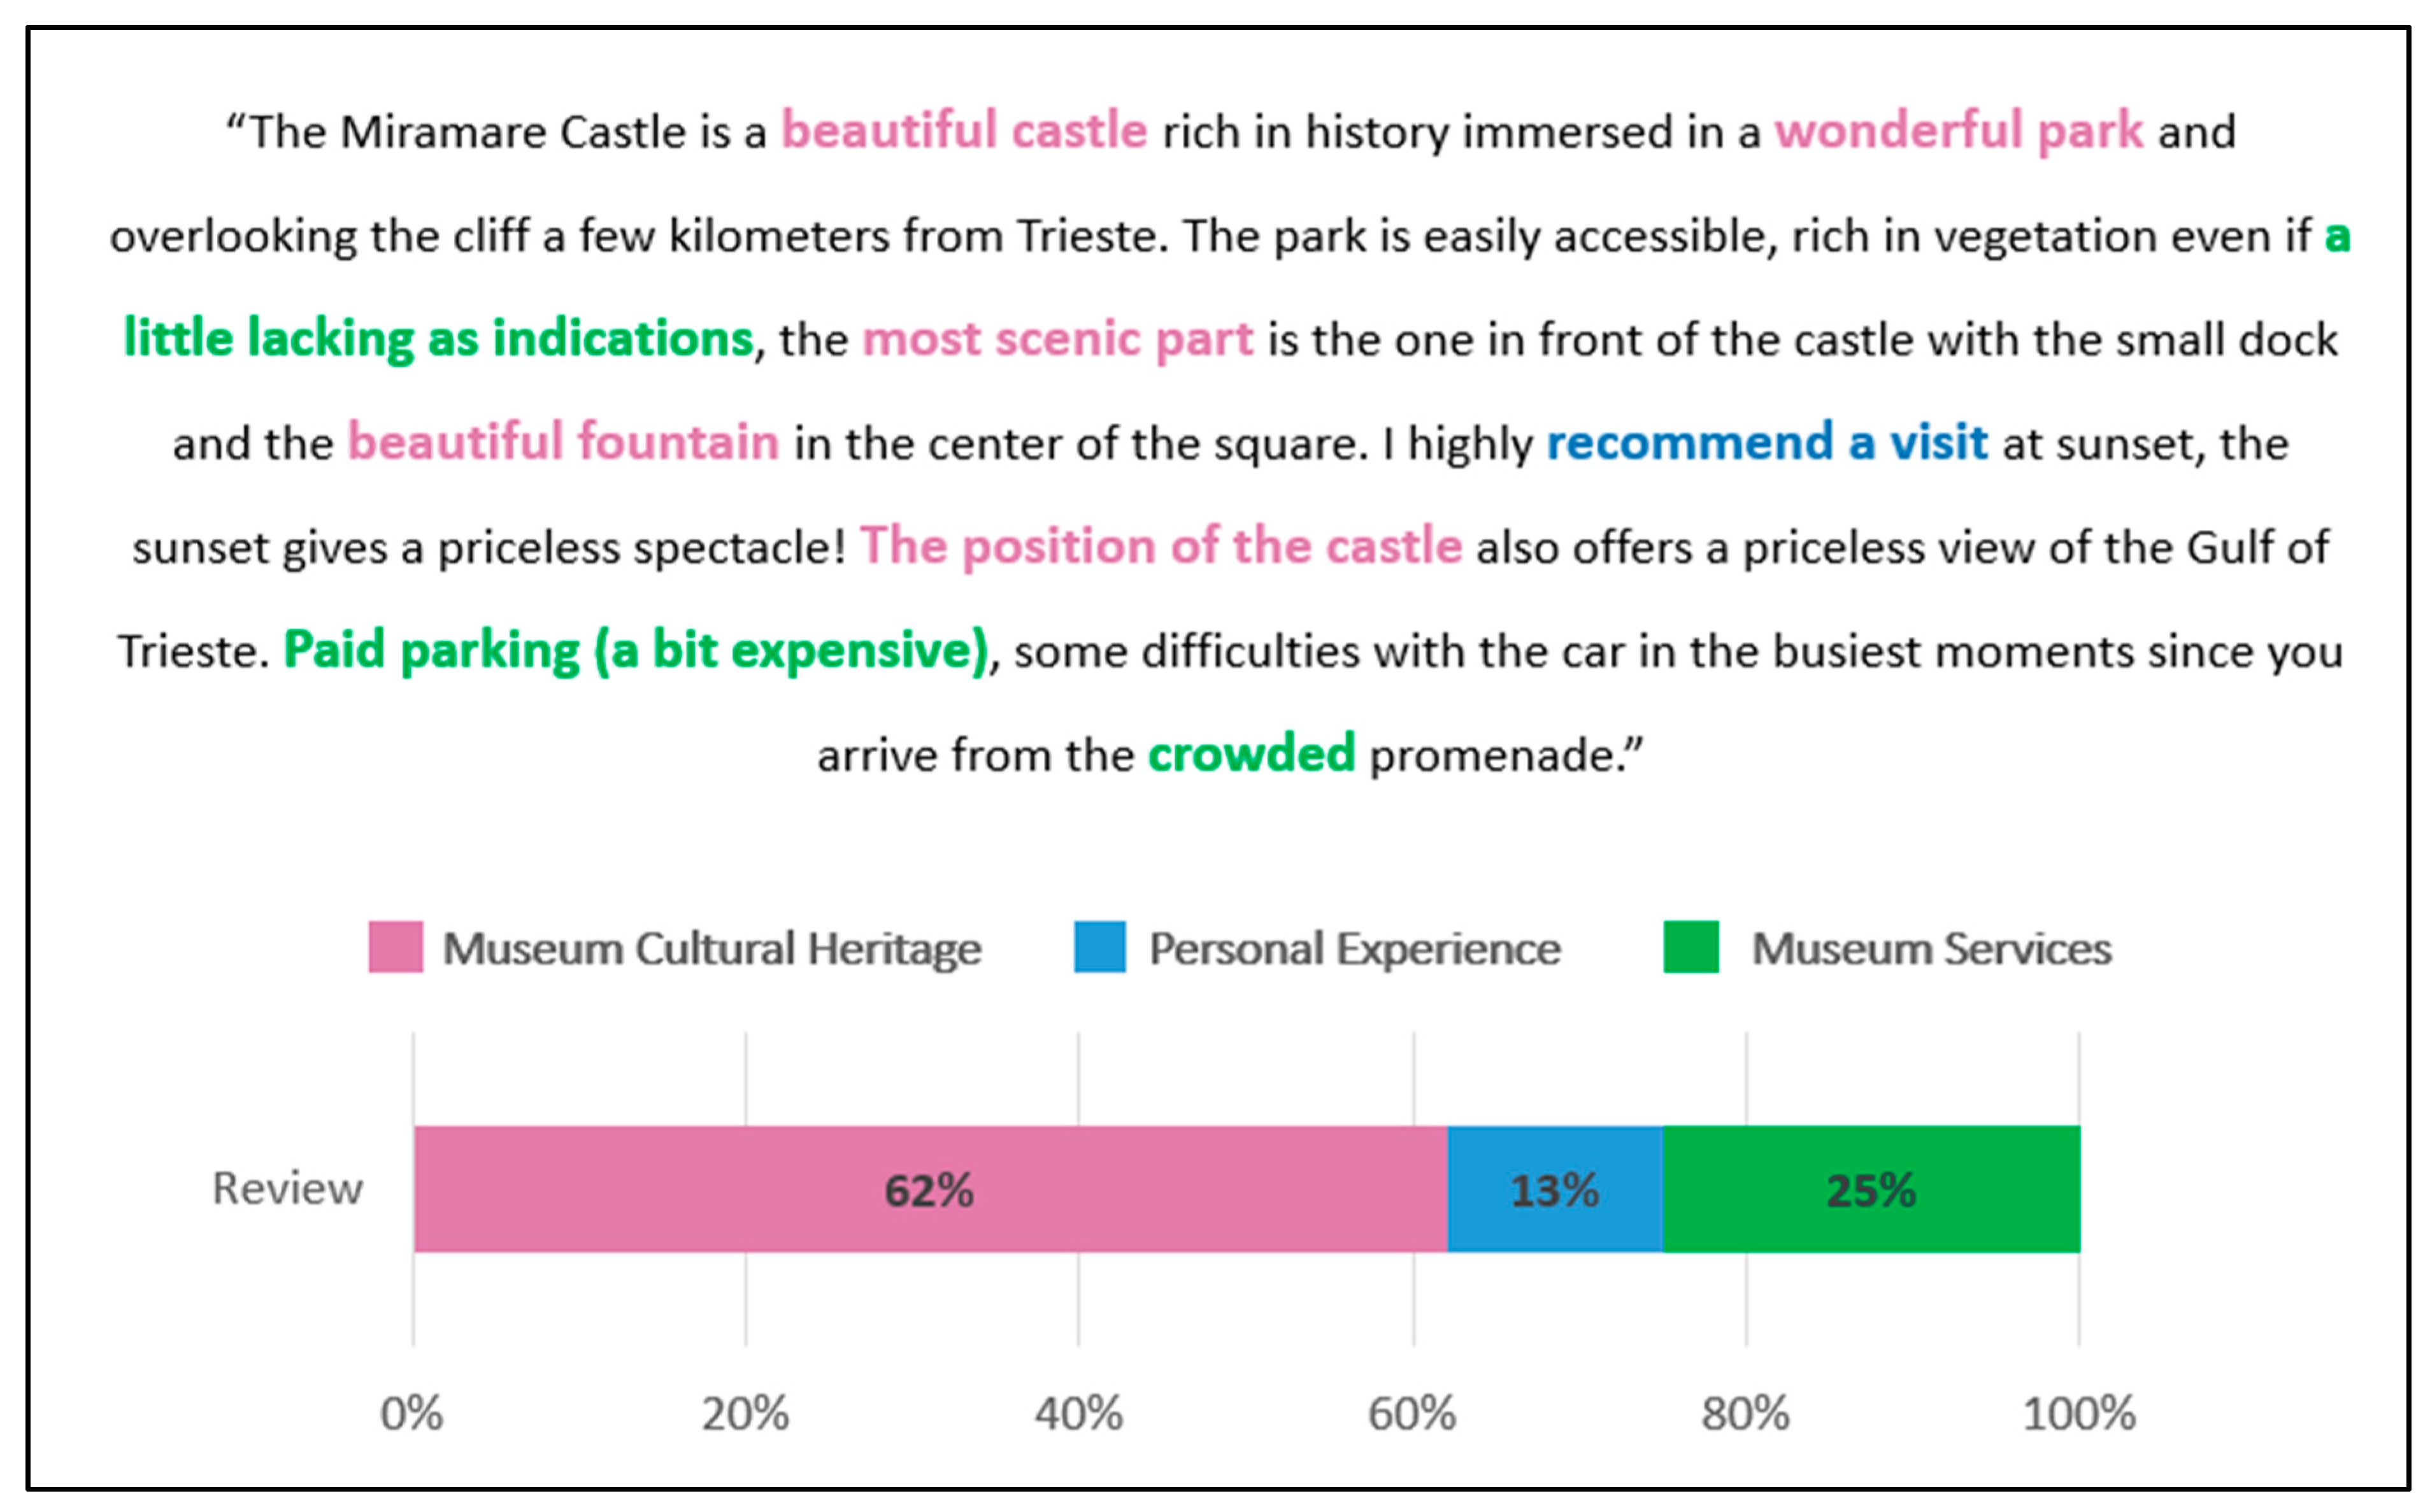
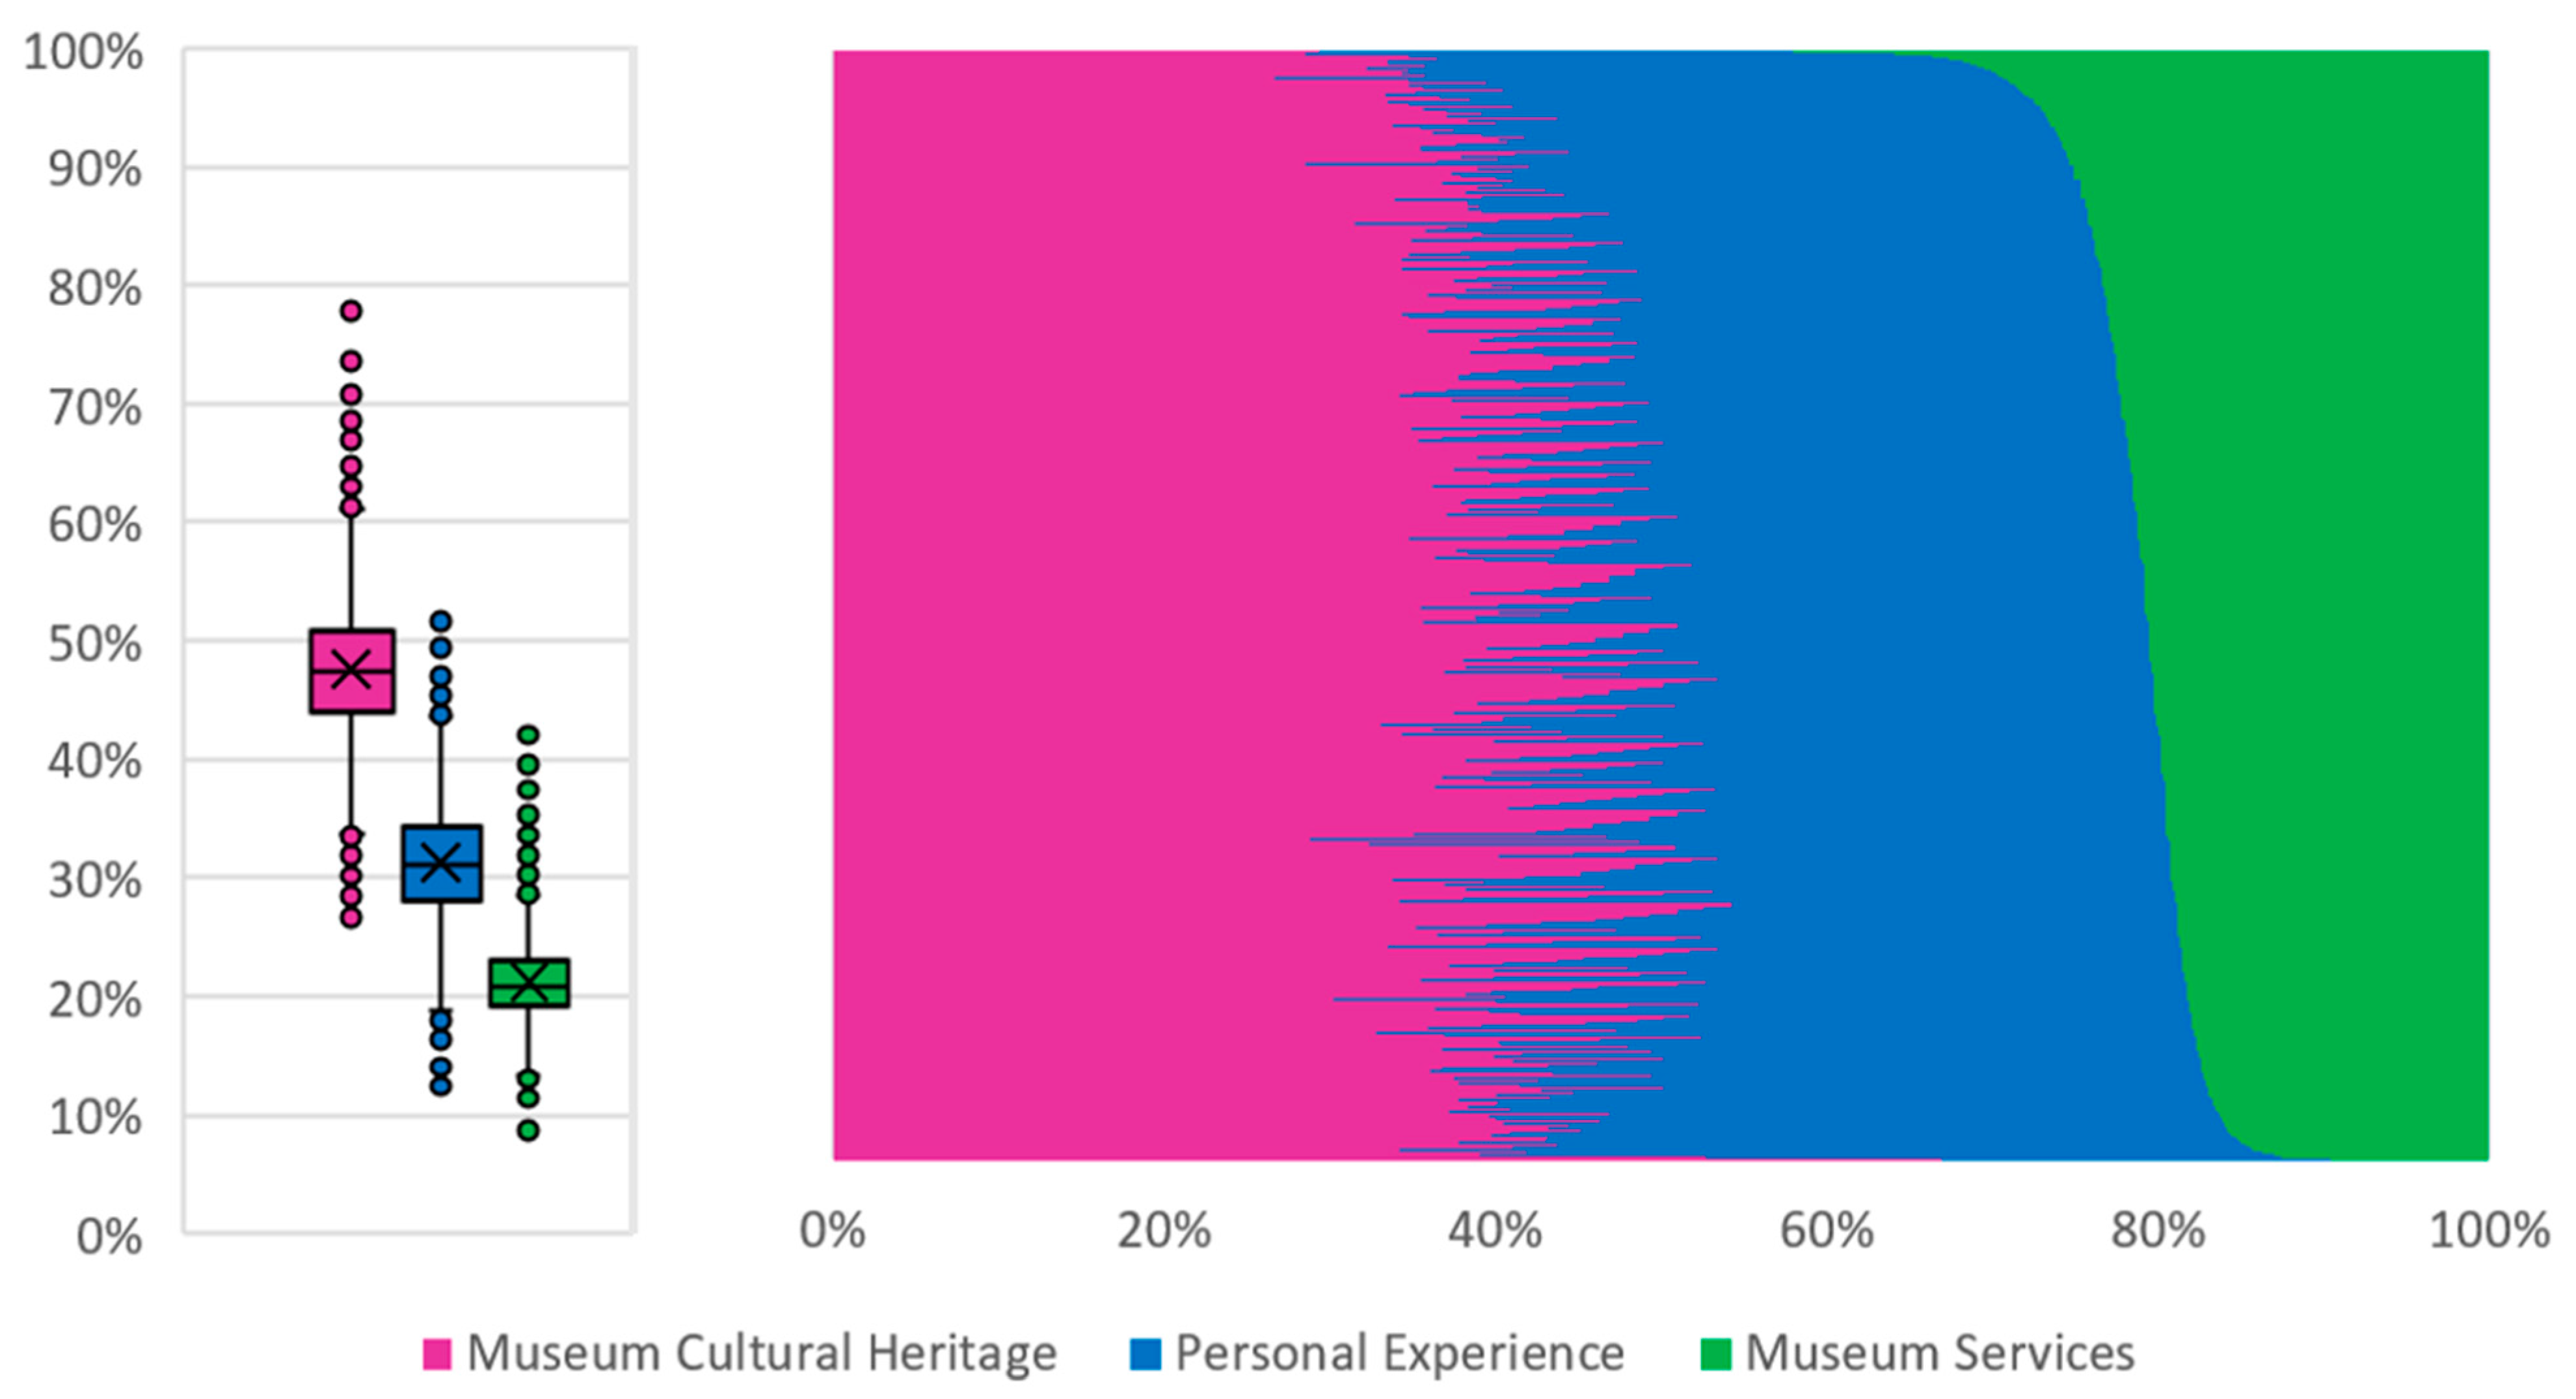
- Museum Cultural Heritage (6 latent topics): With an average probability of 46%, the museum reviews address those aspects connected to the artistic collection of the museum, including comments on exhibitions, findings and artworks, but also considerations of the museums’ history and tradition and descriptions of the buildings, facades, churches and castles.
- Personal Experience (4 latent topics): With an average probability of 31%, museum reviews address the emotional aspects associated with their personal experiences. This includes comments connected to the ‘wow effect’ of the visit, praises for the majesty and beauty and suggestions to visit the heritage site at least once in a lifetime. Additional aspects addressed are connected to the descriptions of revisits to the museum and the associated expectations, but also events that occurred during the visit or in connection to the visit itself, such as the museum’s disorganisation in supporting visitors or lack of information or encounters with rude personnel.
- Museum Services (3 latent topics): With an average probability of 23%, the museum reviews address aspects connected to the services offered by museums, such as ticketing, guided tours, accessibility and transports.
4.3. RQ3: To What Extent Do the Museum Quality Dimensions Evaluated from Online Reviews Using a ‘Bottom-Up’ Approach Differ from Those Identified through a ‘Top-Down’ Approach?
From the Porta San Paolo railway station (from the Piramide metro stop), take the train to Ostia Antica, after a journey of about half an hour. In ancient times, it was the ancient port of Rome, and in it, the goods flowed and passed to and from the whole empire. The ruins are well preserved, and all the activities of the time are recognisable from them, from the storage warehouses to the bathrooms. public buildings, amphitheatres, fire stations and port corporations. I leave the rest to your curiosity. I bet you will be charmed.(30.7% probability of observing the latent topic Accessibility and Transports)
Nice initiative by the students of the Rodolico scientific high school. We were welcomed with kindness and cordiality by the students, appreciating their competence.(20.1% probability of observing latent topic Guided Tours)
Admission 9 euros per person and 4 euros for children seems a bit excessive to me .. to possibly add 1 euro for transport by bus because if you proceed on foot, the path to take is not at all simple and in good shape. Strollers are impossible!!!(19.2% probability of observing latent topic Ticketing (purchase, price, book))
5. Discussion and Conclusions
5.1. Academic Implications
5.2. Practitioner Implications
5.3. Limitations and Further Research
Author Contributions
Funding
Institutional Review Board Statement
Informed Consent Statement
Data Availability Statement
Acknowledgments
Conflicts of Interest
References
- Sheng, C.-W.; Chen, M.-C. A study of experience expectations of museum visitors. Tour. Manag. 2012, 33, 53–60. [Google Scholar] [CrossRef]
- Schuckert, M.; Liu, X.; Law, C.H.R. Hospitality and Tourism Online Reviews: Recent Trends and Future Directions. J. Travel Tour. Mark. 2015, 32, 608–621. [Google Scholar] [CrossRef]
- Bi, J.-W.; Liu, Y.; Fan, Z.-P.; Zhang, J. Wisdom of crowds: Conducting importance-performance analysis (IPA) through online reviews. Tour. Manag. 2018, 70, 460–478. [Google Scholar] [CrossRef]
- Jia, S. Motivation and satisfaction of Chinese and U.S. tourists in restaurants: A cross-cultural text mining of online reviews. Tour. Manag. 2020, 78, 104071. [Google Scholar] [CrossRef]
- Antonio, N.; Correia, M.; Ribeiro, F. Exploring User-Generated Content for Improving Destination Knowledge: The Case of Two World Heritage Cities. Sustainability 2020, 12, 9654. [Google Scholar] [CrossRef]
- Kirilenko, A.P.; Stepchenkova, S.O.; Dai, X. Automated topic modeling of tourist reviews: Does the Anna Karenina principle apply? Tour. Manag. 2020, 83, 104241. [Google Scholar] [CrossRef]
- Taecharungroj, V.; Mathayomchan, B. Analysing TripAdvisor reviews of tourist attractions in Phuket, Thailand. Tour. Manag. 2019, 75, 550–568. [Google Scholar] [CrossRef]
- Hou, Z.; Cui, F.; Meng, Y.; Lian, T.; Yu, C. Opinion mining from online travel reviews: A comparative analysis of Chinese major OTAs using semantic association analysis. Tour. Manag. 2019, 74, 276–289. [Google Scholar] [CrossRef]
- Su, Y.; Teng, W. Contemplating museums’ service failure: Extracting the service quality dimensions of museums from negative on-line reviews. Tour. Manag. 2018, 69, 214–222. [Google Scholar] [CrossRef]
- Liu, Y.; Teichert, T.; Rossi, M.; Li, H.; Hu, F. Big data for big insights: Investigating language-specific drivers of hotel satisfaction with 412,784 user-generated reviews. Tour. Manag. 2017, 59, 554–563. [Google Scholar] [CrossRef]
- Falk, J.H.; Dierking, L.D. The Museum Experience Revisited, 1st ed.; Routledge: New York, NY, USA, 2016; pp. 1–416. [Google Scholar] [CrossRef]
- Giglio, S.; Bertacchini, F.; Bilotta, E.; Pantano, P. Using social media to identify tourism attractiveness in six Italian cities. Tour. Manag. 2019, 72, 306–312. [Google Scholar] [CrossRef]
- Torre, A.; Scarborough, H. Reconsidering the estimation of the economic impact of cultural tourism. Tour. Manag. 2017, 59, 621–629. [Google Scholar] [CrossRef]
- Eleni, M.; Costantine, L. Factors affecting museum visitors’ satisfaction: The case of greek museums. Tourismos 2013, 8, 271–287. [Google Scholar]
- Moreno Gil, S.; Brent-Ritchie, J.R.; Almeida-Santana, A. Museum tourism in Canary Islands: Assessing image perception of Directors and Visitors. Mus. Manag. Curatorship 2019, 34, 501–520. [Google Scholar] [CrossRef]
- Nowacki, M.; Kruczek, Z. Experience marketing at Polish museums and visitor attractions: The co-creation of visitor experiences, emotions and satisfaction. Mus. Manag. Curatorship 2020, 36, 62–81. [Google Scholar] [CrossRef]
- Oren, G.; Shani, A.; Poria, Y. Dialectical emotions in a dark heritage site: A study at the Auschwitz Death Camp. Tour. Manag. 2020, 82, 104194. [Google Scholar] [CrossRef]
- Richards, G.; King, B.; Yeung, E.Y.M. Experiencing culture in attractions, events and tour settings. Tour. Manag. 2020, 79, 104104. [Google Scholar] [CrossRef]
- Bi, J.-W.; Liu, Y.; Fan, Z.-P.; Zhang, J. Exploring asymmetric effects of attribute performance on customer satisfaction in the hotel industry. Tour. Manag. 2019, 77, 104006. [Google Scholar] [CrossRef]
- Galati, F.; Galati, R. Cross-country analysis of perception and emphasis of hotel attributes. Tour. Manag. 2019, 74, 24–42. [Google Scholar]
- Fernández-Hernández, R.; Vacas-Guerrero, T.; García-Muiña, F.E. Online reputation and user engagement as strategic resources of museums. Mus. Manag. Curatorship 2020, 1–16. [Google Scholar] [CrossRef]
- Ferguson, M.; Pichè, J.; Walby, K. Bridging or fostering social distance? An analysis of penal spectator comments on Canadian penal history museums. Crime Media Cult. Int. J. 2015, 11, 357–374. [Google Scholar] [CrossRef]
- Wight, A.C. Visitor perceptions of European Holocaust Heritage: A social media analysis. Tour. Manag. 2020, 81, 104142. [Google Scholar] [CrossRef]
- Simeon, M.I.; Buonincontri, P.; Cinquegrani, F.; Martone, A. Exploring tourists’ cultural experiences in Naples through online reviews. J. Hosp. Tour. Technol. 2017, 8, 220–238. [Google Scholar] [CrossRef]
- Blei, D. Probabilistic topic models. Commun. ACM 2012, 55, 77–84. [Google Scholar] [CrossRef]
- Guo, Y.; Barnes, S.; Jia, Q. Mining meaning from online ratings and reviews: Tourist satisfaction analysis using latent Dirichlet allocation. Tour. Manag. 2017, 59, 467–483. [Google Scholar] [CrossRef]
- Reyes-García, M.E.; Criado-García, F.; Camúñez-Ruíz, J.A.; Casado-Pérez, M. Accessibility to cultural tourism: The case of the major museums in the city of Seville. Sustainability 2021, 13, 3432. [Google Scholar] [CrossRef]
- Xu, Z.; Zhang, H.; Zhang, C.; Xu, M.; Dong, N. Exploring the Role of Emotion in the Relationship between Museum Image and Tourists’ Behavioral Intention: The Case of Three Museums in Xi’an. Sustainability 2019, 11, 559. [Google Scholar] [CrossRef]
- Villaespesa, E. Museum Collections and Online Users: Development of a Segmentation Model for the Metropolitan Museum of Art. Visit. Stud. 2019, 22, 233–252. [Google Scholar] [CrossRef]
- Frochot, I.; Hughes, H. HISTOQUAL: The development of a historic houses assessment scale. Tour. Manag. 2000, 21, 157–167. [Google Scholar] [CrossRef]
- Borghi, M.; Mariani, M.M. Service robots in online reviews: Online robotic discourse. Ann. Tour. Res. 2020, 87, 103036. [Google Scholar] [CrossRef]
- Tsai, C.-F.; Chen, K.; Hu, Y.-H.; Chen, W.-K. Improving text summarization of online hotel reviews with review helpfulness and sentiment. Tour. Manag. 2020, 80, 104122. [Google Scholar] [CrossRef]
- Mehraliyev, F.; Kirilenko, A.P.; Choi, Y. From measurement scale to sentiment scale: Examining the effect of sensory experiences on online review rating behavior. Tour. Manag. 2020, 79, 104096. [Google Scholar] [CrossRef]
- Shao, J.; Ying, Q.; Shu, S.; Morrison, A.M.; Booth, E. Museum Tourism 2.0: Experiences and Satisfaction with Shopping at the National Gallery in London. Sustainability 2019, 11, 7108. [Google Scholar] [CrossRef]
- Dimache, A.; Wondirad, A.N.; Agyeiwaah, E. One museum, two stories: Place identity at the Hong Kong Museum of History. Tour. Manag. 2017, 63, 287–301. [Google Scholar] [CrossRef]
- Rita, P.; Rita, N.; Oliveira, C. Data science for hospitality and tourism. Worldw. Hosp. Tour. Themes 2018, 10, 717–725. [Google Scholar] [CrossRef]
- UNESCO. Available online: https://whc.unesco.org/en/list/&order=country#alphaI (accessed on 22 November 2021).
- MIBACT. Available online: https://www.turismo.beniculturali.it/en/home-strategic-plan-for-tourism/ (accessed on 20 February 2021).
- Langdetect. Available online: https://github.com/Mimino666/langdetect (accessed on 22 November 2021).
- Dandelion API. Available online: https://dandelion.eu/docs/api/datatxt/li/ (accessed on 22 November 2021).
- Google Language Detection. Available online: https://code.google.com/archive/p/language-detection/ (accessed on 22 November 2021).
- Google Language Model. Available online: https://www.slideshare.net/shuyo/language-detection-library-for-java (accessed on 22 November 2021).
- Imamoğlu, Ç.; Yılmazsoy, A.C. Gender and locality-related differences in circulation behavior in a museum setting. Mus. Manag. Curatorship 2009, 24, 123–138. [Google Scholar] [CrossRef][Green Version]
- Trinh, T.T.; Ryan, C. Visitors to Heritage Sites. J. Travel Res. 2016, 56, 67–80. [Google Scholar] [CrossRef]
- Guizzardi, A.; Mazzocchi, M. Tourism demand for Italy and the business cycle. Tour. Manag. 2010, 31, 367–377. [Google Scholar] [CrossRef]
- Devlin, J.; Chang, M.-W.; Lee, K.; Toutanova, K. BERT: Pre-training of Deep Bidirectional Trans-formers for Language Understanding. arXiv Prepr. 2018, arXiv:1810.04805. [Google Scholar]
- BERT Italian Pre-Trained. Available online: https://huggingface.co/neuraly/bert-base-italian-cased-sentiment (accessed on 22 November 2021).
- Harrell, F.E. rms: Regression Modelling Strategies. R Package Version 5.1-3.1. 2019. Available online: https://CRAN.R-project.org/package=rms (accessed on 3 September 2021).
- Griffiths, T.L.; Steyvers, M. Finding scientific topics. Proc. Natl. Acad. Sci. USA 2004, 101, 5228–5235. [Google Scholar] [CrossRef]
- Cao, J.; Xia, T.; Li, J.; Zhang, Y.; Tang, S. A density-based method for adaptive LDA model selection. Neurocomputing 2009, 72, 1775–1781. [Google Scholar] [CrossRef]
- Arun, R.; Suresh, V.; Veni Madhavan, C.E.; Narasimha Murthy, M.N. On Finding the Natural Number of Topics with Latent Dirichlet Allocation: Some Observations. In Advances in Knowledge Discovery and Data Mining; Zaki, M.J., Yu, J.X., Ravindran, B., Eds.; Springer: Berlin/Heidelberg, Germany, 2010; Volume 6118. [Google Scholar] [CrossRef]
- Deveaud, R.; Sanjuan, E.; Bellot, P. Accurate and effective latent concept modeling for ad hoc information retrieval. Doc. Numérique 2014, 17, 61–84. [Google Scholar] [CrossRef]


| Policy Maker’ Standards | ‘Top-Down’ Quality Dimension | Set of Keywords |
|---|---|---|
| Perception of museum user/visitor towards reception services, i.e., friendliness and professionalism of the staff, hostesses, stewards, security guards, cleaners, ticket office, presence of queues, queues, crowds, waiting, flow management, route management, etc. Perception of museum user/visitor towards costs of basic and additional services, i.e., costs incurred/to be incurred | Ticketing and Welcoming | Free, sliding, queue, free, ticket, throng, crowd, wait, entrance, steward, checkout, cost |
| Perception of museum user/visitor towards museum’s physical location Perception of museum user/visitor towards accessibility, e.g., lifts, platforms/slides for people with disabilities, transport to reach the place, parking lots | Space | Restoration, dirt, external/externally, intern, enter, unkempt, access, imposing, out |
| Perception of museum user/visitor towards use of spaces, e.g., halls, exhibitions, set-ups, lighting, signage, aesthetics, exhibition, captions, tour itinerary, cleaning, indoor locations, outdoor locations | Comfort | Lighting, degraded, cured, held |
| Perception of museum user/visitor towards organised activities and events, e.g., exhibitions, shows, presentations, experiences, workshops, educational activities, events, etc. | Activities | Guided tour, show, event |
| Perception of museum user/visitor towards usability, usefulness, completeness and quality of the applications and content of websites and social accounts, i.e., clarity, completeness and exhaustiveness of the information on the institution available online by consulting the institutional websites and social media/network accounts; quality and usability of the applications available online for booking and purchasing tickets for visiting institutes/exhibitions and the like; website compatibility with mobile devices | Communication | Guide, videoguide, audioguide, package, audio, video, booking, indication, itineraries |
| ‘Top-Down’ Quality Dimension | Accuracy |
|---|---|
| Ticketing and Welcoming | 72% |
| Space | 76% |
| Comfort | 80% |
| Activities | 94% |
| Communication | 75% |
| Average | 80% |
| ‘Top-Down’ Approach | ‘Bottom-Up’ Approach | |
|---|---|---|
| Perspective | Policy Maker/Museum Manager | Reviewer/User/Visitor |
| Categorisation | Supervised (keyword-based) | Unsupervised (topic-based) |
| Training | Required | Not required |
| Results interpretation | Not required | Required |
| Representation | Non-overlapping multiclass classifier output | Topic-based probability distribution |
| ‘Top-Down’ Quality Dimension | Short Description | Excerpt of Review Classified |
|---|---|---|
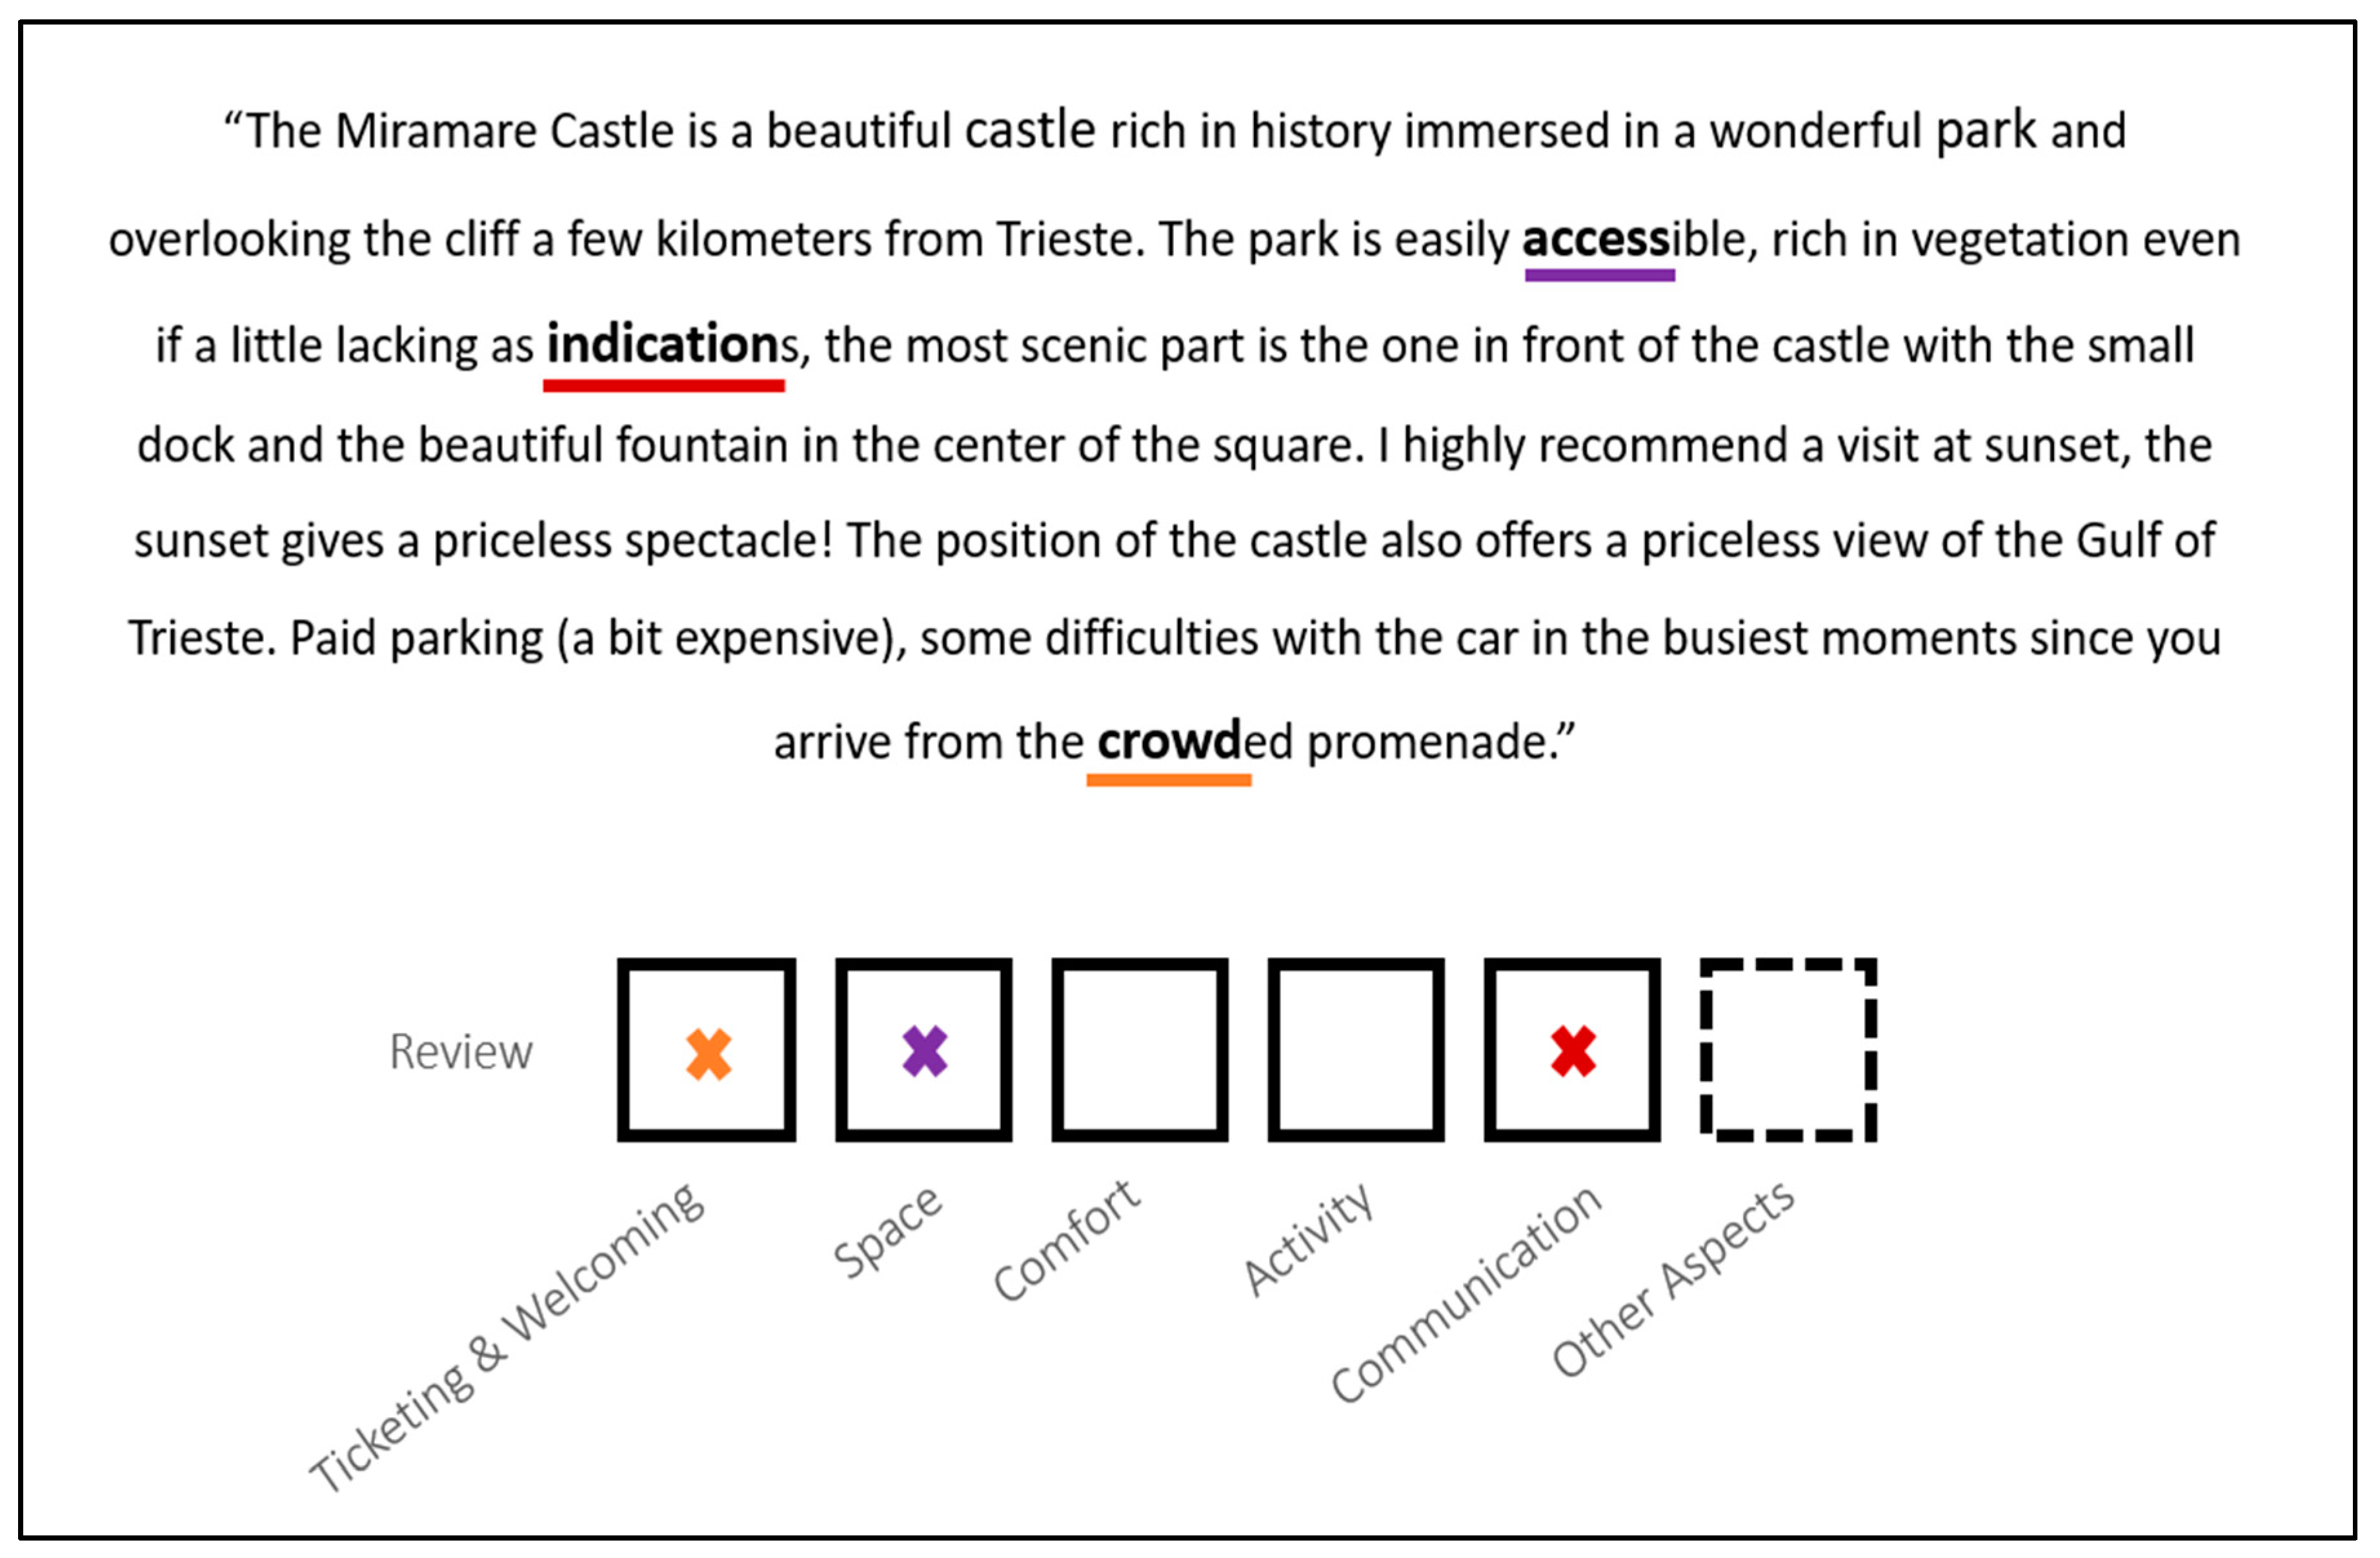
| Ticketing and Welcoming | Aspects related to surveillance, welcoming, fees and costs, such as ticketing, queueing and crowding | ‘… Paid parking (a bit expensive), some difficulties with the car in the busiest moments since you arrive from the crowded promenade.’ |
| Space | Aspects related to the physical characteristics of the museum, such as the location of the museum and its accessibility | ‘… beautiful castle rich in history immersed in a wonderful park and overlooking the cliff a few kilometres from Trieste. The park is easily accessible, rich in vegetation...’ |
| Comfort | Aspects related to the equipment of museums’ exhibitions, such as lighting, cleanliness or maintenance | ‘... the rooms with well-kept furnishings, paintings, furnishings that are well preserved and repaired from tampering ...’ |
| Activities | Aspects related to events organised by museums, such as guided tours and temporary exhibitions | ‘... The advice is to book a guided tour of at least 4 h, as we did, and you will not regret it, as a shorter time is really small...’ |
| Communication | Aspects related to information offered to the public onsite or through online channels, such as physical signposts and audio-guides | ‘… even if a little lacking as indications, the most scenic part is the one in front of the castle with the small dock and the beautiful fountain in the centre of the square...’ |
| ‘Bottom-Up’ Quality Dimension | Most Probable Words (English Translation) | Latent Topics Names | Excerpt of Review |
|---|---|---|---|
| Museum Cultural Heritage | Museum, exposition, floor, room, collection, church, century, fresco, building, structure, marvel, wonder, beauty, artwork, art, gallery, masterpiece, castle seen, inner, landscape, panorama suggest, external, garden, villa, park, palace, fountain | Artistic Collection, Exhibitions and Findings, Castles and Views, Churches and Religious Antiquity, The Museum from Outside, Museum’s History and Tradition | ‘Castle built around 1850–60 in a medieval style wanted by the then Habsburg Empire, more precisely at the behest of Maximilian of Habsburg Archduke of Austria...’ (probability of observing Museum Cultural Heritage in review: 64%) ‘… The museum presents a great variety of works ranging from painting, sculpture and architecture. In addition, you can admire some of the most famous masterpieces of the art world such as... ‘ (probability of observing Museum Cultural Heritage in review: 59%) ‘... The temple was rebuilt in the form in which we can admire it today by the Emperor Hadrian (128 AD), under whose reign the Empire of Rome reached the height of its splendour...’ (probability of observing Museum Cultural Heritage in review: 69%) |
| Personal Experience | Visit, day, suggest, time, place, emotion, experience, see, years, remain, pity, just, personal, tourist, unfortunately | Emotional Visits, Revisits and Expectations, At least once!, Unfortunately | ‘... And every time, looking up at its internal vault, I am amazed at how a closed place can convey that sense of immense space and deep breath to me’ (probability of observing Personal Experience in review: 44%) ‘I remembered seeing a marvel in a state of abandonment, this year I revisited it and I was amazed...’ (probability of observing Personal Experience in review: 41%) ‘… Reviewing the excavations is a great thrill every time, despite the poor signage and maps that are not always clear. However, the organisation turned out to be even worse... ‘ (probability of observing Personal Experience in review: 47%) |
| Museum Services | See, guide, appreciate, organise, path, accompany, explain, tour, ticket, entry, euro, queue, reservation, cost, price, entry, site, park, reach, close, foot, walk, convenient, easy | Accessibility and Transports, Guided Tours, Ticketing (purchase, price, book) | ‘... You can have free and privileged access to the cash desks... the site is easily accessible from Naples by bus...’ (probability of observing Museum Services in review: 46%) ‘... Our guide was extremely engaging, able to actualise what we saw...’ (probability of observing Museum Services in review: 40%) ‘… Having arrived 1 h earlier, we got in line anyway! Once the tickets have been taken, we are told the entrance... ‘ (probability of observing Museum Services in review: 51%) |
| ‘Bottom-Up’ Quality Dimension | Min | Q1 | Q2 | Mean | Q3 | Max |
|---|---|---|---|---|---|---|
| Museum Cultural Heritage | 15.31% | 41.83% | 46.15% | 46.12% | 50.12% | 83.54% |
| Personal Experience | 9.37% | 27.31% | 30.55% | 30.80% | 33.94% | 58.46% |
| Museum Services | 6.47% | 19.59% | 22.05% | 23.09% | 25.61% | 59.46% |
Publisher’s Note: MDPI stays neutral with regard to jurisdictional claims in published maps and institutional affiliations. |
© 2021 by the authors. Licensee MDPI, Basel, Switzerland. This article is an open access article distributed under the terms and conditions of the Creative Commons Attribution (CC BY) license (https://creativecommons.org/licenses/by/4.0/).
Share and Cite
Agostino, D.; Brambilla, M.; Pavanetto, S.; Riva, P. The Contribution of Online Reviews for Quality Evaluation of Cultural Tourism Offers: The Experience of Italian Museums. Sustainability 2021, 13, 13340. https://doi.org/10.3390/su132313340
Agostino D, Brambilla M, Pavanetto S, Riva P. The Contribution of Online Reviews for Quality Evaluation of Cultural Tourism Offers: The Experience of Italian Museums. Sustainability. 2021; 13(23):13340. https://doi.org/10.3390/su132313340
Chicago/Turabian StyleAgostino, Deborah, Marco Brambilla, Silvio Pavanetto, and Paola Riva. 2021. "The Contribution of Online Reviews for Quality Evaluation of Cultural Tourism Offers: The Experience of Italian Museums" Sustainability 13, no. 23: 13340. https://doi.org/10.3390/su132313340
APA StyleAgostino, D., Brambilla, M., Pavanetto, S., & Riva, P. (2021). The Contribution of Online Reviews for Quality Evaluation of Cultural Tourism Offers: The Experience of Italian Museums. Sustainability, 13(23), 13340. https://doi.org/10.3390/su132313340