Communication

Humanitarian Mapping as a Contribution to Achieving Sustainable Development Goals: Research into the Motivation of Volunteers and the Ideal Setting of Mapathons

Department of Geography, Faculty of Science, Masaryk University, Kotlarska 2, 61137 Brno, Czech Republic
*
Author to whom correspondence should be addressed.
Sustainability 2021, 13(24), 13991; https://doi.org/10.3390/su132413991
Submission received: 24 October 2021 / Revised: 7 December 2021 / Accepted: 15 December 2021 / Published: 18 December 2021

Abstract

:
Missing Maps is a humanitarian mapping project that maps vulnerable places in the developing world. Its outcomes are used to target aid in affected areas and to help achieve Sustainable Development Goals. A mapathon is an event in which a group of volunteers maps a defined location. The presented communication answers the following questions: What is the motivation of different contributors in the Missing Maps community in Czechia and Slovakia? How can a mapathon be set up to attract as many participants as possible? How exactly can the contributors to humanitarian mapping subjectively evaluate their contribution so far? A questionnaire about the motivation of contributors and the analysis of statistics from eighteen public mapathons in Brno (Czechia) were used as the primary research methods. The analysis of motivation found six strong motivators. Half of them concern altruism and half of them relate to the importance of the OpenStreetMap project and the mapping community. Analysis of the characteristics of 18 mapathons found that the month of the mapathon had a significant influence on the number of attendants. Statistical analysis confirmed a significant correlation between the number of edits and participants’ self-assessment. This means that humanitarian mappers evaluate their overall contribution very realistically. Analyses with an identical scope are planned for future years.

1. Introduction

Sustainable Development Goals (SDGs) [1] are at the heart of the 2030 Agenda for Sustainable Development [2], which was adopted by all United Nations Member States in 2015. The critical condition for monitoring and meeting the Sustainable Development Goals is the availability of data, including spatial data. Crowdsourced data is helping fill data gaps as well as provide insights into SDGs progress.
In the case of geospatial data, the OpenStreetMap (OSM) project [3] has become a synonym for volunteer mapping, as well as an alternative to the products of national mapping organizations (NMOs). Discussions on the quality of volunteer mapping versus official map products from NMOs remain ubiquitous [4,5,6,7,8]. Volunteer crowdsourcing [9,10] has also become a possible (yet still underutilized) source of data. Spatial data produced by volunteers are referred to as volunteered geographic information (VGI) [11].
The Humanitarian OpenStreetMap Team (HOT) [12] is an international team dedicated to humanitarian action and community development through open mapping. It provides map data for disaster management that reduce risks and contribute to the achievement of Sustainable Development Goals [13]. Beyond the context of open data, it is a broad community partnership to collaboratively create a critical data resource for monitoring and meeting SDGs by making available fundamental, detailed, and timely information on where things are in our world [14].
There are many ways in which crowdsourced mapping using OSM can help to achieve SDGs. For most SDGs, developing basemaps of buildings and road data and place names (i.e., villages, towns, cities) is the starting point. Several examples of relevant demonstrations have been presented in [15]. A brief selection is presented as follows:
  • Goal 1—No Poverty—Putting villages and household footprints on a map is often the first step in giving communities a voice in land rights. Geospatial information is critical in helping people claim their property rights. Kenya’s Map Kibera project (begun in 2009) collects citizen-generated data and other kinds of relevant open data in one of the region’s biggest slums-turned-informal-cities to enhance citizen accountability, development planning, and government use.
  • Goal 3—Good Health and Wellbeing—Public health data collection projects provide local governments and organizations with information to improve their response to health-related issues, such as malaria prevention. In 2018, the HOT supported malaria elimination projects on the ground in Guatemala and Botswana by providing geographical data and training. Data were used for logistics and indoor residual spraying campaigns, for bed net distribution, and for improved monitoring and evaluation to measure intervention impacts.
  • Goal 4—Quality Education—Crowdsourced mapping provides a two-fold benefit towards reaching the SDG for education: assisting partners, governments, and local communities in recognizing gaps in services and the distribution of educational facilities, as well as providing an opportunity for individuals in these groups to gain technical and vocational skills such as GIS and surveying.
  • Goal 5—Gender Equality—Since 2015, the Crowd2Map project has been mapping rural Tanzania. These maps are used by community activists to locate and protect girls at risk of female genital mutilation, as well as to provide local officials with data needed to plan for the development of services.
  • Goal 7—Affordable and Clean Energy—HOT completed the large-scale digitization of rural Tanzania using mapping and household surveys, identifying millions of buildings and more than a thousand villages. By collecting this highly detailed data on settlements, HOT enabled the government and private electricity and renewable energy providers to predict demand and determine where grid and off-grid connections can be made.
  • Goal 9—Industry, Innovation, and Infrastructure—With OSM, roads and buildings can be mapped remotely while teams on the ground add important information such as building conditions and road surface quality.
  • Goal 16—Peace, Justice, and Strong Institutions—Crowdsourced mapping promotes participatory action that increases the representation of communities. OSM is used by humanitarian agencies in decision-making.
Solís et al. [16] describe other examples of how campaigns of volunteered geographic information and participatory GIS driven by the YouthMappers initiative [17] relate to various SDGs. Our focus here is on Goal 3—Good Health and Wellbeing—providing building and road infrastructure information for an insecticide spray campaign to prevent malaria and protect public health in Mozambique and Kenya. The author notes that “Participatory mapping can support greater understanding of connections among places, the people living in them, and the phenomenon arising from global change, in ways that people ranging from scholars to youth to policymakers can quickly grasp”. The remote cooperation between students from George Washington University and students from the University of Kathmandu on the mapping of infrastructure in Kathmandu is an example of cooperation between remote and local participants and the engagement of young people from different parts of the world [16].
Another work by Solís et al. [18] provides a global survey of 205 students participating in the YouthMappers initiative, focusing on how they understand the significance of their work for SDGs. They detected differences by gender and world region. Participants from the Global South perceive themselves to be more engaged with SDGs than those from the Global North. This study suggests that humanitarian mapping can help motivate students to be socially responsible. Leveraging student-led movements on connected campuses offers one possible way of creating a sense of global citizenship, a critical component in achieving SDGs [18].
SDGs are also strongly connected with disaster risk management (DRM). It is impossible to build wellbeing, infrastructure, economic growth, or sustainable cities if our efforts are regularly undermined by natural or man-made disasters. Geospatial data is a necessary part of DRM. Crowdsourced mapping is still underestimated but is a potential source of geospatial data for DRM.
The experience of the OSM response to the 2010 Haiti earthquake demonstrated that volunteers who collaborated around open data could quickly create accurate information after a disaster. Nevertheless, it is better to prepare data in advance of a disaster to allow disaster preparedness. In [19,20,21] we can see other examples of how to create and use prepared crowdsourced geospatial OSM data for DRM:
  • OSM project Community Mapping for Exposure, Indonesia (2011)—the project worked with local governments, university students, and civil society groups. The mapping work focused primarily on critical infrastructure in the capital region of Jakarta, including schools, hospitals, community centers, and places of worship. The resulting data were combined with hazard information from a variety of sources to produce realistic impact scenarios [19].
  • Open Cities project Batticaloa (2012)—Batticaloa, a major city in Sri Lanka’s Eastern Province severely affected by the 2004 Indian Ocean tsunami, is located in a hazard-prone area that has suffered near-annual droughts, floods, and cyclones. Footprints and basic building characteristics, including the number of floors, usage, and the construction materials used for walls and roofs were collected for all buildings in the area [19].
  • Open Cities Kathmandu (2012)—Kathmandu, the capital city of Nepal, is the most seismically at-risk city in the world in terms of the potential for loss of human life during a major event. Open Cities Kathmandu surveyed 2256 schools and 350 health facilities in the Kathmandu Valley [19].
  • One Map Myanmar (2018)—The American Red Cross has been working alongside the Myanmar Red Cross to better understand the locations of critical infrastructure and roads in order to allow decision-making during major disasters such as floods and cyclones [20].
  • Burundi anti-malaria campaign (2020)—Médecins Sans Frontières/Doctors Without Borders (MSF) has prevented the disease from spreading in eastern Burundi with an indoor residual spraying campaign. As large parts of the area were not mapped, Missing Maps volunteers traced nearly 90,000 buildings in the rural region of Ruyigi in Burundi. Over the following month, teams on the ground managed to spray 97% of these households [21].
The latter two campaigns were part of the Missing Maps project. Missing Maps [22] is a humanitarian mapping project that aims to map the most vulnerable places in the developing world using OSM—in advance of an eventual disaster. International and local non-governmental organizations, national and local governments, communities, and individuals use the created OSM data to better respond to crises, achieve SDGs, and monitor their progress. It is essential to have a large pool of trained volunteers ready to assist when a disaster occurs [23]. Hence, there is a motivation to expand the community of voluntary mappers and motivate them to contribute actively.
A mapathon (or mapping party) is an organized collaborative event in which a group of volunteers collectively map a chosen location in places where OSM data is scarce or non-existent [24]. The purpose of mapping parties is to map and socialize [25]. Organizers pursue several aims focused on newcomers: to initiate them into the practice, to have them produce maps throughout the event, and then to retain these new contributors for future activities [26,27]. Classic mapathons are held at an agreed place where mappers from a regional community group and come together in person. However, more and more mapathons are currently organized online due to the pandemic as a substitute for classic mapathons.
Humanitarian mappers do not have to go to mapathons; many of them work online from home. Nevertheless, mapathons can empower users to gain new skills and experience. Users actively producing content in OSM are mostly made up of people who attend mapping parties [25]. One of the key goals of organizing mapathons is to attract recurring participants. They can help to tutor beginner mappers and produce more and better-quality data [28].
The authors of the paper are members of the Czech Missing Maps community and the team that organizes mapathons in the city of Brno, Czechia. The motivation behind this study was to expand the active Czech and Slovak humanitarian mapping community of the Missing Maps project. This means attracting new mappers and ensuring greater attendance at mapathons. To achieve this, it is necessary to discover what attracts contributors from Czechia and Slovakia to participate in humanitarian mapping and to attend mapathons and to discover the reasons why former contributors sometimes cease to contribute. This should reduce the departure of experienced mappers and increase the chances of creating more and better data. This paper communicates our preliminary results after the first round of data collection from the questionnaire. Analyses with an identical scope are planned for subsequent years and forthcoming mapathons.
An additional aim of our study was to examine the respective humanitarian mappers’ self-assessment of their contributions in order to learn more about the contributors’ perspective on humanitarian mapping and mapathons and their level of satisfaction with their mapping efforts.
We attempted to answer the following research questions:
(A) What are the motivations of different contributors in the Missing Maps community in Czechia and Slovakia?
(B) How can a mapathon be set up to attract as many participants as possible?
(C) How do contributors to humanitarian mapping subjectively evaluate their contributions? Do they underestimate or overestimate the importance of their results?

1.1. Citizen Science as an Umbrella for Humanitarian Mapping

The practices of volunteer-based data gathering have a theoretical framework within the concept of citizen science [29]. Citizen science—a new term but an old practice—is related to the opening up of science. Scenarios in which parts of research are in the general public’s hands [30] relate to scientific approaches, tools, and data sets that were formerly used exclusively by researchers. The term “neo-geography” (see Turner [31], who championed the term in 2006) has also been employed [32], though the citizen science approach can be used in any scientific field, not only in geography. For example, West et al. [33] used volunteers to monitor air pollution, while Alender [34] wrote about volunteers monitoring water quality. Citizen science incorporates diverse forms of interaction and cooperation among public volunteers to benefit society and the environment [35,36,37]; these interactions are significantly supported by machine learning and artificial intelligence [38].
The closely-related term citizen management is used by [39,40]. In citizen science, properly trained citizens can participate in a widespread and fine-grained process of knowledge acquisition. In citizen management, citizens adequately trained in problem-solving can change the state of an environmental system with positive effects on the system and themselves [39]. Study [40] describes this concept using the example of beach litter clean-up campaigns. Here, it can be understood that ‘citizen science’ is used in a nature conservation project.
The concept of humanitarian mapping is often referred to in connection with the earthquake in Haiti in 2010, as mentioned in [41,42,43]. This suggests that citizen science activities in humanitarian mapping came later than other citizen science activities, the latter utilized mainly in the natural (environmental) sciences; however, the utilization of community-based mapping in social sciences can also be found (see [44] with the example of socio-economic variables). In the case of humanitarian mapping, where data are needed as quickly as possible, citizen science as an umbrella term for many activities often appears in the form of crowdsourcing [45,46].
Hackley [47] describes crowdsourcing as one of the various levels of public engagement. Crowdsourcing is understood as “the lowest level” of activities linked to data collection. However, the importance of crowdsourcing is enormous (as previously documented, e.g., by Goodchild [11]). We should not see levels of participation as a hierarchically determined sequence, with level 1 (in Haklay’s scale, equal to crowdsourcing) being “worse” than level 4 (equivalent to extreme citizen science, according to Haklay). Indeed, deep research conducted among Czech citizen science projects (see Duží et al. [48]) shows that crowdsourcing is a feature of the majority of such projects. As we focus on spatial data collection, we often use the term volunteered geographic information (VGI), defined by Goodchild [11] and further elaborated, for example, by Sui et al. [45]. In this respect, VGI is used as a synonym for crowdsourcing in the field of cartography and geography [32,45]. Mapathons, conducted as part of humanitarian mapping to expand geospatial knowledge within the OSM project framework, engage the public in an organized way to obtain volunteered geographic information to [49]. A combination of the citizen science approach and the need to contribute to the resolution of socially pressing issues could also serve as a good motivation for participants to be engaged long-term in such voluntary activities [50,51].
Citizen science also has a strong connection to SDGs, an idea that was discussed by Fritz et al. [52] and supported by key policymakers, e.g., during the conference “Knowledge for Change: A Decade of Citizen Science (2020–2030) in support of the SDGs” [53] organized as an official event of Germany’s 2020 EU Council presidency. Fraisl et al. [54] discuss the potential of citizen science to contribute to many more than 76 SDG indicators. The direct connection between humanitarian mapping and SDGs is described in the Introduction.

1.2. The Humanitarian OpenStreetMap Team and the Missing Maps Project

The history of humanitarian mapping is well described [9,55,56,57,58]. The Humanitarian OpenStreetMap Team (HOT) [12] was established in August 2010 to produce maps in OSM for humanitarian work in areas affected by a disaster. It is an example of mapping for disaster management after a crisis has hit.
A very active part of HOT is the YouthMappers initiative [17]. It is an academic network of university-based, student-led, and faculty-mentored local chapters, currently with members from many university campuses in many countries around the world [16]. It is designed to encourage students and their faculty mentors to participate in creating open, free spatial data for humanitarian efforts [24,58]. Participating groups can apply for grants, research fellowships, and other benefits. Studies by Solís et al. [16,18] explain how YouthMappers contribute to various SDGs. This is described in the Introduction.
The Missing Maps project [22] was founded in 2014 as a joint venture of the British and American Red Cross, Médecins Sans Frontières/Doctors Without Borders (MSF), and the Humanitarian OpenStreetMap Team mentioned above [58]. Many other organizations, universities, and entities have joined the project since that time. The goal of the Missing Maps project is to map the most vulnerable places in the developing world where MSF or other humanitarian organizations plan to work. It is an example of mapping as a form of prevention [57].
The Czech and Slovak community is a viable part of the Missing Maps project. The first mapathon in Czechia was held in Prague in June 2016. Over a period of two years (June 2016–June 2018), 840 members of the Czech community participated and mapped more than 400,000 buildings and 13,000 km of roads [59]. In November 2016, Brno became the second Czech city to host a mapathon. After the event, an organizing team in Brno was established and has since organized another 18 mapathons; the first was held in December 2016. Masaryk University hosted most of these events. Others were co-organized by private companies (Red Hat, Kiwi.com (Brno, Czech Republic), CleverMaps (Brno, Czech Republic), and the rest of the mapathons took place as part of various events hosted by non-profit organizations. The attendance statistics from organized mapathons are one of the data inputs of this article.

1.3. (Dis)Connections and Engagements between Stakeholders Related to Humanitarian Mapping

We may identify several kinds of (dis)connections and relationships between various stakeholders related to humanitarian mapping and citizen science. The following statements are based on a review of scientific papers concerning the state-of-the-art, other reference materials, and the experience of the authors of this paper.
Humanitarian mapping, including the use of mapathons, represents one source of newcomers to citizen science. However, as stated for example by Béland [60], humanitarian mapping and mapathons often bring insufficiently skilled or engaged newcomers to the OSM project. Various authors declare that new participants in humanitarian mapping and mapathons exhibit three major weaknesses:
  • their contribution to OSM is low; we speak of ‘hit-and-run’ contributors [60],
  • the average number of mistakes in mappings performed by new participants in humanitarian mapping activities is higher than the average number produced by other more experienced participants [56],
  • most new participants do not become regular participants [61].
We can witness significant tensions between some highly experienced OSM contributors and humanitarian mappers, as stated, for example, by [61,62,63,64]. Experienced OSM contributors claim that the OSM project is being used for a different purpose than that primarily envisaged for OSM, i.e., mapping based on local knowledge [64]. Sometimes, highly experienced OSM contributors are disappointed by the strong public response that humanitarian mapping enjoys throughout society. That is, by the general impression that the OSM project serves a primarily humanitarian purpose [63].
Further tension arises between highly experienced OSM contributors and humanitarian mappers/humanitarian mapping organizers due to their different points of view with respect to initial training [62,64]. Highly experienced OSM contributors support initial training that lasts several hours and comprises a wide variety of examples of mapped spatial objects (in order “to map everything in relation to each other”). In contrast, initial training in humanitarian mapping (e.g., at mapathons) typically lasts about one hour (during a three-hour mapathon) since only three kinds of spatial objects are mapped: buildings, residential areas, and roads. Conceptually, therefore, the demands of these two stakeholder groups are different: highly experienced OSM contributors desire mapping in its full complexity, while humanitarian mappers adopt a more limited, application-driven approach. Generally speaking, however, both stakeholder groups collaborate intensively despite these differences, driven by a shared passion and a common goal: to prepare a free and editable map of the world.
The following conceptual steps would bring the various stakeholder groups of highly experienced OSM contributors and humanitarian mappers closer together:
  • Humanitarian mappings should be organized with as many local contributors as is feasible. Such a step is crucial for synergy between both stakeholder groups [63]. The participation of local contributors from the mapped countries adds value to the remote action, as described by Solís et al. [16,18] regarding the case study of Kathmandu Living Labs. It allows for the creation of both local and remote open data.
  • The number of repeat participants should be increased. This is also one of the primary goals of the efforts described in our paper. Increasing the number of repeat participants would lead to an improvement in the overall quality of mapping thanks to (1) the further training received by less-experienced mappers and (2) the greater input received from highly experienced contributors [62].
  • Unlike classical contributions to OSM, humanitarian mapping allows for the secondary revision of created data by more experienced users, regarded as “validators” [16]. The shorter initial training of humanitarian mappers should be compensated by the more complex training of validators and organizers of mapathons [64] as well as the development of data validation tools, even during the mapping process [61]. The role of humanitarian mapping validators is essential for maintaining the high quality of all contributions made during humanitarian mapping—in particular, at mapathons.

1.4. Looking for the Motivations of VGI Contributors

Humanitarian projects based on OSM (HOT OSM, Missing Maps) have many volunteers. In general, the participants’ motivations may range from enjoying helping vulnerable people to spending free time doing “good things”. Motivations can also be influenced by many other aspects, as recently described in [65]. Furthermore, using gamification approaches to mapping (e.g., getting ‘points’ for every changeset in the map) can help maintain participation by, for example, creating a sense of competitiveness amongst the players and making them feel they are part of a community when playing as a team [61].
Detailed analysis of the motivations of mapathon participants is described, for example, by Dittus, Quattrone, and Capra [26]. They investigated whether first-time participants (beginners) with little experience continue mapping at home in the week after the mapathon. On average, 50% of monthly mapathon attendees were recurring visitors. Around 10% of first-time attendees subsequently mapped at home in the first week, and a similar proportion returned to a future mapping party event. The number was significantly lower in irregular mapathons organized mainly by private companies. It seems that the regularity of mapathons is essential to maintain motivation among newcomers. Online participants of mapathons were approximately three times less likely to be retained for future work.
Dittus, Quattrone, and Capra [26] also looked at what influenced the retention of beginner participants. Technical problems during the mapathon could negatively affect the work of newcomers. However, they did not influence the number of newcomers that continued mapping after the mapathon. Having a mix of attendees in terms of prior experience, from newcomers to highly experienced mappers, also had a positive effect. The enthusiasm of others can inspire newcomers.
Loftian et al. [66] and Hristova et al. [25] note that mapathons result in a significant increase in OSM contributions, though, in contrast to experienced users, newcomers typically stop participating after the event is over. Hristova et al. [25] measured user participation in mapping parties organized regularly in the Greater London area. Most mappers (69%) participated in one event only, while the remaining 31% took part repeatedly. Mapping party attendance appears to be seasonal, with decreased attendance in the first and last quarters of each year.
Green et al. [28] organized four mapathons in which only students of geoinformatics participated. A total of 60% of mappers participated in more than one mapathon. However, extra credit was offered to the students as an incentive. They also measured productivity and found that more experienced participants were generally more productive.
Questionnaires to determine the motivations of OSM contributors were used by Schmidt and Klettner [67], Budhathoki and Haythornthwaite [68], and Alender [34]. Schmidt and Klettner [67] asked inactive OSM participants what could motivate them to become active again. The answers differed according to the participants’ previous experience. Less experienced contributors specified tutorials for beginners, while more experienced contributors identified mapping for a specific purpose, e.g., disaster mapping, as a potential motivation. Many inactive participants mentioned “lack of time” as the reason for their inactivity.
Budhathoki and Haythornthwaite [68] explored differences in motivation between serious and casual OSM contributors. Both groups emphasized the importance of the community, the goals of the project (a free detailed map of the world), and the importance of helping others. Differences between groups were also described. Serious mappers were more oriented towards the community (the goal of OSM cannot be achieved without a community) than casual mappers. Casual mappers were more oriented towards the overall goals of free and open-source projects (maps should be available for free).
Alender [34] describes similar results. The strongest motivators for participants are helping enhance the environment, helping the community, connecting with nature, and contributing to scientific knowledge. The weakest motivators are enhancing reputation in the community and advancing one’s career. No variation by gender was found, but younger volunteers rated “career” motivation much more highly than the other age groups. The study also recommends grouping more experienced volunteers with less experienced volunteers.
The aforementioned papers seem to indicate that motivation depends on the experience of the contributors and that the desire to help others is a strong motivator not only for humanitarian mappers. An interest in geography and a love of maps are, of course, communitywide motivators. Both casual and serious mappers are well motivated by orientation and interest in mapping and geography and particularly by the possibility of contributing to local geography [68].
The creation and use of maps are topics also researched by means of psychological methods. Gómez-Barrón, Manso-Callejo, and Alcarria [69] offer a psychological view of the motivation of VGI producers. Another type of interdisciplinary research in psychology, geography, and cartography using psychological methods is presented by [70]. Volunteerism, however, is probably as old as humankind and is not related specifically to VGI or OSM. An example of a study about the motivation of volunteers not focused only on VGI is that by Clary and Snyder [71].

1.5. Experiences with Mapathons—How to Make Them Successful

The abovementioned work [26] looked at how some aspects of the organization of mapathons influence their success. They discussed, among others, the following measures:
  • Mapathons should include a mix of less and more experienced participants so that attendees who are experienced in mapping can provide necessary peer support.
  • Refreshments should be served in a separate area—food served in a separate room may disrupt work, but it also encourages communication between participants.
  • Technical issues at mapathons (especially a weak internet connection or too few electrical outlets) should be kept to a minimum, as they diminish the participants’ overall experience.
A comparison of mapathon organization experiences from three different universities in three different countries (Italy, USA, South Africa) is offered in [24]. Various strategies are discernible. The following is a list of examples that could serve as inspiration:
  • Some universities accept mapathons as part of the curriculum [24]. Another possibility is to incorporate the teaching of open imagery and open mapping tools in other programs and courses [16].
  • Some universities give additional credit to students who participate in mapathons [24,28]. Students use it to improve their grades, so this gesture boosts attendance. On the other hand, some studies cast doubt on this approach. Clary and Snyder found that there was a slightly negative relationship between prior experience and future intentions to volunteer for students who felt under external pressure to volunteer [71].
  • Students participating in Youth Mappers are involved voluntarily and regularly organize mapathons for their members [24].
  • Sometimes, finding a date for a mapathon suitable for most students is challenging (e.g., during exam periods). A humanitarian mapping project could be selected on the HOT Tasking Manager, which would allow contributors to contribute for a whole week [24].
  • A mapathon could include a Skype call with a practitioner from the agency requesting the data in order to provide context [24].
  • The website “Show Me The Way” [72], which displays the real-time mapping of OSM users, is visible on a large screen during the mapathon [24].
The most comprehensive recommendations for organizers of mapathons can be found on the official website of Missing Maps [23,27]. Here is a summary:
  • Find a space that fits your group—a library, community center, university, private company, etc.
  • Publicize your event on social media, on websites, in the local OSM community, etc.
  • A strong Internet connection (typically wifi) is necessary. Slow wifi is the worst threat to the success of a mapathon.
  • Recruit organizers/helpers. One helper is recommended for every 10 mappers at in-person events and for every 2 or 3 mappers online, depending on the group size.
  • There must be a sufficient number of extension cords for everyone to power a laptop.
  • Extra laptops/computers for people that may not bring their own are a good idea.
  • Print training and publicity materials—available on MissingMaps.org.
  • Arrange refreshments for the mappers. They will stay longer, and they will map longer. “Pizza fills the Map!”
  • Invite a special guest who can present his experience from the field (e.g., MSF, HOT, OSM, etc.).
  • Inform people about the mapping task and the locality; speak with them about what they see on the map.
  • Use a group hashtag during mapping. It allows the results of your group to be summarized after more mapathons or at the end of the year.
  • Show the mapathon results—the number of mapped buildings and paths; use a leaderboard to show the best mapper of the mapathon.
  • At the end of the mapathon, go to the pub with the mappers. It is a way of recruiting new organizers to your team.
Organizers of mapathons from the Czech and Slovak Missing Maps community added some further tips based on their experiences (shared on the Trello platform of the Czech and Slovak community [73]):
  • Search for and try new locations for mapathons. Try to reach companies.
  • Allow participants to choose from more groups with different levels of experience—e.g., beginners, advanced mappers, experts/validators. Each group can have its own experienced trainer who explains tips appropriate to the level of his group.
  • Some experienced mappers should be with a group of beginners to be available to help or to answer questions [28,73].
  • There should also be a group for participants who want to map without training and without being disturbed. Usually, this is the case with experienced mappers.
Most of the above-mentioned recommendations for setting up mapathons are employed for mapathons organized in Brno. In the literature and manuals, however, there is a lack of statistical evidence about the influence of these recommendations—e.g., the possibility of using a borrowed computer. Mapathons held at the Department of Geography offer computers to participants who do not have their own laptops.
In addition, some aspects are not covered in manuals for organizers—e.g., the choice of a weekday for a mapathon. We tried to explore the influence of selected characteristics of mapathons on attendance.

2. Materials and Methods

Two types of data were collected:
  • Questionnaire answers about the motivations of contributors from the Czech and Slovak Missing Maps community for humanitarian mapping.
  • Attendance statistics concerning the previous 18 mapathons organized in Brno city.
Questionnaire data were collected from February 2020 to April 2020. The questionnaire was prepared in web form. It was focused on anyone interested in the Missing Maps project in Czechia and Slovakia. The questionnaire was disseminated through many electronic communication channels, either by e-mail to former participants of mapathons or through sharing in the official Facebook group of the project “Missing Maps Czechia & Slovakia.” We also planned to offer questionnaires to participants during various mapathons in Czechia; however, in-person mapathons were canceled because of the COVID-19 pandemic and switched to online events. Despite all the dissemination methods used, only 44 completed questionnaires were obtained—see Table 1. We see this paper as a communication of our preliminary but significant results. Analyses with an identical scope are planned for upcoming years and upcoming mapathons.
The questionnaire consisted of several sections. The first section collected the anonymous personal details of the participants—age, gender, education, the field of employment or study, and status of employment. These are presented in Table 1. The main section of the questionnaire concerned the evaluation of motivation. Motivation, in this case, was defined on the basis of 21 statements that represent possible motivators (Table 2). The motivators and statements offered in the questionnaire were based on the studies by Budhathoki and Haythornthwaite [68] and by Clary and Snyder [71]. All statements were measured using a five-point Likert-type scale with 1 as strongly disagree and 5 as strongly agree.
In the last section, participants were asked to fill in the number of his/her total edits from their profile on the Missing Maps page [74]. They were also asked to evaluate their overall contribution to the OSM project, this time on a scale from 1 (minimal contribution) to 10 (maximal contribution). This section of the questionnaire also asked “When was the last time you contributed to humanitarian mapping?” If a participant selected the answer “more than one year ago”, additional questions appeared, such as “Why did you stop contributing?” and “Do you plan to continue?”
The responses from the questionnaires were analyzed using methods of descriptive statistics. Simple statistical measures were used, including means, medians, and standard deviations. The assumption of normal distribution was tested by the Shapiro–Wilk test. Because the distribution did not assume a normal distribution, we conducted the Mann–Whitney U test to identify differences in motivation between identified groups of humanitarian mapping contributors (based on age, gender, education, mapping experience, field of employment or study, and status of employment). For the same reason, Spearman’s coefficient was used to calculate the correlation between the number of edits made by a participant and the participant’s evaluation of his/her contribution to OSM. Results are displayed using a boxplot graph.
We also analyzed attendance statistics relating to public mapathons in Brno that were organized by our group. These comprised 18 public mapathons held between December 2016 and February 2020 with 183 individual participants. We correlated the characteristics of mapathons in Brno with their attendance and tried to find positive and negative factors influencing the attendance rate. We analyzed the impact of:
  • location,
  • day of the week,
  • month of the year,
  • the possibility to come without a laptop and use a borrowed computer.
The number of participants was also analyzed using methods of descriptive statistics (mean, median) and common types of graphs (line graph, bar chart). Because the distribution did not assume a normal distribution (verified by the Shapiro–Wilk test), we conducted the Mann–Whitney U test and Kruskal–Wallis H test to identify differences in attendance. Results were displayed using common types of boxplot graphs, stacked column graphs, bar graphs, and line graphs.
We were also interested in the portion of recurring participants in mapathons. One of the key goals of organizing mapathons is to motivate contributors to attend mapathons repeatedly.

3. Results

The results are presented in line with the three research questions defined in this study. Answers to each research question are then presented in sub-sections dealing with specific aspects in detail.

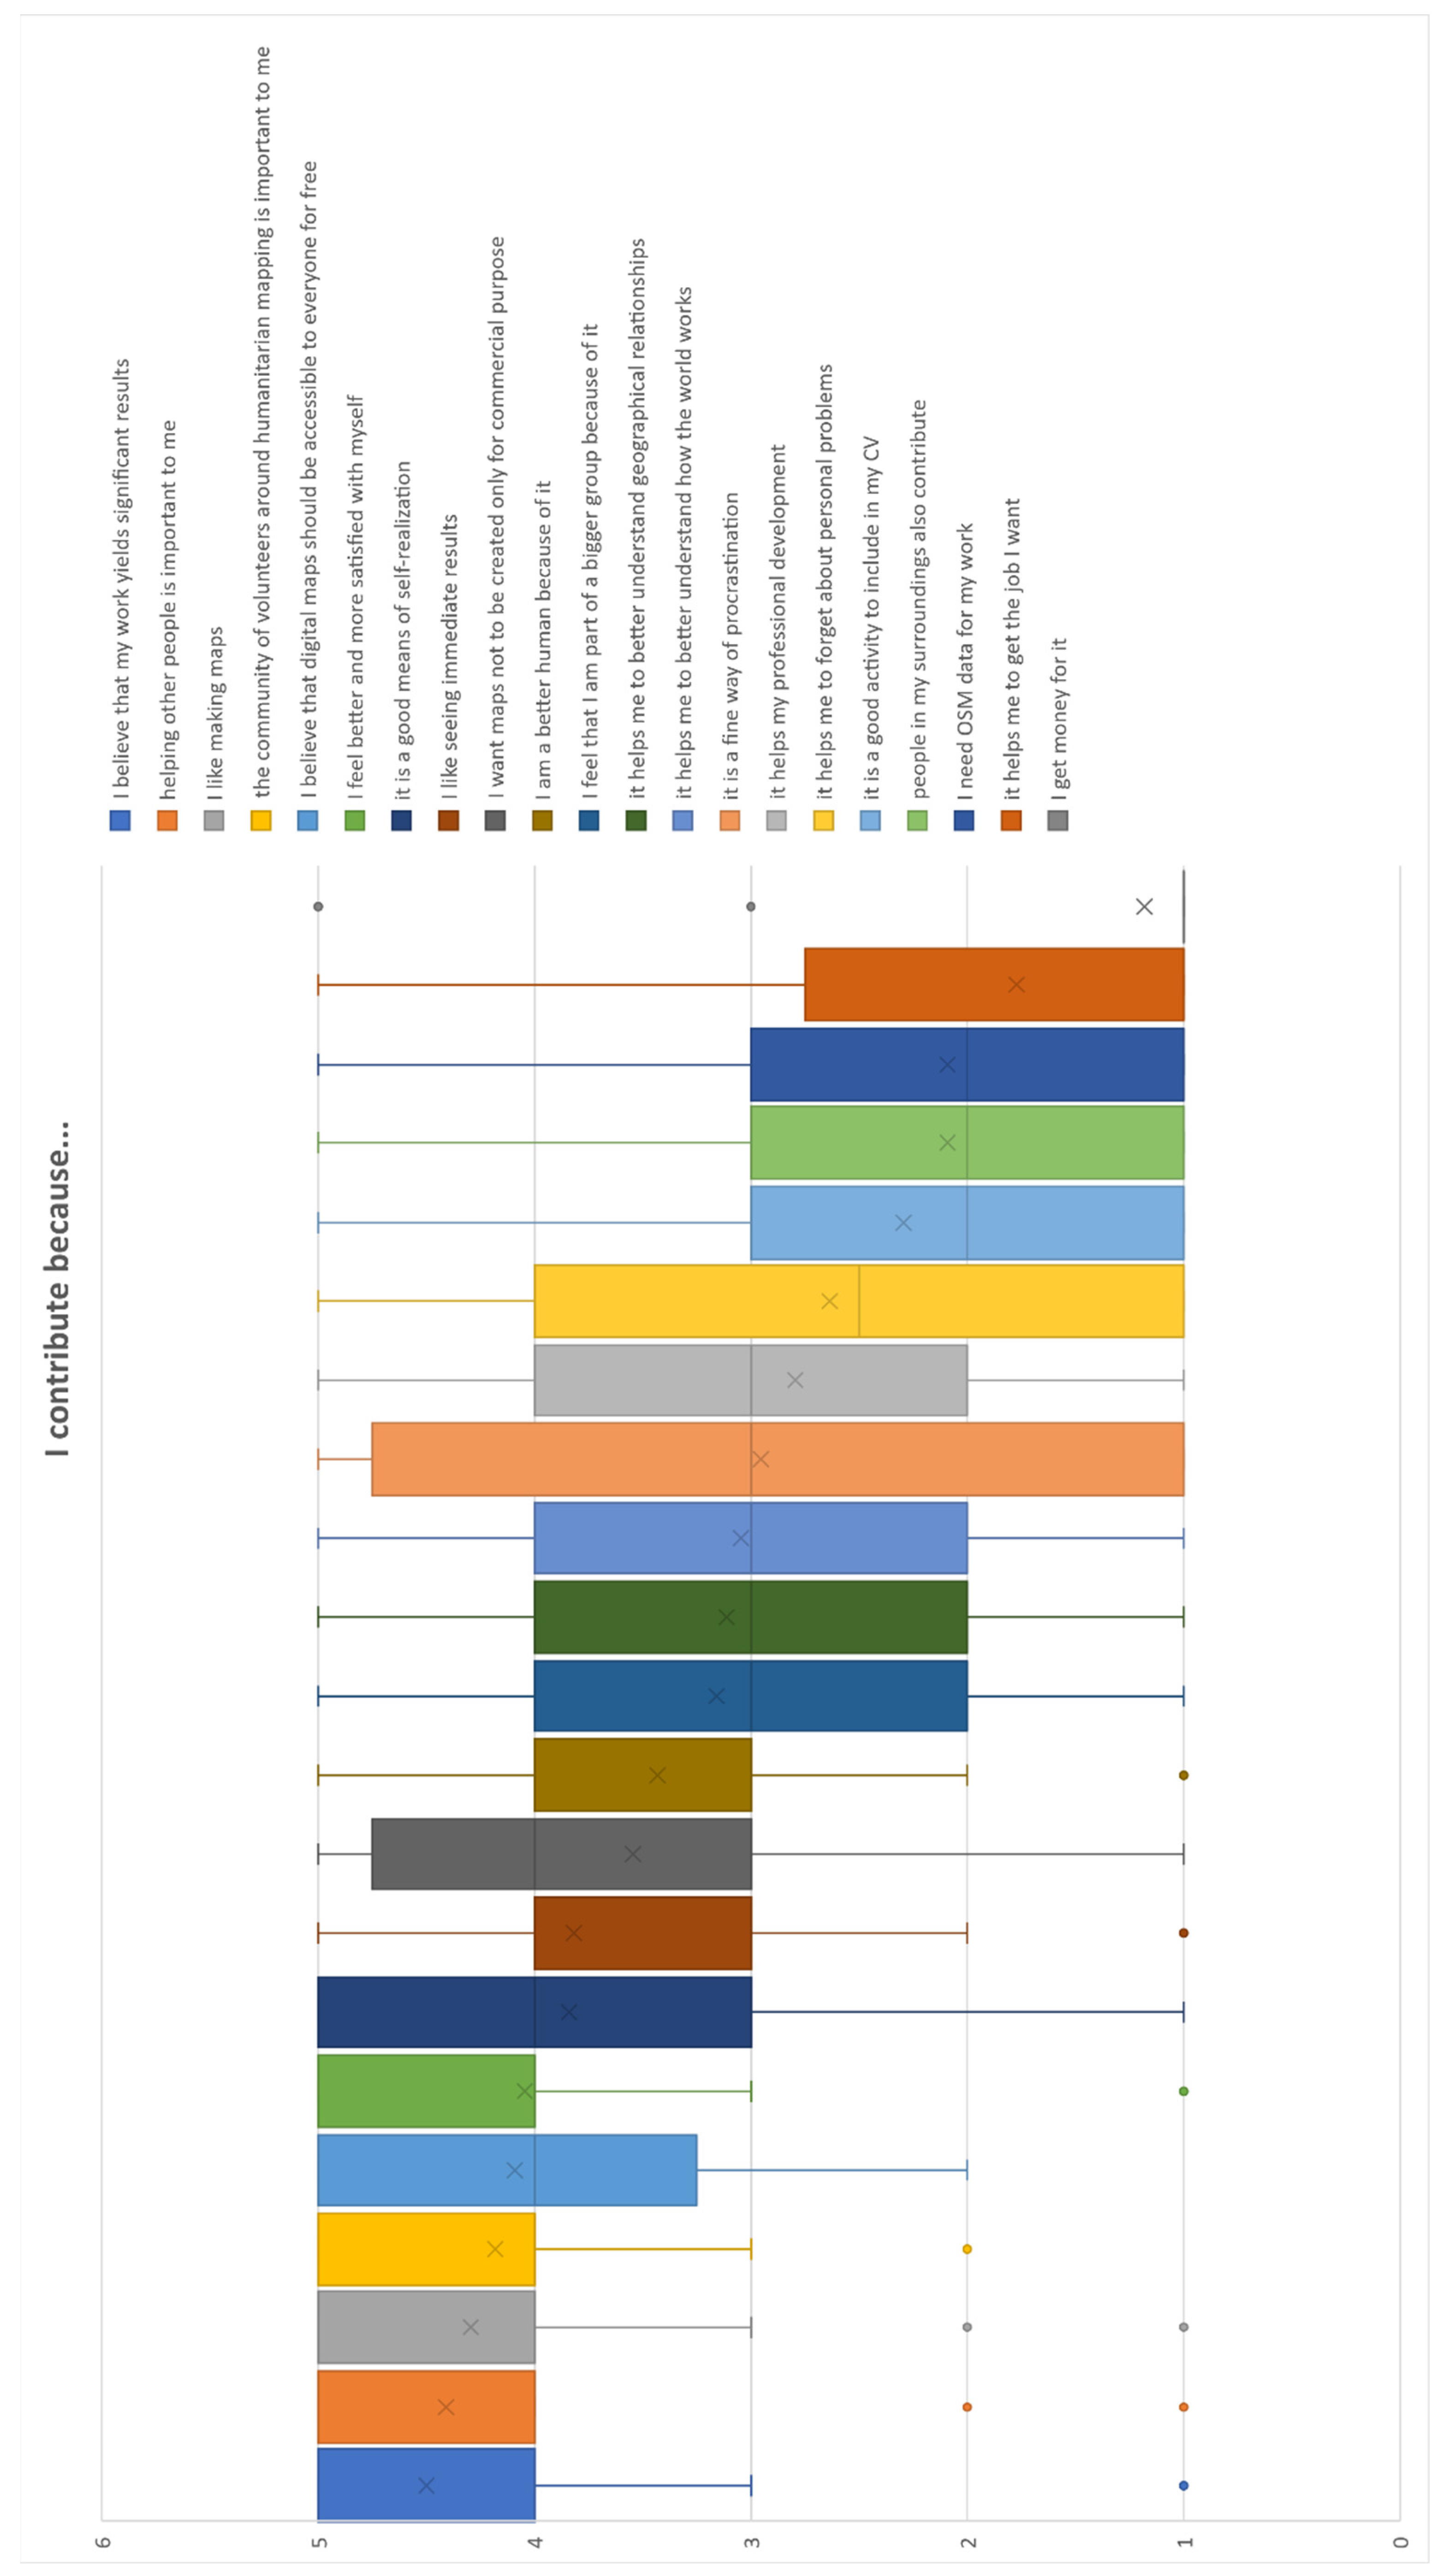
3.1. The Motivation for Contributing to Humanitarian Mapping

Identifying the motivations of different humanitarian mappers was the primary goal of the questionnaires. Respondents evaluated 21 statements that represented possible motivators. We analyzed both the general motivations of all participants and differences in motivation between various groups of participants.

3.1.1. The General Motivation for Contributing without Division into Groups

The mean and median values for each statement are presented in Table 2. A high score (a value between 4 and 5) indicates that individuals considered the item to be a highly significant motivator behind their contribution to humanitarian mapping projects.
The results in Table 2 and Figure 1 can be partially summarized as follows. The three most important motivations are:
  • to produce beneficial results (“I believe that my work yields significant results”),
  • to feel a sense of solidarity with other people (“helping other people is important for me”),
  • to achieve personal satisfaction (“I like making maps”).
In general, most of the primary motivations are those related to creating a greater good. In contrast, self-rewarding aspects were considered the least important (“it helps me to get the job I want,” or “I get money for it”).
Figure 1. Motivations for contributing—answers of all participants to the questionnaire.
Sustainability 13 13991 g001

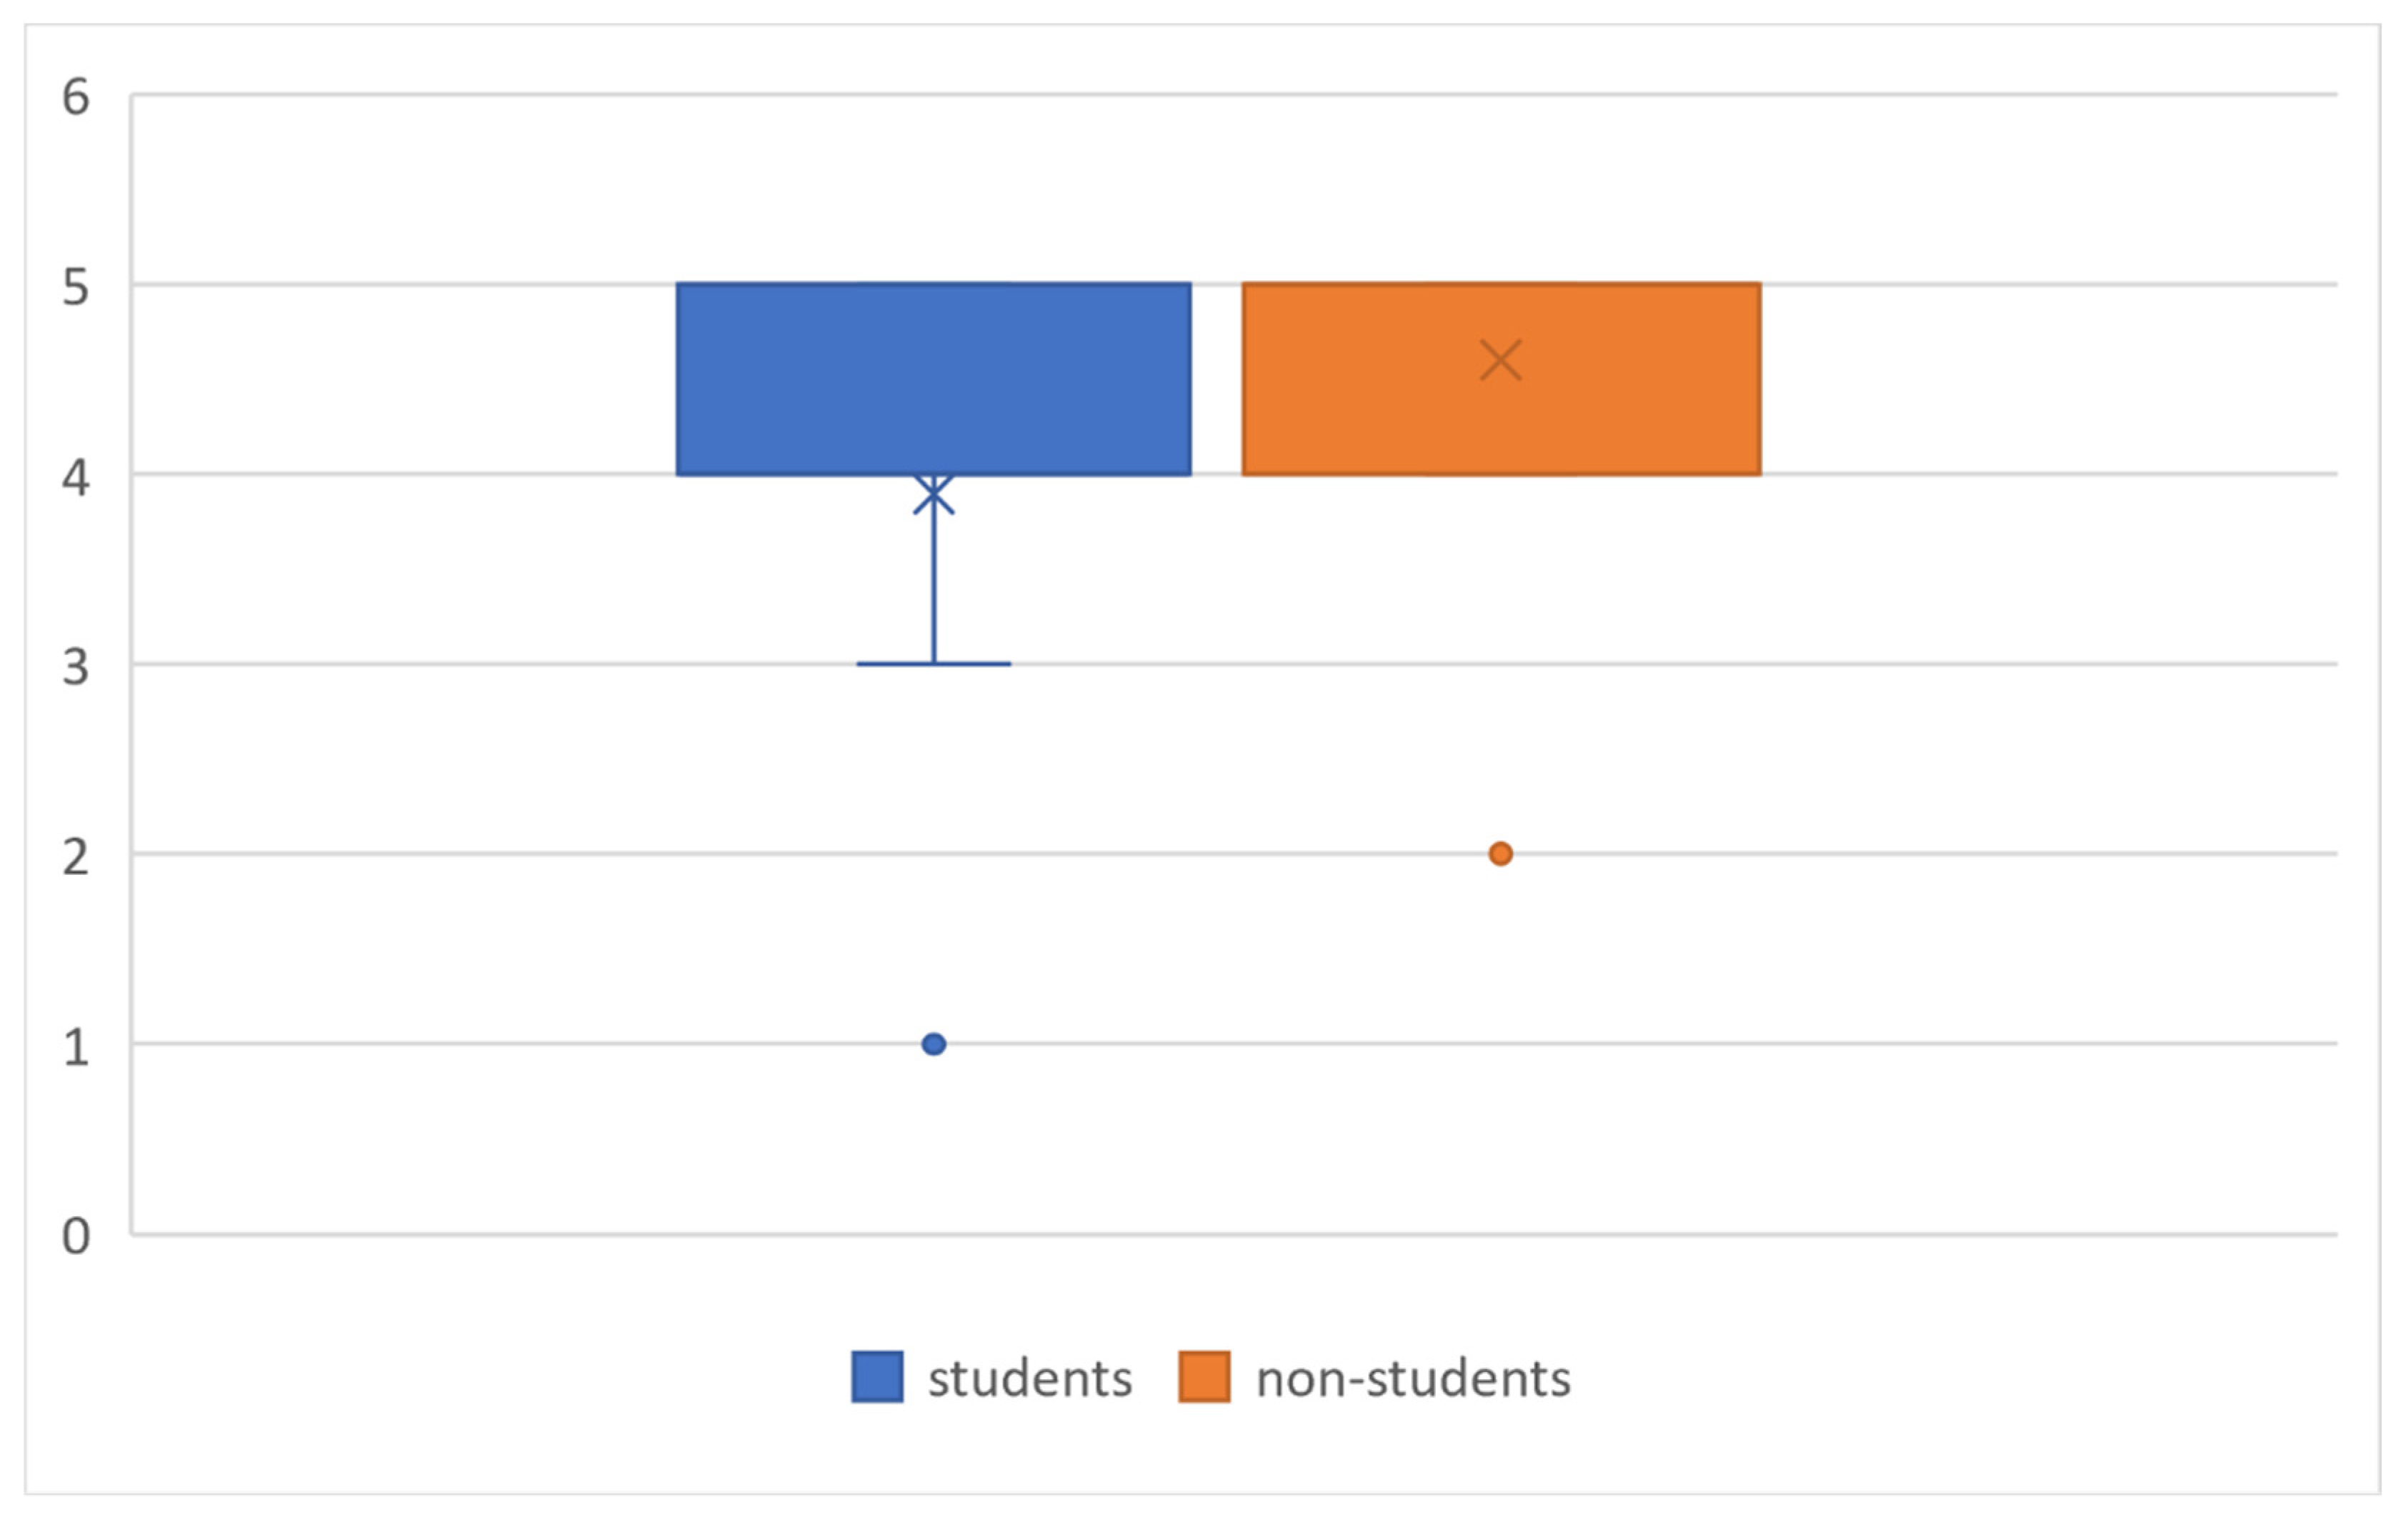
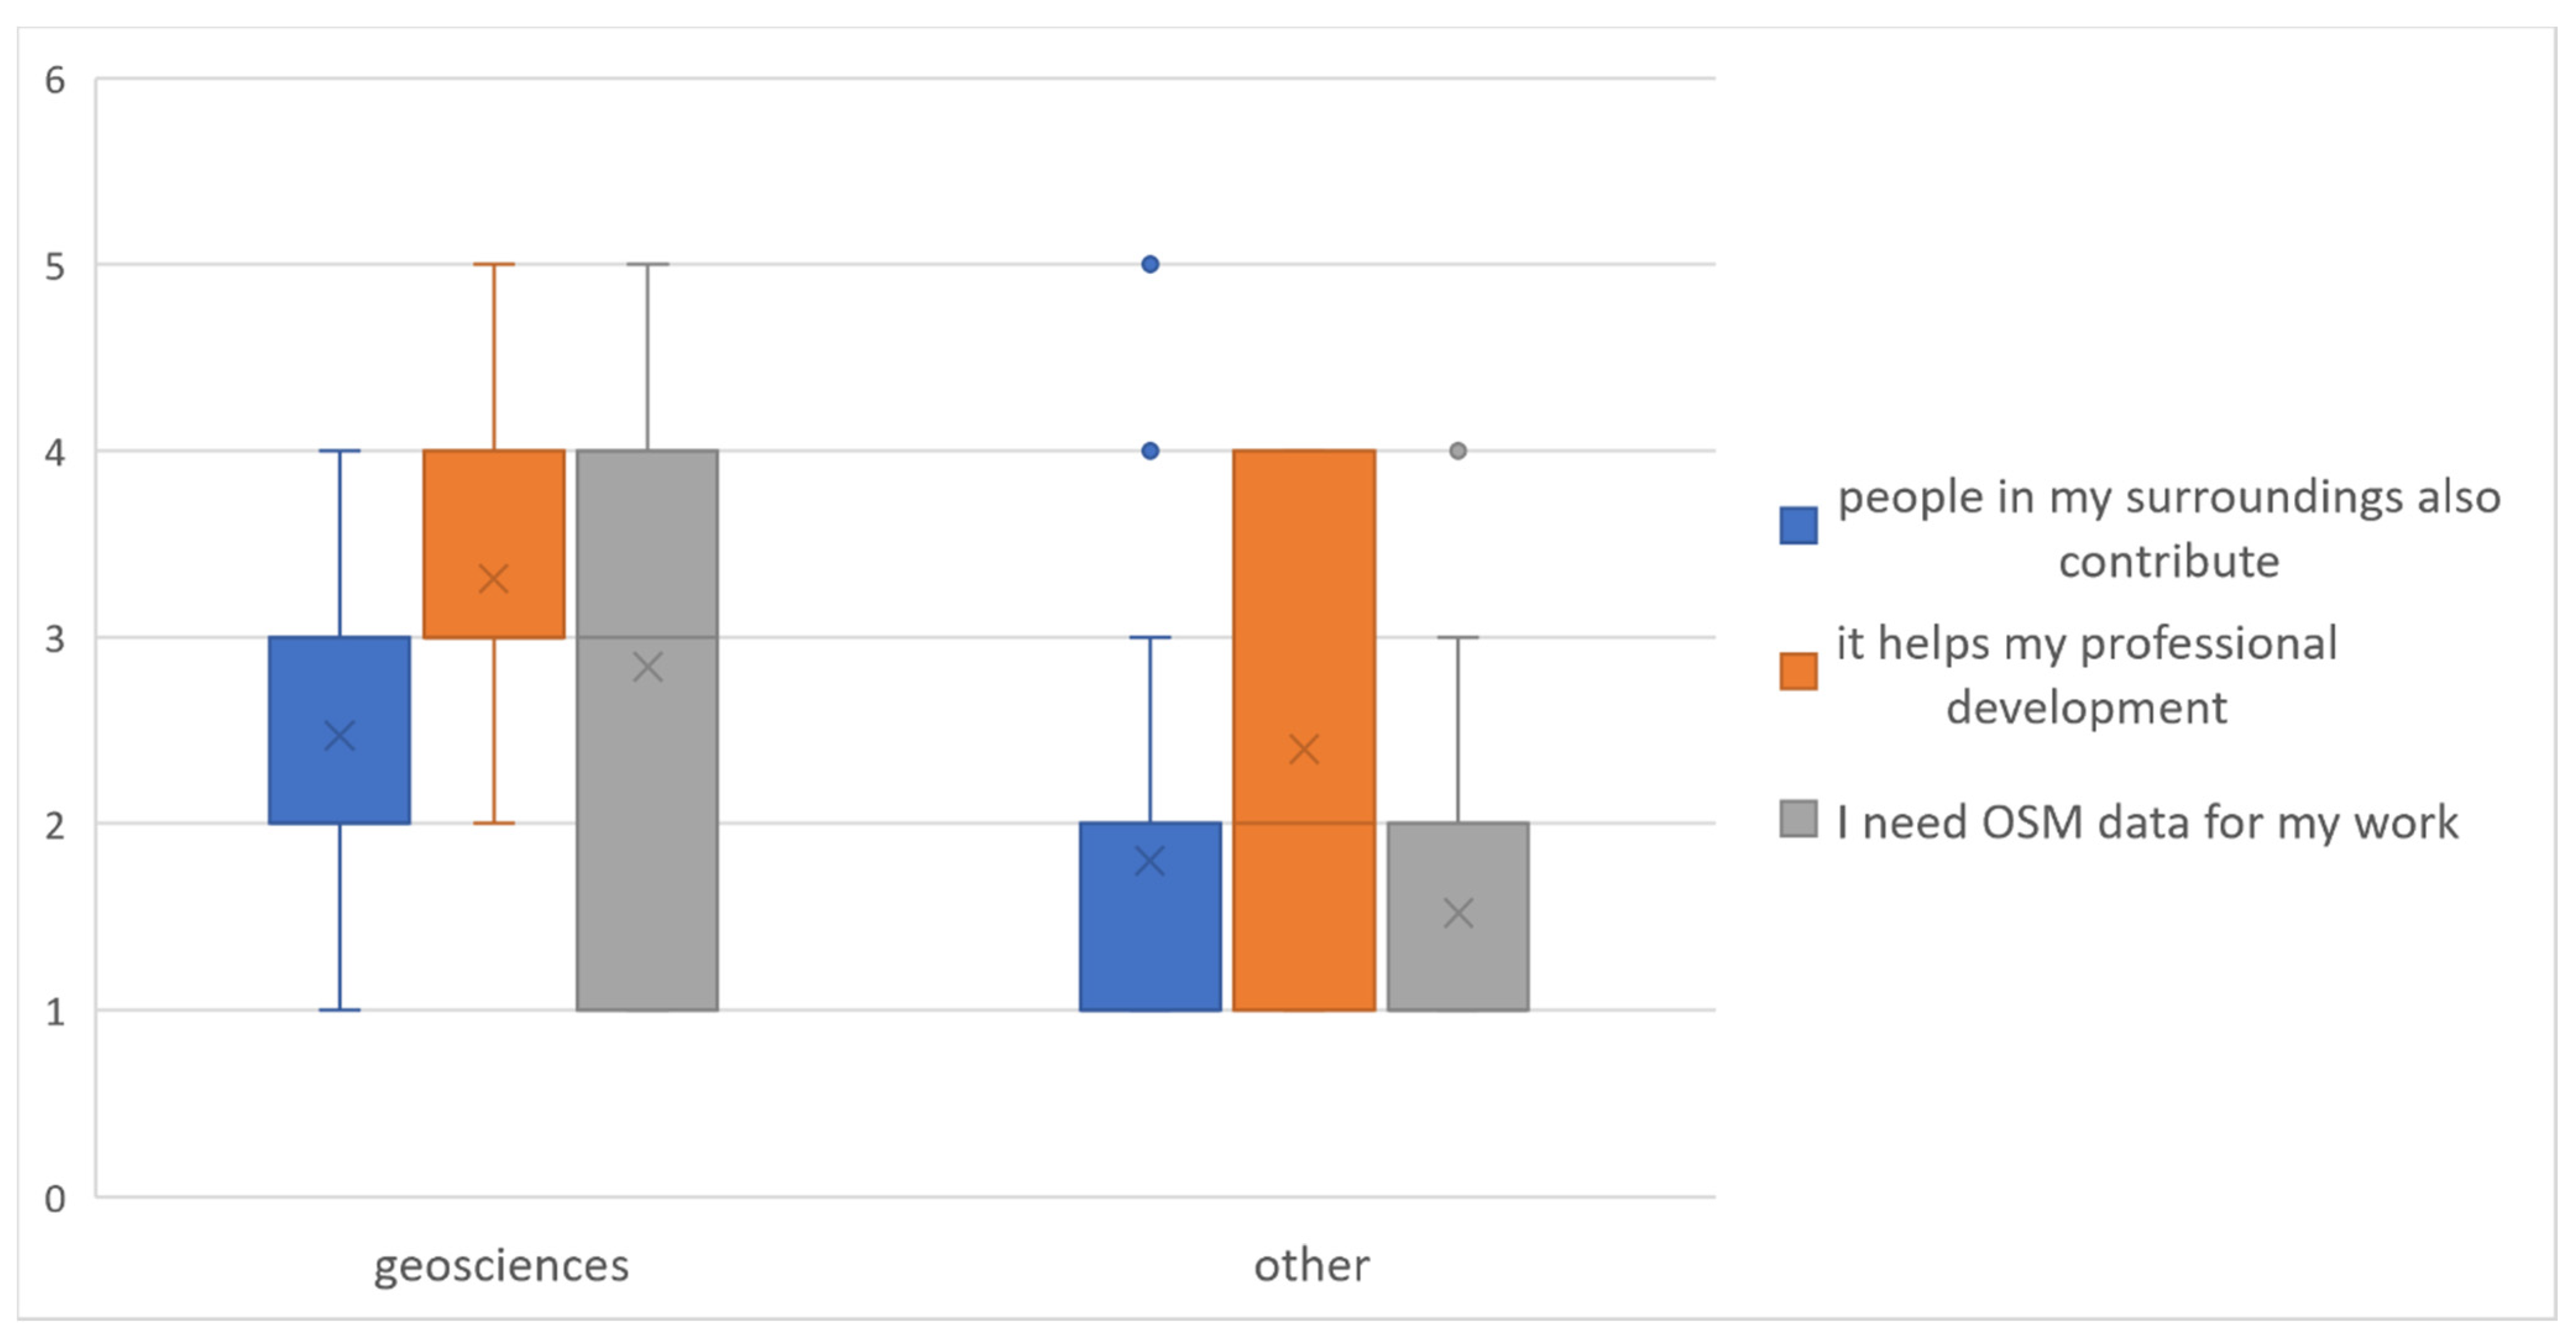
3.1.2. Differences in Motivation between Various Groups of Participants

Participants were divided into groups according to their characteristics—age, gender, education, mapping experience, field of employment or study, and status of employment. Differences in the responses to the 21 given statements between these groups were statistically analyzed. The differences in responses between groups based on age, gender, education, and mapping experience were not statistically significant, as shown by the conducted Mann–Whitney U tests. In contrast, statistically significant differences were found in the case of groups based on the status and field of employment or study.
For status of employment, participants were divided into two groups: students and non-students (employed, retired, children, and others). A difference between these groups was found for the motivator “I like making maps” (Table 3, Figure 2). It was more important for non-students (a median value of 5) than for students (a median value of 4).
For the field of employment or study, participants were divided into two groups: geosciences (cartography, geoinformatics, geodesy, physical geography, human geography, geology) and other fields. Significant differences were found for the motivators: “people in my surroundings also contribute”, “it helps my professional development”, and “I need OSM data for my work” (Table 4, Figure 3). All of these motivators were stronger for participants connected to geosciences.

3.1.3. Reasons for Former Contributors to Have Ceased Participation

Our study aimed to identify the motivations of humanitarian mappers from the Czech and Slovak Missing Maps community to participate in mapathons. On the other hand, we also tried to discover the reasons why former contributors ceased their participation. In the questionnaire, 5 of the 44 participants answered that their previous contribution had been more than one year ago. They mentioned two reasons for this—a lack of time (3) and the relatively large distance to the city where mapathons are held (2)—as indicated in their answers below:
  • “I have a small child (already the third). I have not contributed since its birth. When I have time, I want to continue.”
  • “Lack of time, but I would like to continue again.”
  • “I rapidly reduced my mapping activities due to a higher workload.”
  • “I moved outside Prague. I cannot go to mapathons.”
  • “I live outside Prague. Maybe I will continue.”

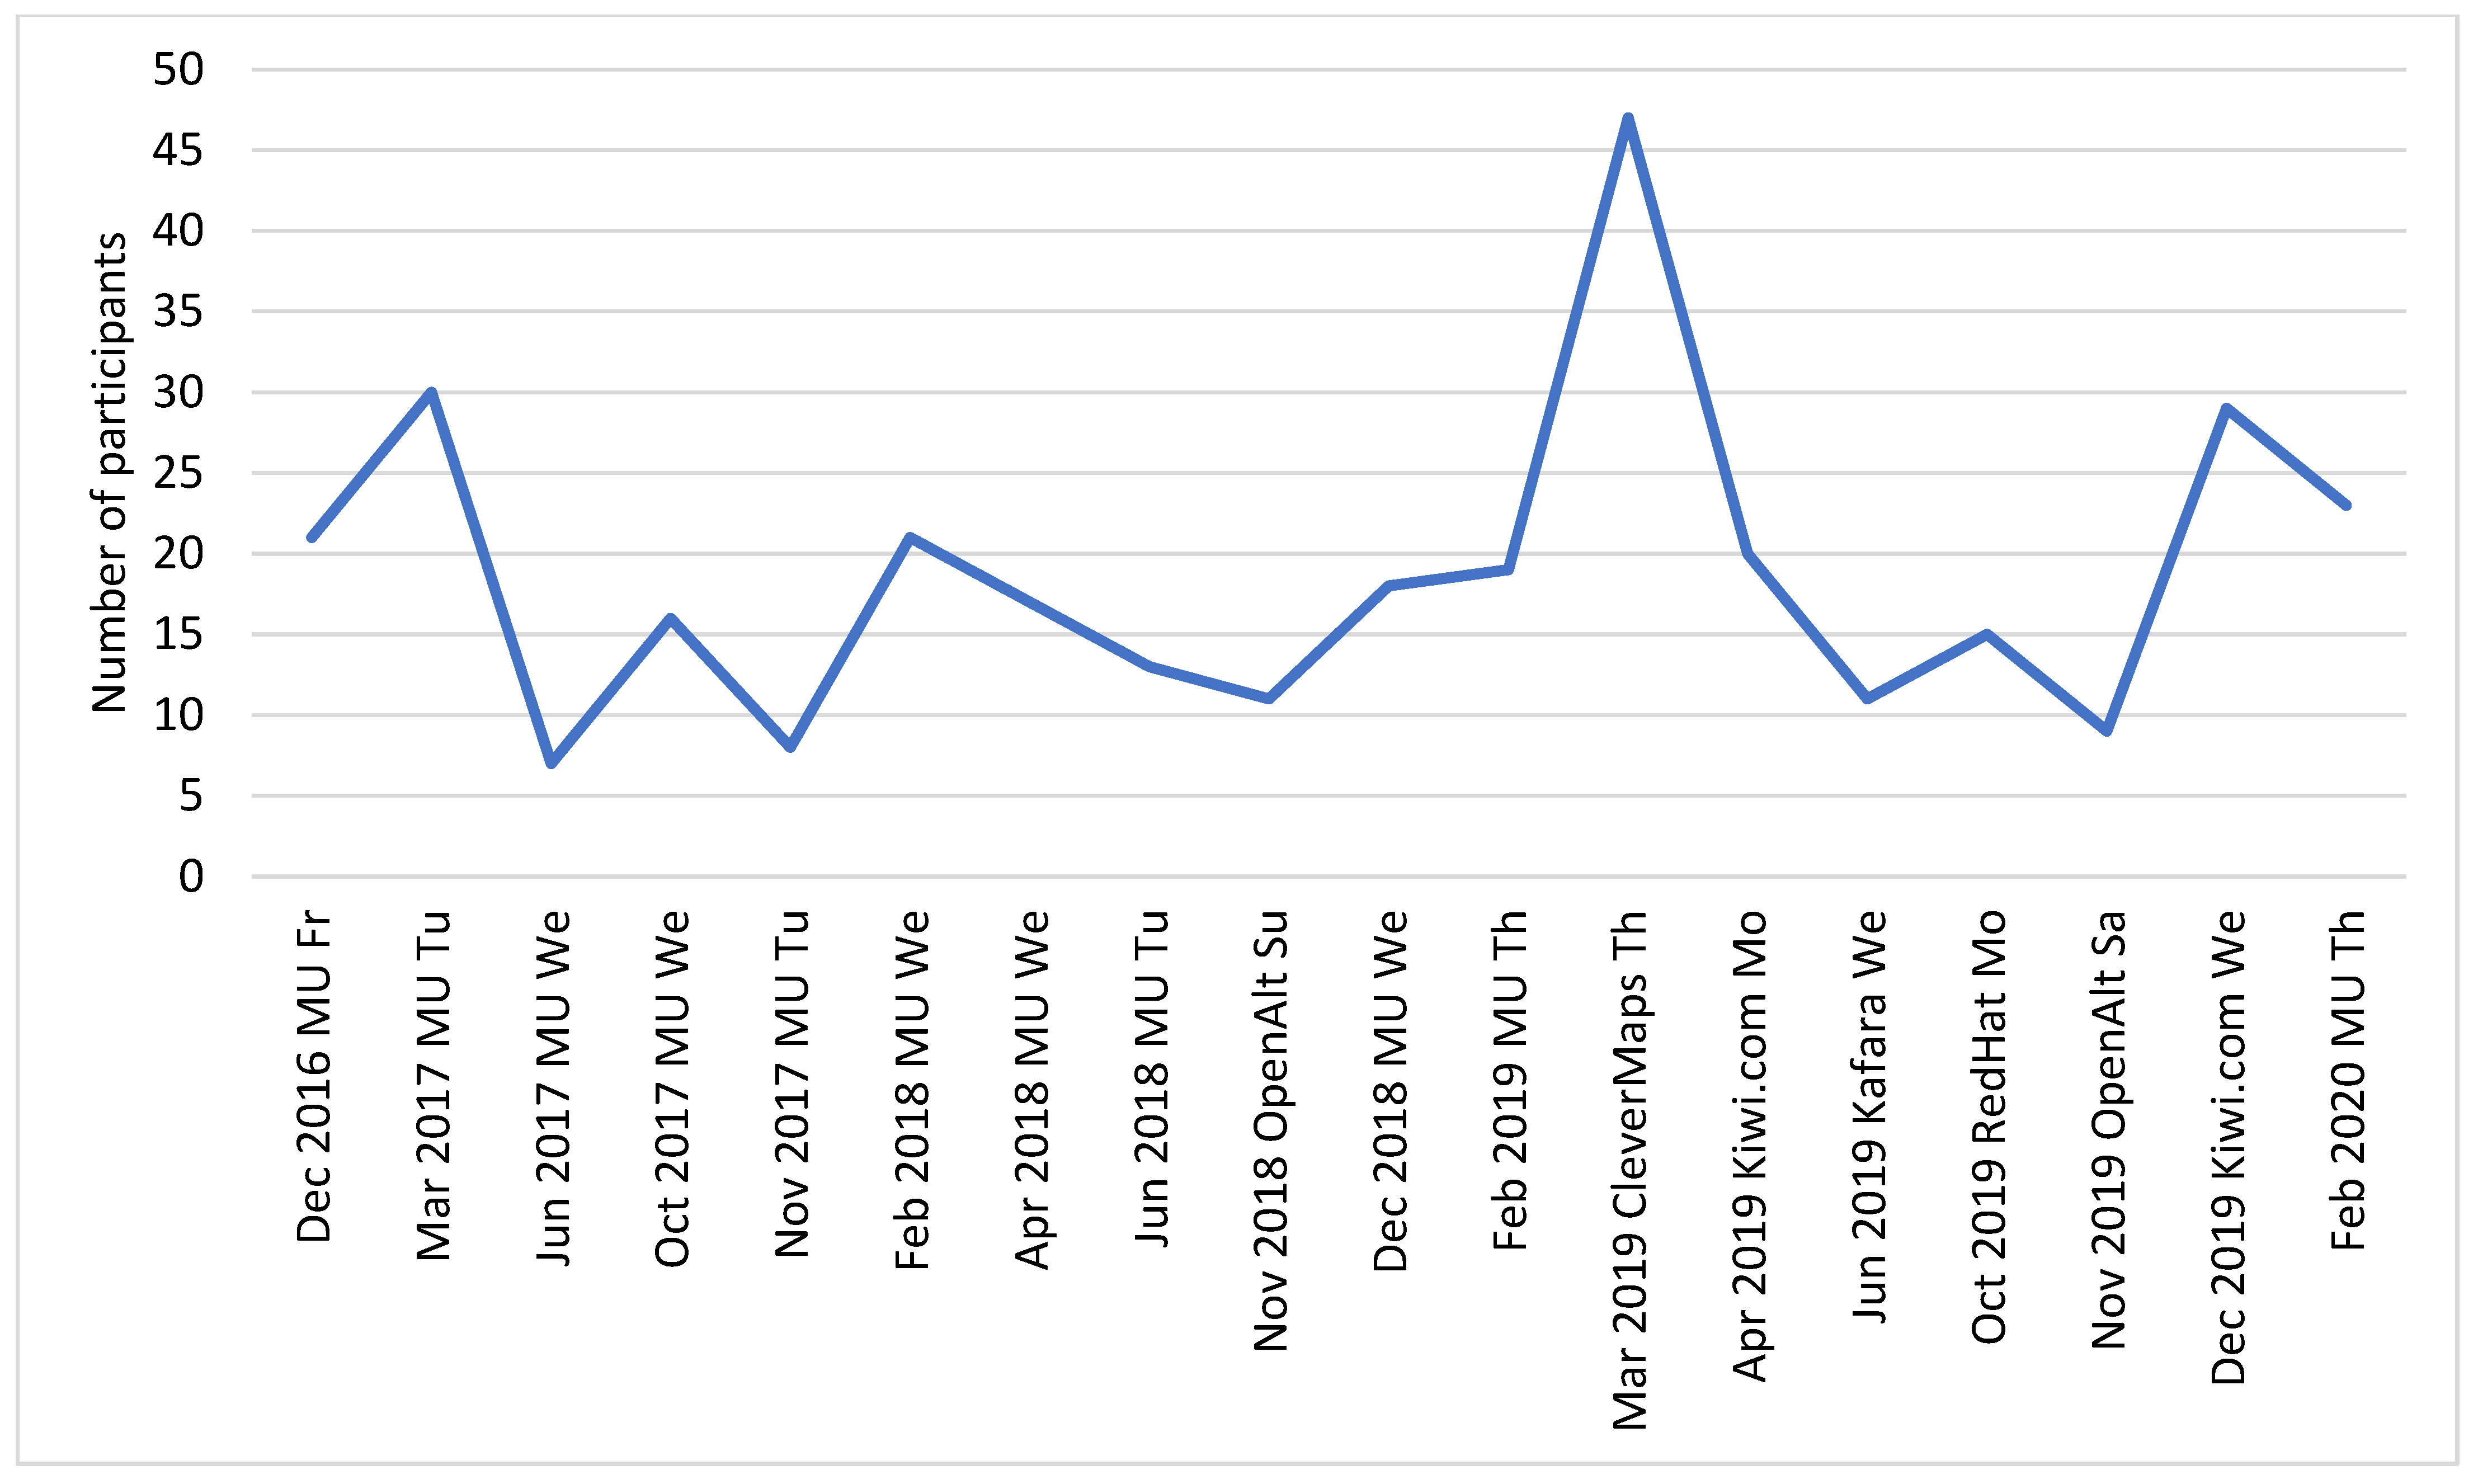
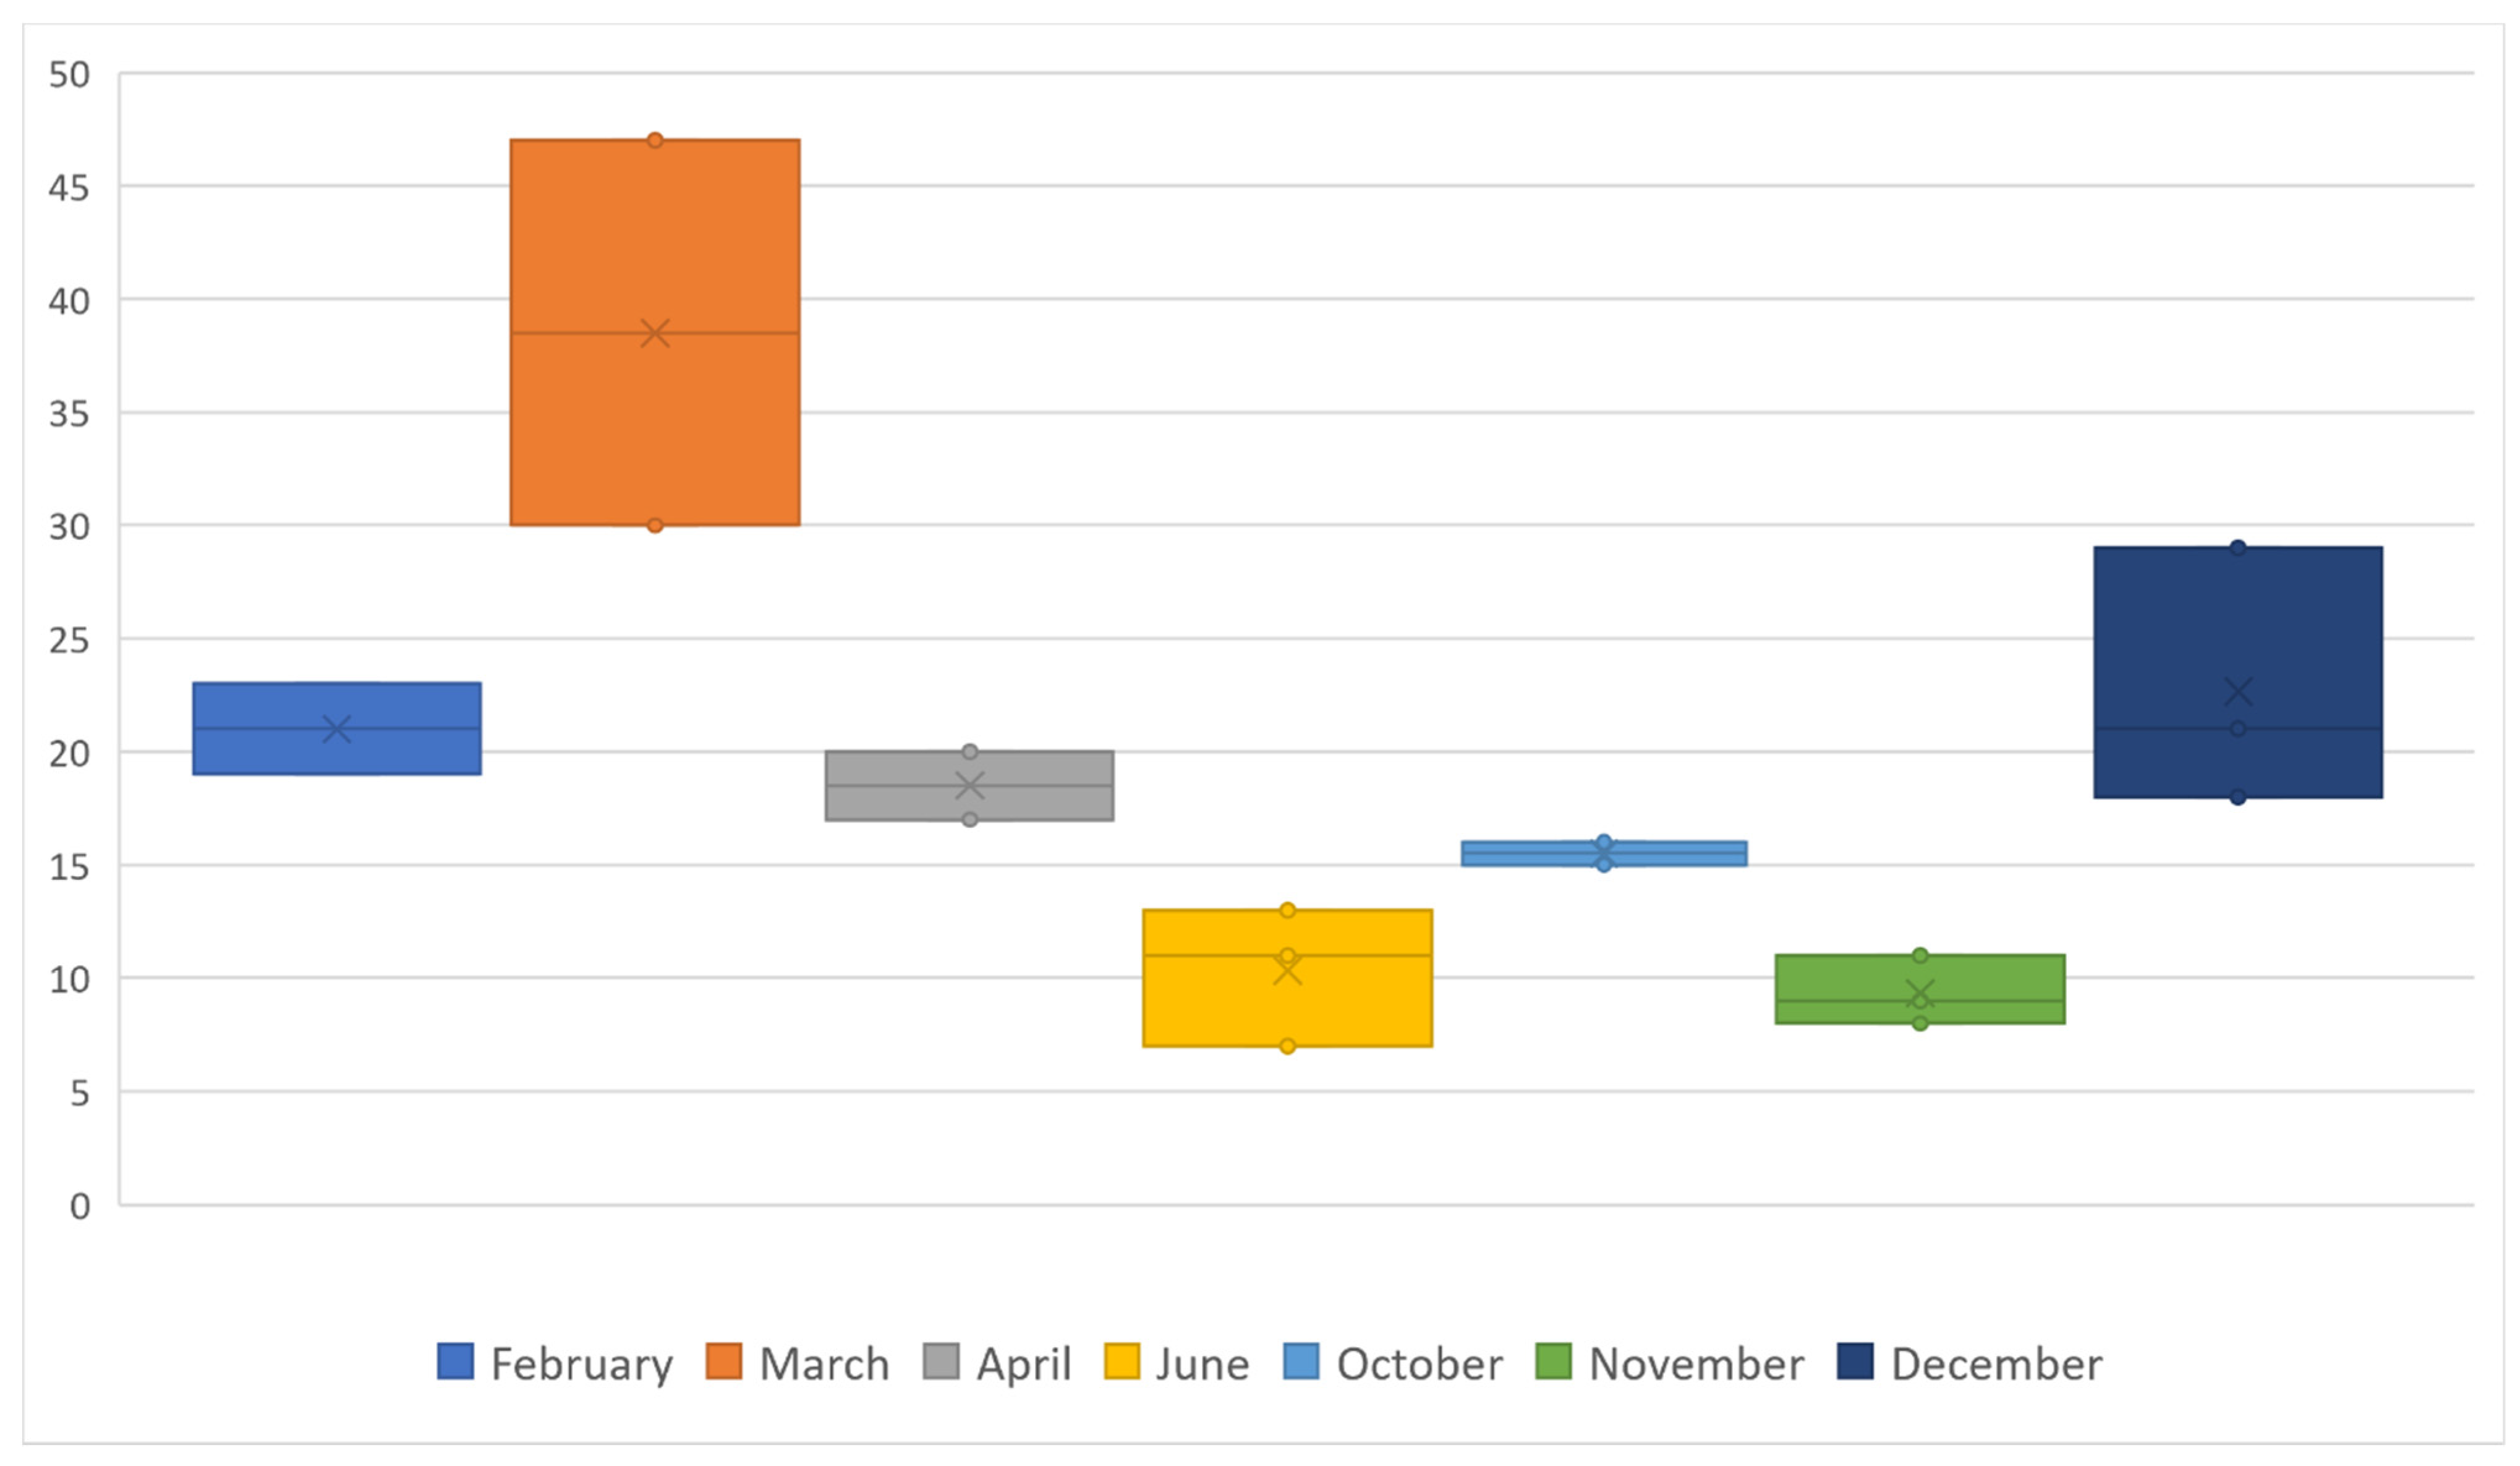
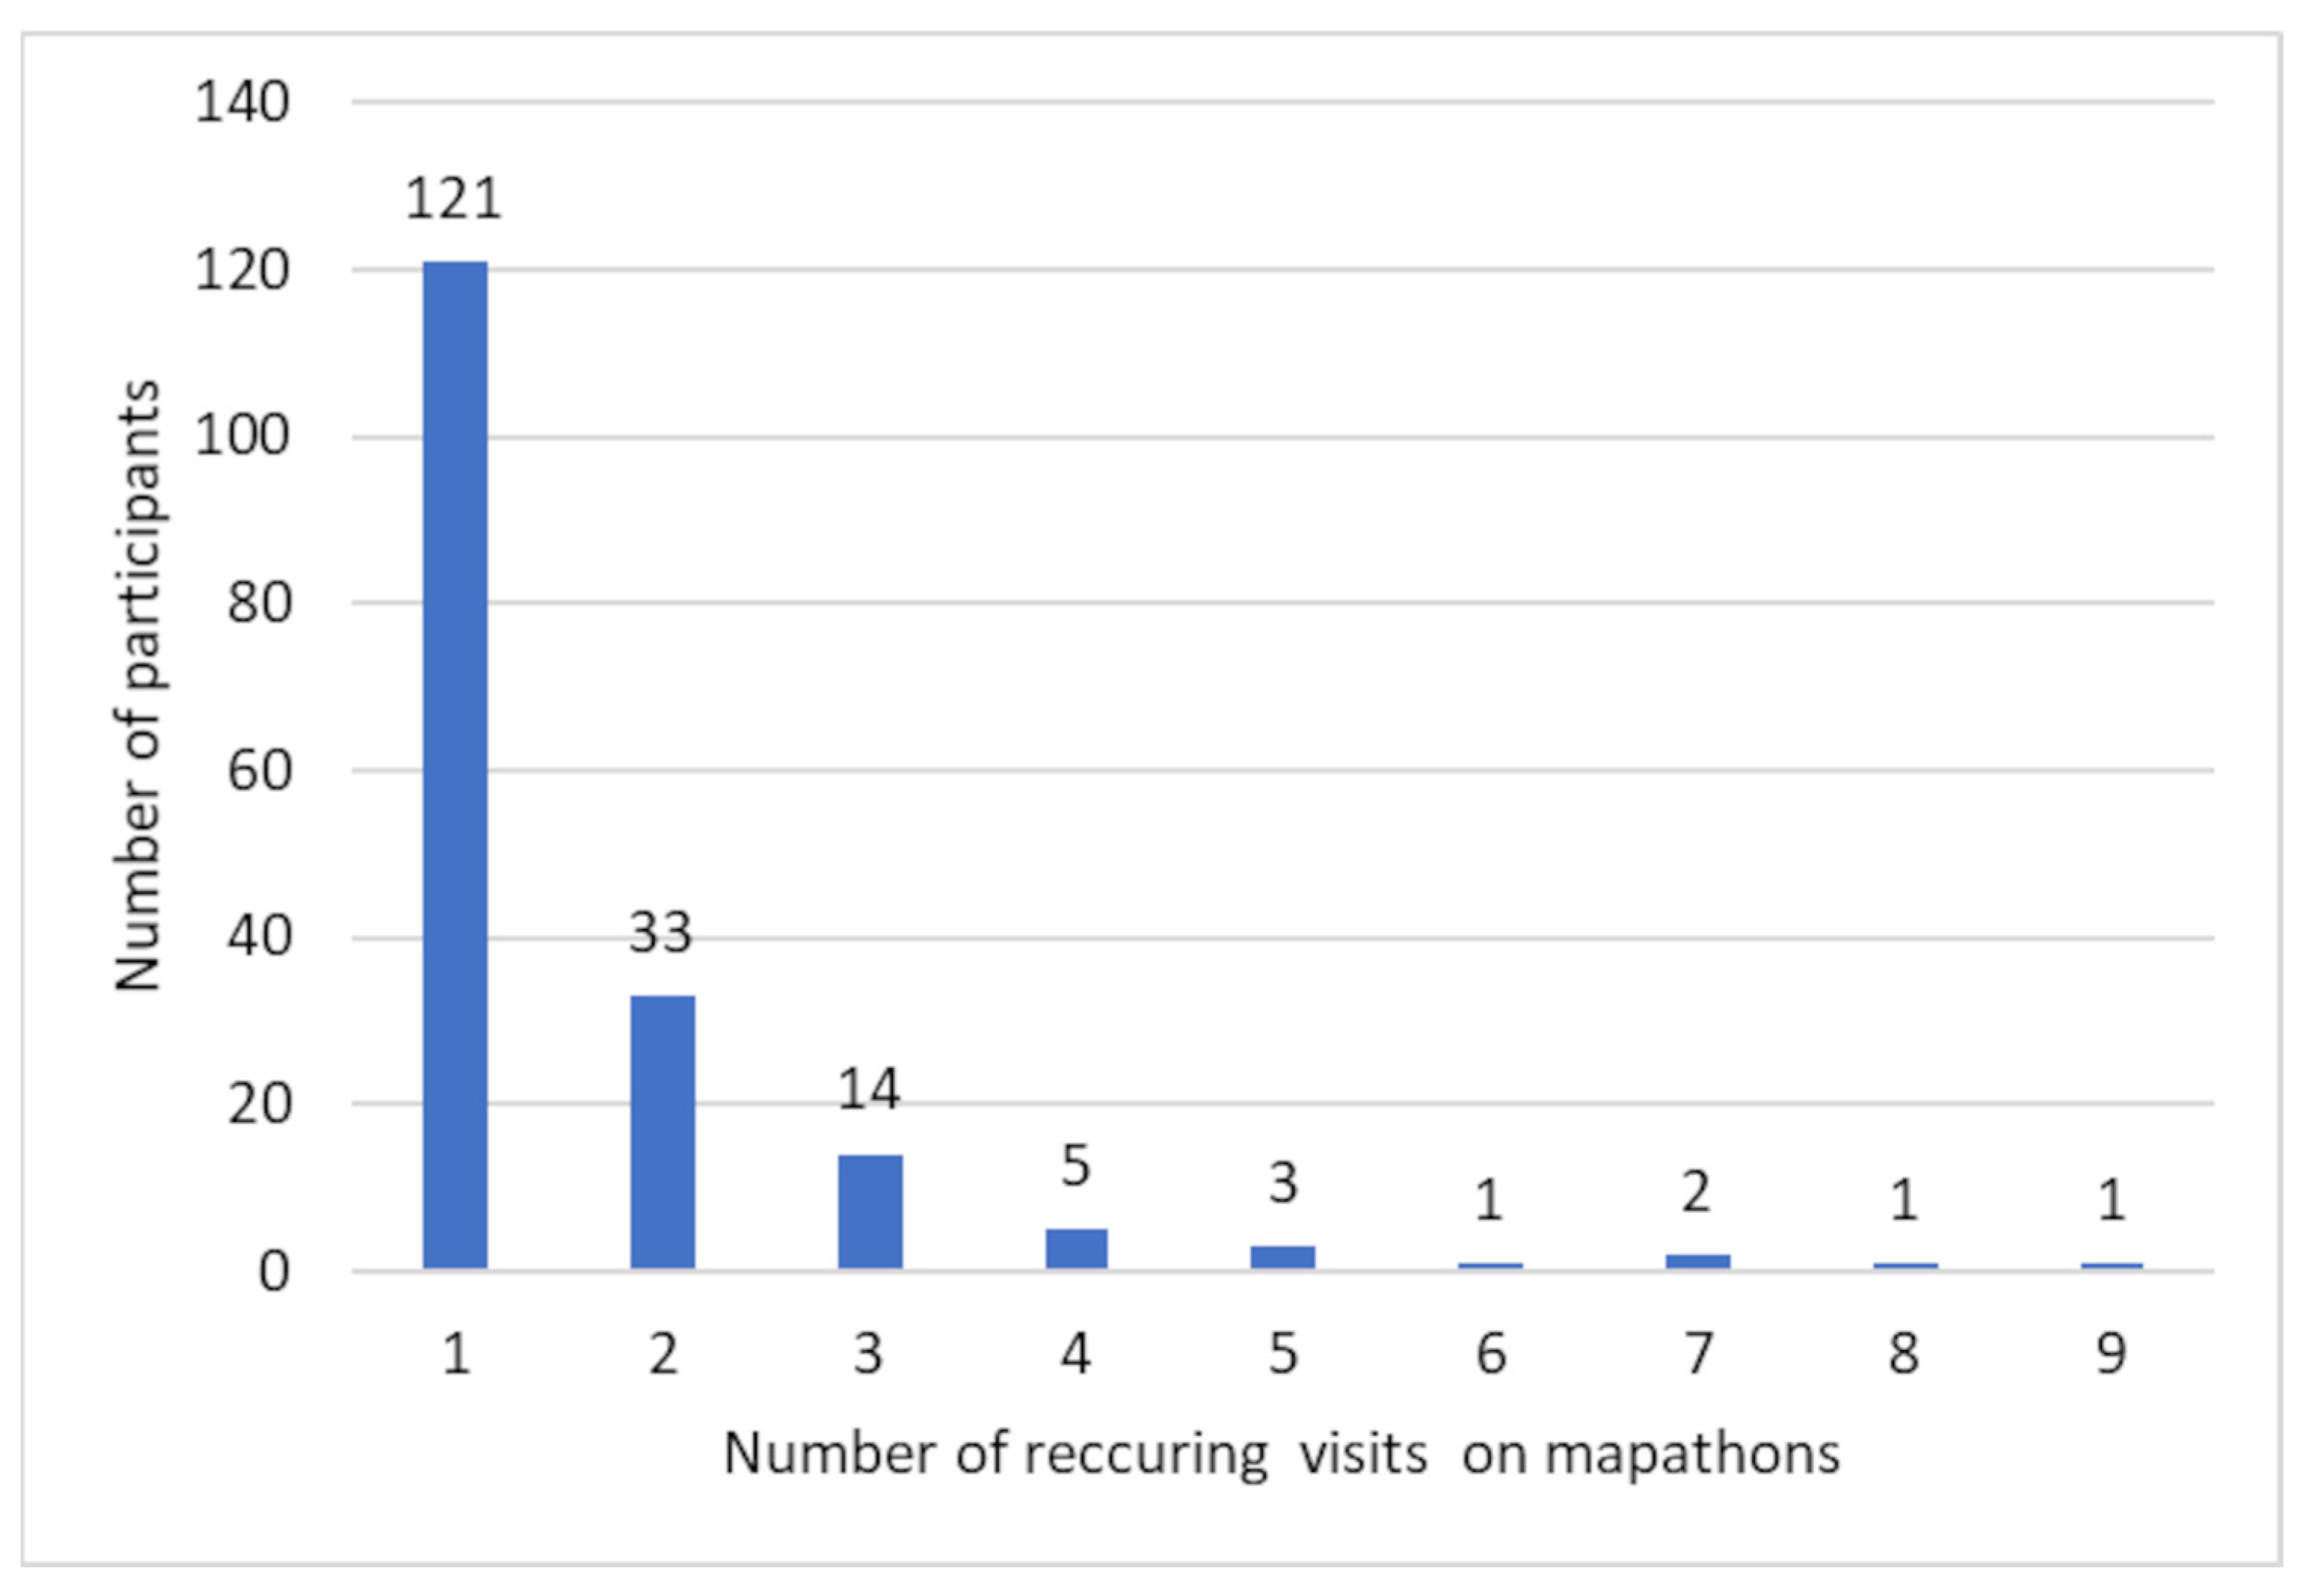
3.2. Characteristics of Mapathons and Recurring Participants

The second research question concerned the issue of how to attract as many participants as possible. The attendance statistics of contributors to 18 mapathons organized in Brno were used for this purpose.
The characteristics of the mapathons (month, day of the week, location, possibility to come without a laptop and use a borrowed computer) and their respective attendance statistics are presented in Table 5. Figure 4 shows changes in attendance as a line chart. The influence of the mentioned characteristics was tested statistically.
The numbers of participants were highest at two mapathons organized by private companies (e.g., Kiwi.com (Brno, Czech Republic), CleverMaps (Brno, Czech Republic)). The third-highest number was for participants who attended one of the mapathons held at the Masaryk University. However, it was only the second mapathon in Brno, so it was a new experience for most participants. Our hypothesis was that new or non-traditional locations of mapathons are the best attractors.
However, no significant statistical difference was found between individual types of locations according to the results of the Kruskal–Wallis H test (H(2)) = 5.176, p-value = 0.075). Similarly, the influence of day of the week was found to be non-significant (H(4) = 3.720, p-value = 0.445).
On the other hand, we found statistically significant differences between the months of the year (H(6) = 15.307; p-value = 0.018). A comparison of the average numbers of participants in mapathons in individual months is shown in Table 6 and Figure 5. The lowest numbers are clearly in June and November.
The effect of the possibility of participants to come without their own laptop was analyzed using the Mann–Whitney U test, but a statistically significant difference was not found (computer borrow: U = 37.0, p-value = 0.928).
The number of recurring participants was another focus of this particular research sub-question. The total number of registered participants that attended at least one mapathon in Brno was 181. Figure 6 shows the breakdown of how many mapathons the 181 registered participants visited in Brno. A total of 121 contributors came to only one mapathon, while 60 participants (32.8%) attended at least two. Only five mappers came to more than five mapathons.

3.3. Self-Assessment of Humanitarian Mappers

The last research question of the conducted study elicited the self-assessment of contributors to humanitarian mapping. A particular sub-question concerned the subjective evaluation of their contributions (underestimations or overestimations).
Data were obtained from the conducted questionnaire. The total number of each respondent’s edits from their profile on the Missing Maps page and their evaluation of their overall contribution to the OSM project were relativized on a scale from 1 (minimal contribution) to 10 (maximal contribution). Spearman’s coefficient was used to calculate the correlation between the number of a participant’s edits and the participant’s evaluation of his/her contribution to OSM. Statistical analysis showed a significant correlation (r = 0.754, p = 0.000) between the number of edits and self-assessment. That is, the self-assessment of participants was generally very accurate.

4. Discussion

Similarly to the Results section, this section is also structured in line with the three research questions identified at the beginning of this study.

4.1. The Motivation for Contributing to Humanitarian Mapping

The analysis of the overall motivation of contributors without division into groups showed six strong motivators with a mean value on the motivation scale higher than 4. Three of them—”I believe that my work yields significant results”, “helping other people is important to me”, and “I feel better and more satisfied with myself”—are connected with altruism. Two of the other strong motivators—”I like making maps” and “I believe that digital maps should be accessible to everyone for free”—are directly connected with the OSM project. The remaining strong motivator—”the community of volunteers around humanitarian mapping is important to me”—demonstrates the strength of networking within the OSM and humanitarian mapping communities.
Such a statement corresponds with the study by Budhathoki and Haythornthwaite [68], which found that the importance of community, the goals of the OSM project, and general altruism were the strongest motivators. Budhathoki and Haythornthwaite [68] also note that an important aspect of feedback highlighted in the OSM VGI case is the visual appeal of maps and visualizations. The analysis of questionnaire results indicated that the overall motivation is a mixture of various reasons. The same findings are also reported in [71].
The analysis of differences in motivation between various groups of participants found only a few statistically significant differences. Only employment status influenced one of the strong motivators mentioned above. Non-students assessed the motivator “I like making maps” as more important than students. We have no exact hypothesis about this result. Interest in maps is described as a communitywide motivator for various groups of mappers [68]. It is possible that students are also interested in maps, but they also prefer other motivators, so “I like making maps” is not so important for their group.
An interest in geography and a love of maps are, of course, communitywide motivators, and both casual and serious mappers are well motivated by an overall interest in mapping and geography and particularly by the possibility of contributing to local geography [68].
Differences in three motivators were found after dividing participants according to fields of study or employment. Participants connected to geosciences assessed the motivators “people in my surroundings also contribute”, “it helps my professional development”, and “I need OSM data for my work” as stronger than participants connected to other fields. However, none of these motivators was generally strong. This agrees with [68], where more differences were found for items on the lower end of the motivation scale.
No significant differences were found between groups based on gender, age, mapping experience, or level of education. Our results are in line with [34,67], which found that there was only a small difference in motivation between males and females. However, there are differences between our results and [68] when speaking about the motivation of more and less experienced contributors. Budhathoki and Haythornthwaite [68] noted that serious mappers are more oriented towards the community while casual mappers are more oriented towards the overall goals of open-source projects.
We asked former humanitarian mappers why they ended their participation. They mentioned two types of reasons—lack of time and long distances to the cities with mapathons. A proportion of them expressed the hope that their humanitarian mapping would begin again.
Lack of time was also the main reason for the ceasing of contributions in [67]. In contrast to our study, none of the related studies found that a large distance to the cities where mapathons are held was mentioned as a reason for the ending of contributions. Humanitarian mapping is not limited to mapathons. In fact, mappers are also encouraged to map alone, independently of other mappers—e.g., from home. This indicates that for many humanitarian mappers, the specific atmosphere of a mapathon is important, where a number of volunteers work together on the same task. This can be connected with the abovementioned strong position of the motivator “the community of volunteers around humanitarian mapping is important to me”. This indicates that expanding the group of cities where mapathons take place could help to retain experienced contributors and expand the community.

4.2. Characteristics of Mapathons and Recurring Participants

The analysis of attendance statistics from Brno mapathons found only one characteristic of a mapathon with a statistically significant influence on attendance—the month of the year. Mapathons in Brno are usually held from October to December and from February to June—during the months of teaching at the university. It is clear that mapathons organized in June (when semester exams and state exams are held) suffer from lower attendance because students either have a higher workload or have already left for the holidays. An anomaly is the weaker mapathon attendance in November. November mapathons are organized during the teaching season at the university; however, they are organized at the annual IT conference OpenAlt [75] attended by IT professionals, not by the general public or the usual participants of Brno mapathons.
No other characteristics of a mapathon—location, day of the week, or the possibility to come without a laptop—proved to be significant attractors. This could be due to the small number of data collected for analysis. It is also possible that in the case of some mapathons, different influences had opposite effects—e.g., an attractive location was negated by an unattractive day of the week. This analysis needs to be repeated when attendance statistics for more mapathons from Czechia and Slovakia are available.
Although it is recommended in the mapathon organization manual [23,27] to provide some extra laptops or computers for participants, most of the mapathons in Czechia and worldwide require participants to bring their own laptops. Mapathons held at the Department of Geography at Masaryk University offer computers to participants who do not have their own laptop (or whose laptop does not work properly). The effect of such an offer has not been analyzed before. Therefore, within this study, we tried to determine whether it had some positive effect on attendance. It was found, however, that there was no significant advantage to mapathons offering this possibility. Nevertheless, when this possibility existed, it was used by 1–3 participants. Therefore, though the offer to borrow computers did not influence the number of participants, it appeared to be a welcome service for some. We will therefore continue to offer this option at mapathons held at the Department of Geography.
All the organizers of mapathons try to attract recurring participants. One third of the mappers (60 out of 181) that attended at least one Brno mapathon also visited at least one other mapathon. This is in line with findings in [25], where 31% of participants were recurring. However, in [26], 50% of monthly mapathon attendees were recurrent visitors. In [28], it is even reported that 60% of attendees were reattending visitors, though this figure was probably influenced by the fact that participants were students credited for attendance.
The authors of this study are also the organizers of mapathons in Brno. Their long-term goal is to attract a proportion of repeat participants that is significantly greater than the current figure of around 30%. A possible partial explanation for this relatively low fraction is the location of some Brno mapathons in private companies. Dittus et al. [26] emphasized that “Corporate mapathons had the lowest newcomer retention, although their event format was comparable to other mapathons.” However, this problem must be examined in a broader context—e.g., using attendance statistics of mapathons in other cities in Czechia and Slovakia.

4.3. Self-Assessment of Humanitarian Mappers

One of the most common free-text comments received in questionnaires emphasized that self-assessment is difficult for participants. Such a statement contrasts with the statistical evaluation of participants’ self-assessment. According to the results of this study, statistical analysis confirmed a significant correlation between the number of edits and participants’ self-assessment. As far as the authors are aware, no similar study has so far been published about the overconfidence or underconfidence of mapathon participants.

5. Conclusions and Future Plans

Missing Maps is a humanitarian mapping project that aims to map the most vulnerable places in the developing world using OSM. Created data are used to better respond to crises, achieve SDGs, and monitor their progress.
The main motivation behind the presented research is to expand the active Czech and Slovak community of the humanitarian mapping Missing Map project, to attract new mappers, and to ensure greater attendance at mapathons. We want to discover what attracts contributors from Czechia and Slovakia to participate in humanitarian mapping and to attend mapathons and to discover the reasons why former contributors sometimes cease to contribute. Subsumed in this is the additional goal of reducing the departure of experienced mappers. Overall, these motivations and goals should increase the chances of creating more and better data. Data from a questionnaire and attendance statistics were analyzed to answer the three defined research questions. The following statements can be made:
(A) What are the motivations of different contributors in the Missing Maps community in Czechia and Slovakia?
The importance of community and general altruism are the strongest motivators for all mappers. They are the keys to the success of the (mapping) project, irrespective of differences in gender, age, level of education, or mapping experience. Students are the only exception in that they mention the strong motivator “I like making maps” less often in comparison to other groups. The only other significant differences in motivation were found for contributors connected to the geosciences, but they were related to less important motivators.
Lack of time and long distances to the cities with mapathons were two mentioned reasons why some contributors ended their participation. Expanding the group of cities where mapathons take place could significantly retain experienced contributors and expand the community.
(B) How can a mapathon be set up to attract as many participants as possible?
Statistical analysis found no significant influence of location, day of the week, or possibility to come without a laptop. Only the month of the mapathon had a significant influence, with the weakest attendance in June (due to the end of the university year) and November (due to the organization of a mapathon within the IT conference).
(C) How do contributors to humanitarian mapping subjectively evaluate their contributions? Do they underestimate or overestimate the importance of their results?
Humanitarian mappers evaluate their overall contribution to OSM very realistically. In general, self-assessments were neither over-optimistic nor over-pessimistic.
This paper communicates our preliminary results after the first attempt at data collection from a questionnaire. The number of collected questionnaires was too low for representative results; however, analyses with an identical scope are planned for the upcoming years. We would like to collect new data using the same questionnaire every year to observe changes over time. Searching for the characteristics of the “ideal” mapathon will be repeated after collecting data from a larger number of mapathons from Czechia and Slovakia.
Like most human activity, humanitarian mapping and the organization of mapathons were severely hit by the COVID-19 pandemic in 2020 and 2021. Most of the collective events, including mapathons, moved to online environments. Accordingly, the organization and specificities of online mapathons have become a new object of research in the humanitarian mapping community. We plan to follow this direction and compare the characteristics, attendance, and results of classic and online mapathons organized by Czech and Slovak humanitarian mapping communities in the future.

Author Contributions

Conceptualization, R.Š., J.T. and T.Ř.; methodology, R.Š. and L.H.; validation: R.Š.; formal analysis, R.Š., L.H. and J.T.; investigation, J.T. and K.T.; resources, K.T. and L.H.; data curation, L.H. and K.T.; writing—original draft, R.Š., J.T. and K.T.; writing—review and editing, L.H. and T.Ř.; supervision, T.Ř.; project administration, T.Ř.; funding acquisition, J.T., L.H. and T.Ř. All authors have read and agreed to the published version of the manuscript.

Funding

This paper is part of a project that has received funding from the European Union’s Horizon 2020 research and innovation programme under grant agreement No. 818346 titled “Sino–EU Soil Observatory for intelligent Land Use Management” (SIEUSOIL).

Institutional Review Board Statement

Not applicable.

Informed Consent Statement

Informed consent was obtained from all subjects involved in the study.

Data Availability Statement

Data are not publicly available, though the data may be made available on request from the corresponding author.

Acknowledgments

Our team thanks all participants and organizers of Brno mapathons, the Missing Maps project community in Czechia and Slovakia, and all contributors to humanitarian mapping worldwide.

Conflicts of Interest

The authors declare no conflict of interest.

References

  1. The 17 Goals. Available online: https://sdgs.un.org/goals (accessed on 2 August 2021).
  2. Transforming Our World: The 2030 Agenda for Sustainable Development. Available online: https://sdgs.un.org/2030agenda (accessed on 2 August 2021).
  3. OpenStreetMap. Available online: https://www.openstreetmap.org/ (accessed on 1 May 2021).
  4. Viana, C.M.; Encalada, L.; Rocha, J. The Value of OpenStreetMap Historical Contributions as a Source of Sampling Data for Multi-Temporal Land Use/Cover Maps. ISPRS Int. J. Geo-Inf. 2019, 8, 116. [Google Scholar] [CrossRef] [Green Version]
  5. Jonietz, D.; Zipf, A. Defining Fitness-for-Use for Crowdsourced Points of Interest (POI). ISPRS Int. J. Geo-Inf. 2016, 5, 149. [Google Scholar] [CrossRef] [Green Version]
  6. Muttaqien, B.I.; Ostermann, F.O.; Lemmens, R.L.G. Modeling aggregated expertise of user contributions to assess the credibility of OpenStreetMap features. Trans. GIS 2018, 22, 823–841. [Google Scholar] [CrossRef]
  7. Yang, S.; Shen, J.; Konečný, M.; Wang, Y.; Štampach, R. Study on the Spatial Heterogeneity of the POI Quality in OpenStreetMap. In Proceedings of the 7th International Conference on Cartography and GIS, Sozopol, Bulgaria, 18–23 June 2018; Bandrova, T., Konečný, M., Eds.; Bulgarian Cartographic Association: Sofia, Bulgaria, 2018. [Google Scholar]
  8. Touya, G.; Antoniou, V.; Olteanu-Raimond, A.-M.; Van Damme, M.-D. Assessing Crowdsourced POI Quality: Combining Methods Based on Reference Data, History, and Spatial Relations. ISPRS Int. J. Geo-Inf. 2017, 6, 80. [Google Scholar] [CrossRef]
  9. Kankanamge, N.; Yigitcanlar, R.; Goonetilleke, A.; Kamruzzaman, M. Can volunteer crowdsourcing reduce disaster risk? A systematic review of the literature. Int. J. Disaster Risk Reduct. 2019, 35, 101097. [Google Scholar] [CrossRef]
  10. Konečný, M.; Reinhardt, W. Early warning and disaster management: The importance of geographic information (Part B). Int. J. Digit. Earth 2010, 3, 313–315. [Google Scholar] [CrossRef]
  11. Goodchild, M. Citizens as sensors: The world of volunteered geography. GeoJournal 2007, 69, 211–221. [Google Scholar] [CrossRef] [Green Version]
  12. Humanitarian OpenStreetMap Team. Available online: https://www.hotosm.org/ (accessed on 10 January 2021).
  13. What We Do. Available online: https://www.hotosm.org/what-we-do (accessed on 2 August 2021).
  14. A Practical Guide to Launching and Growing Open Mapping Initiatives at the National and Local Levels. Available online: https://documents1.worldbank.org/curated/en/967511563521548873/pdf/Open-Mapping-for-the-SDGs-A-Practical-Guide-to-Launching-and-Growing-Open-Mapping-Initiatives-at-the-National-and-Local-Levels.pdf (accessed on 2 August 2021).
  15. Open Mapping for the SDGs. Available online: https://sdgs.hotosm.org/ (accessed on 30 October 2021).
  16. Solís, P.; McCusker, B.; Menkiti, N.; Cowan, N.; Blevins, C. Engaging global youth in participatory spatial data creation for the UN sustainable development goals: The case of open mapping for malaria prevention. Appl. Geogr. 2018, 98, 143–155. [Google Scholar] [CrossRef]
  17. YouthMappers. Available online: https://www.youthmappers.org/ (accessed on 10 January 2021).
  18. Solís, P.; Rajagopalan, S.; Villa, L.; Mohiuddin, M.B.; Boateng, E.; Wavamunno, N.S.; Valencia, M.F.P. Digital humanitarians for the Sustainable Development Goals: YouthMappers as a hybrid movement. J. Geogr. High. Educ. 2020. [Google Scholar] [CrossRef]
  19. Forni, M.; Haack, J.; Soden, R.; York, D.; Sommerville, R.; Deparday, V. Open Data for Resilience Initiative: Planning and Open Cities Mapping Project, World Bank, Global Facility for Disaster Reduction and Recovery; World Bank: Washington, DC, USA, 2014; 96p. [Google Scholar]
  20. One Map Myanmar and Phandeeyar. Available online: https://www.missingmaps.org/blog/2018/09/24/mapping-in-myanmar/ (accessed on 15 November 2021).
  21. Burundi Anti-Malaria Campaign: Covering the Gap—A Year of Blogs—January 2020. Available online: https://www.missingmaps.org/blog/2020/01/29/a-year-of-blogs/ (accessed on 15 November 2021).
  22. Missing Maps—Putting the World’s Vulnerable People on the Map. Available online: https://www.missingmaps.org/ (accessed on 10 January 2021).
  23. Hosting a Mapathon. Available online: https://www.missingmaps.org/host/#Materials (accessed on 5 April 2021).
  24. Coetzee, S.; Minghini, M.; Solis, P.; Rautenbach, V.; Green, C. Towards understanding the impact of mapathons—Reflecting on YouthMappers experiences. Int. Arch. Photogramm. Remote Sens. Spatial Inf. Sci. 2018, XLII-4/W8, 35–42. [Google Scholar] [CrossRef] [Green Version]
  25. Hristova, D.; Quattrone, G.; Mashhadi, A.; Capra, L. The Life of the Party: Impact of Social Mapping in OpenStreetMap; ICWSM: Atlanta, GA, USA, 2013; pp. 234–243. [Google Scholar]
  26. Dittus, M.; Quattrone, G.; Capra, L. Social Contribution Settings and Newcomer Retention in Humanitarian Crowd Mapping. In Proceedings of the 8th International Conference, SocInfo 2016, Bellevue, WA, USA, 11–14 November 2016; Spiro, E., Ahn, Y.-Y., Eds.; Springer: Cham, Switzerland, 2016; Part II; pp. 179–193. [Google Scholar] [CrossRef] [Green Version]
  27. How to Host a Mapathon. Available online: https://www.missingmaps.org/assets/downloads/mapathon-materials/english/How_to_Host_a_Mapathon_EN.pdf (accessed on 6 April 2021).
  28. Green, C.; Rautenbach, V.; Coetzee, S. Evaluating student motivation and productivity during mapathons. Int. Arch. Photogramm. Remote. Sens. Spat. Inf. Sci. 2019, XLII-4/W14, 85–91. [Google Scholar] [CrossRef] [Green Version]
  29. Trojan, J.; Schade, S.; Lemmens, R.; Frantál, B. Citizen science as a new approach in Geography and beyond: Review and reflections. Morav. Geogr. Rep. 2019, 27, 254–264. [Google Scholar] [CrossRef] [Green Version]
  30. Kerski, J.J. Geo-awareness, geo-enablement, geotechnologies, citizen science, and storytelling: Geography on the world stage. Geogr. Compass 2015, 9, 14–26. [Google Scholar] [CrossRef]
  31. Turner, A. Introduction to Neo-Geography; O’Reilly Media, Inc.: Sebastopol, CA, USA, 2006. [Google Scholar]
  32. Wilson, M.W.; Graham, M. Situating Neogeography. Environ. Plan. A Econ. Space 2013, 45, 3–9. [Google Scholar] [CrossRef]
  33. West, S.E.; Büker, P.; Ashmore, M.; Njoroge, G.; Welden, N.; Muhoza, C.; Osano, P.; Makau, J.; Njoroge, P.; Apondo, W. Particulate matter pollution in an informal settlement in Nairobi: Using citizen science to make the invisible visible. Appl. Geogr. 2020, 114, 102133. [Google Scholar] [CrossRef]
  34. Alender, B. Understanding volunteer motivations to participate in citizen science projects: A deeper look at water quality monitoring. J. Sci. Commun. 2016, 15, A04. [Google Scholar] [CrossRef] [Green Version]
  35. Bonney, R.; Cooper, C.B.; Dickinson, J.; Kelling, S.; Phillips, T.; Rosenberg, K.V.; Shirk, J. Citizen science: A developing tool for expanding science knowledge and scientific literacy. BioScience 2009, 59, 977–984. [Google Scholar] [CrossRef]
  36. Dickinson, J.L.; Shirk, J.; Bonter, D.; Bonney, R.; Crain, R.L.; Martin, J.; Phillips, T.; Purcell, K. The current state of citizen science as a tool for ecological research and public engagement. Front. Ecol. Environ. 2012, 10, 291–297. [Google Scholar] [CrossRef] [Green Version]
  37. Zhang, G. Spatial and Temporal Patterns in Volunteer Data Contribution Activities: A Case Study of eBird. ISPRS Int. J. Geo-Inf. 2020, 9, 597. [Google Scholar] [CrossRef]
  38. Franzen, M.; Kloetzer, L.; Ponti, M.; Trojan, J.; Vicens, J. Machine Learning in Citizen Science: Promises and Implications. In The Science of Citizen Science, 1st ed.; Vohland, K., Land-Zandstra, A., Ceccaroni, L., Lemmens, R., Perelló, J., Ponti, M., Samson, R., Wagenknecht, K., Eds.; Springer: Cham, Switzerland, 2021. [Google Scholar] [CrossRef]
  39. Battisti, C.; Cerfolli, F. From Citizen Science to Citizen Management: Suggestions for a pervasive fine-grained and operational approach to biodiversity conservation. Isr. J. Ecol. Evol. 2021; in press. [Google Scholar] [CrossRef]
  40. Battisti, C.; Poeta, G.; Romiti, F.; Picciolo, L. Small Environmental Actions Need of Problem-Solving Approach: Applying Project Management Tools to Beach Litter Clean-Ups. Environments 2020, 7, 87. [Google Scholar] [CrossRef]
  41. Taft-Morales, M.; Margesson, R. Haiti earthquake: Crisis and response. Curr. Politics Econ. South Cent. Am. 2011, 4, 1–67. [Google Scholar]
  42. Reznik, T.; Horakova, B.; Szturc, R. Geographic Information for Command and Control Systems Demonstration of Emergency Support System. In Intelligent Systems for Crisis Management: Geo-Information for Disaster Management (GI4DM) 2012, 1st ed.; Zlatanova, S., Peters, R., Dilo, A., Scholten, H., Eds.; Springer: Berlin, Germany, 2013; pp. 263–275. [Google Scholar]
  43. Reznik, T.; Horakova, B.; Szturc, R. Advanced methods of cell phone localization for crisis and emergency management applications. Int. J. Digit. Earth 2015, 8, 259–272. [Google Scholar] [CrossRef]
  44. Arsanjani, J.; Bakillah, M. Understanding the potential relationship between the socio-economic variables and contributions to OpenStreetMap. Int. J. Digit. Earth 2015, 8, 861–876. [Google Scholar] [CrossRef]
  45. Sui, D.Z.; Goodchild, M.F.; Elwood, S. Volunteered Geographic Information, the Exaflood, and the Growing Digital Divide. In Crowdsourcing Geographic Knowledge: Volunteered Geographic Information (VGI) in Theory and Practice; Sui, D.Z., Elwood, S., Goodchild, M.F., Eds.; Springer: Dordrecht, The Netherlands, 2013; pp. 1–12. [Google Scholar] [CrossRef]
  46. Bandrova, T.L.; Konečný, M.; Yotova, A. Cartography development and challenges on the basis of Big Data. In Proceedings of the 5th International Conference on Cartography and GIS, Riviera, Bulgaria, 15–20 June 2014; Bandrova, T., Konečný, M., Eds.; Bulgarian Cartographic Association: Sofia, Bulgaria, 2014; pp. 164–173. [Google Scholar]
  47. Haklay, M. Citizen Science and Volunteered Geographic Information: Overview and Typology of Participation. In Crowdsourcing Geographic Knowledge: Volunteered Geographic Information (VGI) in Theory and Practice; Sui, D.Z., Elwood, S., Goodchild, M.F., Eds.; Springer: Dordrecht, The Netherlands, 2013; pp. 105–122. [Google Scholar] [CrossRef]
  48. Duží, B.; Osman, R.; Lehejček, J.; Nováková, E.; Taraba, P.; Trojan, J. Exploring citizen science in post-socialist space: Uncovering its hidden character in the Czech Republic. Morav. Geogr. Rep. 2019, 27, 241–253. [Google Scholar] [CrossRef] [Green Version]
  49. Herfort, B.; Li, H.; Fendrich, S.; Lautenbach, S.; Zipf, A. Mapping human settlements with higher accuracy and less volunteer efforts by combining crowdsourcing and deep learning. Remote Sens. 2019, 11, 1799. [Google Scholar] [CrossRef] [Green Version]
  50. Costa Fonte, C.; Fritz, S.; Olteanu-Raimond, A.M.; Antoniou, V.; Foody, G.; Mooney, P.; See, L. Mapping and the Citizen Sensor; Ubiquity Press: London, UK, 2017; 398p. [Google Scholar]
  51. Vohland, K.; Land-Zandstra, A.; Ceccaroni, L.; Lemmens, R.; Perelló, J.; Ponti, M.; Wagenknecht, K. The Science of Citizen Science; Springer: Cham, Switzerland, 2021; 529p. [Google Scholar]
  52. Fritz, S.; See, L.; Carlson, T.; Haklay, M.; Oliver, J.L.; Fraisl, D.; Mondardini, R.; Brocklehurst, M.; Shanley, L.A.; Schade, S.; et al. Citizen science and the United Nations Sustainable Development Goals. Nat. Sustain. 2019, 2, 922–930. [Google Scholar] [CrossRef]
  53. Knowledge for Change: A Decade of Citizen Science (2020–2030) in Support of the SDGs. Available online: https://www.cs-sdg-conference.berlin/en/ (accessed on 16 November 2021).
  54. Fraisl, D.; Campbell, J.; See, L.; Wehn, U.; Wardlaw, J.; Gold, M.; Moorthy, I.; Arias, R.; Piera, J.; Oliver, J.L.; et al. Mapping citizen science contributions to the UN Sustainable Development Goals. Sustain. Sci. 2020, 15, 1735–1751. [Google Scholar] [CrossRef]
  55. Meier, P. Digital Humanitarians: How Big Data Is Changing the Face of Humanitarian Response, 1st ed.; CRC Press: Boca Raton, FL, USA, 2015; 259p. [Google Scholar]
  56. Clark, N.; Guiffault, F. Seeing through the clouds: Processes and challenges for sharing geospatial data for disaster management in Haiti. Int. J. Disaster Risk Reduct. 2018, 28, 258–270. [Google Scholar] [CrossRef]
  57. Konečný, M.; Bandrova, T.; Kubíček, P.; Stachoň, Z.; Štampach, R.; Shen, J.; Rotanova, I.; Brodský, J.; Špulák, P. Strategies of Disaster Risk Reduction on the Background on U.N. GGIM and Digital Belt and Road Efforts. In Proceedings of the 8th International Conference on Cartography and GIS, Nessebar, Bulgaria, 15–20 June 2020; Bandrova, T., Konečný, M., Marinova, S., Eds.; Bulgarian Cartographic Association: Sofia, Bulgaria, 2020; Volume 1, 17p, Available online: https://iccgis2020.cartography-gis.com/ (accessed on 16 November 2021).
  58. Ebrahim, M.; Minghini, M.; Molinari, M.E.; Torrebruno, A. MiniMapathon—Mapping the world at 10 years old. In Proceedings of the EDULEARN16 Conference, Barcelona, Spain, 4–6 July 2016; pp. 4200–4208. [Google Scholar]
  59. Wirnitzer, J. Czech Volunteers Map Slums around the World (Čeští Dobrovolníci Mapují Chudinské Čtvrti ve Světě). Hospodářské Noviny, 2 July 2018. (In Czech) [Google Scholar]
  60. Béland, P. OSM Quality Mapping: Metrics to Monitor Buildings Outbounds. In State of the Map 2019. Available online: https://2019.stateofthemap.org/sessions/3BZCXA/ (accessed on 23 November 2021).
  61. Reinmuth, M.; Herfort, B.; Stier, J.; Klerings, A. Evolution of Humanitarian Mapping within the OpenStreetMap Community. In State of the Map 2020. Available online: https://2020.stateofthemap.org/sessions/SNEDXL/ (accessed on 23 November 2021).
  62. Nile, E.; Maron, M.; Vyncke, J.; Firth, R.; Nassozi, S.; Gibb, M. Mapathons, Validation & Mapping Quality—A Debate. In HOT Summit 2019. Available online: https://www.youtube.com/watch?v=zWW0i-V4lgw&list=PLb9506_-6FMFeUJr8cbOZ3aE7Npw3-Ifu&index=15&t=0s (accessed on 23 November 2021).
  63. Ramm, F. There Might Have been a Misunderstanding… In State of the Map 2020. Available online: https://2020.stateofthemap.org/sessions/DYXWDC/ (accessed on 23 November 2021).
  64. Menard, S.; Chavent, N. Mapathon, Mapathon, Mapathon! In State of the Map 2019. Available online: https://2019.stateofthemap.org/sessions/GQ3AAF/ (accessed on 23 November 2021).
  65. Schott, M.; Grinberger, A.Y.; Lautenbach, S.; Zipf, A. The Impact of Community Happenings in OpenStreetMap—Establishing a Framework for Online Community Member Activity Analyses. ISPRS Int. J. Geo-Inf. 2021, 10, 164. [Google Scholar] [CrossRef]
  66. Loftian, M.; Ingensand, J.; Brovelli, M.A. A Framework for Classifying Participant Motivation that Considers the Typology of Citizen Science Projects. ISPRS Int. J. Geo-Inf. 2020, 9, 704. [Google Scholar] [CrossRef]
  67. Schmidt, M.; Klettner, S. Gender and Experience-Related Motivators for Contributing to OpenStreetMap. In Proceedings of the 16th AGILE International Conference on GIS, Leuven, Belgium, 14–17 May 2013. [Google Scholar]
  68. Budhathoki, N.M.; Haythornthwaite, C. Motivation for Open Collaboration: Crowd and Community Models and the Case of OpenStreetMap. Am. Behav. Sci. 2012, 57, 548–575. [Google Scholar] [CrossRef]
  69. Gómez-Barrón, J.-P.; Manso-Callejo, M.-A.; Alcarria, R. Needs, drivers, participants, and engagement actions: A framework for motivating contributions to volunteered geographic information systems. J. Geogr. Syst. 2019, 21, 5–41. [Google Scholar] [CrossRef]
  70. Stachoň, Z.; Šašinka, Č.; Čeněk, J.; Štěrba, Z.; Angsuesser, S.; Fabrikant, S.I.; Štampach, R.; Morong, K. Cross-cultural differences in figure-ground perception of cartographic stimuli. Cartogr. Geogr. Inf. Sci. 2018, 46, 82–94. [Google Scholar] [CrossRef]
  71. Clary, E.G.; Snyder, M. The Motivations to Volunteer: Theoretical and Practical Considerations. Curr. Dir. Psychol. Sci. 1999, 8, 156–159. [Google Scholar] [CrossRef]
  72. Show Me the Way. Available online: http://osmlab.github.io/show-me-the-way/ (accessed on 11 January 2021).
  73. Trello—Missing Maps CZ & SK. Available online: https://trello.com/b/8Vo5QWU6/missing-maps-cz-sk (accessed on 3 May 2021). (In Czech).
  74. User Profile on the Missing Maps. Available online: https://www.missingmaps.org/users/#/ (accessed on 2 August 2021).
  75. OpenAlt Conference. Available online: https://www.openalt.cz/ (accessed on 11 January 2021). (In Czech).
Figure 2. Differences for the motivator “I like making maps” for groups of students and non-students.
Sustainability 13 13991 g002
Figure 3. Differences between groups of geosciences and other fields.
Sustainability 13 13991 g003
Figure 4. The number of attendees at mapathons organized in Brno according to month, year, location, and day of the week.
Sustainability 13 13991 g004
Figure 5. Differences in numbers of attendees at mapathons held in particular months.
Sustainability 13 13991 g005
Figure 6. Participants of mapathons in Brno by the number of mapathons they attended.
Sustainability 13 13991 g006
Table 1. Characteristics of respondents.
Number of Participants44
Experience (more experienced = more than 1000 edits) (%)
less experienced38.6
more experienced61.4
Gender (%)
Male68.2
Female31.8
Education (%)
elementary school2.3
high school25.0
university—BSc.18.2
university—MSc. and higher54.5
Age (%)
25 and under29.6
26–3550.0
36–4513.6
46 and over6.8
Table 2. Motivation from the questionnaire. Values are from a Likert-type scale: 1—strongly disagree, 2—disagree, 3—neutral, 4—agree, 5—strongly agree.
I Contribute Because…MeanMedian
…I believe that my work yields significant results.4.55.0
…helping other people is important to me.4.45.0
…I like making maps.4.35.0
…the community of volunteers around humanitarian mapping is important to me.4.24.0
…I believe that digital maps should be accessible to everyone for free.4.14.0
…I feel better and more satisfied with myself.4.14.0
…it is a good means of self-realization.3.84.0
…I like seeing immediate results.3.84.0
…I want maps not to be created only for commercial purposes.3.64.0
…I am a better human because of it.3.44.0
…I feel that I am part of a bigger group because of it.3.23.0
…it helps me to better understand geographical relationships.3.13.0
…it helps me to better understand how the world works.3.13.0
…it is a fine method of procrastination.3.03.0
…it helps my professional development.2.83.0
…it helps me to forget about personal problems.2.62.5
…it is a good activity to include in my CV.2.32.0
…people in my surroundings also contribute.2.12.0
…I need OSM data for my work.2.12.0
…it helps me to get the job I want.1.81.0
…I get money for it.1.21.0
Table 3. Results of statistical analysis for groups based on the status of employment.
MotivatorStatus of EmploymentNumber of ParticipantsMedianMeanStd DevShapiro–Wilk TestMann–Whitney U Test
p-ValueUp-Value
I like making mapsstudent194.03.91.20.00068.00.016
non-student255.04.60.70.000
Table 4. Result of statistical analysis for groups based on field of employment or study.
MotivatorStatus of EmploymentNumber of ParticipantsMedianMeanStd DevShapiro–Wilk TestMann–Whitney U Test
p-ValueUp-Value
people in my surroundings also contributegeosciences192.02.51.10.022144.50.028
other251.01.81.20.000
it helps my professional developmentgeosciences193.03.30.90.018145.00.029
other252.02.41.30.000
I need OSM data for my workgeosciences193.02.81.50.031113.00.003
other251.01.50.80.000
Table 5. Attendance statistics of mapathons organized in Brno. The possibility to use a borrowed computer (i.e., to come without a laptop) was only at mapathons held at Masaryk University.
Month and YearWeekdayLocationAttendeesAttendees that Used Borrowed Computer
December 2016 FridayMasaryk University213
March 2017TuesdayMasaryk University303
June 2017WednesdayMasaryk University71
October 2017WednesdayMasaryk University162
November 2017TuesdayMasaryk University81
February 2018WednesdayMasaryk University211
April 2018 WednesdayMasaryk University170
June 2018 TuesdayMasaryk University131
November 2018SundayOpenAlt conference11not available
December 2018WednesdayMasaryk University182
February 2019ThursdayMasaryk University192
March 2019ThursdayCleverMaps company47not available
April 2019MondayKiwi.com company20not available
June 2019WednesdayKafara community center11not available
October 2019MondayRed Hat company15not available
November 2019SaturdayOpenAlt conference9not available
December 2019WednesdayKiwi.com company29not available
February 2020ThursdayMasaryk University235
Mean18.61.9
Median17.52.0
Table 6. Mean and median of the numbers of attendees in mapathons held in particular months.
MonthNumber of MapathonsNumber of ParticipantsMeanMedian
February36321.021.0
March27738.538.5
April23718.518.5
June33110.311.0
October23115.515.5
November3289.39.0
December36822.721.0
Total1833518.617.5
Publisher’s Note: MDPI stays neutral with regard to jurisdictional claims in published maps and institutional affiliations.

