Abstract
Investment in China’s transport infrastructure has contributed to its rapid economic growth, which also consumes a great deal of energy and generates a significant amount of carbon emissions. In these circumstances, it is worthwhile to discuss the internal influence mechanisms behind these two outcomes’ similar growth trends. This paper selects panel data from 30 regions in China from 2009 to 2019 and uses the threshold spatial autoregressive (TSAR) model to analyze the impact of transport infrastructure investment on the energy intensity due to fiscal decentralization. While studies of the relationship between transport infrastructure investment and energy intensity exist, few studies examine the non-linear spatial relationship between the two. This paper fills this gap by using the TSAR Model. The results show the following: (1) the effect of transport infrastructure investment on the energy intensity under fiscal decentralization and heterogeneity expresses non-linear characteristic; (2) there is a positive relationship between infrastructure investment and energy intensity when the degree of attenuation is low, but when the degree of attenuation is higher than a particular threshold value, transport infrastructure investment negatively impacts energy intensity; (3) rising energy prices, increasing investment in technological innovation costs, and increasing foreign trade will help to drive the decline in energy intensity.
1. Introduction
Global climate and health issues have emerged as a significant challenge post-COVID-19. At the 75th session of the United Nations General Assembly, the General Secretary of the Chinese Communist Party and President of China, Xi Jinping, proposed the goals of “carbon neutrality by 2030” and “carbon neutrality by 2060” based on China’s national conditions. In 2020, China’s central economic work conference explicitly listed “double-carbon” work as one of the eight key construction projects. The implementation of dual-carbon projects is full of opportunities and challenges. Promoting an energy transformation and reducing energy intensity has become a meaningful way to rely on the dual-carbon target [1].
With the decentralization of power from the central government to local governments, local governments have the primary responsibility for economic development within their jurisdiction [2]. A typical case is that fiscal decentralization has increased the fiscal revenue of local governments [3], and local governments have begun to expand various infrastructure investments to achieve rapid economic growth in their regions; at the same time, fiscal decentralization has brought an increase in energy consumption. To gain a deeper understanding of the impact of transportation infrastructure on energy intensity, this paper incorporates fiscal decentralization into its analysis framework.
In addition to analyzing the mechanism role of fiscal decentralization in the relationship between transportation infrastructure and energy intensity, two important issues should be noted: spatial and threshold effects. Local CO2 emissions can be affected by spatial effects in two ways [4,5]. One is that the carbon dioxide gas from other provinces flows into the local area; the other is that the energy transition in other places can have a demonstration effect, affecting the local energy transition and thus affecting the local energy intensity. The threshold effect is the difference in the degree of fiscal decentralization in various provinces, and the effect of transportation infrastructure investment on energy intensity is different. Local governments with higher fiscal decentralization have more fiscal revenues for investment in their transportation infrastructure, which may significantly impact their regions’ energy intensity. To further analyze the impact mechanism of transportation infrastructure investment on energy intensity, both spatial effects and threshold effects should be considered.
The contribution of this paper is reflected in the following three aspects. First, although many studies have analyzed the spatial spillover effects of energy intensity, they have ignored the non-linear spatial relationship between transportation infrastructure investment and energy intensity. Second, some literature separately analyzes the impact of transportation infrastructure investment and fiscal decentralization on energy intensity. Our article takes fiscal decentralization to be an instability factor and analyzes its role in the transmission path, which helps us to have a deeper understanding of the non-linear relationship between transportation infrastructure investment and energy intensity. Third, we use a novel empirical model called the threshold spatial autoregressive model (TSAR). This model can analyze the spatial heterogeneity between variables, so that the threshold effect and spatial effect are estimated in one equation, and the result is robust.
We use the TSAR model to analyze the impact of transportation infrastructure investment on energy intensity under different degrees of fiscal decentralization. We examined the non-linear spatial relationship between transportation infrastructure investment and energy intensity, and we also found that the degree of fiscal decentralization affects the mechanism between transportation infrastructure investment and energy intensity. Policy implications of these results suggest that the central government should pay attention to the role fiscal decentralization plays in the impact of transportation infrastructure investment on energy intensity.
The rest of this paper is structured as follows. Section 2 briefly reviews the existing literature. Section 3 includes the research methods and variable descriptions, which use the TSAR model to investigate the impact of transport infrastructure investment on energy intensity from the perspective of fiscal decentralization. Section 4 analyzes the empirical results using panel data from 30 provinces in China to analyze the impact of transport infrastructure investment on energy intensity at different degrees of fiscal decentralization. Section 5 provides the conclusions and policy implications. The final section discusses the limitations of this study.
2. Literature Review
This section reviews the factors influencing energy intensity—especially the research on the relationship between transportation infrastructure investment and energy intensity—and analyzes the role of fiscal decentralization in this relationship. At the end of this section, the progress of this article compared with the existing literature is given.
2.1. Studies on the Factors Affecting Energy Intensity
Many scholars have completed deep research into the factors influencing energy intensity, but the conclusions are different because of differences in theory and empirical methods. In the existing literature [6], scholars first studied the relationship between economic growth and energy structure, which showed a positive correlation between economic scale and energy factor consumption, which in turn led to a decline in environmental quality. To analyze the impact of railway, highway, aviation, and waterway per capita transportation mileage on energy intensity, Li et al. [7] combined the autoregressive distribution lag (ADL) with the vector error correction model (VECM) to examine China’s data from 1985 to 2013. Some researchers [8] analyzed the impact of foreign investment and technology and believe that foreign investment may improve technology, but also that its spillover effect inhibits the reduction of energy intensity. Predrag Petrovic [9] analyzed the imbalanced panel data of 36 EU countries from 1995 to 2015 and found that the main factors driving energy intensity were industrial output, real GDP per capita, and retail prices of petroleum. Although many factors have supported China’s energy intensity during the past four decades of rapid economic growth, transport infrastructure construction is considered essential [10,11,12]. Many studies have demonstrated that transport infrastructure investment plays a positive role in economic growth [13]. However, the rapid development of China’s economy, including its transport infrastructure investment as its main driving force, has taken its toll on the environment [14]. Therefore, it is necessary to analyze the relationship between transportation infrastructure investment and energy intensity.
2.2. Studies on the Impacts of Transportation Infrastructure Investment on Energy Intensity
There have also been many different conclusions regarding mechanisms in the impact of transport infrastructure investment on energy consumption. From a theoretical perspective, some studies provided evidence that transport infrastructure investment achieved green development through a knowledge spillover [15] and green innovation [16]. Lin and Chen [17] found that transport infrastructure investment reduced the energy intensity of China’s manufacturing industry in the long term. Wetwitoo and Hulten et al. [18,19] discovered that the productivity in developed areas was higher, and higher productivity could mean a lower energy intensity. Glaeser and Kahn [20] believed that the production costs saved could be allocated to energy-preserving technology, thus affecting energy efficiency. On the contrary, there is evidence that excessive transport infrastructure investment leads to massive energy consumption, ultimately leading to a double increase in energy intensity. According to the China National Ecological Environment Circular (2019), the width of the road has a significant negative impact on PM10, and although rail transit has an air-pollution-reducing effect in the long run, the construction of rail transit has a negative short-term effect on air quality.
In terms of quantitative research, empirical findings suggested that the inverse U-shaped inflection point of the Kuznets curve was used to study the non-linear relationship between transport infrastructure and energy consumption [21,22]. In areas with a high level of transportation infrastructure, increased investment can improve the infrastructure conditions in a region, and the scale effect of transportation infrastructure construction and the application of new technologies can also promote a reduction in energy consumption. However, for regions with a low level of transportation infrastructure, inter-provincial coordination is poor, and it is difficult to form a scale effect, resulting in investment in transportation facilities that can increase energy consumption. Moreover, from agglomeration economics theories, the energy intensity of different provinces has a spatial spillover effect, which can be tested by spatial econometrics [23]. The quadratic function only assumes a non-linear relationship between transport infrastructure and energy consumption. It is rare to start from estimating the data itself to verify the non-linear relationship between transport infrastructure and energy intensity. However, there are short works of literature that put the two effects into an econometric model for comprehensive estimation.
2.3. Studies on the Roles of Fiscal Decentralization in the Path of “Transport Infrastructure Investment—Energy Intensity”
Some studies also found that fiscal decentralization caused the local government to invest excessively in transport infrastructure for economic growth, and this action has squeezed the investment of the environmental protection department [24].
When China regulates energy intensity, the central government generally formulates unified policies, and local governments implement the policies. Due to their assessment and competition, local governments can be affected by many factors, resulting in differences in the supervision of energy intensity in different provinces. First, the importance of economic growth in the promotion and evaluation of officials is infinitely magnified, and local governments can blindly increase investment in transportation infrastructure; it can also reduce local governments’ emphasis on energy consumption to stimulate the local economic growth [25,26]. Second, to stabilize their tax revenue and reduce the transportation costs of local enterprises, local governments can increase investment in transportation infrastructure and ignore energy intensity [27]. Third, local governments increase investment in transportation infrastructure and carry out differentiated competition to attract more enterprises. Neighboring provinces can also imitate, attracting new enterprises and seeking economic development by increasing their investment in transportation infrastructure [28]. However, the existing literature rarely analyses the impact of transport infrastructure investment on energy intensity and the path of fiscal decentralization [29].
Although different regression approaches were applied in previous studies—such as the mediating effect model, moderating effect model, and system dynamics model—these methods ignore spatial effects. There is no research in the existing literature on the non-linear spatial relationship between transportation infrastructure and energy intensity. In contrast, our model can analyze the spatial heterogeneity between transportation infrastructure investment and energy intensity, so that the threshold and spatial effects are estimated in one equation. In terms of economic theory, since the general spatial measurement models are linear assumptions, they cannot explain the asymmetric policy responses of local governments. Investment in transportation infrastructure is increasing, but there are significant differences in energy intensity. As China’s regional economic development is unbalanced, the fiscal power of local governments is also different. The TSAR model can estimate the non-linear relationship in space, that is, considering the role of the different financial powers of local governments on transportation infrastructure investment in their effects on the relationship between transportation infrastructure investment and energy intensity.
3. Econometric Methodology
Based on works in the literature [11], we present the panel data model:
where EIit represents the energy intensity of province i at time t, TIit represents the investment intensity of province i at time t, Xit is a vector composed of a set of control variables, δt represents the time effect, and ui represents the personal effect.
Some investigations also showed that due to the existence of fiscal decentralization, to stimulate economic growth local governments can increase investment in transport infrastructure and squeeze investment in environmental pollution such as R&D expenditure. Thus, different degrees of decentralization can affect the impact of transport infrastructure investment on energy efficiency. We adopted the threshold regression model with panel data (TR) to investigate its impact on energy intensity and established the following TR:
In this formula, FDit means the degree of fiscal decentralization of province i at time t and I (.) is the indicative function.
Some scholars gave evidence that TI is an essential factor affecting energy intensity. However, energy intensity is affected by some other economic factors within the region. It is also affected by the spatial correlation of carbon emissions in the adjacent area [29]. Thus, we introduced the spatial lag of energy intensity based on Equation (2). Since the threshold variables in this paper act on the explanatory variables, the existing theory has not yet given the estimation method of the spatial Durbin model in the case of multiple thresholds. Therefore, we established the following TSAR model based on the previous literature and existing theories:
Here, W represents the spatial weight matrix. Thus, we take the spatial lag terms of the energy intensity (EIit) into the model to research the spatial spillover effects of the energy intensity.
3.1. Spatial Weight Matrix
There are three main methods to construct spatial weight matrices: spatial adjacency, economic distance, and geographical distance. However, compared with economic distance and geographical distance, the spatial adjacency matrix is sparse. The storage space can be saved without changing the contents and information of the original spatial matrix, and the speed and efficiency of the spatial metrological model analysis can be improved [30]. Therefore, this paper selects the spatial adjacency matrix as the spatial weight matrix of empirical research. The general expression for constructing the spatial adjacency weight matrix is:
3.2. Variable and Data
The dependent variable of this paper is the provincial energy intensity, the core independent variable is transport infrastructure investment, the threshold variable is fiscal decentralization, and the other variables are control variables.
3.2.1. Dependent Variable: Energy Intensity
Based on the definition of the statistical indicator, this paper defines energy intensity as the ratio of the primary energy consumption to real GDP.
3.2.2. Independent Variable: Investment in Transport Infrastructure
There are three methods to measure transport infrastructure investment: stock, public, and fixed asset. As a large amount of private capital participates in the investment in transport infrastructure, it is more appropriate to choose the fixed assets investment index for transport infrastructure. For this reason, this paper refers to the definition of transport infrastructure investment in the World Development Report 1994: Infrastructure for Development published by the World Bank. In the selection of indicators in the study by Liu Ming et al., the fixed assets investment of “transportation, warehousing, post and telecommunications” is selected as the index to analyze.
3.2.3. Threshold Variable: Fiscal Decentralization
Presently, the measurement of fiscal decentralization is mainly divided into three measurement methods: fiscal revenue decentralization, fiscal expenditure decentralization, and fiscal autonomy. To reflect regional differences in fiscal relations, this paper refers to the measurement methods of Chen Shuo et al. [31]. The degree of budgetary autonomy is chosen as the quantitative index of fiscal decentralization, defined as the ratio between the fiscal revenue and total fiscal expenditure in the provincial budget.
3.2.4. Control Variables
According to Shen Xiaobo et al. [32,33], the first control variable is the energy price index. When the energy price rises, each master will reduce its energy consumption to drive a reduction in the energy cost under the condition of a constant output. It has been shown that the energy price index harms energy intensity [34]. Since technological innovation significantly affects energy efficiency improvement, the second control variable selects R&D expenditure intensity to measure technological progress. The literature verifies that increasing R&D expenditure can promote technological progress and cause a drop in energy intensity [35]. In addition to fostering independent innovation through internal R&D costs, external channels such as foreign investment and international trade also play an essential role in technological innovation [36]. The theory of economic growth holds that foreign investment and foreign exchange have a spatial spillover effect and that technologically backward countries improve their domestic technical level by imitating the technology of advanced countries [37,38], thus contributing to a decline in energy intensity. Based on this, this paper selects foreign investment and imports and exports as control variables. The variable description is shown in Table 1.

Table 1.
Variable description and data processing.
3.3. Data Sources
This paper selects data from 30 provinces in China from 2009 to 2019 (excluding Hong Kong, Macao, Taiwan, and Tibet). The data in Table 1 are mainly from the wind database and CEIC China Economic Database. The data on transport infrastructure investment after 2018 were calculated according to the growth rate in the statistical bulletin of each province. The statistical descriptions of the variables are shown in Table 2.
Table 2.
Descriptive statistics of variables.
3.4. Threshold Effect Test
The number of possible thresholds M and the values of the thresholds γ needed to be solved before estimating the model’s regression (3). In the study of the threshold effect, Hansen’s theory [39] was used to search for the threshold values based on the idea of a minimum sum of squares of residuals.
The bootstrap method was used to simulate the asymptotic distribution and the critical values of the LR test. The results of the threshold effect and the threshold values are shown in Table 3.
Table 3.
Test of FD’s threshold effect.
The results in Table 3 show that the p-value of the triple threshold was 0.387, which is not significant at the level of 10%. In comparison, the estimate of the double threshold was essential at the level of 1%, which indicates the existence of a double-threshold effect. Therefore, when fiscal decentralization was used as the threshold variable, a threshold effect of transport infrastructure investment on energy intensity existed, indicating that transport infrastructure investment’s impact on energy intensity changed twice. It also shows that the impact of transport infrastructure investment on energy intensity can vary with the degree of fiscal decentralization. The interval classifications obtained for specific degrees of budgetary decentralization are shown in Table 4.
Table 4.
Classification of fiscal decentralization based on the threshold values.
4. Empirical Analysis
4.1. Spatial Correlation Test
To test the spatial correlation of the explained variables and verify the rationality of using a spatial econometric analysis, this study used a spatial adjacency weight to measure the energy intensity of Moran’s I in 30 regions of China from 2009 to 2019; results are shown in Table 5.
Table 5.
Global spatial correlation test.
As shown in Table 5, the energy intensity in the 30 regions in China was positive. At the 1% level, the significance test shows that energy intensity had a positive spatial correlation among provinces. The scatter plots of energy intensity in 2009 and 2019 are plotted in Figure 1 to vividly show the spatial correlation of energy intensity.
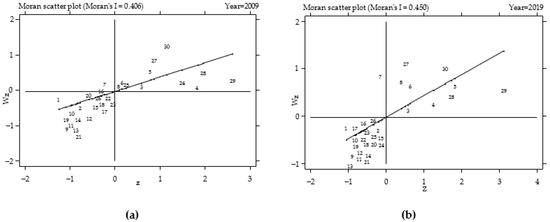
Figure 1.
This is a set of Moran scatter plots. Here: (a) scatter plot of local Moran index of EI in 30 provinces of China in 2009; (b) scatter plot of local Moran index of EI in 30 provinces of China in 2019.
From Figure 1, it can be found that the energy intensity in the first and third quadrants was higher than that in the second and fourth quadrants. Provinces with low (high) energy intensity tended to cluster spatially. The spatial correlation of energy intensity was verified by calculating the Moran index and drawing the cluster graph.
4.2. Empirical Results and Discussion
The results of the Hausman test indicate that the fixed effects form was adopted in the panel data model. Table 6 analyzes the impact of transport infrastructure investment on energy intensity using the panel data model, the threshold regression model with panel data (TR), and the threshold spatial autoregressive (TSAR) model. Referring to the method of Kelejian and Chen [40,41], we used spatial two-stage least squares to estimate the TSAR.
Table 6.
Regression results of the model.
The panel data model show that the impact coefficient of transport infrastructure investment on energy intensity was significantly positive at the 1% level, which indicates that the energy consumption increased with the increase in transport infrastructure investment. After adding the threshold effect, the model of TR is superior to the ordinary panel model’s goodness of fit. A threshold regression model with panel data with the control variable FDI did not appear significant from the single-variable significance. Other variables show the importance of little change. In the panel data model, transport infrastructure investment had a positive correlation with energy consumption. Under fiscal decentralization heterogeneity, transport infrastructure investment was still positively related to energy consumption in the first and second intervals. Still, in the third interval transport infrastructure investment was negatively correlated with energy intensity. However, the double-threshold model lacks a consideration of the spatial effect, so that it was mainly analyzed with TSAR.
The estimated results of TSAR in Table 6 show that the spatial lag ρ passed the significance test at the level of 1%, indicating a significant spatial spillover effect on energy intensity. This is also consistent with the conclusion that the energy intensity had an autocorrelation in space. According to the estimated coefficients of the threshold term, the impact of transportation infrastructure investment on energy intensity showed a non-linear trend. When the degree of budgetary decentralization was less than 0.292, each unit increase in transportation infrastructure investment was associated with a 0.9708 unit increase in energy intensity. When the degree of fiscal decentralization broke through the first threshold, the impact of transportation infrastructure investment on energy intensity decreased. Each additional unit of transport generated 0.5119 units of energy intensity. When the intensity of fiscal decentralization further expanded and broke through the second threshold, the effect of transportation infrastructure investment on energy negatively impacted the slight positive impact. This stage of development can be understood as follows: with the expansion of local financial power, the increase in the scale of transport infrastructure investment to increased energy intensity underwent an inevitable slowdown. Liu and Elheddad also found a non-linear relationship between fiscal decentralization and energy consumption [42,43,44].
According to the new economic geography theory, with the impact of transportation costs, material resources, human resources, and other factors on space, energy consumption can also move spatially, resulting in an inverted U-shaped change in energy intensity in space. Based on the empirical results in Table 6, double thresholds of fiscal decentralization and their effects on the energy intensity of transport infrastructure investment are gradually weakened. It can be understood that there is an inverted U-shaped trend of energy intensity in transport infrastructure investment. Numerous theories and studies have shown that fiscal decentralization and transport infrastructure investment impacted positively on energy intensity. Given a negative relationship between transport infrastructure investment and energy intensity when the degree of decentralization was higher than the second threshold, Kuby and He [45] believed that local governments had increased the amount of debt issuance and corporate tax incentives to attract a group of low-energy, high-tech companies to settle in the local area, which had a high degree of decentralization, and could increase investment in transport infrastructure to reduce the transport costs of foreign enterprises, allowing these areas to produce lower energy emissions. On the other hand, introducing the technological level and economic benefits of these foreign companies could promote the energy transformation of local industries and further reduce the energy intensity. These areas are mainly distributed in eastern coastal provinces and cities.
4.3. Decomposition of Spatial Effects
For spatial econometric models, the effects of independent variables on dependent variables can be decomposed into direct effects, indirect effects, and total effects. The marginal effects should be judged based on the decomposed effects. Table 7 shows the direct, indirect, and total effects calculated based on the model estimates.
Table 7.
Spatial effect decomposition.
The results in Table 7 show that the spatial effects of transportation infrastructure investment on energy intensity were statistically significant under different degrees of decentralization. When the degree of fiscal decentralization was in the first and second interval, the increase in investment in transportation infrastructure in a region could not only increase its energy intensity; it could also have a positive impact on the energy intensity of the surrounding area. Specifically, for the Midwestern Sectional Figure Skating Championships, each percent increase in transport infrastructure investment in the surrounding provinces would result in a 0.6 percent to 0.9 percent increase in the energy intensity of the province. In terms of the overall effect, an increase of 1% in the transportation infrastructure investment in the central and western regions would increase energy intensity by 1.21% to 1.71%. If investment in transportation infrastructure increased by 1% in the eastern region, energy intensity would drop by 0.58%.
For other control variables, energy prices, technological innovation, and foreign trade had a significant direct inhibitory effect on energy intensity directly and had a significant inhibitory effect on indirect effects. This shows that rising energy prices, increasing investment in technological innovation, and increasing foreign trade can benefit energy intensity. The direct effect of foreign investment on energy intensity was negatively correlated. However, the indirect effect was positively correlated, and the significance as not exceptionally high, indicating that the entry of foreign investment did not achieve the expected decline in energy intensity through technology-spillover effects. On the contrary, the overall effect was positively correlated, indicating that foreign investment had a negative impact on the overall energy intensity of a region.
4.4. Robustness Test
To verify the rationality of the TSAR model and the robustness of the conclusions, this study performed regression tests by changing the index of the fiscal decentralization measure and spatial weight matrix. First, we used Xu’s method [46] of fiscal decentralization measurement for local governments to replace Chen and others’ fiscal decentralization measurement methods. Second, the spatial weight matrix used in the TSAR model was transformed from the spatial adjacency method to the geographical distance weight matrix for regression. Third, we performed the regression again by adding two control variables, which are the population density and the GDP per capita.
The regression results in Table 8 show that there were still double thresholds in the replaced financial decentralization indicators. The symbols and signs of the regression coefficient of energy intensity for transport infrastructure investment did not change substantially in each interval. That is to say that there was an inverted U-shaped trend of energy intensity in transport infrastructure investment.
Table 8.
Robustness tests.
5. Conclusions and Policy Implications
5.1. Conclusions
This study selected panel data on transport infrastructure investment and energy intensity in 30 regions of China from 2009 to 2019 and tested the threshold effect and spatial correlation. By analyzing the empirical results, the main conclusions are as follows.
First, transportation infrastructure investment significantly impacted energy intensity, and this effect was non-linear in space. Specifically, there was a positive relationship between transportation infrastructure investment and energy intensity. However, transportation infrastructure investment always negatively affected energy intensity when decentralization was higher than a certain threshold, which was mainly manifested in China’s eastern coastal provinces and cities.
Second, investment in transport infrastructure directly affected energy intensity and had a significant adverse impact on reducing energy intensity through indirect effects. The direct and indirect effects of transportation infrastructure investment on energy intensity were both positive. Nevertheless, for provinces with a high degree of fiscal decentralization, the direct and indirect impacts showed opposite conclusions. This conclusion could be explained as follows: that an increase of 1% in transport infrastructure investment would increase energy intensity by approximately 1.2116% to 1.7128%.
Third, energy price, technology innovation, and foreign trade had significant inhibitions on energy intensity, but the relationship between foreign investment and energy intensity is uncertain.
Fourth, the neglect of non-linear relationships in space could lead to biased regression results.
5.2. Policy Implications
The conclusion of this paper enables us to put forward some targeted policy recommendations to improve the policy design of the Chinese government and provides references for local governments with different levels of fiscal decentralization.
First, the central government should attach importance to investment in transportation infrastructure in the central and western regions and decentralize some fiscal powers, giving them to local governments. The central government could also give local governments certain powers in the issuance of bonds and tax collection, and improve the audit and supervision mechanism, so that fiscal decentralization can truly bring dividends for the central and western regions in attracting investment and at the same time strengthen the migration of high-tech industries to stimulate the technological innovation of local enterprises and promote the conservation of energy and reduction of emissions.
Second, the central government could increase high-speed rail investment in the central and western regions. Furthermore, local governments could also guide residents to use high-speed rail as their primary mode of travel. For the inverted U-shaped inflection point for transportation infrastructure investment to arrive as soon as possible, governments at all levels should comprehensively formulate plans based on financial conditions to increase the incentive system for eastern technical personnel to support the western region, improve energy efficiency in the central and western regions, and reduce energy intensity.
Third, the local governments could actively reform energy prices and use energy price control mechanisms to reduce energy consumption. At present, in addition to coal having achieved a market-oriented mechanism, other energy prices are still under the government’s macro-control. The central government should speed up the formulation of the carbon trading system and improve the carbon market pricing mechanism and regulatory mechanism. The government should also provide certain fiscal expenditures as extraordinary expenses for new energy research and development to accelerate the application of clean and renewable energy.
6. Discussion
To achieve more credible scientific research and stronger policy recommendations in this study, we discuss its limitations, which are detailed as follows.
First, although we have used the novel TSAR model to analyze the non-linear spatial impact of transportation infrastructure investment on energy intensity, due to the limitations of theoretical estimation methods we are currently unable to provide a comparison between the TSDM model and TSEM model, because in these models the method of estimating has not yet been studied. The TSAR is the most novel and appropriate among the existing models when analyzing the non-linear relationship in space.
Second, due to the difficulty of obtaining data, many variables have not been considered when selecting control variables in this study. Of course, when we were conducting research, we also excluded many control variables that did not meet the conditions. For example, there was multicollinearity among existing variables, and they were not significant after being added.
Third, this study analyzed the impact of transportation infrastructure on energy intensity. Provinces with a higher degree of decentralization had a negative impact on energy intensity. These provinces are mainly manifested in the eastern part of China. Based on this conclusion, this article makes the following bold conjectures: for some emerging economies, the degree of fiscal decentralization of local governments is low, and transportation infrastructure investment can have a positive relationship with energy intensity. That is, the environment will be polluted. For developed countries such as Europe and the United States, where fiscal decentralization is relatively high and technology is relatively advanced, investment in transportation infrastructure negatively correlates with energy intensity. In the future, we will collect data from various countries to analyze the relationship between transportation infrastructure investment and energy intensity in the context of fiscal decentralization heterogeneity.
Author Contributions
W.L. conceived and designed the study and created the analytical model. A.Y. reviewed and edited the paper. All authors discussed the results and implications and commented on the paper at all stages. All authors have read and agreed to the published version of the manuscript.
Funding
This research was funded by the National Natural Science Foundation of China, grantnumbers 72073030 and 71571046.
Institutional Review Board Statement
Not applicable.
Informed Consent Statement
Not applicable.
Data Availability Statement
https://data.cnki.net/trade/yearbook/Single/N2020100004?z=Z001. (accessed on 6 September 2021).
Conflicts of Interest
The authors declare no conflict of interest.
References
- Fan, Y.; Yi, B. Evolution, Driving Mechanism, and Pathway of China's Energy Transition of the article. J. Manag. World 2021, 37, 95–105. [Google Scholar]
- Qian, Y.; Weingast, B.R. Federalism as a Commitment to Preserving Market Incentives. J. Econ. Perspect. 1997, 11, 83–92. [Google Scholar] [CrossRef]
- He, C. Regional decentralisation and location of foreign direct investment in China. Post-Communist Econ. 2006, 18, 33–50. [Google Scholar]
- Ren, X.; Lu, Z.; Cheng, C.; Shi, Y.; Shen, J. On dynamic linkages of the state natural gas markets in the USA: Evidence from an empirical spatio-temporal network quantile analysis. Energy Econ. 2019, 80, 234–252. [Google Scholar] [CrossRef]
- Ren, X.; Cheng, C.; Wang, Z.; Yan, C. Spillover and dynamic effects of energy transition and economic growth on carbon dioxide emissions for the European Union: A dynamic spatial panel model. Sustain. Dev. 2020, 29, 228–242. [Google Scholar] [CrossRef]
- Barker, T.; Dagoumas, A.; Rubin, J. The macroeconomic rebound effect and the world economy. Energy Effic. 2009, 2, 411–427. [Google Scholar] [CrossRef]
- Li, X.; Fan, Y.; Wu, L. CO2 emissions and expansion of railway, road, airline and in-land waterway networks over the 1985-2013 period in China: A time series analysis. Transport. Res. Part D—Transport. Environ. 2017, 57, 130–140. [Google Scholar] [CrossRef]
- Huang, J.; Du, D.; Tao, Q. An analysis of technological factors and energy intensity in China. Energy Policy 2017, 109, 1–9. [Google Scholar] [CrossRef]
- Petrovic, P.; Filipovic, S.; Radovanovic, M. Underlying causal factors of the European Union energy intensity: Econometric evidence. Renew. Sustain. Energy Rev. 2018, 89, 216–227. [Google Scholar] [CrossRef]
- Cosar, A.K.; Demir, B. Domestic Road Infrastructure and International Trade: Evidence from Turkey. J. Dev. Econ. 2016, 118, 232–244. [Google Scholar] [CrossRef]
- Rokicki, B.; Stepniak, M. Major transport infrastructure investment and regional economic development—An accessibility-based approach—ScienceDirect. J. Transp. Geogr. 2018, 72, 36–49. [Google Scholar] [CrossRef]
- Yu, J.; Shi, X.; Laurence, J. Will the Chinese economy be more volatile in the future? Insights from urban household survey data. Int. J. Emerg. Mark. 2019, 4, 790–808. [Google Scholar] [CrossRef]
- Lin, B.; Chen, Y. Transportation infrastructure and efficient energy services: A perspective of China's manufacturing industry. Energy Econ. 2020, 89, 104809. [Google Scholar] [CrossRef]
- Duan, F.; Ji, Q.; Liu, B.; Fan, Y. Energy investment risk assessment for nations along China's Belt & Road Initiative. J. Clean. Prod. 2018, 170, 535–547. [Google Scholar]
- Agrawal, A.; Galasso, A.; Oettl, A. Roads and Innovation. Rev. Econ. Stat. 2017, 99, 417–434. [Google Scholar] [CrossRef]
- Sun, D.; Zeng, S.; Lin, H.; Meng, X.; Yu, B. Can transportation infrastructure pave a green way? A city-level examination in China. J. Clean. Prod. 2019, 226, 669–678. [Google Scholar] [CrossRef]
- Lin, B.; Chen, Y. Will economic infrastructure development affect the energy intensity of China's manufacturing industry? Energy Policy 2019, 132, 122–131. [Google Scholar] [CrossRef]
- Wetwitoo, J.; Kato, H. High-speed rail and regional economic productivity through agglomeration and network externality: A case study of inter-regional transportation in Japan. Case Stud. Transp. Policy 2017, 5, 549–559. [Google Scholar] [CrossRef]
- Hulten, C.R.; Bennathan, E.; Srinivasan, S. Infrastructure, externalities, and economic development: A study of the Indian manufacturing industry. World Bank Econ. Rev. 2006, 20, 291–308. [Google Scholar] [CrossRef]
- Glaeser, E.L.; Kahn, M.E. The greenness of cities: Carbon dioxide emissions and urban development. J. Urban Econ. 2010, 67, 404–418. [Google Scholar] [CrossRef] [Green Version]
- Fu, F.; Liu, H.; Polenske, K.R.; Li, Z. Measuring the energy consumption of China's domestic investment from 1992 to 2007. Appl. Energy 2013, 102, 1267–1274. [Google Scholar] [CrossRef]
- Bi, C.; Jia, M.; Zeng, J. Nonlinear Effect of Public Infrastructure on Energy Intensity in China: A Panel Smooth Transition Regression Approach. Sustainability 2019, 11, 629. [Google Scholar] [CrossRef] [Green Version]
- Wang, N.; Zhu, Y.; Yang, T. The impact of transportation infrastructure and industrial agglomeration on energy efficiency: Evidence from China's industrial sectors. J. Clean. Prod. 2020, 244, 118708. [Google Scholar] [CrossRef]
- Wu, A.; Ye, L.; Li, H. The impact of fiscal decentralization on urban agglomeration: Evidence from China. J. Urban Aff. 2019, 41, 170–188. [Google Scholar] [CrossRef] [Green Version]
- Jin, J.; Zou, H. How does fiscal decentralization affect aggregate, national, and subnational government size? J. Urban Econ. 2002, 52, 270–293. [Google Scholar] [CrossRef] [Green Version]
- Fredriksson, P.; Millimet, D. Strategic interaction and the determination of environmental policy across US states. J. Urban Econ. 2002, 51, 101–122. [Google Scholar] [CrossRef]
- Barret, S. Strategic Environmental Policy and International Trade. J. Public Econ. 1994, 54, 325–338. [Google Scholar] [CrossRef]
- Xie, H.; Liu, G.; Liu, Q.; Wang, P. Analysis of Spatial Disparities and Driving Factors of Energy Consumption Change in China Based on Spatial Statistics. Sustainability 2014, 6, 2264–2280. [Google Scholar] [CrossRef] [Green Version]
- LeSage, J.P.; Pace, R.K. Spatial econometric modeling of origin-destination flows. J. Reg. Sci. 2008, 48, 941–967. [Google Scholar] [CrossRef]
- Elhorst, J.P. Specification and estimation of spatial panel data models. Int. Reg. Sci. Rev. 2003, 3, 244–268. [Google Scholar] [CrossRef]
- Wang, F.; Chen, S. Tax Reform, Fiscal Decentralization and Local Public Goods Provision in China. China 2017, 15, 145–162. [Google Scholar]
- Shen, X.; Lin, B. Does industrial structure distortion impact the energy intensity in China? Sustain. Prod. Consump. 2021, 2, 551–562. [Google Scholar] [CrossRef]
- Shen, X.; Lin, B. Policy incentives, R&D investment, and the energy intensity of China's manufacturing sector. J. Clean. Prod. 2020, 255, 120208. [Google Scholar]
- Hang, L.; Tu, M. The impacts of energy prices on energy intensity: Evidence from China. Energy Policy 2007, 35, 2978–2988. [Google Scholar] [CrossRef]
- Lin, B.; Du, Z. Promoting energy conservation in China's metallurgy industry. Energy Policy 2017, 104, 285–294. [Google Scholar] [CrossRef]
- Elliott, J.R.; Sun, P.; Chen, S. Energy intensity and foreign direct investment: A Chinese city-level study. Energy Econ. 2013, 40, 484–494. [Google Scholar] [CrossRef]
- Yu, H. The influential factors of China's regional energy intensity and its spatial linkages: 1988–2007. Energy Policy 2012, 45, 583–593. [Google Scholar] [CrossRef]
- Zheng, Y.; Qi, J.; Chen, X. The effect of increasing exports on industrial energy intensity in China. Energy Policy 2011, 39, 2688–2698. [Google Scholar] [CrossRef]
- Hansen, B.E. Threshold effects in non-dynamic panels: Estimation, testing, and inference. J. Econom. 1999, 2, 345–368. [Google Scholar] [CrossRef] [Green Version]
- Kelejian, H.H.; Prucha, I.R. Generalized spatial two-stage least squares procedure for estimating a spatial autoregressive model with autoregressive disturbances. J. Real Estate Finance Econ. 1998, 17, 99–121. [Google Scholar] [CrossRef]
- Chen, C.; Ye, A. Threshold Effect of the Internet on Regional Innovation in China. Sustainability 2021, 13, 10797. [Google Scholar] [CrossRef]
- Liu, L.; Ding, D.; He, J. Fiscal Decentralization, Economic Growth, and Haze Pollution Decoupling Effects: A Simple Model and Evidence from China. Comput. Econ. 2019, 54, 1423–1441. [Google Scholar] [CrossRef]
- Chen, X.; Liu, J. Fiscal Decentralization and Environmental Pollution: A Spatial Analysis. Discrete Dyn. Nat. Soc. 2020, 2020, 9254150. [Google Scholar] [CrossRef] [Green Version]
- Elheddad, M.; Djellouli, N.; Tiwari, A.K. The relationship between energy consumption and fiscal decentralization and the importance of urbanization: Evidence from Chinese provinces. J. Environ. Manag. 2020, 264, 110474. [Google Scholar] [CrossRef]
- Kuby, M.; He, C.; Trapido-Lurie, B.; Moore, N. The Changing Structure of Energy Supply, Demand, and CO2 Emissions in China. Ann. Assoc. Am. Geogr. 2011, 101, 795–805. [Google Scholar] [CrossRef]
- Qiao, B.; Martinez-Vazquez, J.; Xu, Y. The tradeoff between growth and equity in decentralization policy: China's experience. J. Dev. Econ. 2008, 86, 112–128. [Google Scholar] [CrossRef]
Publisher’s Note: MDPI stays neutral with regard to jurisdictional claims in published maps and institutional affiliations. |
© 2021 by the authors. Licensee MDPI, Basel, Switzerland. This article is an open access article distributed under the terms and conditions of the Creative Commons Attribution (CC BY) license (https://creativecommons.org/licenses/by/4.0/).