
Towards Nearly-Zero Energy in Heritage Residential Buildings Retrofitting in Hot, Dry Climates


Abstract
1. Introduction
1.1. Literature Review
1.2. Research Proplems and Objectives
- How can heritage buildings transform to become energy neutral in hot climates?
- What are the optimal scenarios that can achieve the nearly-zero energy target while preserving cultural values?
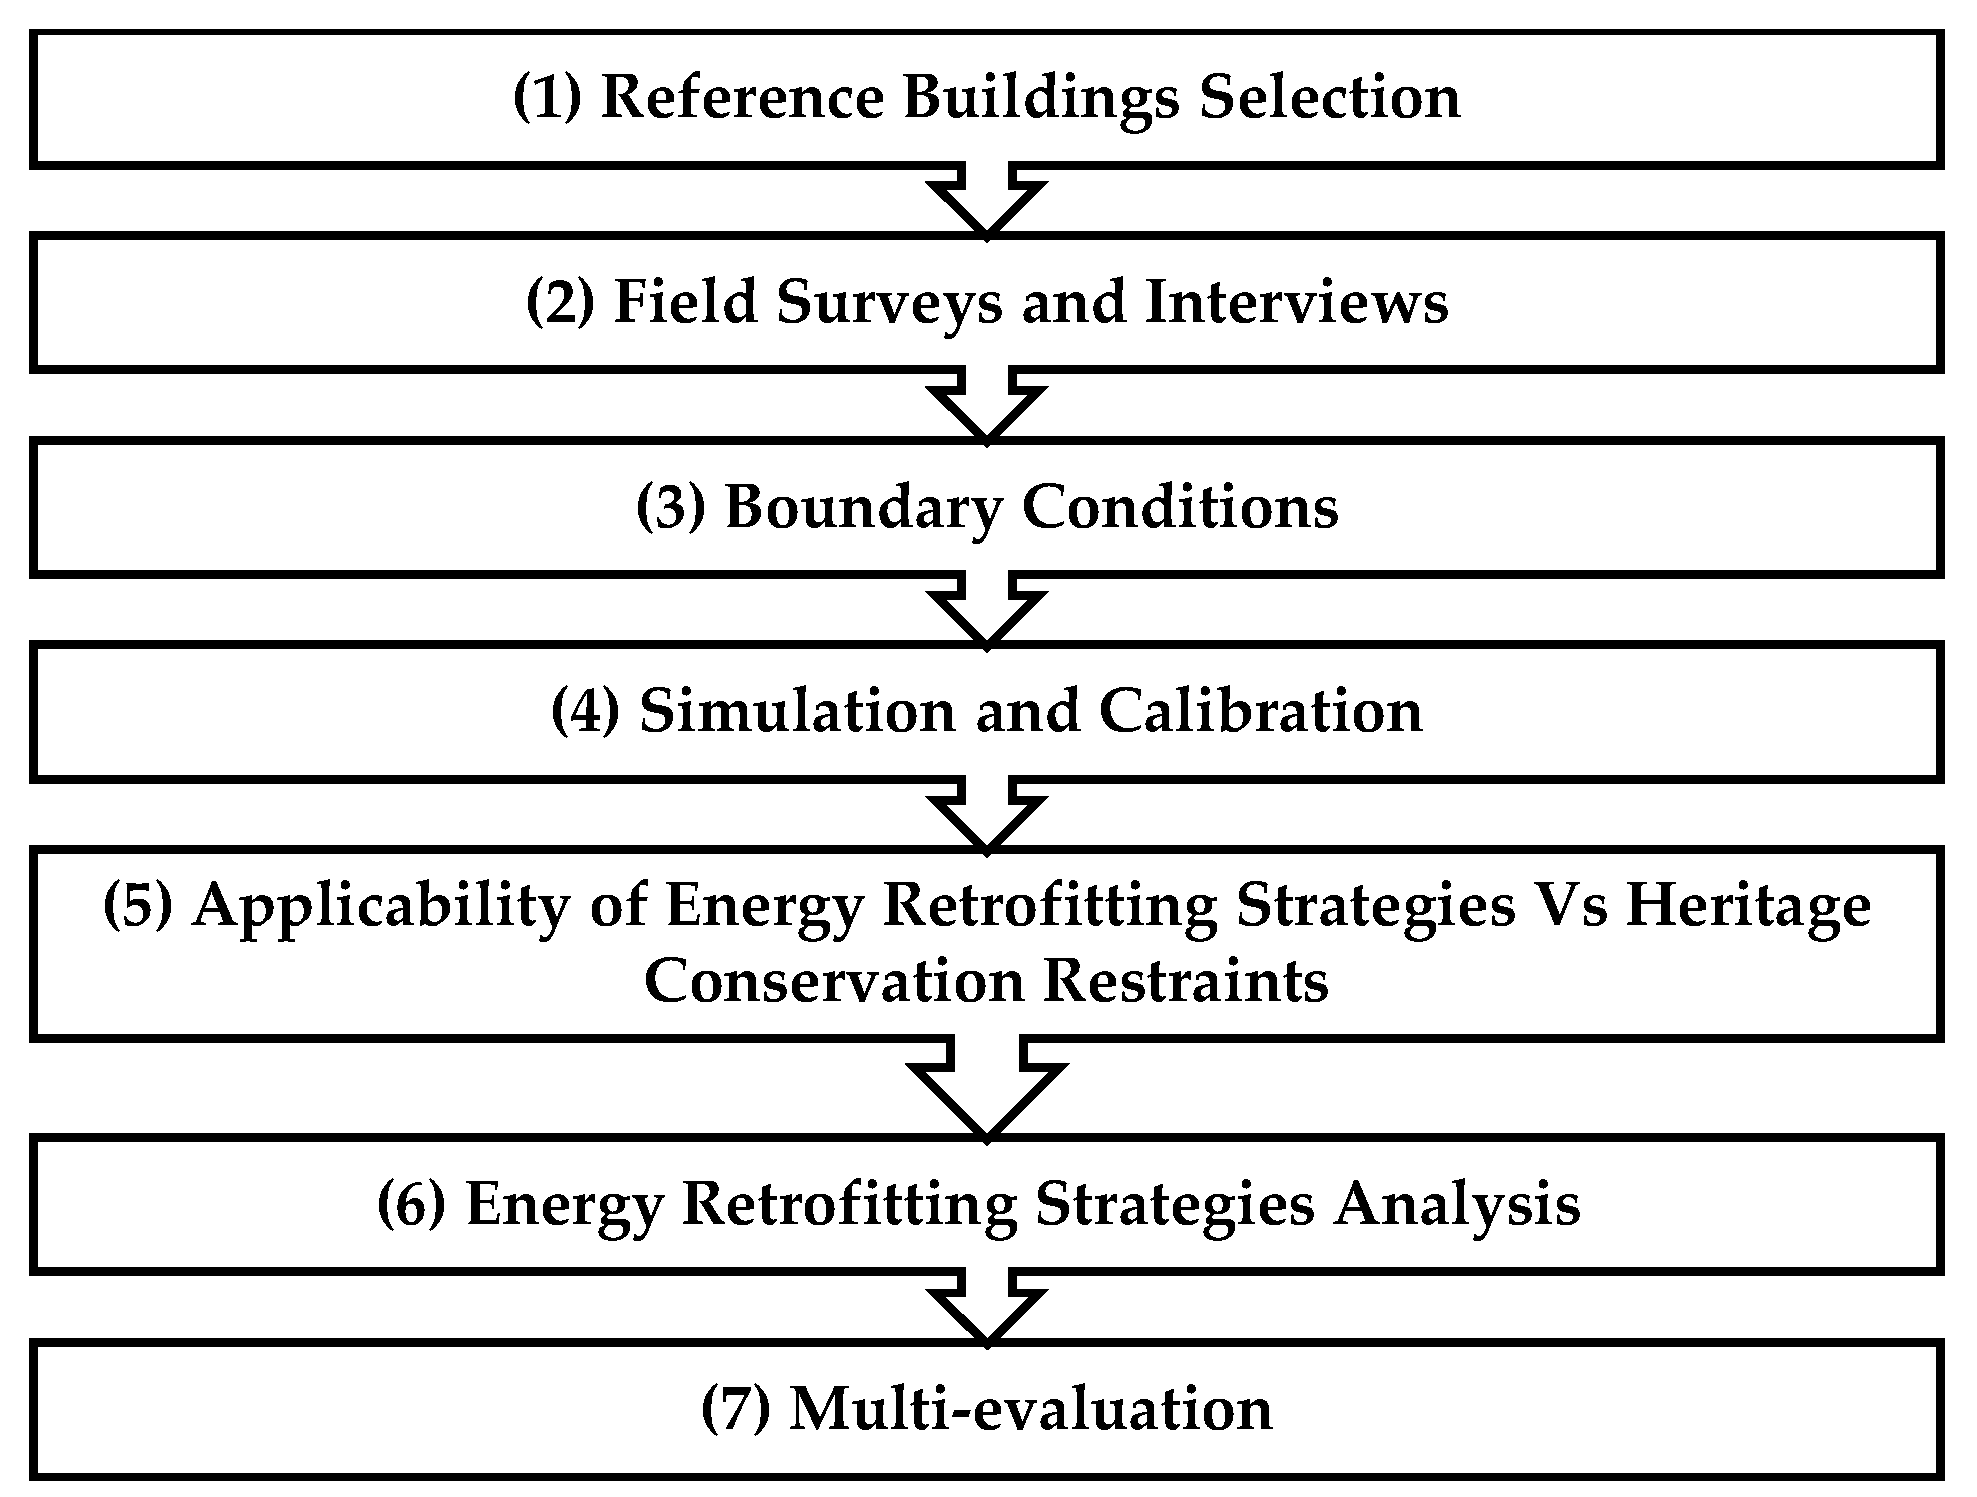
2. Materials and Methods
2.1. Reference Buildings Selection
2.1.1. Criteria for Selecting Reference Buildings
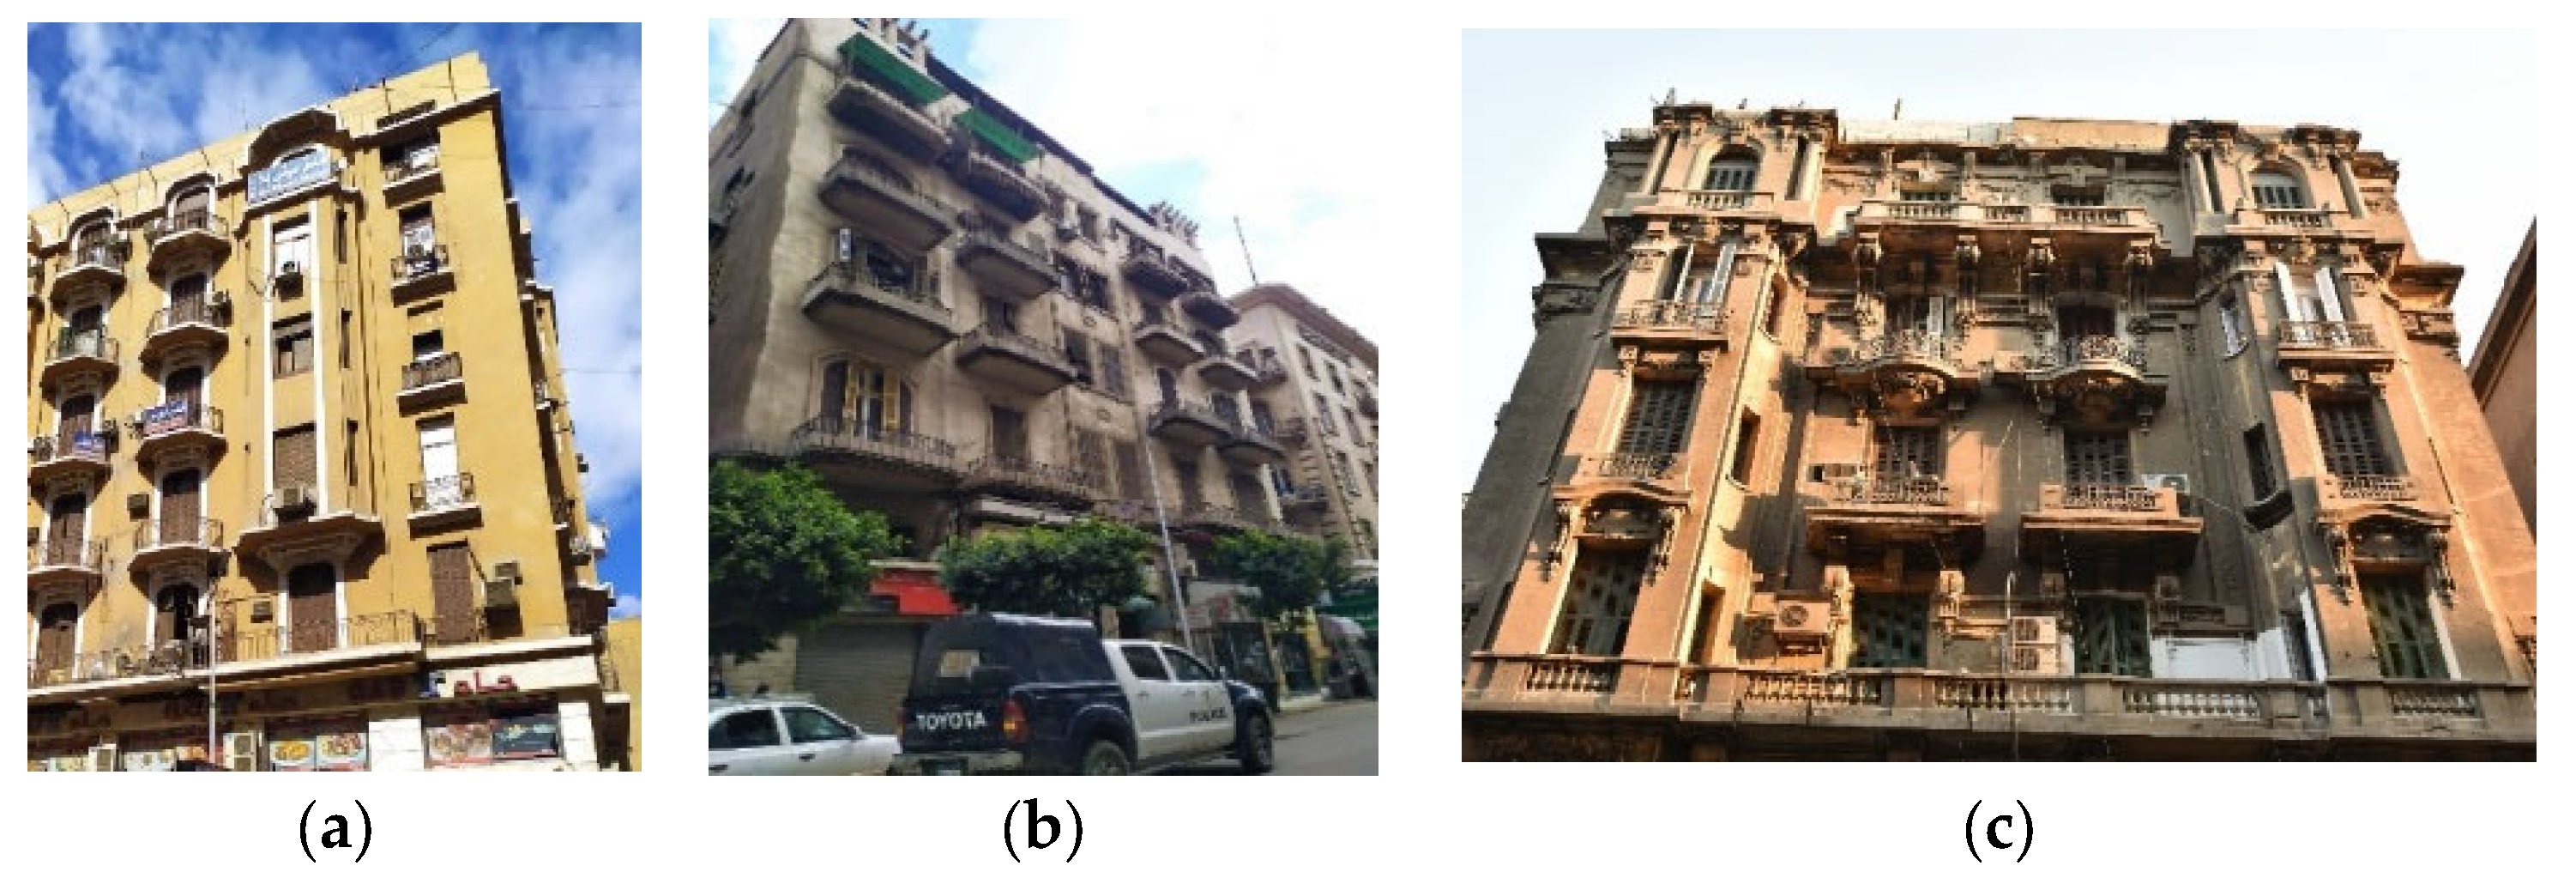
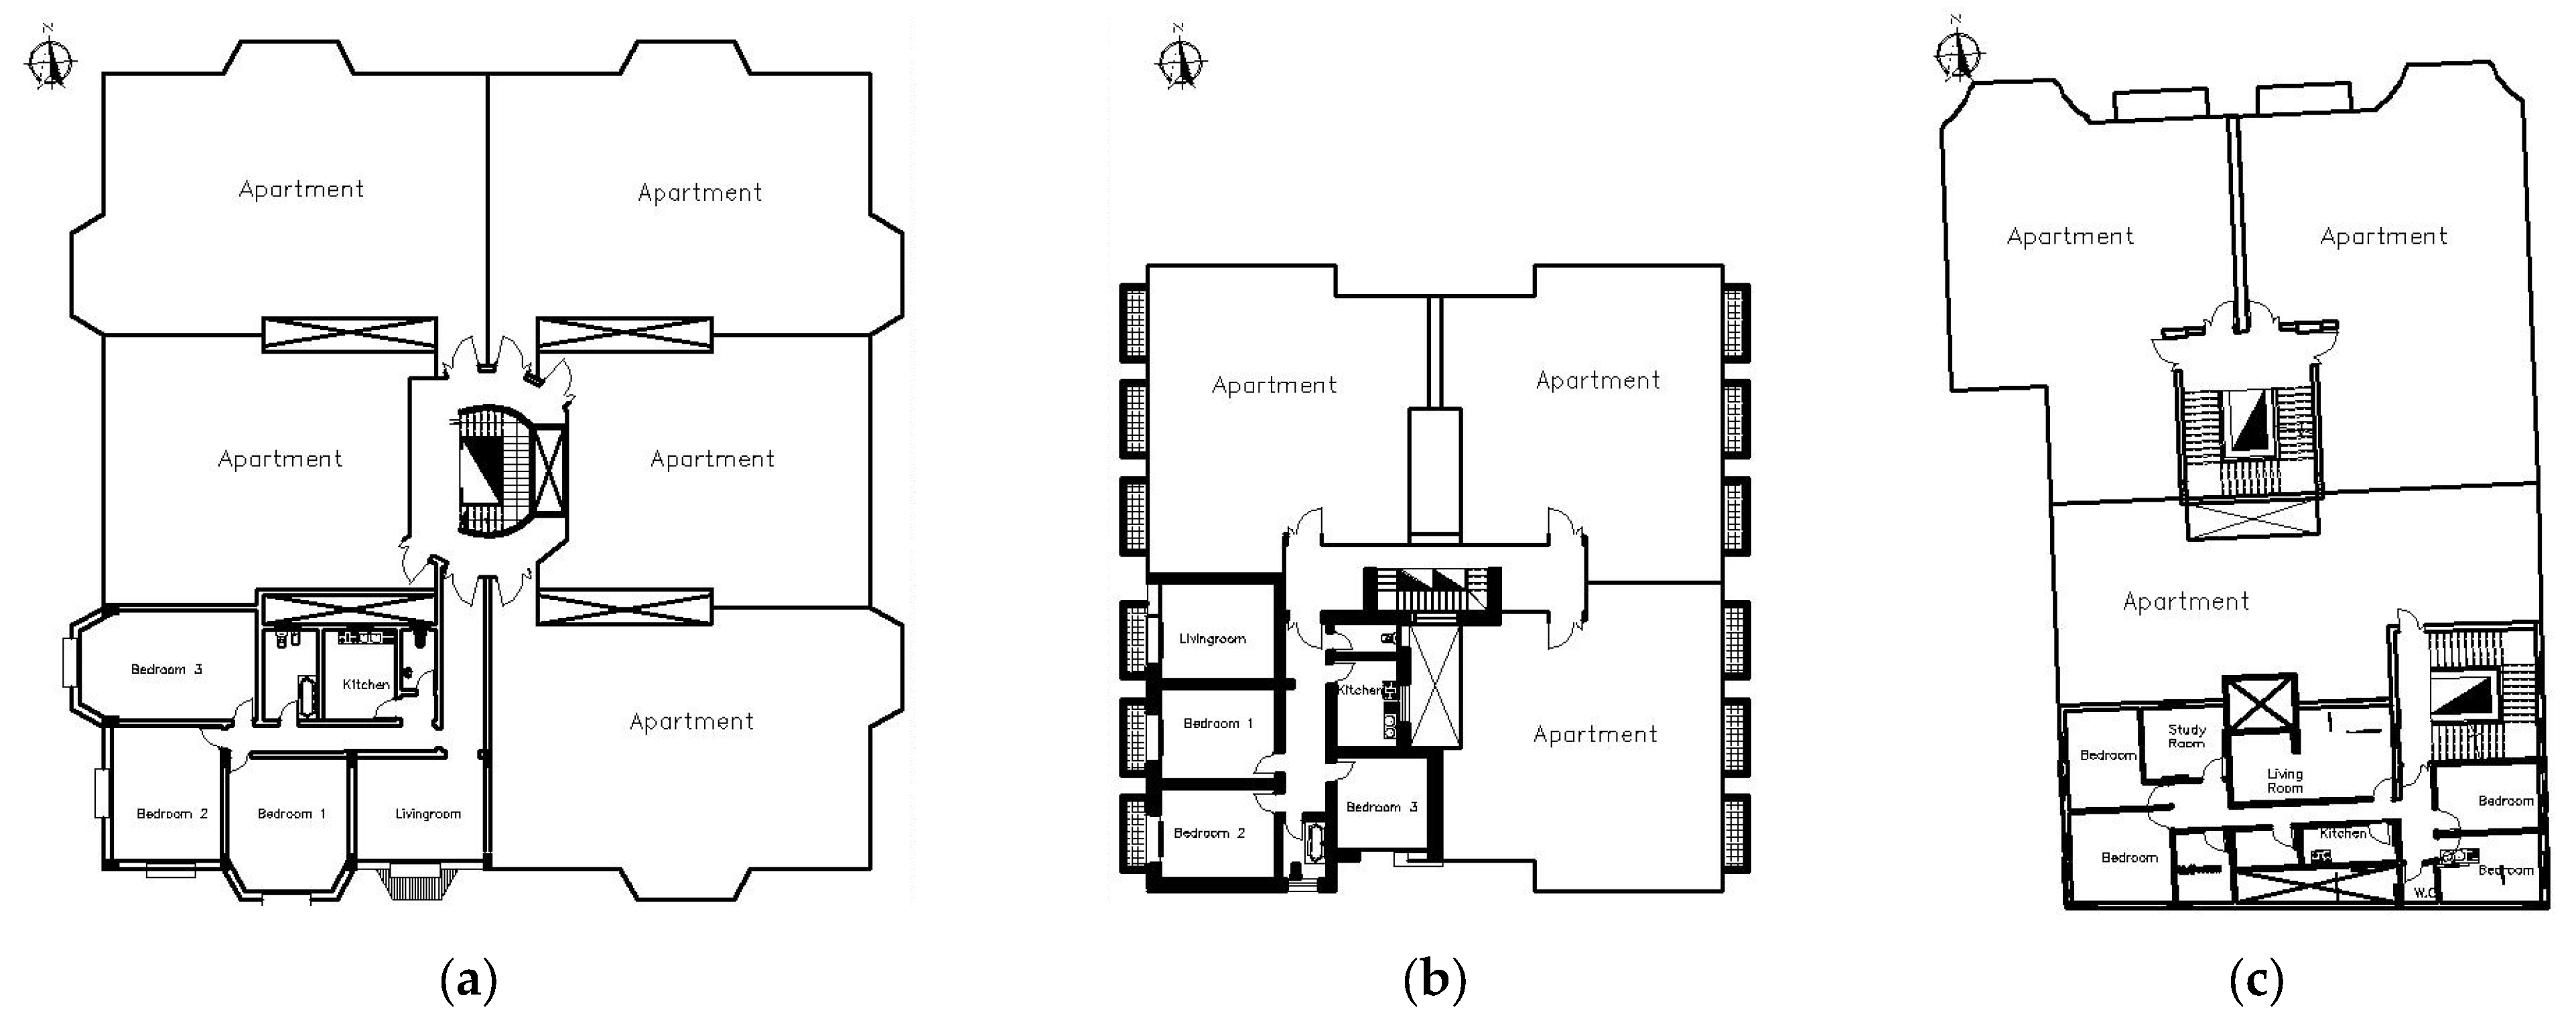
2.1.2. Description of The Selected Reference Buildings
2.1.3. Climate Characteristics of the Case Study Area
- Location and weather
- Irradiation data
2.2. Field Surveys and Interviews
2.2.1. Measurements and Weather Data
2.2.2. Housing and Household Characteristics
2.3. Boundary Conditions
2.4. Simulation and Calibration
2.5. Applicability of Retrofitting Strategies vs. Heritage Conservation Restraints
2.6. Energy Retrofitting Strategies Analysis
2.6.1. Passive Retrofitting Strategies
2.6.2. Active Retrofitting Strategies (Non-Energy Generating)
- Replacement of Lighting
- Replacement of Air Conditioning units
2.6.3. Active Retrofitting Strategies (Energy Generating)
- Building Integrated Photovoltaic (BIPV)
- Location of PV System
- 2.
- Selection of orientation and tilt angle
- 3.
- Selection of PV module
- 4.
- Selection of PV system size/layout
- 5.
- Inverter selection
- 6.
- Energy storage system selection
- Building Integrated Solar Thermal (BIST)
2.6.4. Hybrid Strategy (Combination of Passive and Active)
2.7. Multi-Evaluation
3. Results
3.1. Modeling and Validation
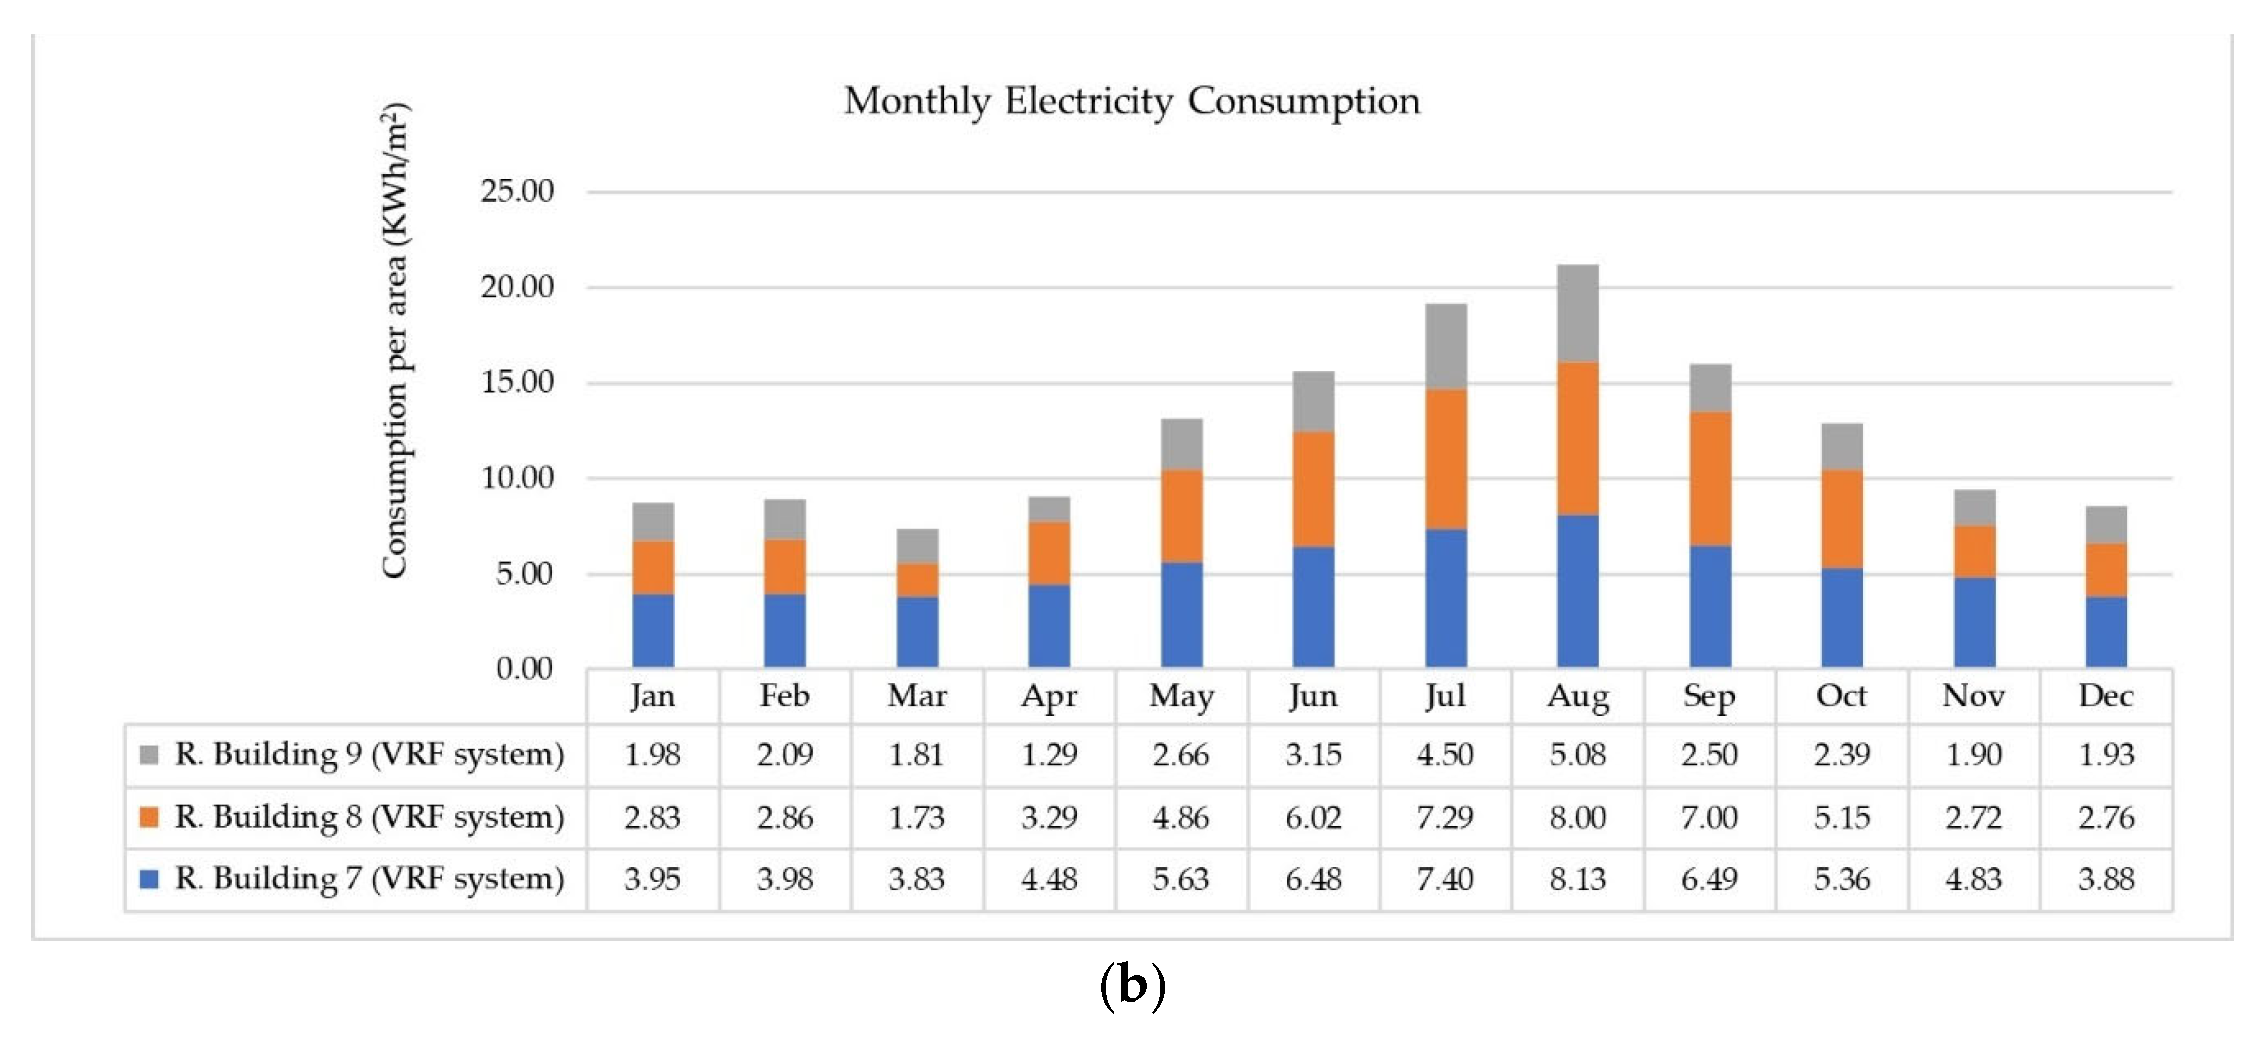
3.2. Evaluation of the Base Case Status
3.3. Effect of Passive Strategies
3.4. Effect of Applying Active Strategies
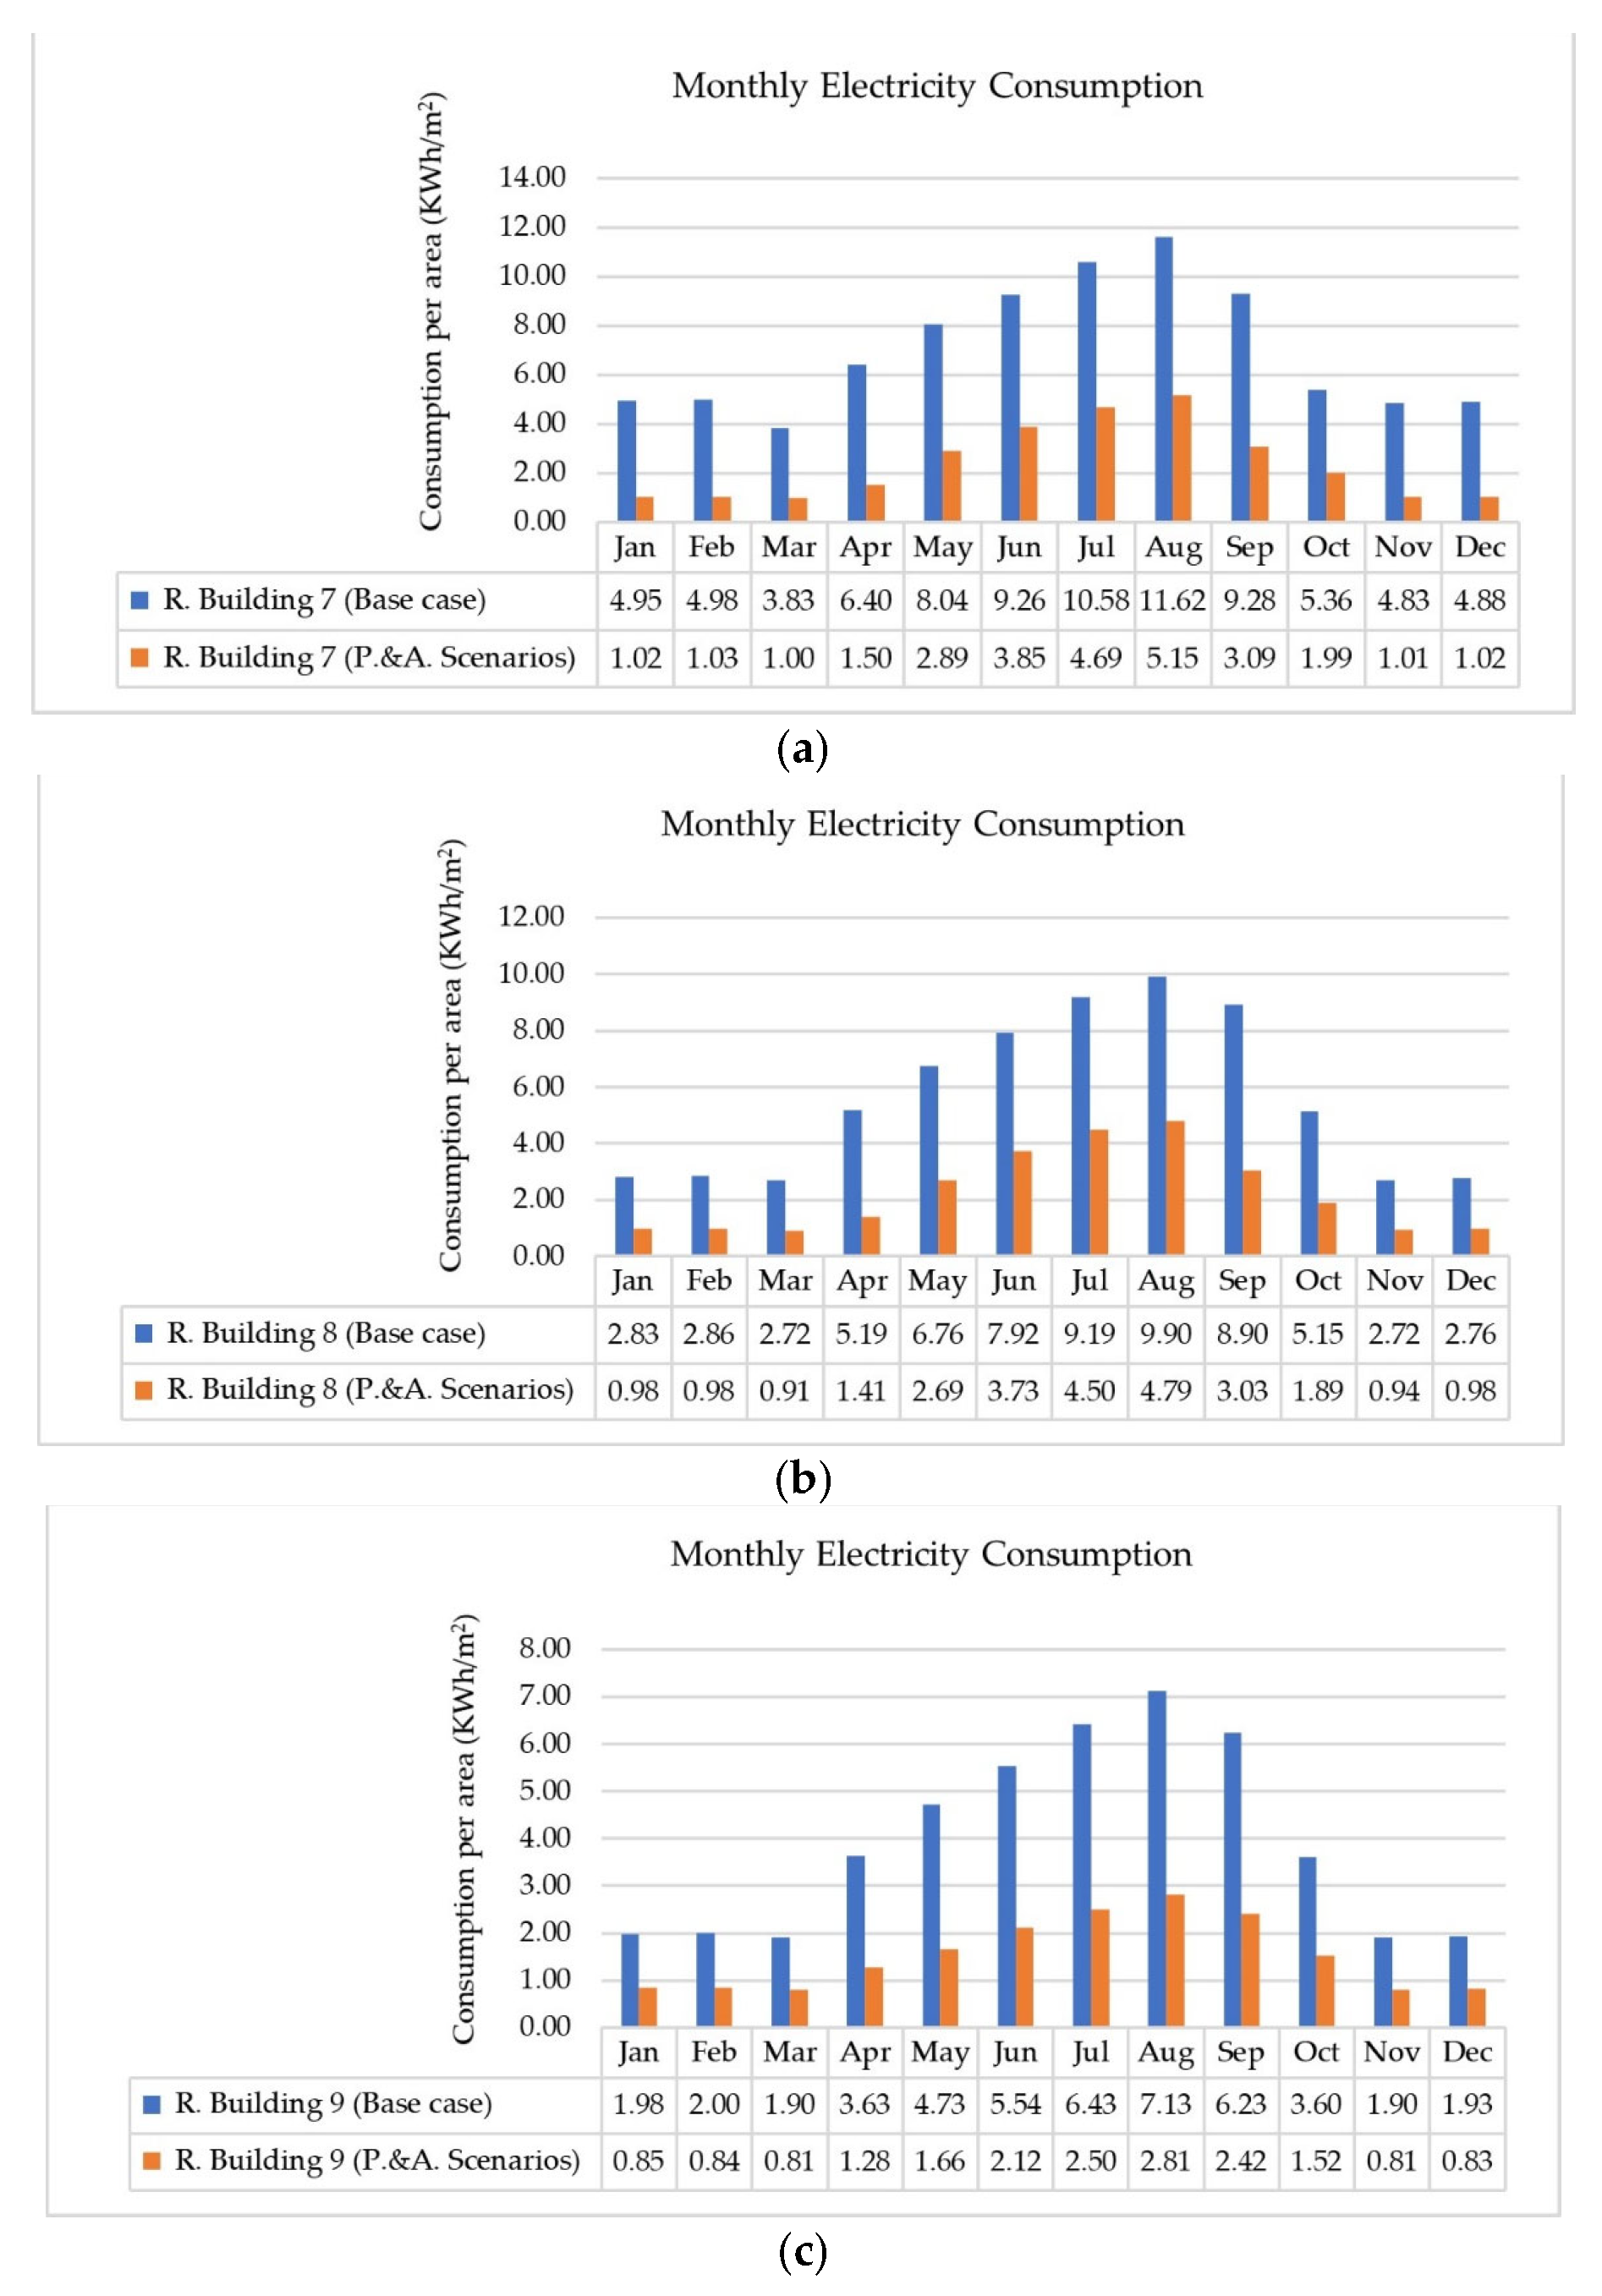
3.5. Effect of Combination between Passive and Active Strategies
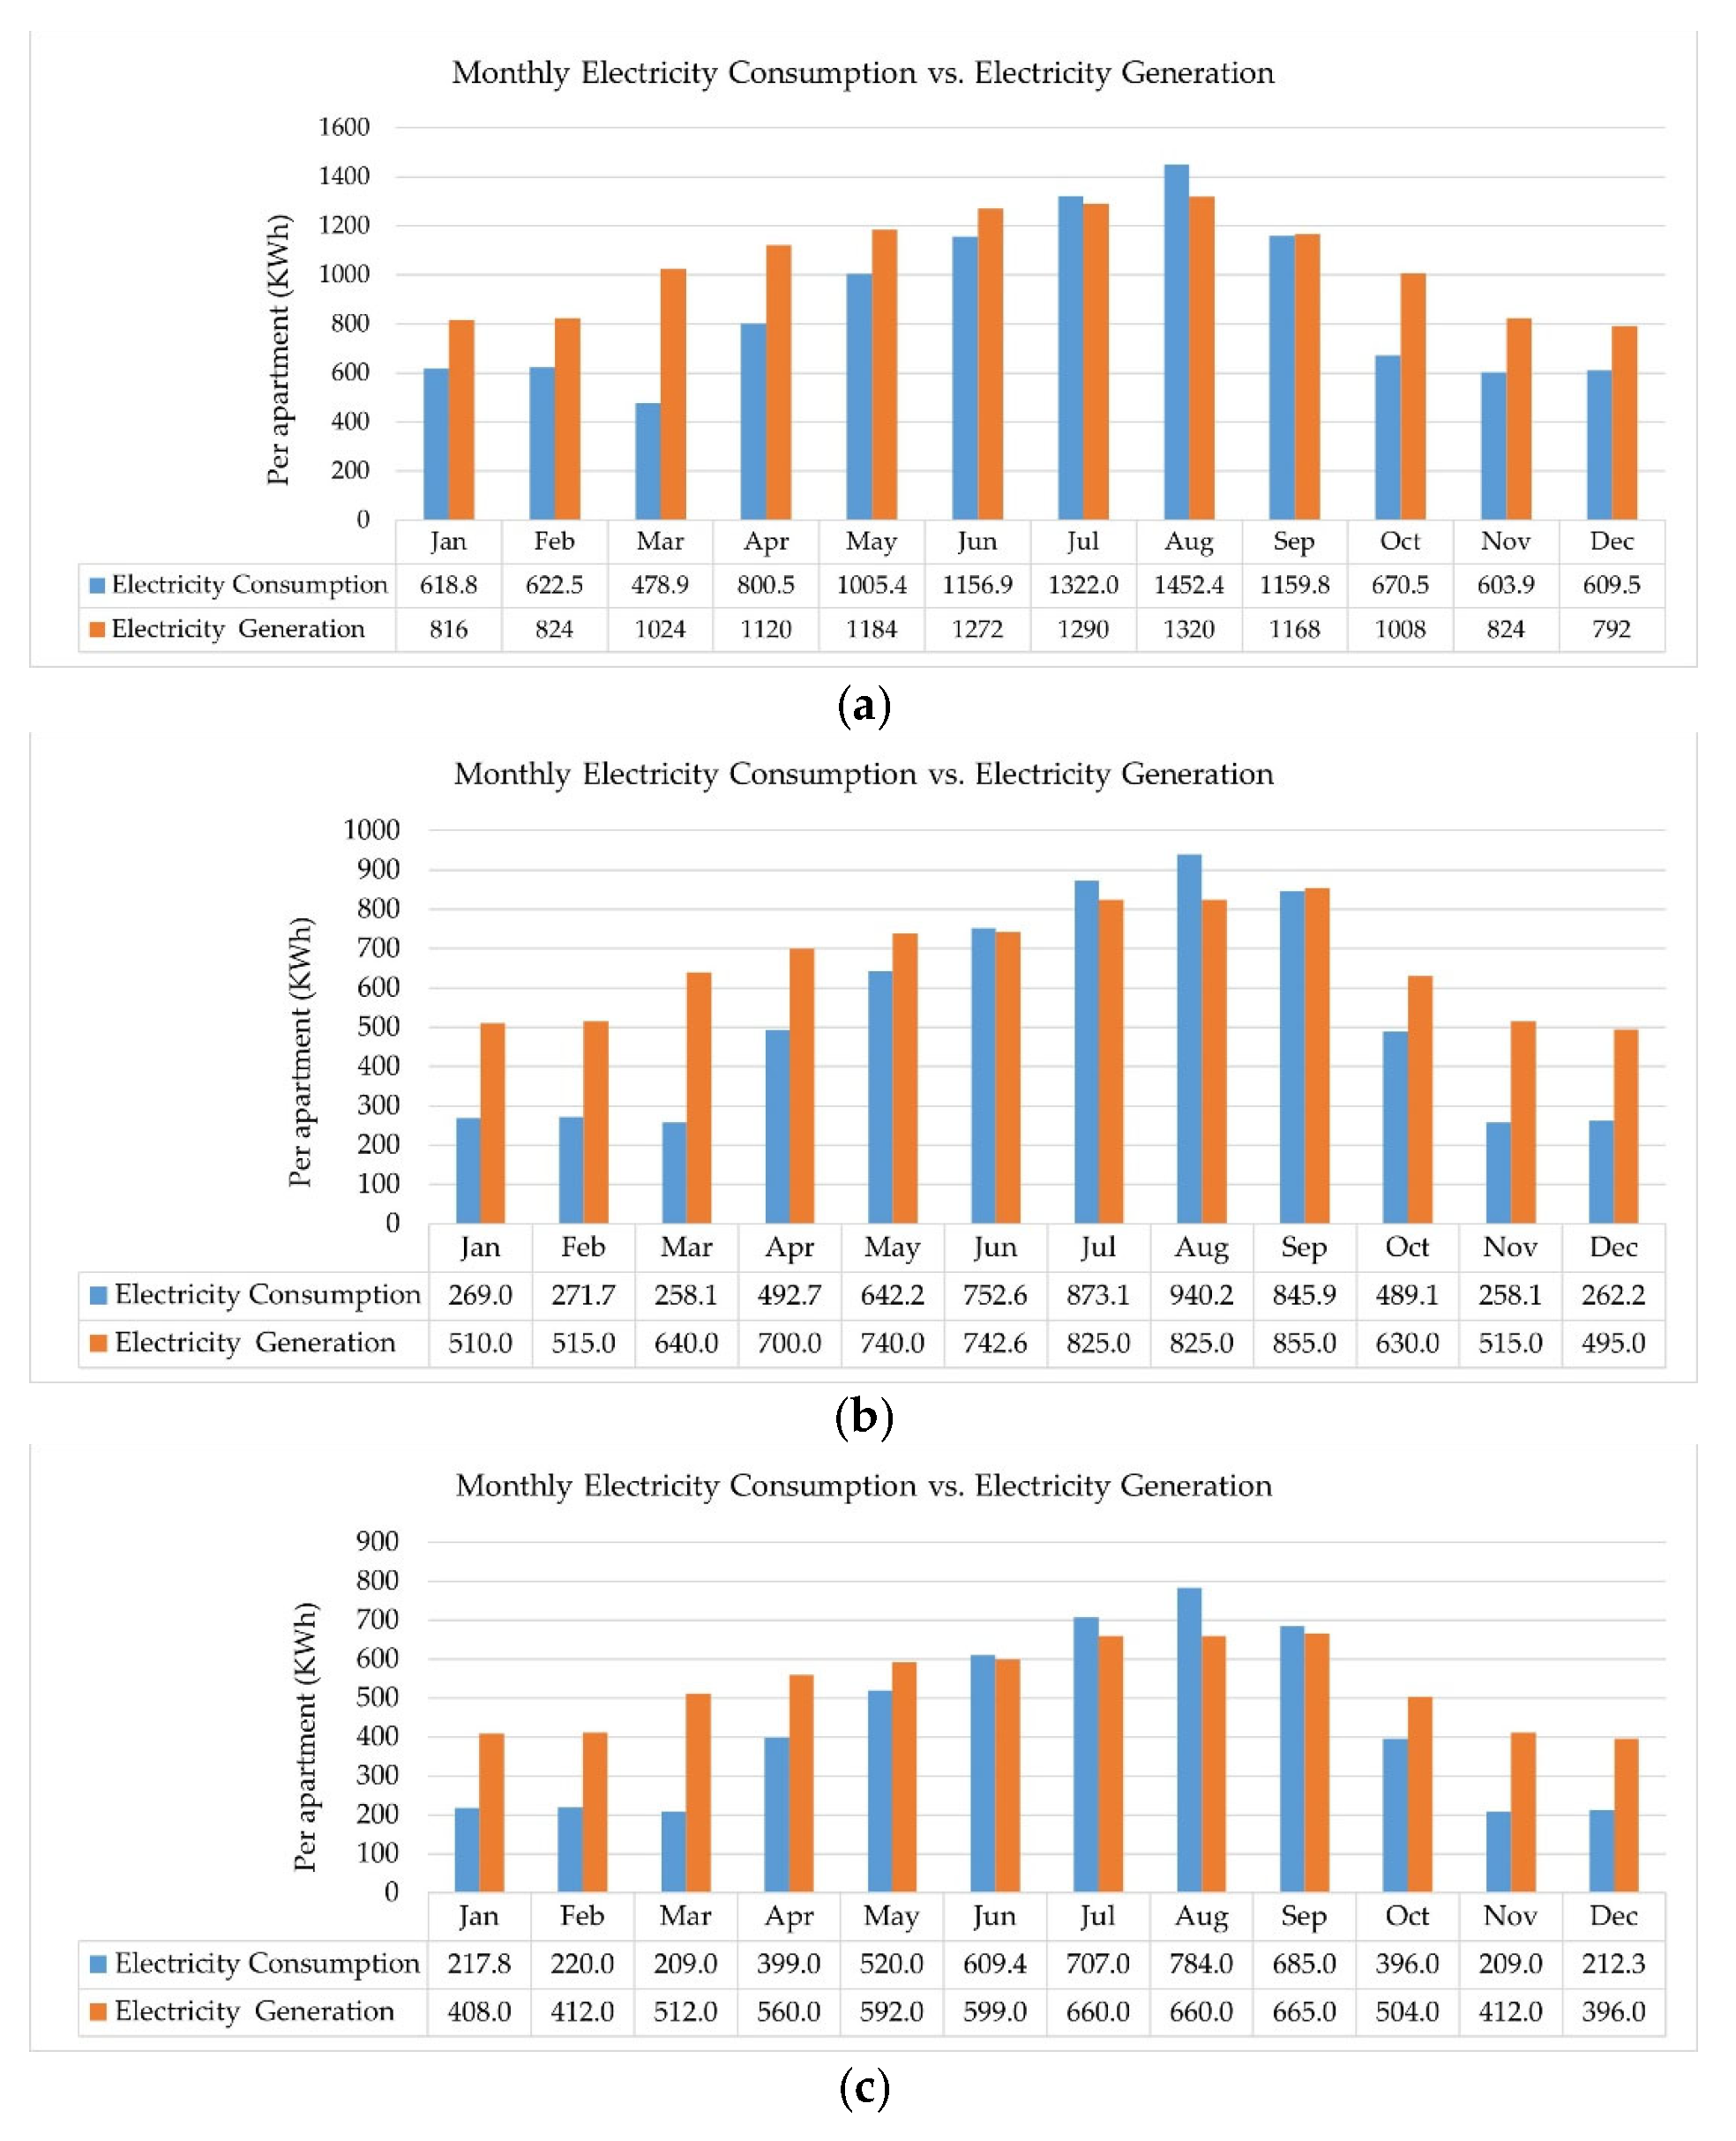
3.6. Effect of Building Integrated Photovoltaic (BIPV)
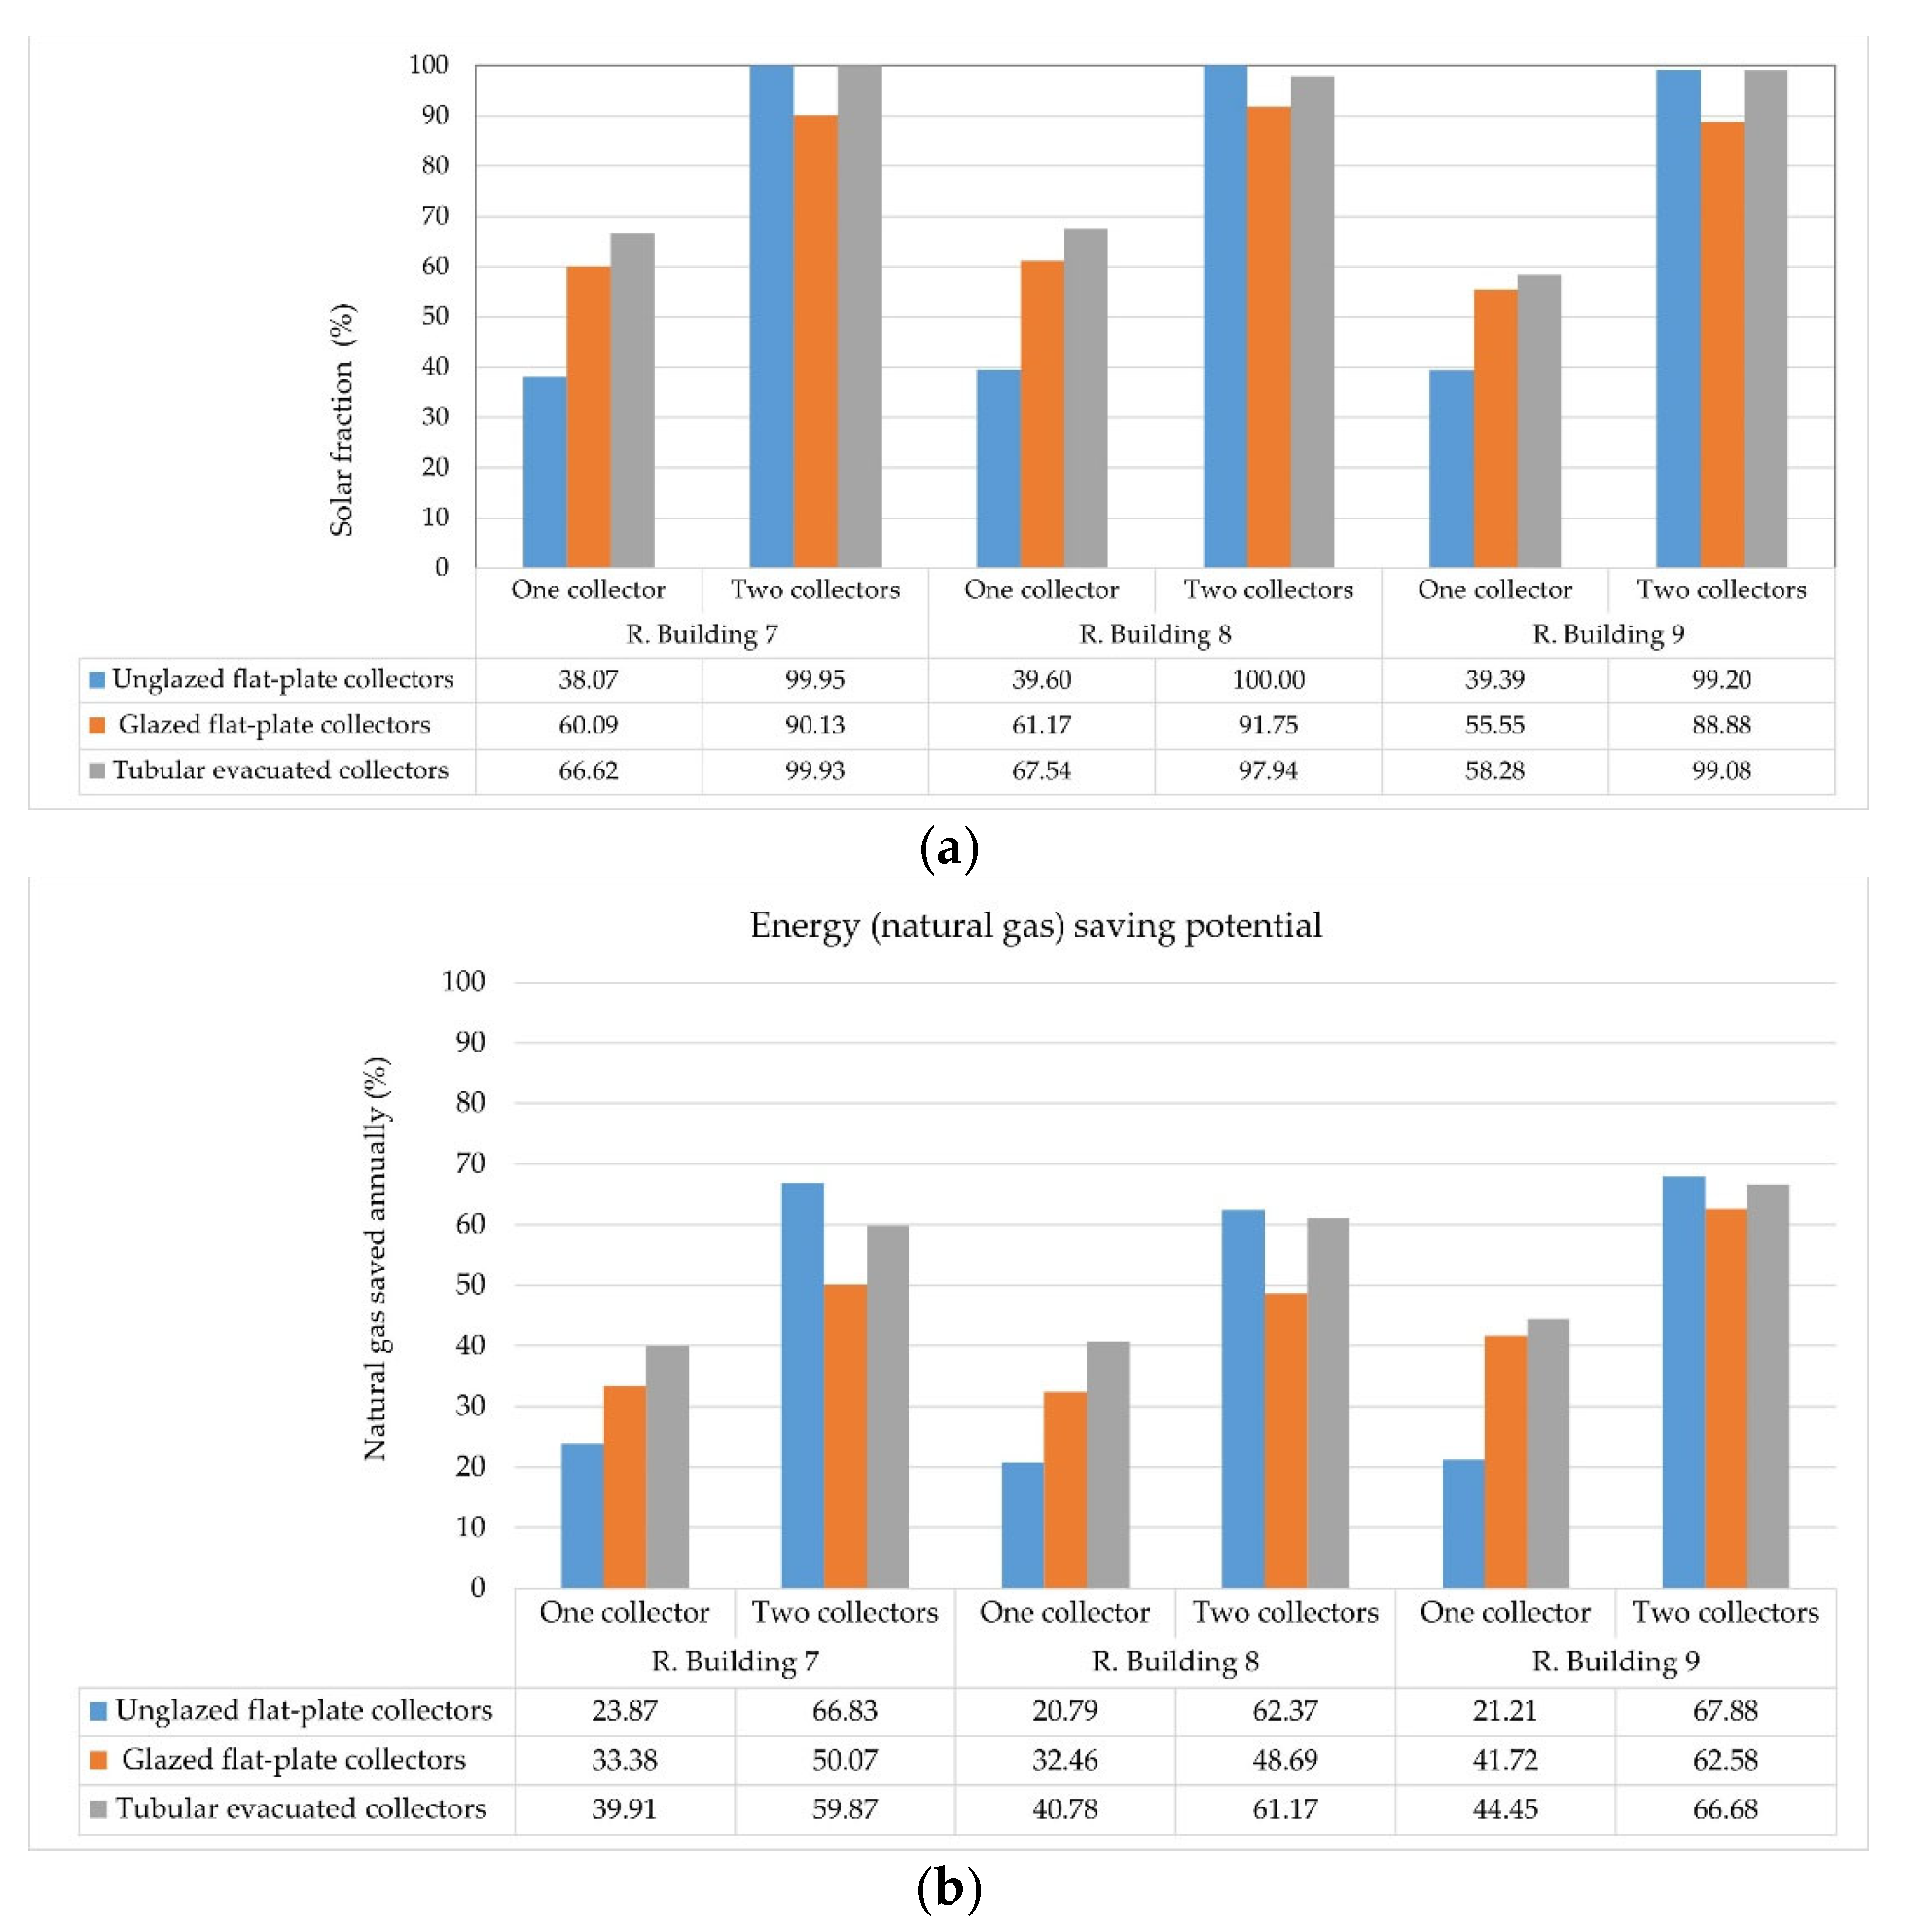
3.7. Effect of Building Integrated Solar Thermal (BIST)
3.8. Evaluation of the “Nearly-ZEB Case”
4. Discussion
4.1. Main Findings and Recommendations
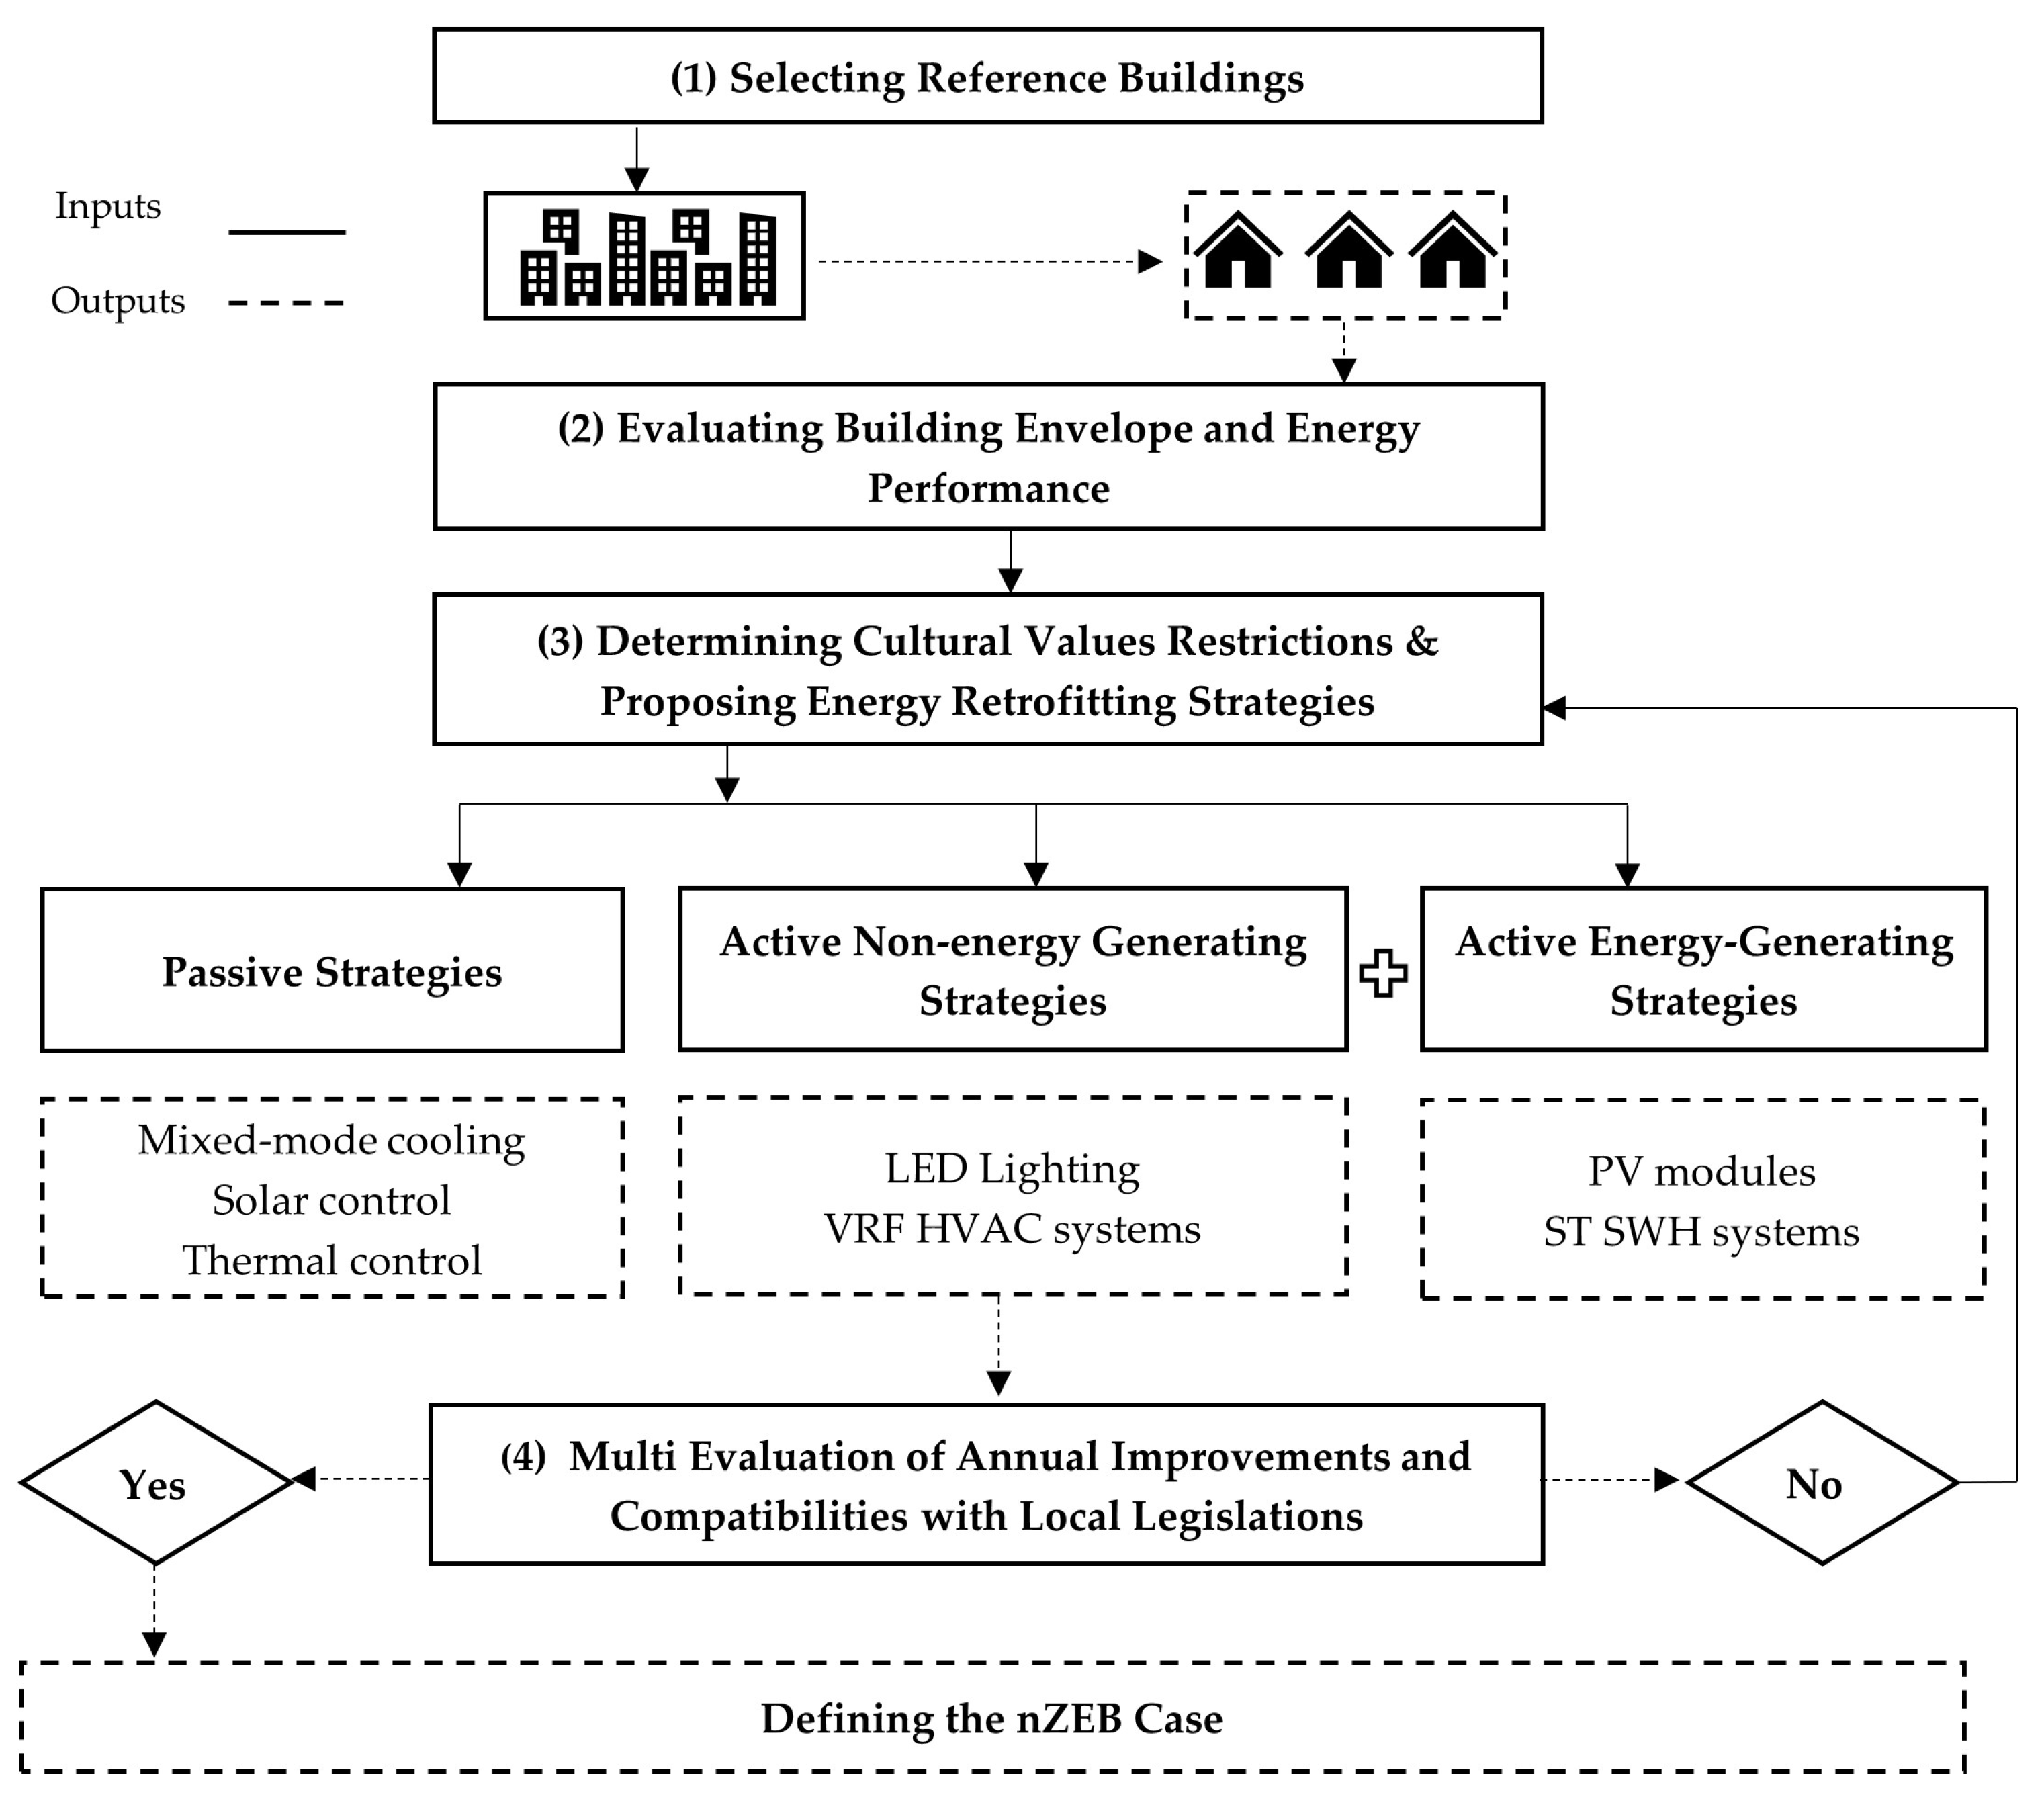
- Phase one selects real reference buildings representing the most dominant residential building types in the case study area, Khedivial Cairo. Indoor air temperatures inside the selected buildings were monitored, and three energy models were created, simulated, and manually calibrated.
- Phase two evaluates the building envelope and energy performance of the three models, as base cases. The detailed evaluation process is as follows:
- Base case evaluation
- 3.
- Phase three determines cultural value restrictions of the heritage grade of the selected buildings and proposes appropriate retrofitting scenarios. We found that all selected buildings have the same heritage grade, “Grade B”, which is the most dominant in the study area. The proposed retrofitting scenarios followed a retrofitting checklist provided by Ibrahim et al. (2021) [24,25]. In the first step, proposed passive retrofitting scenarios were applied. Secondly, proposed active non-generating and generating scenarios were applied separately. Lastly, a combination of passive and active retrofitting scenarios was applied and evaluated as “nearly-ZEB case”. The evaluation process is as follows:
- Step1: Evaluation of passive retrofitting scenarios
- Step2: Evaluation of active (non-energy generating) retrofitting scenarios
- Step 3: Evaluation of a combination of passive and active retrofitting scenarios
- Step 4: Evaluation of active (energy-generating) retrofitting scenarios
- 4.
- Phase four evaluates all the above-proposed scenarios to define the “nearly-ZEB case” and its compatibility with local legislation, and to apply it to 133 heritage residential buildings in the study area. The proposed nearly-ZEB case includes passive, active, non-energy-generating, and energy-generating scenarios. This case has the most effective retrofitting solutions in terms of three performance targets: indoor thermal comfort, achieving nearly-zero energy use, and compatibility with cultural values.
- Selecting reference buildings that represent the most dominant building typologies on the urban level of a study area is considered a tool of flexibility and strength that could provide preliminary advice on energy performance and sustainable scenarios for retrofitting.
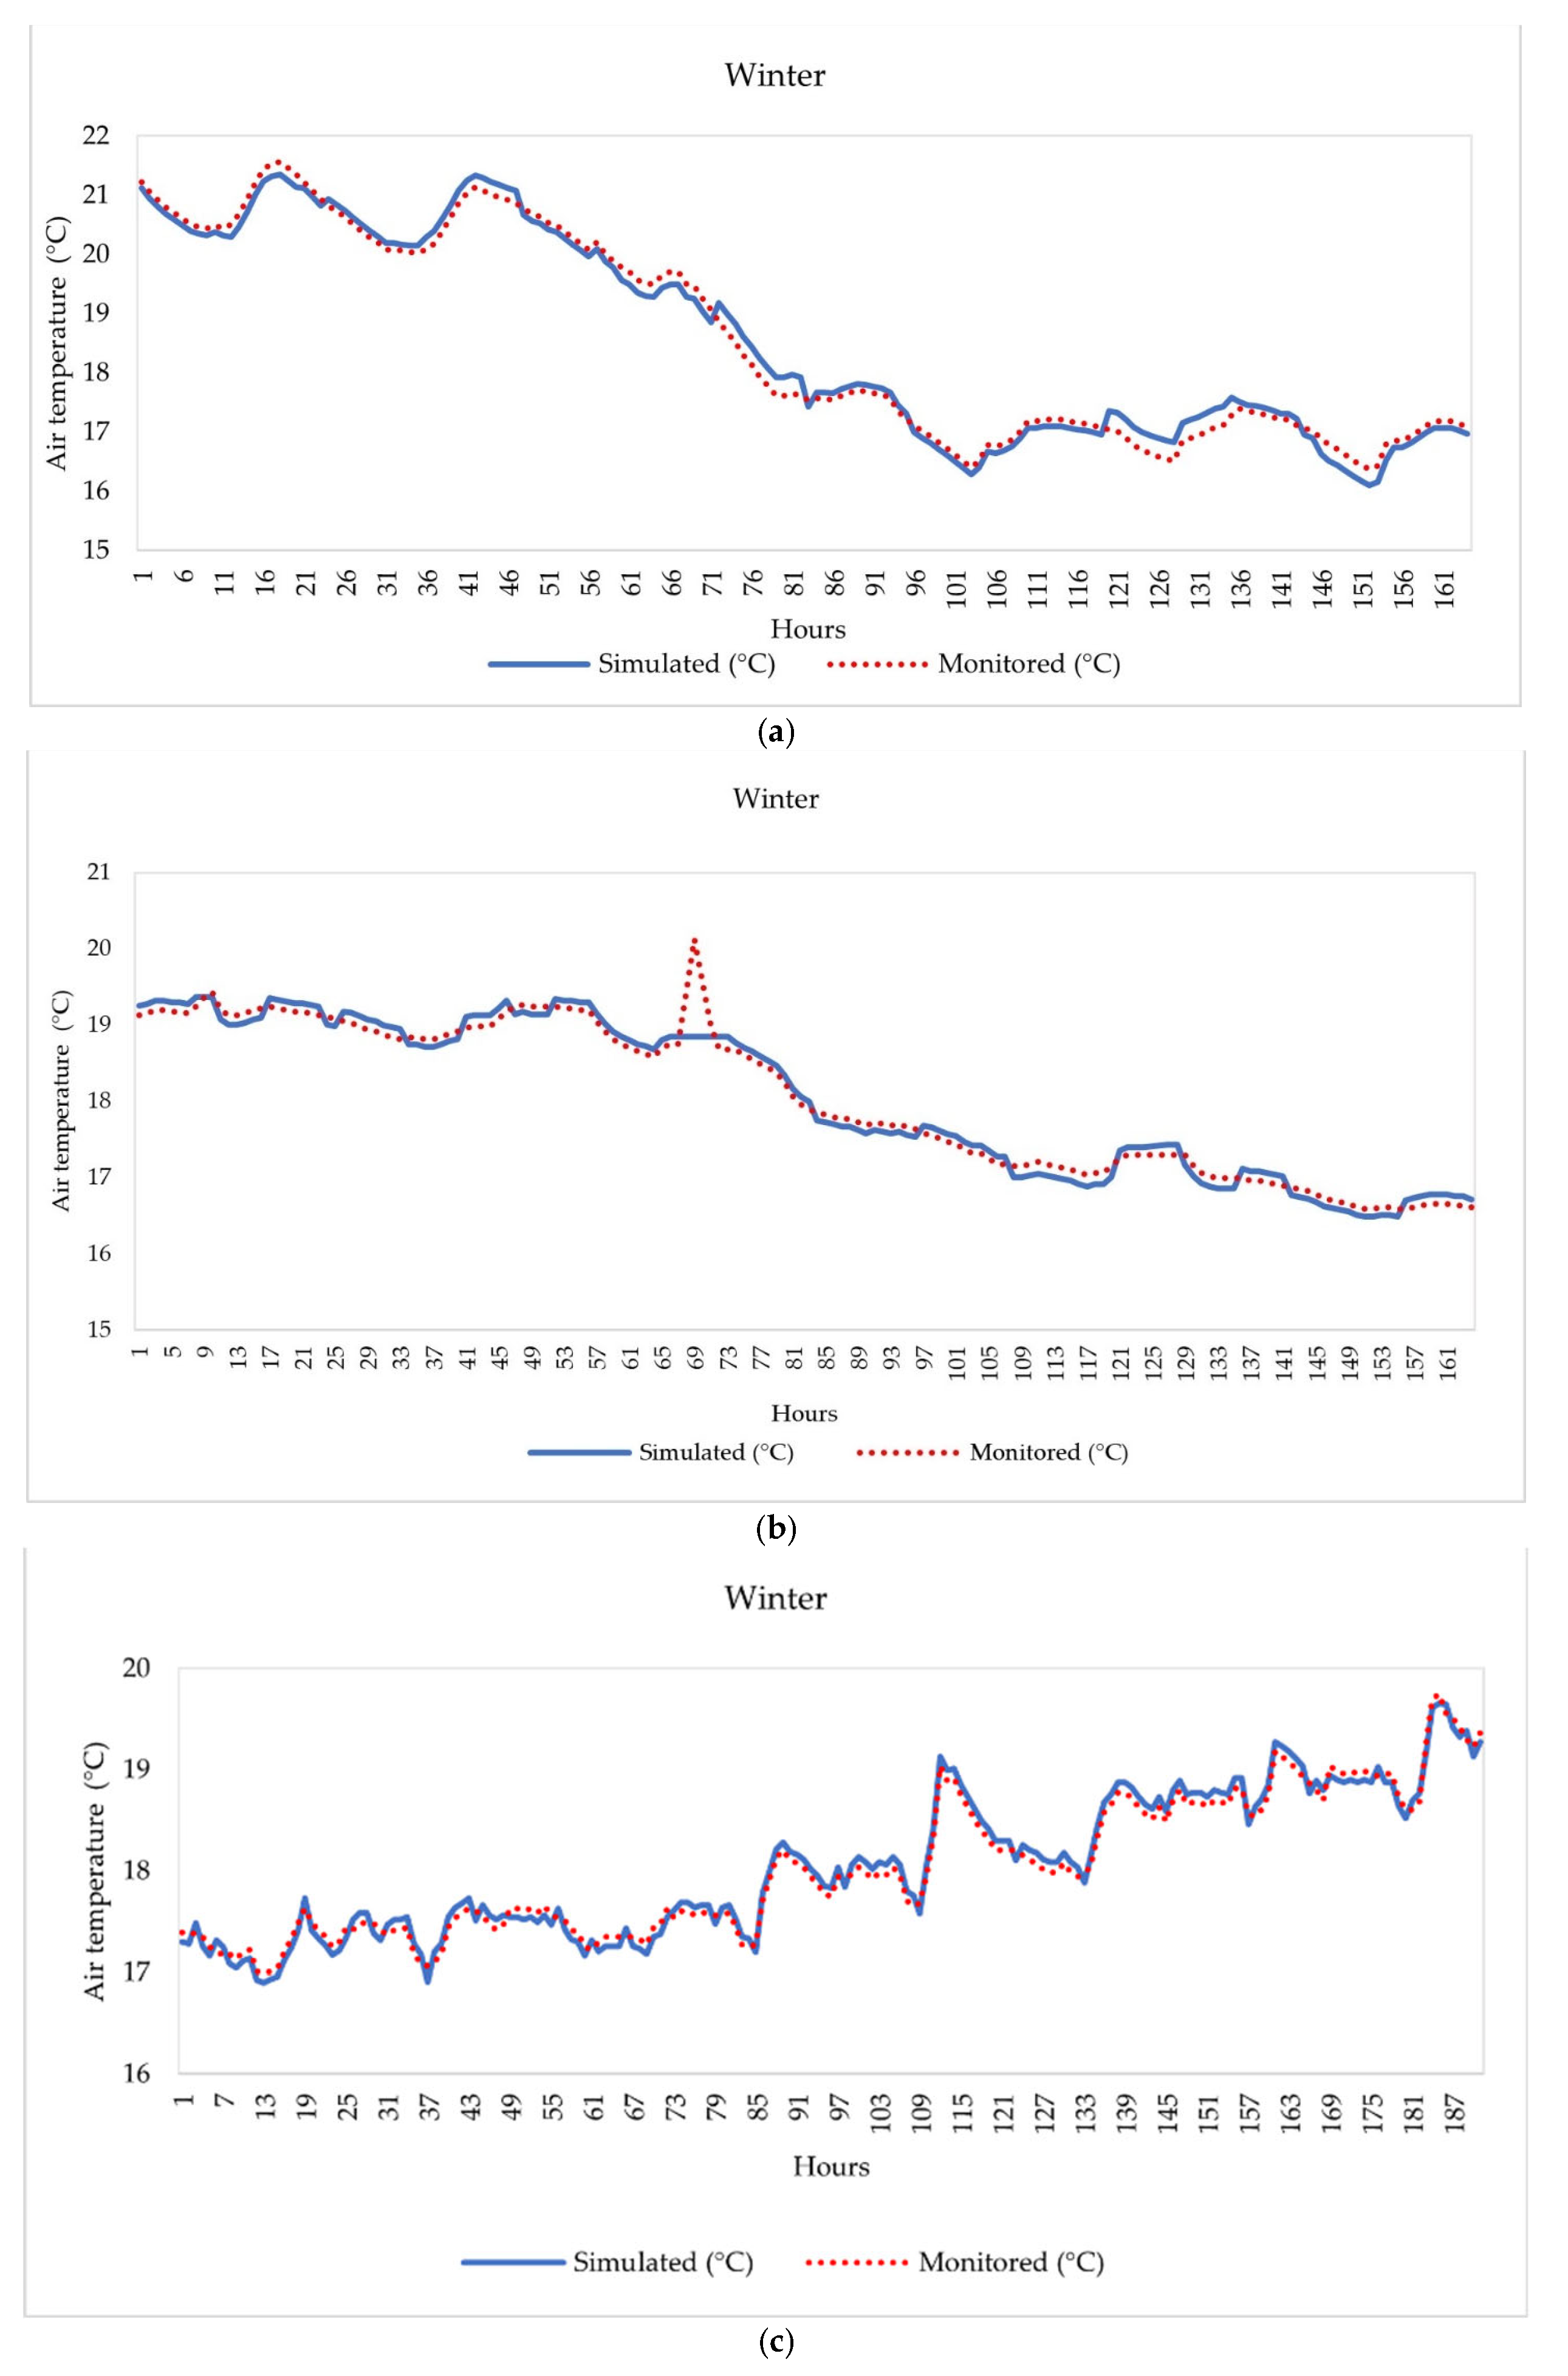
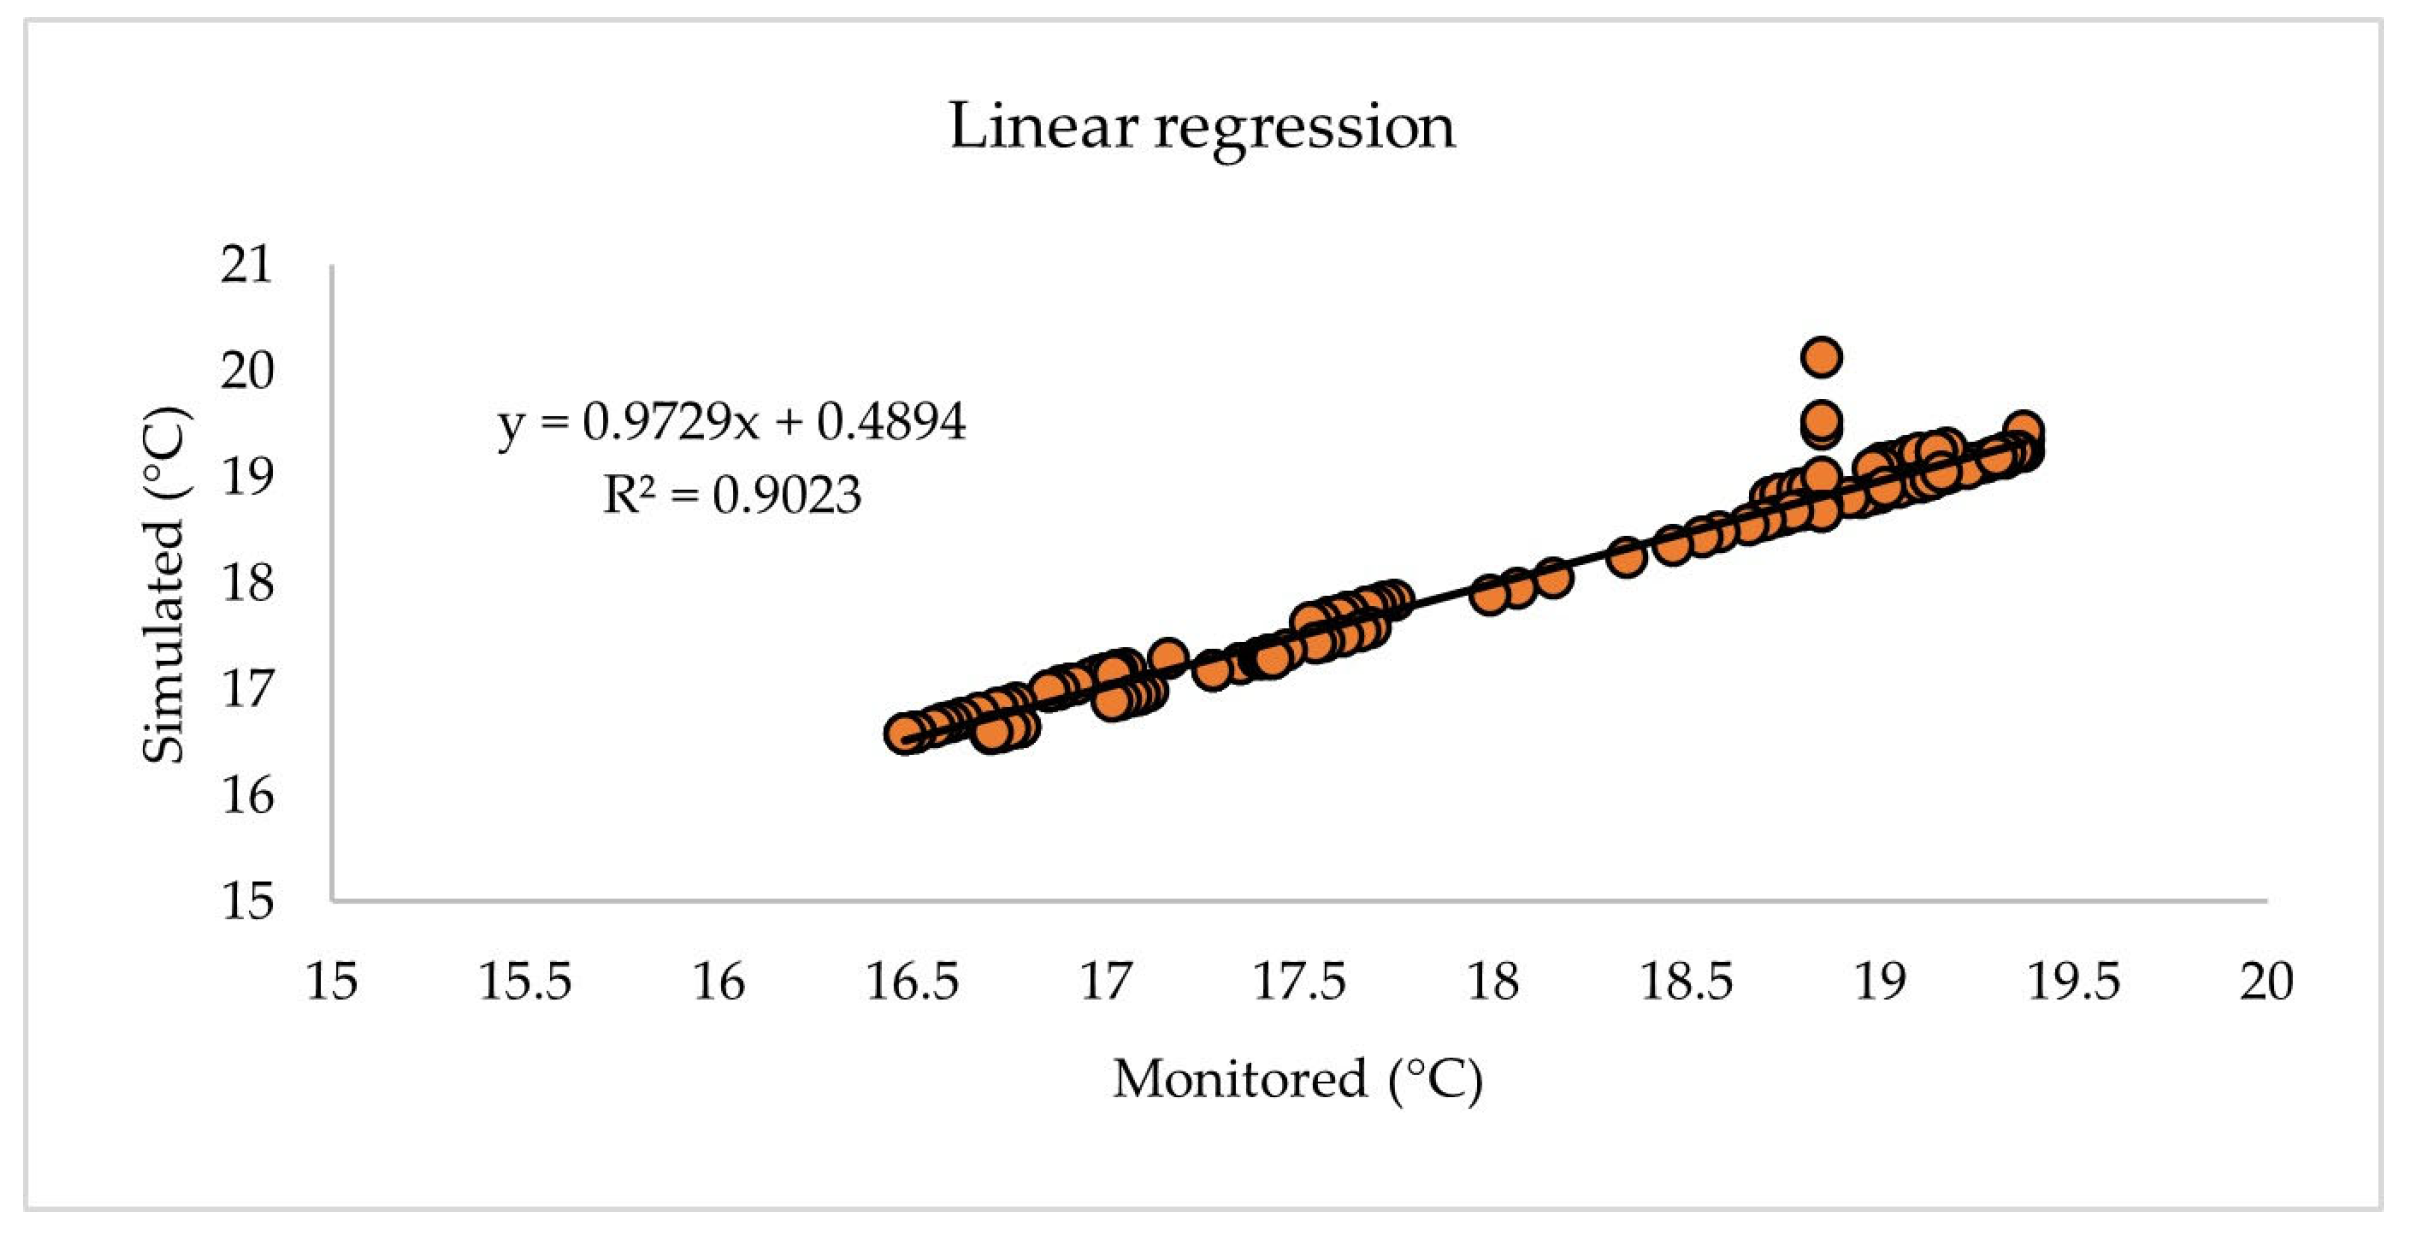
- Operative temperature (OT) should be considered in thermal comfort and energy use calculations. As mentioned previously in Section 2.3, air temperature measurements were used to carry out the manual calibration. It should be noted that there was a peak point that occurred in the measured air temperature in reference building 9, because the number of occupants unusually increased for two hours during night-time; see Figure 5b. However, this unexpected change had no noteworthy effect on overall calculations of calibration and energy.
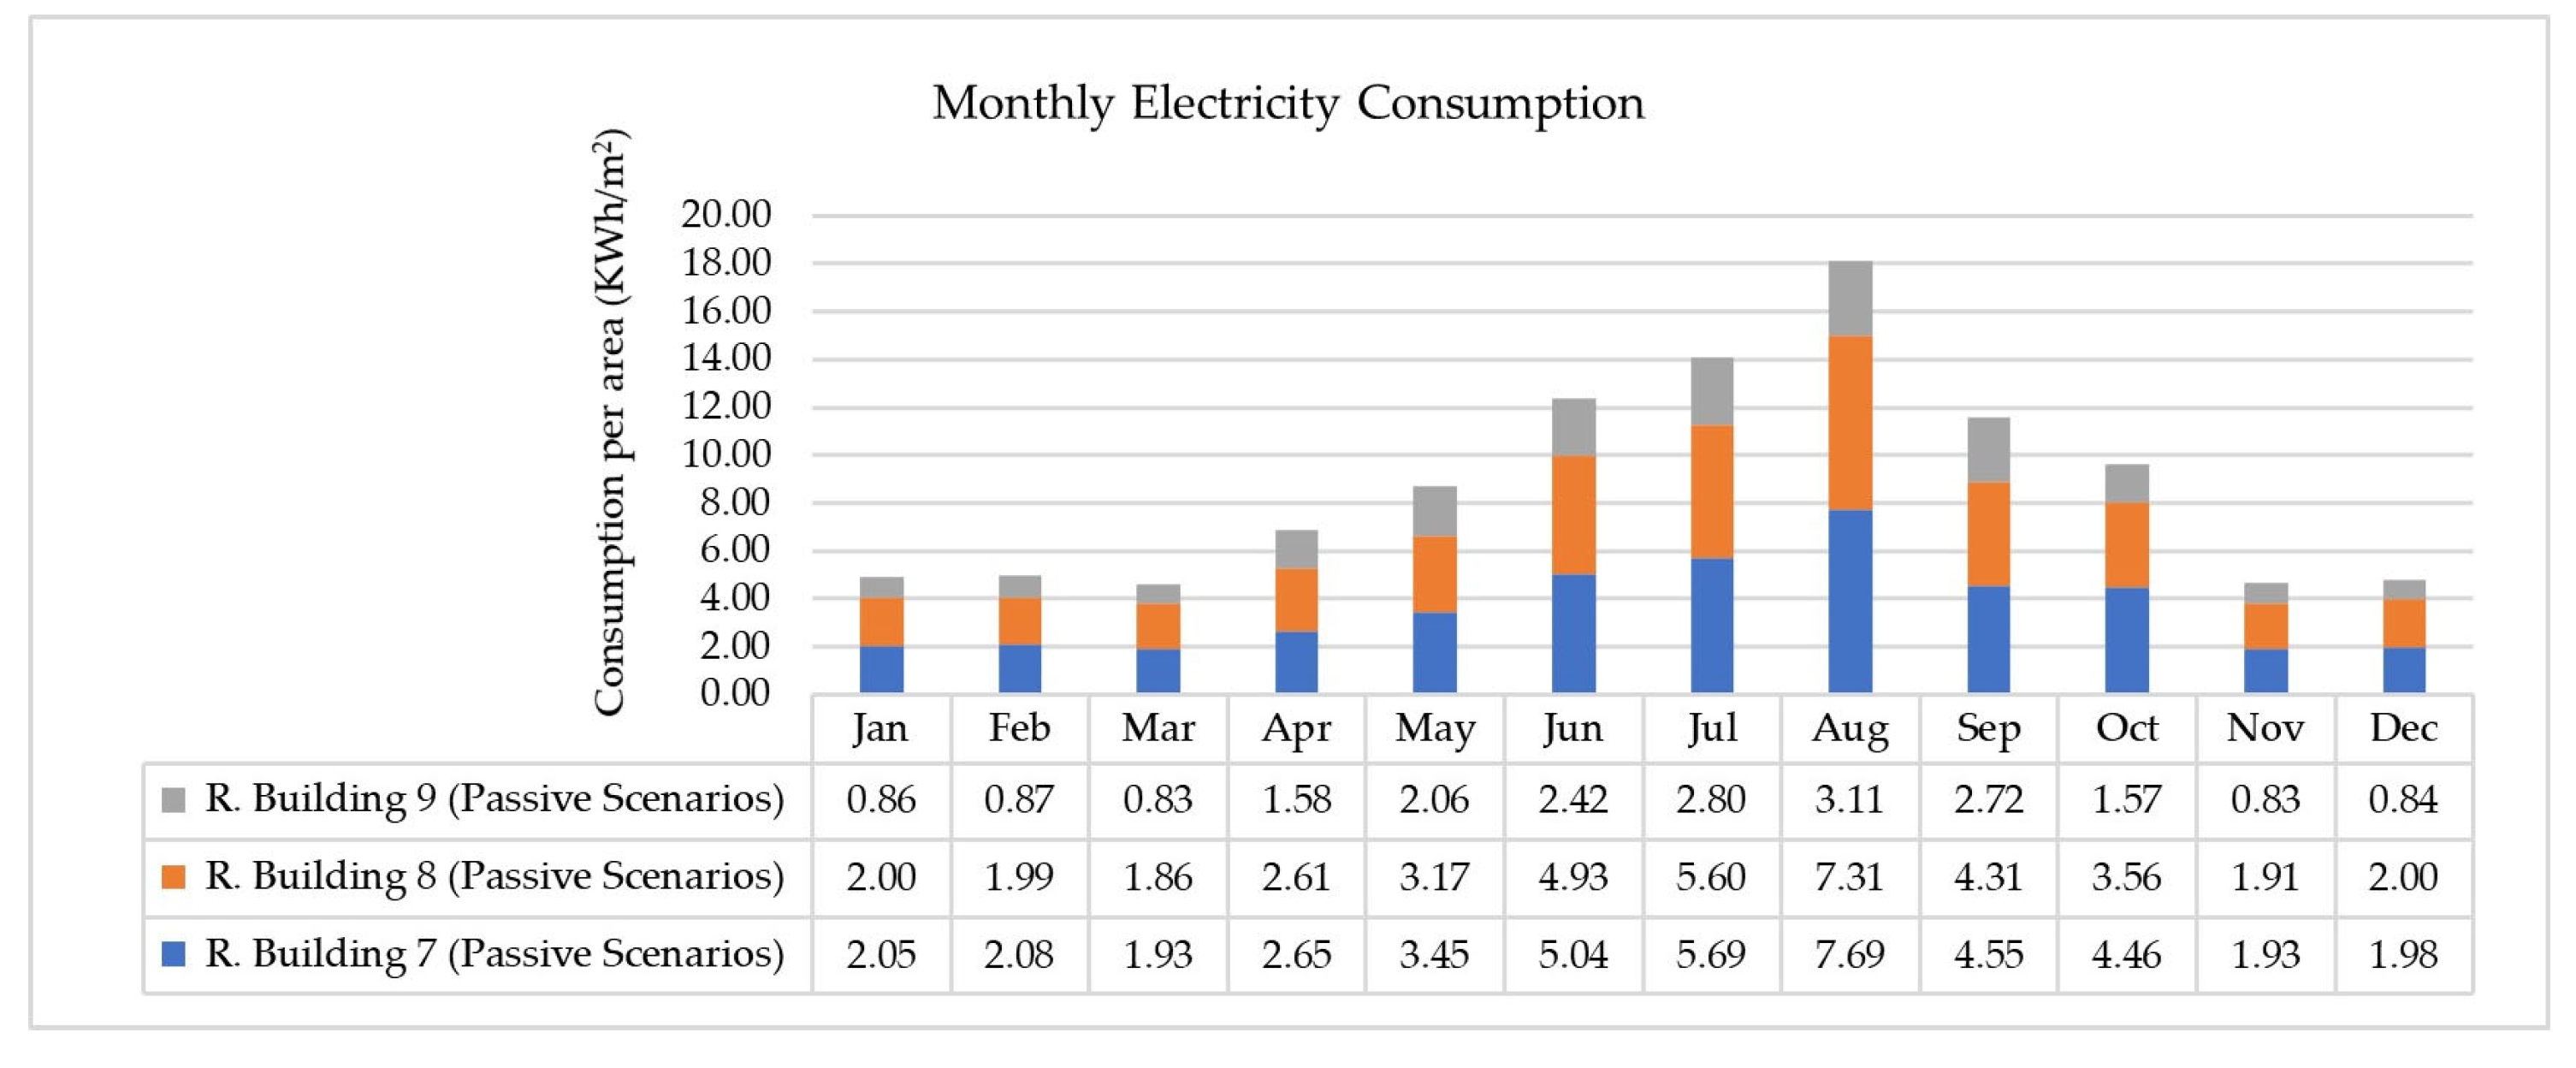
- Application of a set of passive energy-efficient scenarios provides maximum primary energy saving, taking into consideration that different building typologies with similar energy retrofitting interventions have a different impact on energy savings under the same climate conditions. It should be noted that both building size and location could affect the energy retrofitting strategies applied. However, in our present work, they had no noteworthy effect, because all reference buildings have approximately similar sizes and locations.
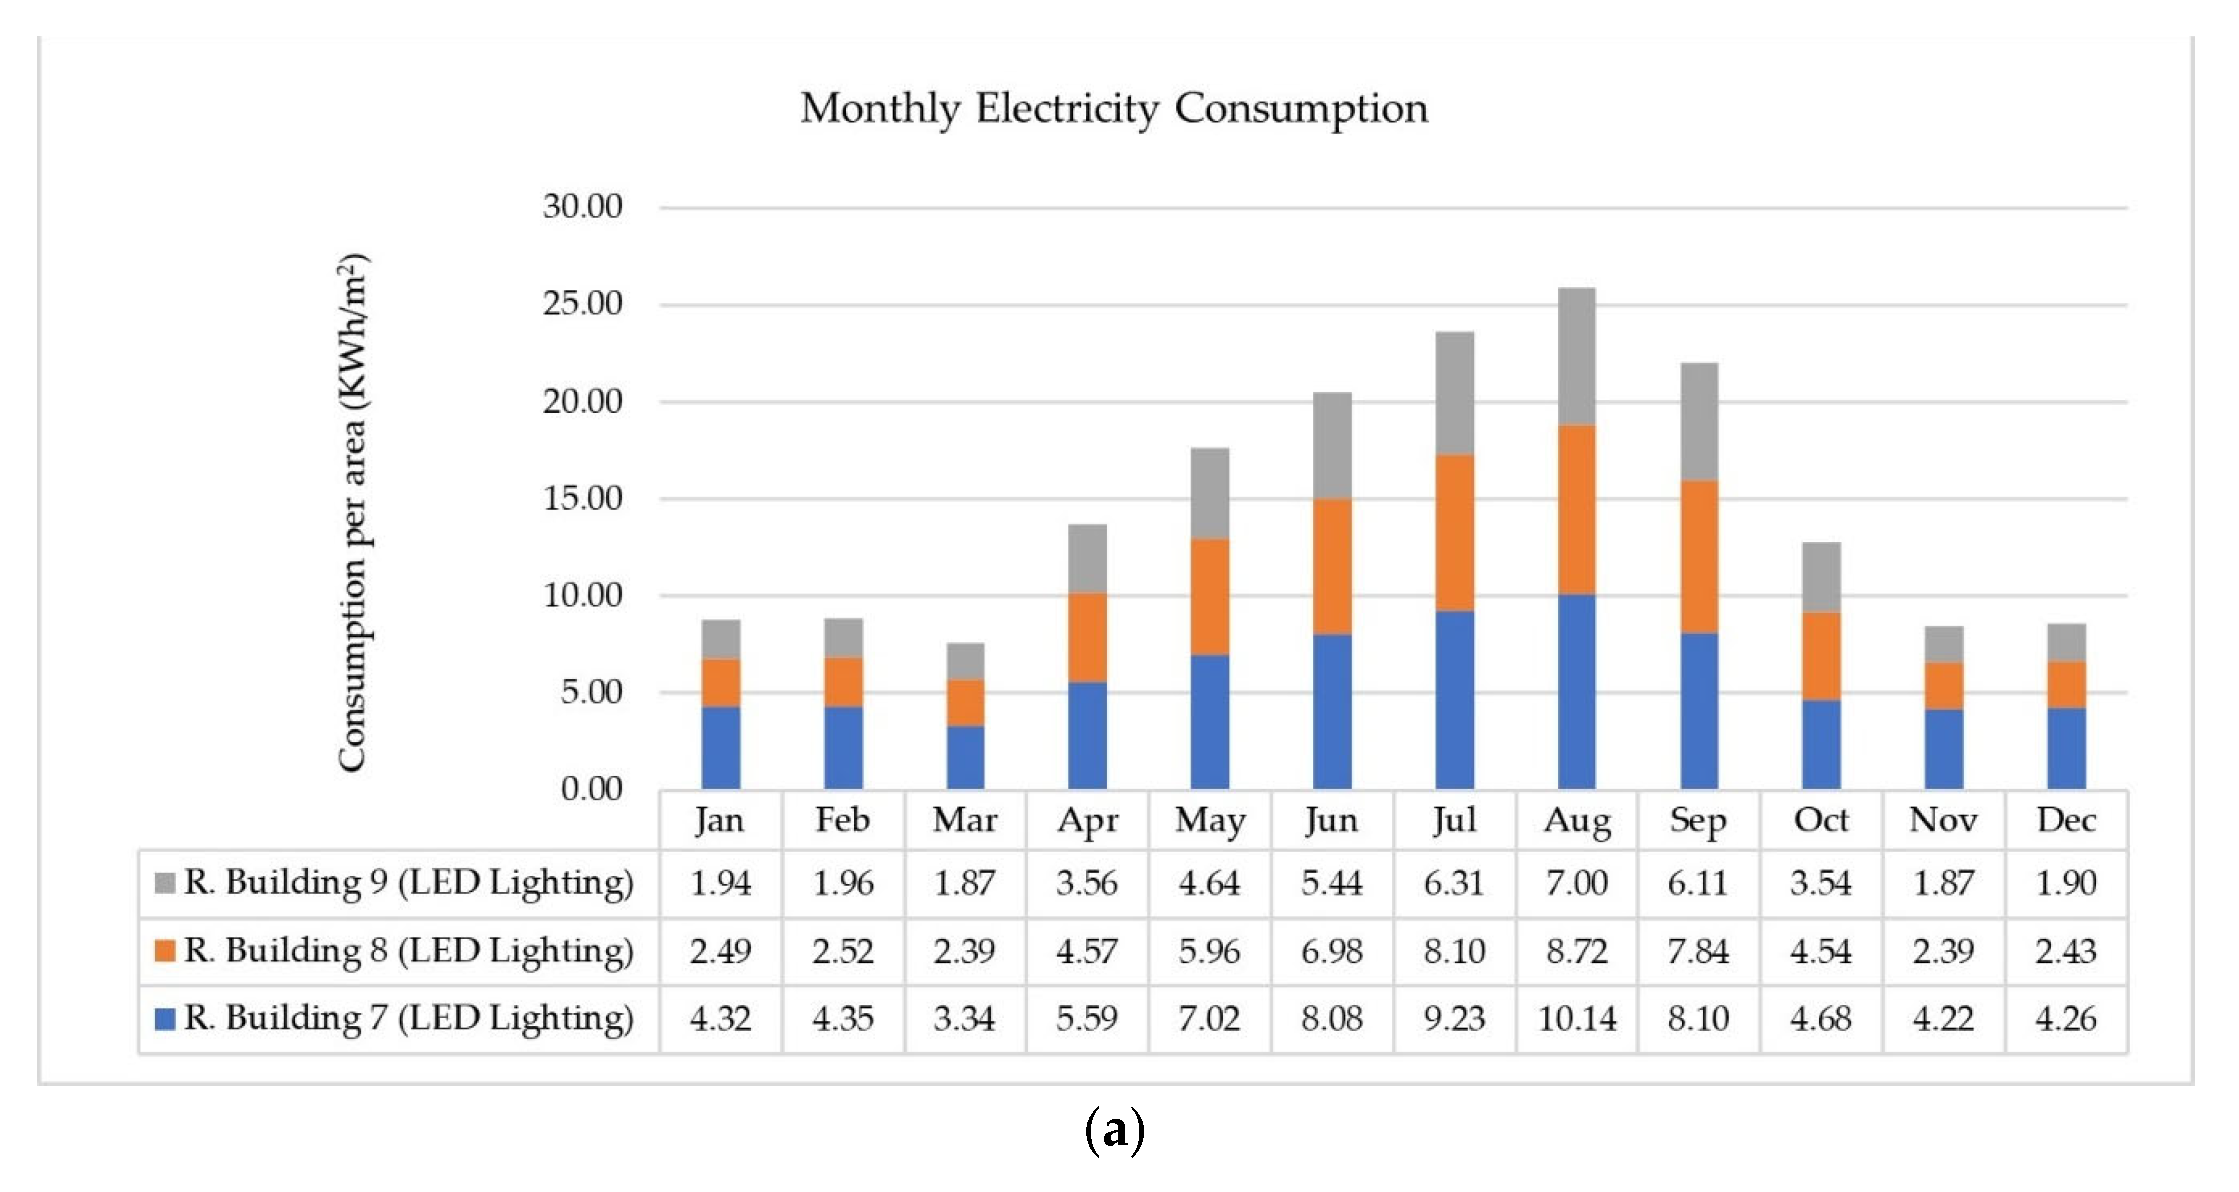
- Replacing conventional lighting lamps with LED lighting would achieve optimal lighting energy efficiency, especially in developing countries with hot climates.
- Replacing air conditioning units (AC) with VRF HVAC systems in apartment buildings would be an effective solution to achieve nearly-zero energy buildings. However, energy savings with this system could occur at moderate temperature conditions (not exceeding 35 °C), whereas at high temperature conditions, VRF could consume more energy compared to the other HVAC systems [93]. Moreover, feasibility and financial studies of replacing air conditioning units (AC) with VRF HVAC systems should be considered.
- The application of PV in residential building stock should have a dual meter—bidirectional meter—if the installation of a solar energy system is connected to the government grid, to calculate the amount of energy produced by the solar panels and the amount of energy consumed. As a result, the residents’ net bills are either positive or negative.
- Feasibility studies are required for the integration of PV in residential buildings. That includes a financial study of PV; for example, the initial cost, payback period, and electricity prices from and to the government grids.
- In hot climates, to maximize the benefits of PV applications on the urban level, investigations should be conducted in terms of determining the exact electricity demand—monthly and daily peak loads—to effectively define the solar electricity generation needed.
- By application of ST using SWHs, the evacuated type of solar collector is considered most efficient if one solar collector is used, but this type is generally more expensive due to the added cost of creating a vacuum [79]. The unglazed type is the cheapest and most efficient if two solar collectors are used. However, it requires a large area to effectively heat the needed amounts of water [79].
- In hot climates, unglazed collectors could be an effective option to provide a large amount of water (below 40 °C) for domestic hot water supplies. Glazed flat-plate collectors are the most widely used and can provide heat for basic domestic hot water use (below 60 °C). On the other hand, evacuated tube collectors can deliver heat at high temperatures (above 80 °C) and is higher in efficiency compared to flat-plate collectors [79,87,88]. Similarly to the application of PV, the application of SHWs requires feasibility and financial studies.
- The proposed “nearly-ZEB case” of the three reference buildings could be used as benchmark energy models in heritage residential building stock of Khedivial Cairo. Furthermore, the proposed methodology would cover the maximum energy needed by using the energy generated by solar energy, and export surplus energy, if applicable, to energy grids. More importantly, this methodology would improve the indoor thermal comfort and be highly compatible with the Egyptian Energy Code requirements and cultural values of the different building heritage grades.
4.2. Strengths and Limitations of the Study
4.3. Study Implications and Future Studies
5. Conclusions
Author Contributions
Funding
Institutional Review Board Statement
Informed Consent Statement
Data Availability Statement
Acknowledgments
Conflicts of Interest
Appendix A. Thermal Properties of Materials Used in the Reference Buildings in Terms of Conductivity, Specific Heat Capacity, and Density

| No. | Building Element | Outside to Inside | Composition | Thickness (m) | Conductivity * (W/m · k) | Specific Heat Capacity * (J/kg · k) | Density * (kg/m3) |
|---|---|---|---|---|---|---|---|
| t | λ | cp | D | ||||
| 1 | Exterior wall | Layer 1 | Limestone, soft | 0.02 | 0.93 | 900 | 1650 |
| Layer 2 | Cement mortar | 0.02 | 0.9 | 896 | 1570 | ||
| Layer 3 | Burnt-brick | 0.25 | 0.85 | 480 | 1500 | ||
| Layer 4 | Cement plaster | 0.02 | 0.72 | 840 | 1760 | ||
| 2 | Internal wall | Layer 1 | Cement plaster | 0.02 | 0.72 | 840 | 1760 |
| Layer 2 | Burnt-brick | 0.12 | 0.85 | 480 | 1500 | ||
| Layer 3 | Cement plaster | 0.02 | 0.72 | 840 | 1760 | ||
| 3 | Internal floor | Layer 1 | Mosaico tiles | 0.02 | 1.6 | 840 | 2450 |
| Layer 2 | Cement mortar | 0.02 | 0.9 | 896 | 1570 | ||
| Layer 3 | Sand | 0.06 | 0.33 | 800 | 1520 | ||
| Layer 4 | Reinforced concrete slab | 0.15 | 1.9 | 840 | 2300 | ||
| Layer 5 | Cement plaster | 0.02 | 0.72 | 840 | 1760 | ||
| 4 | Ground floor | Layer 1 | Mosaico tiles | 0.02 | 1.6 | 840 | 2450 |
| Layer 2 | Cement mortar | 0.02 | 0.9 | 896 | 1570 | ||
| Layer 3 | Sand | 0.06 | 0.33 | 800 | 1520 | ||
| Layer 4 | Concrete, cast, no fines | 0.3 | 1.44 | 840 | 2460 | ||
| 5 | Roof | Layer 1 | Roofing tiles | 0.02 | 1.5 | 1000 | 2100 |
| Layer 2 | Cement mortar | 0.02 | 0.9 | 896 | 1570 | ||
| Layer 3 | Sand | 0.06 | 0.33 | 800 | 1520 | ||
| Layer 4 | Reinforced concrete slab | 0.15 | 1.9 | 840 | 2300 | ||
| Layer 5 | Cement plaster | 0.02 | 0.72 | 840 | 1760 |
| No. | Building Element | Outside to Inside | Composition | Thickness (m) | Conductivity * (W/m · k) | Specific Heat Capacity * (J/kg · k) | Density * (kg/m3) |
|---|---|---|---|---|---|---|---|
| t | λ | cp | D | ||||
| 1 | Exterior wall | Layer 1 | Limestone hard | 0.05 | 0.7 | 1000 | 2200 |
| Layer 2 | Cement mortar | 0.02 | 0.9 | 896 | 1570 | ||
| Layer 3 | Brick | 0.5 | 0.85 | 480 | 1500 | ||
| Layer 4 | Cement plaster | 0.02 | 0.72 | 840 | 1760 | ||
| 2 | Internal wall | Layer 1 | Cement plaster | 0.02 | 0.72 | 840 | 1760 |
| Layer 2 | Brick | 0.5 | 0.85 | 480 | 1500 | ||
| Layer 3 | Cement plaster | 0.02 | 0.72 | 840 | 1760 | ||
| 3 | Internal floor | Layer 1 | Marble | 0.04 | 2.77 | 802 | 2600 |
| Layer 2 | Cement mortar | 0.02 | 0.9 | 896 | 1570 | ||
| Layer 3 | Sand | 0.06 | 0.33 | 800 | 1520 | ||
| Layer 4 | Reinforced concrete slab | 0.15 | 1.9 | 840 | 2300 | ||
| Layer 5 | Cement plaster | 0.02 | 0.72 | 840 | 1760 | ||
| 4 | Ground floor | Layer 1 | Marble | 0.04 | 2.77 | 802 | 2600 |
| Layer 2 | Cement mortar | 0.02 | 0.9 | 896 | 1570 | ||
| Layer 3 | Sand | 0.06 | 0.33 | 800 | 1520 | ||
| Layer 4 | Concrete, cast, no fines | 0.3 | 1.44 | 840 | 2460 | ||
| 5 | Roof | Layer 1 | Roofing tiles | 0.02 | 0.5 | 1000 | 2100 |
| Layer 2 | Cement mortar | 0.02 | 0.9 | 896 | 1570 | ||
| Layer 3 | Sand | 0.06 | 0.33 | 800 | 1520 | ||
| Layer 4 | Concrete, cast, no fines | 0.07 | 1.44 | 840 | 2460 | ||
| Layer 5 | Reinforced concrete slab | 0.15 | 1.9 | 840 | 2300 | ||
| Layer 6 | Cement plaster | 0.02 | 0.72 | 840 | 1760 |
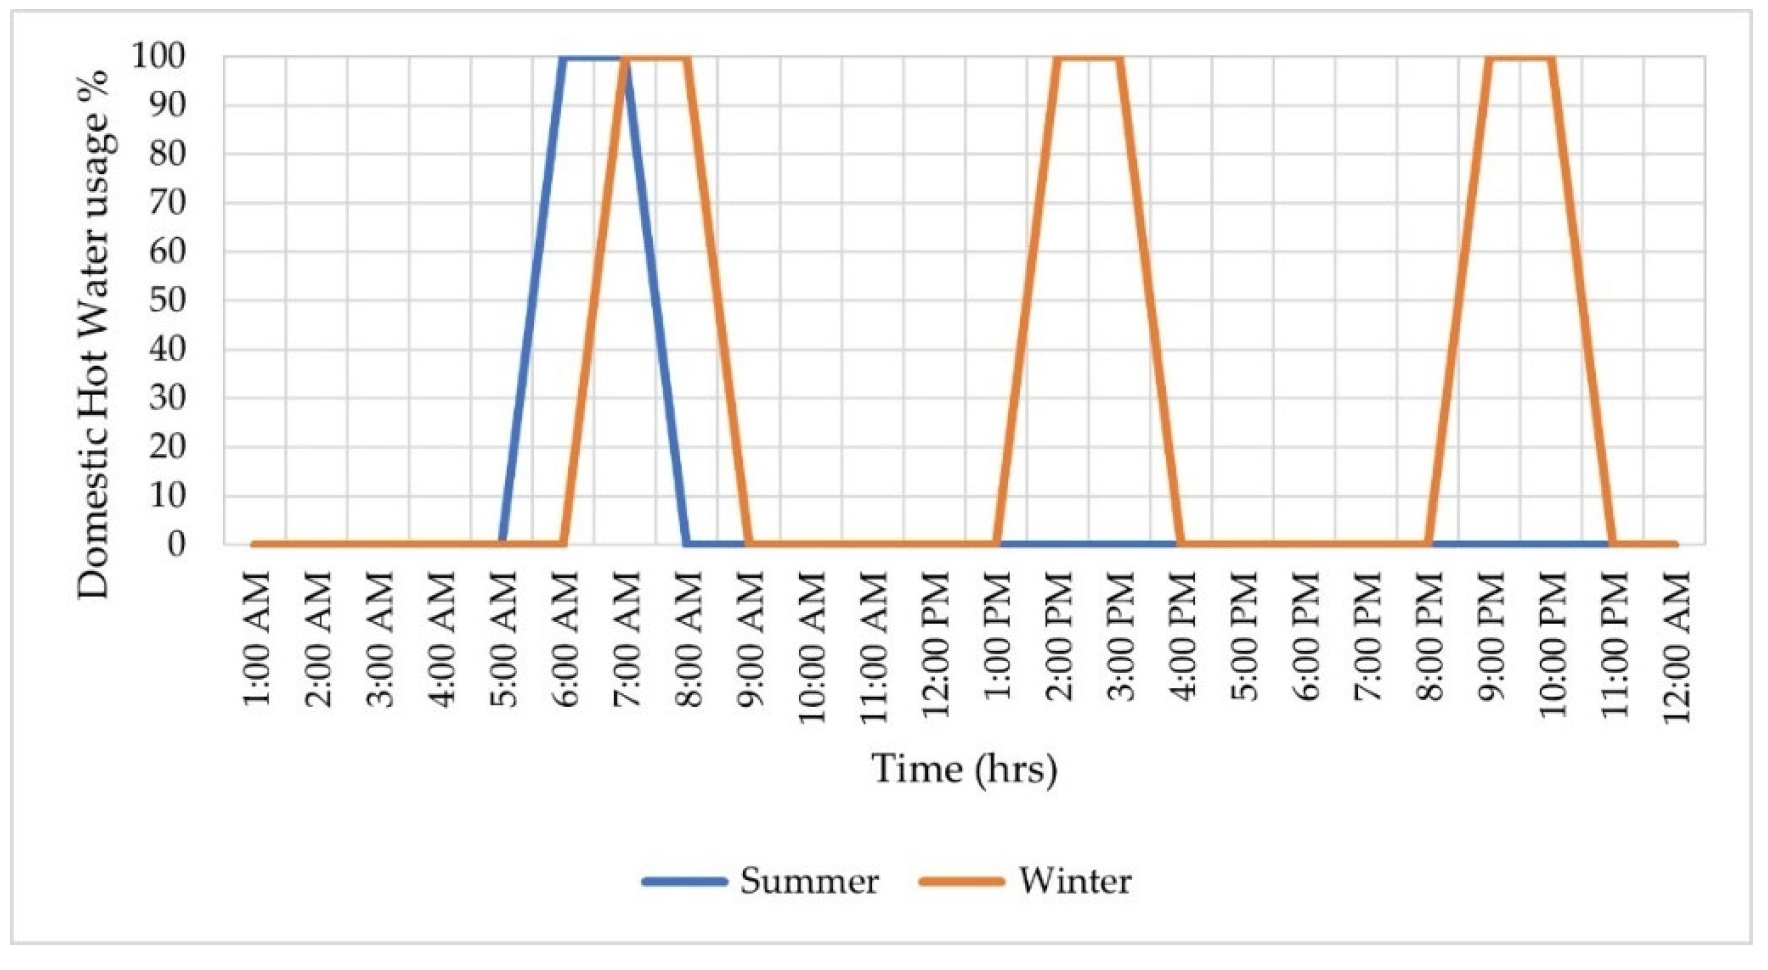
Appendix A.1. Schedules


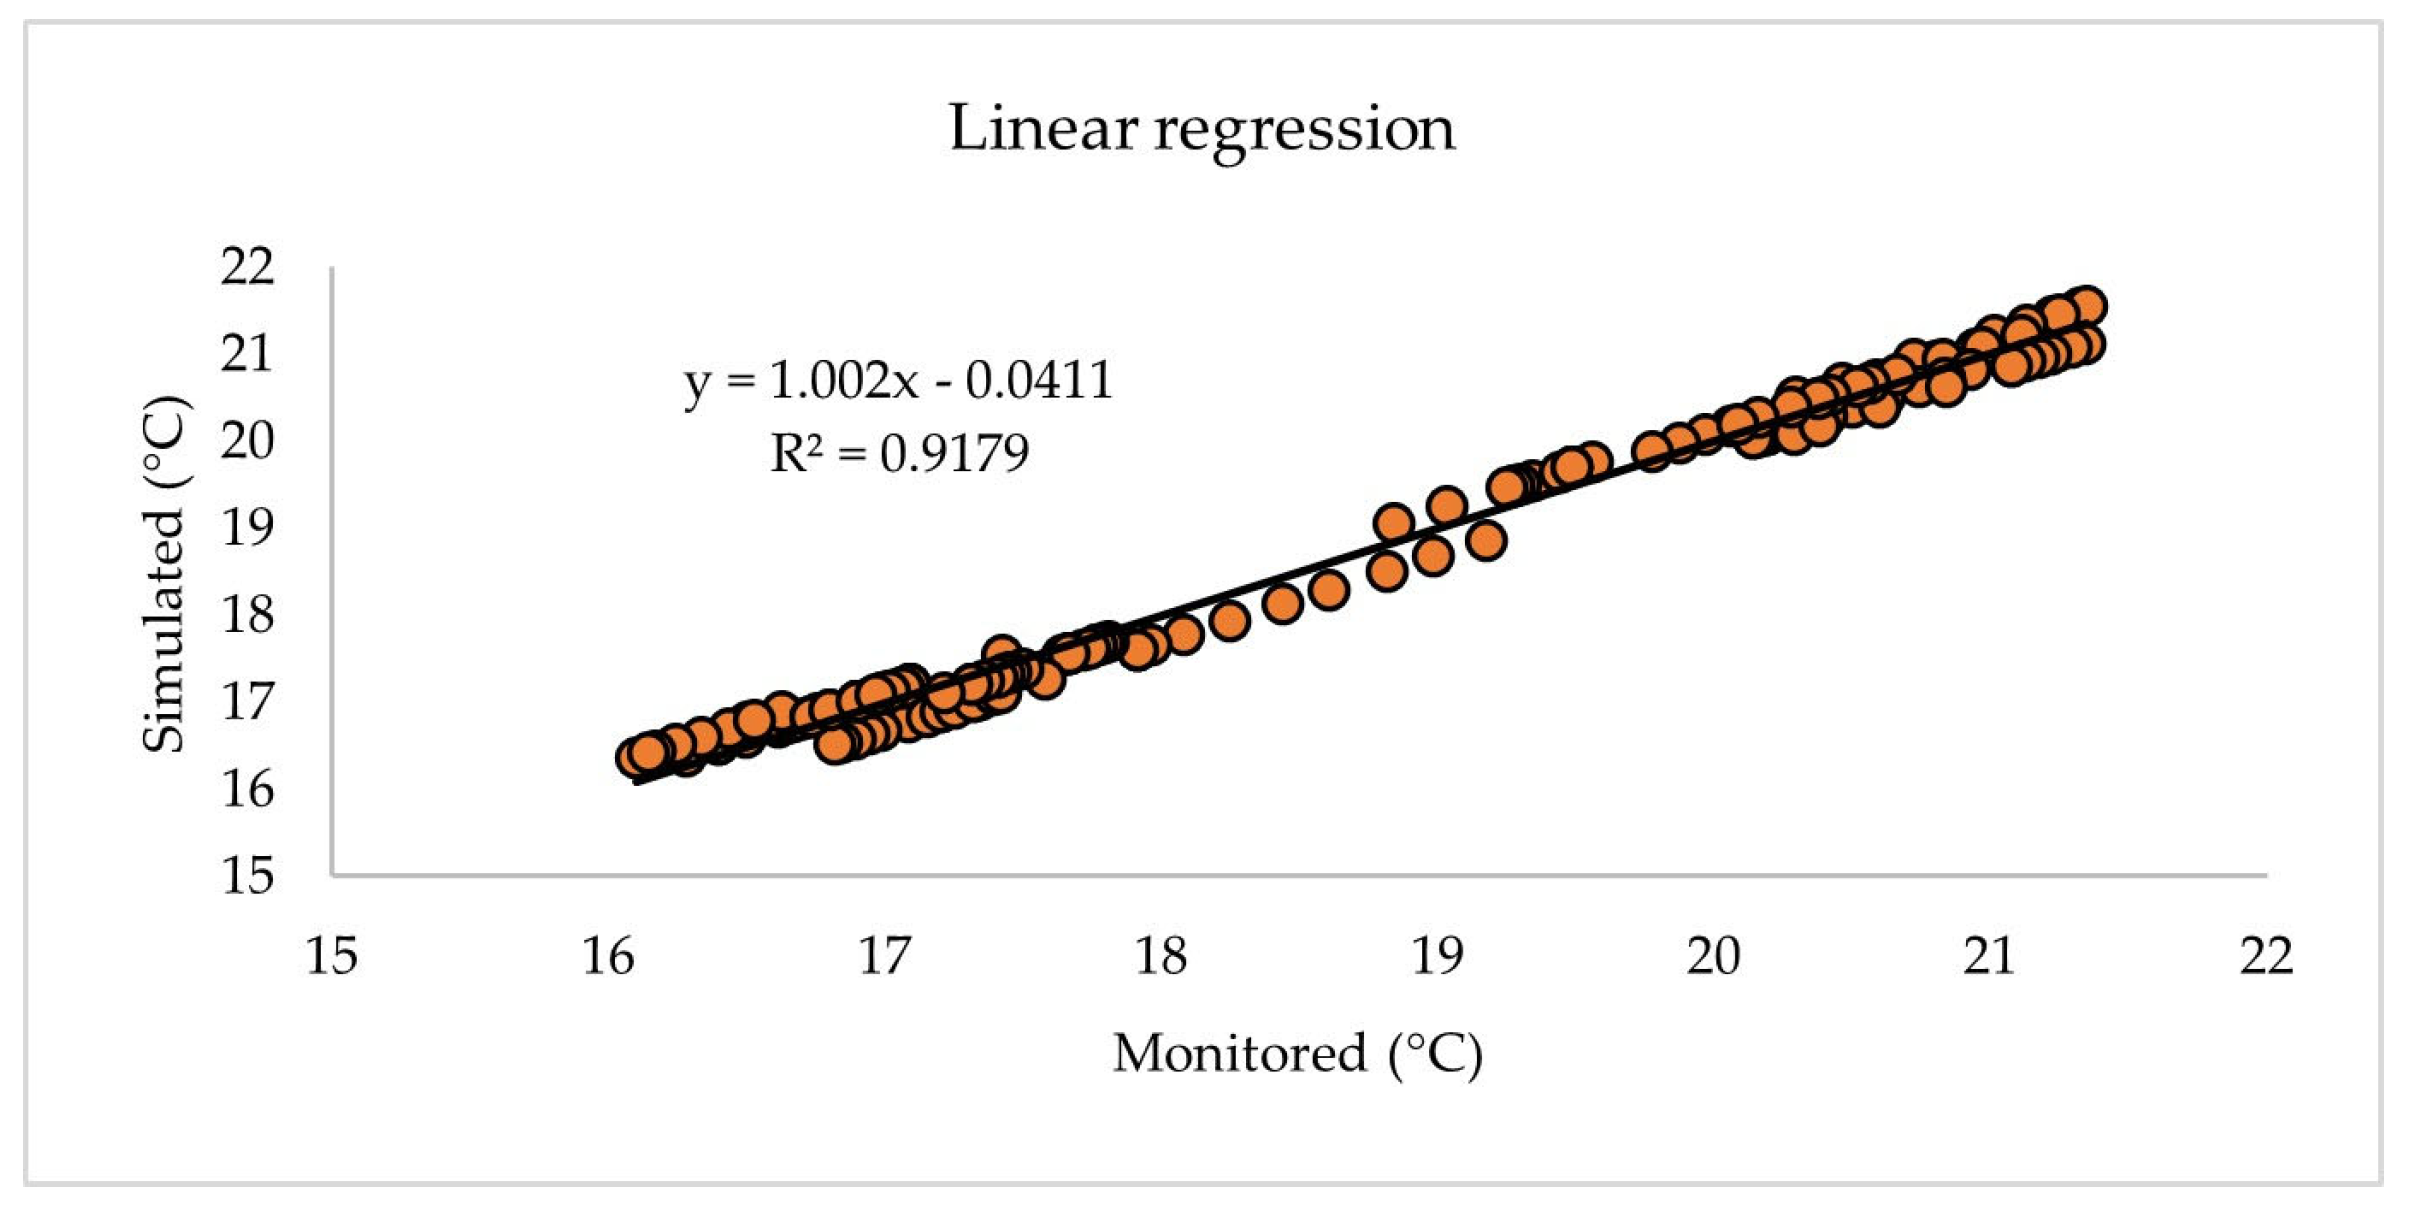
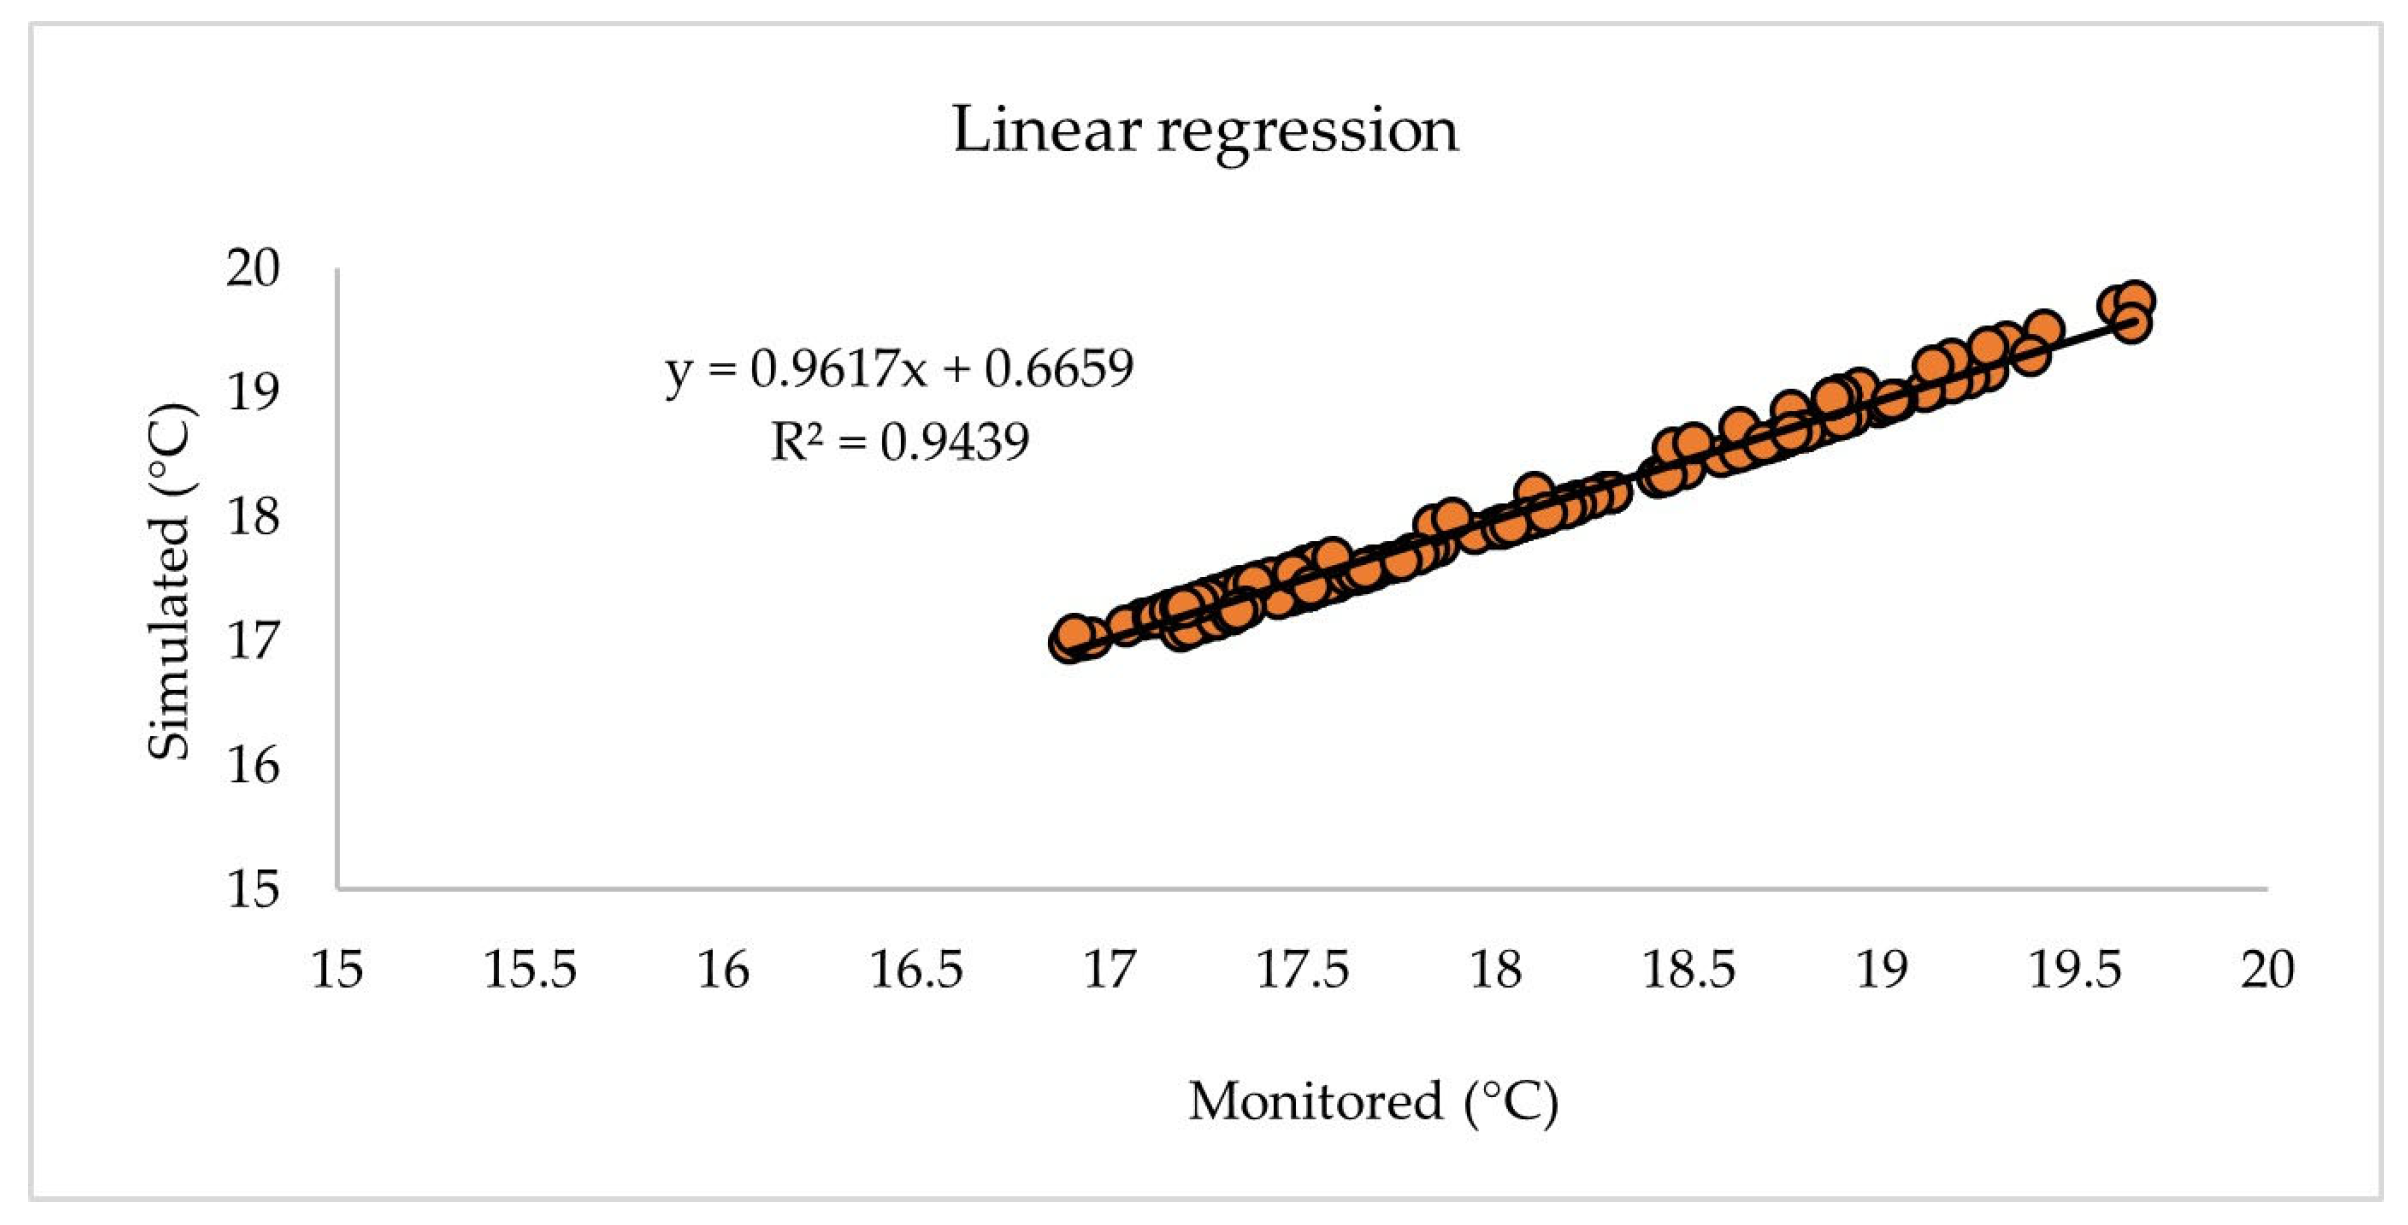
Appendix A.2. Linear Regression Analysis of Calibration of the Simulation Models for Winter


Appendix B. Equations Used to Calculate the Solar Fraction for Solar Water Heaters SWHs
References
- International Energy Agency (IEA). Net Zero by 2050 A Roadmap for the Global Energy. Available online: https://www.iea.org/data-and-statistics/data-product/net-zero-by-2050-scenario (accessed on 25 May 2021).
- Gremmelspacher, J.M.; Pizarro, R.C.; van Jaarsveld, M.; Davidsson, H.; Johansson, D. Historical building renovation and PV optimisation towards NetZEB in Sweden. Sol. Energy 2021, 223, 248–260. [Google Scholar] [CrossRef]
- Miljödepartementet, Klimatpolitiska Handlingsplanen; Technical Report: 2019; Ministry of the Environment: Stockholm, Sweden, 2019.
- Lee, J.; Shepley, M.M.; Choi, J. Exploring the effects of a building retrofit to improve energy performance and sustainability: A case study of Korean public buildings. J. Build. Eng. 2019, 25, 100822. [Google Scholar] [CrossRef]
- Fouseki, K.; Newton, D.; Camacho, K.S.M.; Nandi, S.; Koukou, T. Energy Efficiency, Thermal Comfort, and Heritage Conservation in Residential Historic Buildings as Dynamic and Systemic Socio-Cultural Practices. Atmosphere 2020, 11, 604. [Google Scholar] [CrossRef]
- Ali, U.; Shamsi, M.H.; Bohacek, M.; Hoare, C.; Purcell, K.; Mangina, E.; O’Donnell, J. A data-driven approach to optimize urban scale energy retrofit decisions for residential buildings. Appl. Energy 2020, 267, 114861. [Google Scholar] [CrossRef]
- Lidelöw, S.; Örn, T.; Luciani, A.; Rizzo, A. Energy-efficiency measures for heritage buildings: A literature review. Sustain. Cities Soc. 2019, 45, 231–242. [Google Scholar] [CrossRef]
- Cho, H.M.; Yun, B.Y.; Yang, S.; Wi, S.; Chang, S.J.; Kim, S. Optimal energy retrofit plan for conservation and sustainable use of historic campus building: Case of cultural property building. Appl. Energy 2020, 275, 115313. [Google Scholar] [CrossRef]
- Energy in Buildings and Communities Programme (EBC). EBC ANNEX 76-SHC TASK 59, Deep Renovation of Historic Buildings Towards Lowest Possible Energy Demand and CO2 Emissions; Executive Committee Support Services Unit, AECOM: London, UK, 2019. [Google Scholar]
- Lopez, C.P.; Lucchi, E.; Franco, G. Acceptance of Building Integrated Photovoltaic (BIPV) in Heritage Buildings and Landscapes: Potentials, Barrier and Assessment Criteria. In Proceedings of the Rehabend Conference, Construction Pathology, Rehabilitation Technology and Heritage Management, Granada, Spain, 24–27 March 2020. [Google Scholar]
- Martinez-Molina, A.; Tort-Ausina, I.; Cho, S.; Vivancos, J.-L. Energy efficiency and thermal comfort in historic buildings: A review. Renew. Sustain. Energy Rev. 2016, 61, 70–85. [Google Scholar] [CrossRef]
- Ibrahim, H.S.S.; Khan, A.Z.; Mahar, W.A.; Attia, S.; Serag, Y. Assessment of Passive Retrofitting Scenarios in Heritage Residential Buildings in Hot, Dry Climates. Energies 2021, 14, 3359. [Google Scholar] [CrossRef]
- Lelieveld, J.; Proestos, Y.; Hadjinicolaou, P.; Tanarhte, M.; Tyrlis, E.; Zittis, G. Strongly increasing heat extremes in the Middle East and North Africa (MENA) in the 21st century. Clim. Chang. 2016, 137, 245–260. [Google Scholar] [CrossRef]
- Lange, M.A. Impacts of climate change on the Eastern Mediterranean and the Middle East and North Africa region and the water–energy nexus. Atmosphere 2019, 10, 455. [Google Scholar] [CrossRef]
- Salameh, T.; Tawalbeh, M.; Juaidi, A.; Abdallah, R.; Hamid, A.-K. A novel three-dimensional numerical model for PV/T water system in hot climate region. Renew. Energy 2021, 164, 1320–1333. [Google Scholar] [CrossRef]
- Salameh, T.; Ghenai, C.; Merabet, A.; Alkasrawi, M. Techno-economical optimization of an integrated stand-alone hybrid solar PV tracking and diesel generator power system in Khorfakkan, United Arab Emirates. Energy 2020, 190, 116475. [Google Scholar] [CrossRef]
- Salameh, T.; Assad, M.E.; Tawalbeh, M.; Ghenai, C.; Merabet, A.; Öztop, H.F. Analysis of cooling load on commercial building in UAE climate using building integrated photovoltaic façade system. Sol. Energy 2020, 199, 617–629. [Google Scholar] [CrossRef]
- International Bank for Reconstruction and Development/The World Bank. Report No: ACS22504, Egypt Energy Efficiency Implementation, Energy Efficiency and Rooftop Solar PV Opportunities: Report Summary; International Bank for Reconstruction and Development/The World Bank: Cairo, Egypt, 2017. [Google Scholar]
- Egyptian Electricity Holding Company (EEHC). Annual Report 2018/2019; Ministery of Electricity & Renewable Energy: Cairo, Egypt, 2020.
- Attia, S.; Evrard, A.; Gratia, E. Development of benchmark models for the Egyptian residential buildings sector. Appl. Energy 2012, 94, 270–284. [Google Scholar] [CrossRef]
- Abdallah, L. Egypt’s nationally determined contributions to Paris agreement: Review and recommendations. Int. J. Ind. Sustain. Dev. 2020, 1, 49–59. [Google Scholar] [CrossRef]
- Central Agency for Public Mobilization and Statistics (CAPMAS). Housing and Establishment Census 2017; CAPMAS: Egypt, Cairo, 2019.
- Berggren, B. Evaluating Energy Efficient Buildings: Energy-and Moisture Performance Considering Future Climate Change. Doctoral Thesis, Lund University, Lund, Sweden, 2019. [Google Scholar]
- Ibrahim, H.S.S.; Khan, A.Z.; Attia, S.; Serag, Y. Classification of Heritage Residential Building Stock and Defining Sustainable Retrofitting Scenarios in Khedivial Cairo. Sustainability 2021, 13, 880. [Google Scholar] [CrossRef]
- Ibrahim, H.S.S.; Khan, A.Z.; Ali, M.A.M.; Serag, Y. Evaluation of a Retrofitted Heritage Building in Downtown Cairo as a Best-Practice Example. In Proceedings of the SBE21 Sustainable Built Heritage, Renovating Historic Buildings for a Low-Carbon Built, Bolzano, Italy, 14–16 April 2021. [Google Scholar]
- Webb, A.L. Energy retrofits in historic and traditional buildings: A review of problems and methods. Renew. Sustain. Energy Rev. 2017, 77, 748–759. [Google Scholar] [CrossRef]
- Kottek, M.; Jürgen, G.; Christoph, B.; Bruno, R.; Franz, R. World map of the Köppen-Geiger climate classification updated. Meteorol. Zeitsxhrift. 2006, 15, 259–263. [Google Scholar] [CrossRef]
- Sahin, C.D.; Arsan, Z.D.; Tunçoku, S.S.; Broström, T.; Akkurt, G.G. A transdisciplinary approach on the energy efficient retrofitting of a historic building in the Aegean Region of Turkey. Energy Build. 2015, 96, 128–139. [Google Scholar] [CrossRef]
- Güleroğlu, S · k.; Karagüler, M.E.; Kahraman, I.; Umdu, E.S. Methodological approach for performance assessment of historical buildings based on seismic, energy and cost performance: A Mediterranean case. J. Build. Eng. 2020, 31, 101372. [Google Scholar] [CrossRef]
- Bellia, L.; Alfano, F.R.; Giordano, J.; Ianniello, E.; Riccio, G. Energy requalification of a historical building: A case study. Energy Build. 2015, 95, 184–189. [Google Scholar] [CrossRef]
- Lucchi, E.; Lopez, C.P.S.; Franco, G. A conceptual framework on the integration of solar energy systems in heritage sites and buildings. IOP Conf. Ser. Mater. Sci. Eng. 2020, 949, 012113. [Google Scholar] [CrossRef]
- Attia, S.; De Herde, A.; Gratia, E.; Hensen, J.L. Achieving informed decision-making for net zero energy buildings design using building performance simulation tools. Build. Simul. 2013, 16, 3–21. [Google Scholar] [CrossRef]
- Fahmy, M.; Mahmoud, S.; Elwy, I.; Mahmoud, H. A Review and Insights for Eleven Years of Urban Microclimate Research Towards a New Egyptian ERA of Low Carbon, Comfortable and Energy-Efficient Housing Typologies. Atmosphere 2020, 11, 236. [Google Scholar] [CrossRef]
- Housing and Building National Research Center (HBRC). The Egyptian Code for Energy Efficiency Improvement in Buildings Part 1 (ECP 306–2005); Ministry of Housing, Utilities & Urban Communities: Cairo, Egypt, 2006. (In Arabic) [Google Scholar]
- Housing and Building National Research Center (HBRC). Specifications of Thermal Insulation Work Items; Ministry of Housing, Utilities & Urban Communities: Cairo, Egypt, 2007. [Google Scholar]
- Egyptian Prime Minister, Egyptian Law No. 144 of 2006, Regulation of the Demolition of Unthreatened Buildings and Constructions and the Conservation of the Architectural Heritage; The Egyptian Gazette (Al-Waqa’i’ al-Misriyya): Cairo, Egypt, 2006. (In Arabic)
- Attia, S.; De Herde, A. Impact and potential of community scale low-energy retrofit: Case study in Cairo. In Proceedings of the 3rd CIB International Conference on Smart and Sustainable Built Environments, Delft, The Netherlands, 15–19 June 2009. [Google Scholar]
- General Meteorological Authority. Statistical Yearbook, Geography & Climate; General Meteorological Authority: Cairo, Egypt, 2016.
- Mostafa, A.N.; Wheida, A.; El Nazer, M.; Adel, M.; El Leithy, L.; Siour, G.; Coman, A.; Borbon, A.; Magdy, A.W.; Omar, M.; et al. Past (1950–2017) and future (−2100) temperature and precipitation trends in Egypt. Weather Clim. Extrem. 2019, 26, 100225. [Google Scholar] [CrossRef]
- Weather Data/EnergyPlus. Available online: https://energyplus.net/weather (accessed on 26 April 2021).
- BizEE Degree Days, Weather Data for Energy Saving. Available online: https://www.degreedays.net (accessed on 26 April 2021).
- Setyantho, G.R.; Park, H.; Chang, S. Multi-Criteria Performance Assessment for Semi-Transparent Photovoltaic Windows in Different Climate Contexts. Sustainability 2021, 13, 2198. [Google Scholar] [CrossRef]
- Photovoltaic Geographical Information System, European Commission EU. Available online: https://re.jrc.ec.europa.eu (accessed on 1 June 2021).
- GEO-CRADLE. The Solar Atlas of Egypt, The European Union’s Horizon 2020 Research and Innovation Programme; European Commission: Brussels, Belgium, 2013. [Google Scholar]
- RETScreen® Software Online Manual. Solar Water Heating Project Model. RET Screen International Clean Energy Decision Support Centre. 2005. Available online: www.retscreen.net (accessed on 5 July 2021).
- Mahar, W.A.; Verbeeck, M · k.S.G.; Attia, S. An investigation of thermal comfort of houses in dry and semi-arid climates of Quetta, Pakistan. Sustainability 2019, 11, 5203. [Google Scholar] [CrossRef]
- Semahi, S.; Noureddine, Z.; Manoj, K.S.; Attia, S. Comparative bioclimatic approach for comfort and passive heating and cooling strategies in Algeria. Build. Environ. 2019, 161, 106271. [Google Scholar] [CrossRef]
- Attia, S.; Carlucci, S. Impact of different thermal comfort models on zero energy residential buildings in hot climate. Energy Build. 2015, 102, 117–128. [Google Scholar] [CrossRef]
- Attia, S.; Hamdy, M.; Ezzeldin, S. Twenty-year tracking of lighting savings and power density in the residential sector. Energy Build. 2017, 154, 113–126. [Google Scholar] [CrossRef]
- Attia, S.; De Herde, A. Strategic decision making for zero energy buildings in hot climates. In Proceedings of the EuroSun 2010, the 8th EuroSun Conference of ISES Europe, Graz, Austria, 28 September–1 October 2010. [Google Scholar]
- Tabibian, S.; Ghavami, M. New HVAC system in restoration of historic buildings. J. Nat. Sci. Sustain. Technol. 2016, 10, 37. [Google Scholar]
- Torregrosa-Jaime, B.; Martínez, P.J.; González, B.; Payá-Ballester, G. Modelling of a Variable Refrigerant Flow System in EnergyPlus for Building Energy Simulation in an Open Building Information Modelling Environment. Energies 2018, 12, 22. [Google Scholar] [CrossRef]
- Thornton, B. General Services Administration (Report); US Federal Government: Washington, DC, USA, 2012.
- Afify, R. Designing VRF systems. ASHRAE J. 2008, 50, 52. [Google Scholar]
- Aynur, T.N.; Hwang, Y.; Radermacher, R. Simulation comparison of VAV and VRF air conditioning systems in an existing building for the cooling season. Energy Build. 2009, 41, 1143–1150. [Google Scholar] [CrossRef]
- Kim, D.; Cox, S.J.; Cho, H.; Im, P. Evaluation of energy savings potential of variable refrigerant flow (VRF) from variable air volume (VAV) in the U.S. climate locations. Energy Rep. 2017, 3, 85–93. [Google Scholar] [CrossRef]
- Kani-Sanchez, C.; Richman, R. Incorporating variable refrigerant flow (VRF) heat pump systems in whole building energy simulation – Detailed case study using measured data. J. Build. Eng. 2017, 12, 314–324. [Google Scholar] [CrossRef]
- Pelle, M.; Lucchi, E.; Maturi, L.; Astigarraga, A.; Causone, F. Coloured BIPV Technologies: Methodological and Experimental Assessment for Architecturally Sensitive Areas. Energies 2020, 13, 4506. [Google Scholar] [CrossRef]
- Quintana, S.; Huang, P.; Saini, P.; Zhang, X. A preliminary techno-economic study of a building integrated photovoltaic (BIPV) system for a residential building cluster in Sweden by the integrated toolkit of BIM and PVSITES. Intell. Build. Int. 2021, 13, 51–69. [Google Scholar] [CrossRef]
- Moschella, A.; Salemi, A.; Sanfilippo, G.; Detommaso, M.; Privitera, A. Historic buildings in Mediterranean area and solar thermal technologies: Architectural integration vs preservation criteria. Energy Procedia 2013, 42, 416–425. [Google Scholar] [CrossRef]
- Gevorkian, P. Solar Power in Building Design: The Engineer’s Complete Design Resource; McGraw-Hill Education: New York, NY, USA, 2008. [Google Scholar]
- Kallioğlu, M.A.; Durmuş, A.; Karakaya, H.; Yılmaz, A. Empirical calculation of the optimal tilt angle for solar collectors in northern hemisphere. Energy Sources Part A Recover. Util. Environ. Eff. 2020, 42, 1335–1358. [Google Scholar] [CrossRef]
- Darhmaoui, H.; Lahjouji, D. Latitude based model for tilt angle optimization for solar collectors in the Mediterranean region. Energy Procedia 2013, 42, 426–435. [Google Scholar] [CrossRef]
- López, C.S.P.; Troia, F.; Nocera, F. Photovoltaic BIPV Systems and Architectural Heritage: New Balance between Conservation and Transformation. An Assessment Method for Heritage Values Compatibility and Energy Benefits of Interventions. Sustainability 2021, 13, 5107. [Google Scholar] [CrossRef]
- Solar Panel Kits & Products. Longi Solar, Model ID (LR4-60HPH-360M). Available online: https://www.solaris-shop.com (accessed on 15 July 2021).
- Bhargav, K.; Antony, S.M. A MPPT controller based Solar Power Generation using a Multilevel Inverter. Int. J. Eng. Technol. 2016, 8, 265–273. [Google Scholar]
- Babes, B.; Boutaghane, A.; Hamouda, N. A novel nature-inspired maximum power point tracking (MPPT) controller based on ACO-ANN algorithm for photovoltaic (PV) system fed arc welding machines. Neural Comput. Appl. 2021, 1–19. [Google Scholar] [CrossRef]
- Fronius Primo 5.0-1 TL 5KW Inverter. Available online: https://www.solaris-shop.com/fronius-primo-5-0-1-tl-5kw-inverter/ (accessed on 30 July 2021).
- Horan, P.; Luther, M.B.; Li, H.X. Guidance on Implementing Renewable Energy Systems in Australian Homes. Energies 2021, 14, 2666. [Google Scholar] [CrossRef]
- Salameh, T.; Abdelkareem, M.A.; Olabi, A.G.; Sayed, E.T.; Al-Chaderchi, M.; Rezk, H. Integrated standalone hybrid solar PV, fuel cell and diesel generator power system for battery or supercapacitor storage systems in Khorfakkan, United Arab Emirates. Int. J. Hydrogen Energy 2021, 46, 6014–6027. [Google Scholar] [CrossRef]
- Hassan, A.S.; Cipcigan, L.; Jenkins, N. Optimal battery storage operation for PV systems with tariff incentives. Appl. Energy 2017, 203, 422–441. [Google Scholar] [CrossRef]
- Muenzel, V.; Mareels, I.; De Hoog, J.; Vishwanath, A.; Kalyanaraman, S.; Gort, A. PV generation and demand mismatch: Evaluating the potential of residential storage. In Proceedings of the 2015 IEEE Power & Energy Society Innovative Smart Grid Technologies Conference (ISGT), Washington, DC, USA, 18–20 February 2015; pp. 1–5. [Google Scholar]
- Weniger, J.; Tjaden, T.; Quaschning, V. Sizing of Residential PV Battery Systems. Energy Procedia 2014, 46, 78–87. [Google Scholar] [CrossRef]
- Aichhorn, A.; Greenleaf, M.; Li, H.; Zheng, J. A cost effective battery sizing strategy based on a detailed battery lifetime model and an economic energy management strategy. In Proceedings of the 2012 IEEE Power and Energy Society General Meeting, San Diego, CA, USA, 22–26 July 2012; pp. 1–8. [Google Scholar]
- Xiao, H.; Pei, W.; Yang, Y.; Kong, L. Sizing of battery energy storage for micro-grid considering optimal operation management. In Proceedings of the 2014 International Conference on Power System Technology, Ghengdu, China, 20–22 October 2014; pp. 3162–3169. [Google Scholar]
- Calculate Solar Array Size and Cost. Available online: http://sroeco.com/solar/calculate-solar-cost/what_size_solar_system_ (accessed on 14 June 2021).
- Castro-Gutiérrez, J.; Celzard, A.; Fierro, V. Energy storage in supercapacitors: Focus on tannin-derived carbon electrodes. Front. Mater. 2020, 7, 217. [Google Scholar] [CrossRef]
- Frattolillo, A.; Canale, L.; Ficco, G.; Mastino, C.C.; Dell’Isola, M. Potential for Building Façade-Integrated Solar Thermal Collectors in a Highly Urbanized Context. Energies 2020, 13, 5801. [Google Scholar] [CrossRef]
- Raza, S.A.; Ahmad, S.S.; Ratlamwala, T.A.H.; Hussain, G.; Alkahtani, M. Techno-Economic Analysis of Glazed, Unglazed and Evacuated Tube Solar Water Heaters. Energies 2020, 13, 6261. [Google Scholar] [CrossRef]
- Lima, J.B.A.; Prado, R.T.; Taborianski, V.M. Optimization of tank and flat-plate collector of solar water heating system for single-family households to assure economic efficiency through the TRNSYS program. Renew. Energy 2006, 31, 1581–1595. [Google Scholar] [CrossRef]
- Çomaklı, K.; Çakır, U.; Kaya, M.; Bakirci, K. The relation of collector and storage tank size in solar heating systems. Energy Convers. Manag. 2012, 63, 112–117. [Google Scholar] [CrossRef]
- Sizing The Solar Thermal Array. SunMaxx Sloar. Available online: https://www.sunmaxxsolar.com/architects-engineer-training/sizing-the-solar-thermal-array/ (accessed on 5 July 2021).
- Calculation and Simulation of Solar Thermal Plants for Heating and Potable Water. Oventrop. Available online: https://www.oventrop.com/en-GB/downloadssoftware/onlinecalculations/solarcalculation (accessed on 5 July 2021).
- RETScreen® International Software Product Database. RET Screen International Clean Energy Decision Support Centre. 2015. Available online: www.retscreen.net (accessed on 5 July 2021).
- Duffie, J.A.; Beckman, W.A.; Worek, W.M. Solar Engineering of Thermal Processes, 2nd ed.; Wiley: Hoboken, NJ, USA; New York, NY, USA, 1991; p. 1919. [Google Scholar]
- Hsieh, J.S. Solar Energy Engineering; Prentice-Hall, Inc.: Old Tappan, NJ, USA, 1986. [Google Scholar]
- Yasin, A. Technical and Financial Assessment of Glazed and Evacuated Tubes Solar Collectors for Domestic Water Heating Application in Palestine. An-Najah Univ. J. Res. A (Nat. Sci.) 2017, 31, 151–172. [Google Scholar]
- Liu, S.; Hao, B.; Chen, X.; Yao, C.; Zhou, W. Analysis on limitation of using solar fraction ratio as solar hot water system design and evaluation index. Energy Procedia 2015, 70, 353–360. [Google Scholar] [CrossRef][Green Version]
- Guide Specifications. Aquatherm Industries. Available online: http://aquathermsolar.com/specs/ (accessed on 15 June 2021).
- SOLTOP Schuppisser. 2016. Available online: https://www.soltop.ch/ (accessed on 15 June 2021).
- Shangdong Linuo Paradigma. Available online: http://www.linuo-ritter-international.com/ (accessed on 15 June 2021).
- Abd-Ur-Rehman, H.M.; Al-Sulaiman, F.A. Techno-Economic Evaluation of Different Types of Solar Collectors for Water Heating Application in Domestic Sector of Saudi Arabia. In Proceedings of the 2014 5th International Renewable Energy Congress (IREC), Hammamet, Tunisia, 25–27 March 2014; pp. 1–6. [Google Scholar]
- Khatri, R.; Joshi, A. Energy performance comparison of inverter based variable refrigerant flow unitary AC with constant volume unitary AC. Energy Procedia 2017, 109, 18–26. [Google Scholar] [CrossRef]


| Model Input Measures | Parameters * | |||
|---|---|---|---|---|
| Reference Building 7 | Reference Building 8 | Reference Building 9 | ||
| Envelope | Air tightness (ac/h) at 50 PA ** | 24.5 | 21.7 | 17.9 |
| WWR (window to wall ratio) (%) | 25 N, 21 W, 21 E, 25 S | 22 N, 20 W, 20 E, 22 S | 18.2 N, 21 W, 21 E | |
| Window U value (W/m2 · K) single clear 3 mm | 5.73 | 5.73 | 5.73 | |
| SHGC (solar heat gain coefficient) | 0.81 | 0.81 | 0.81 | |
| LT (light transmission) | 0.898 | 0.898 | 0.898 | |
| SC (shading coefficient) | 0.99 | 0.99 | 0.99 | |
| Roof solar reflectance | 0.3 | 0.4 | 0.3 | |
| Occupancy | Density (people/m2) | 0.15 | 0.15 | 0.04 |
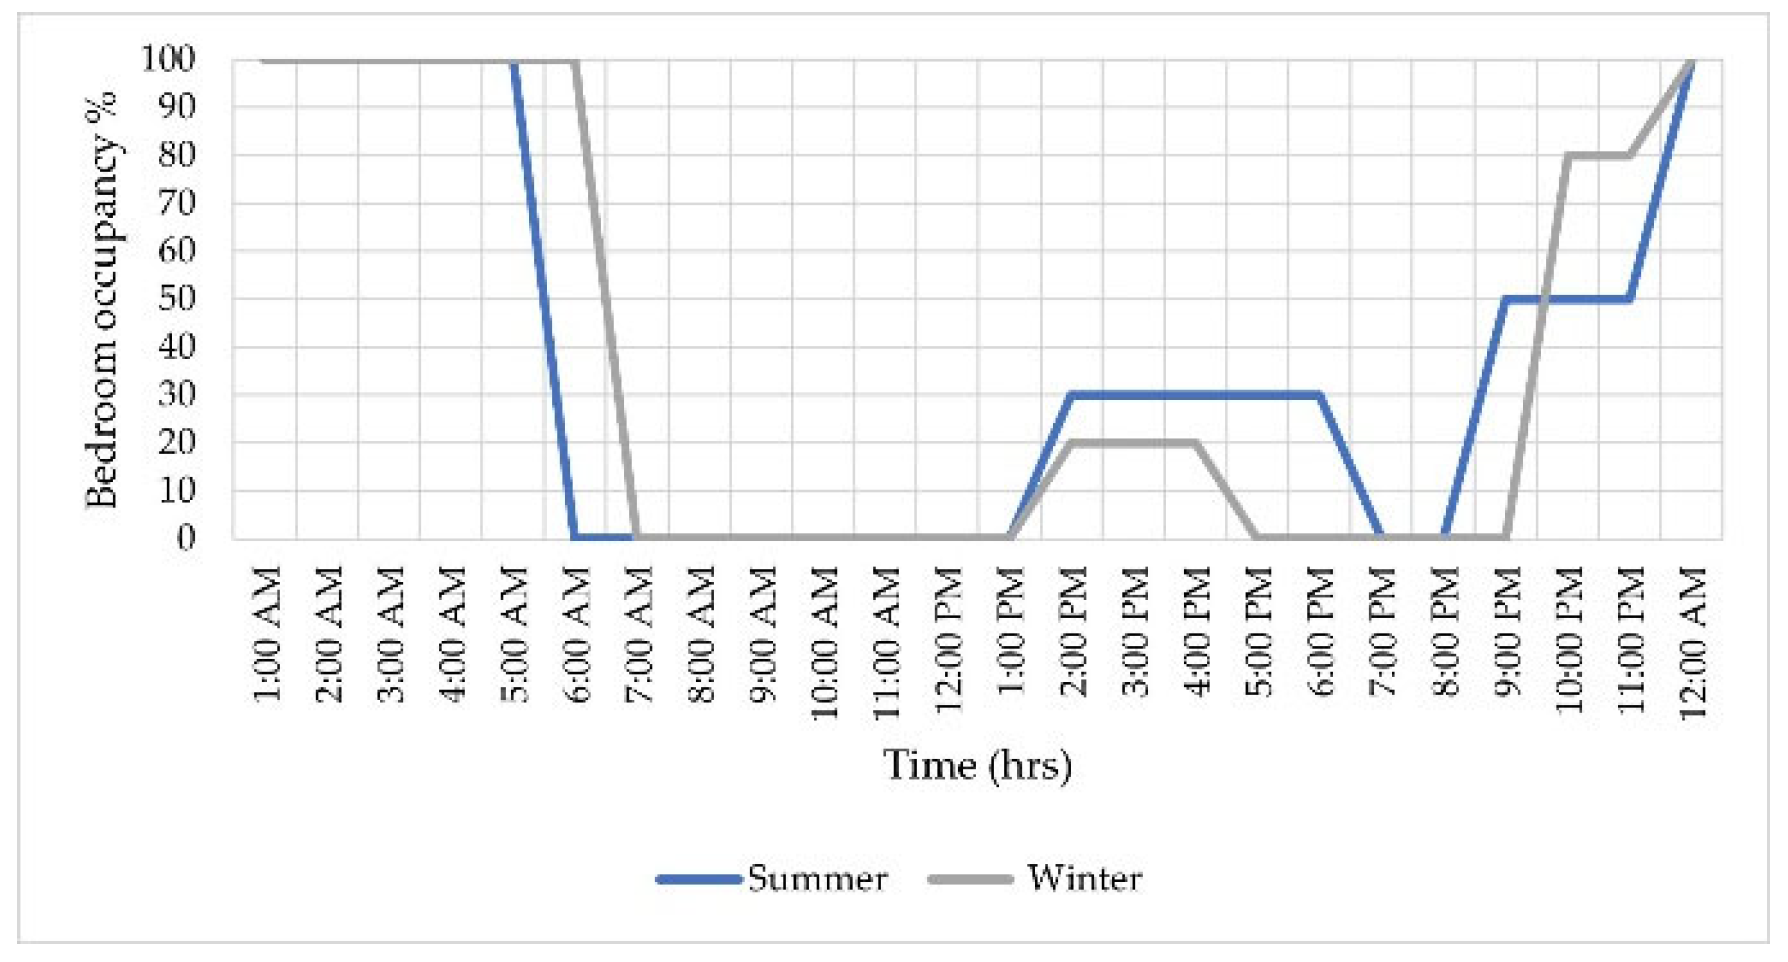
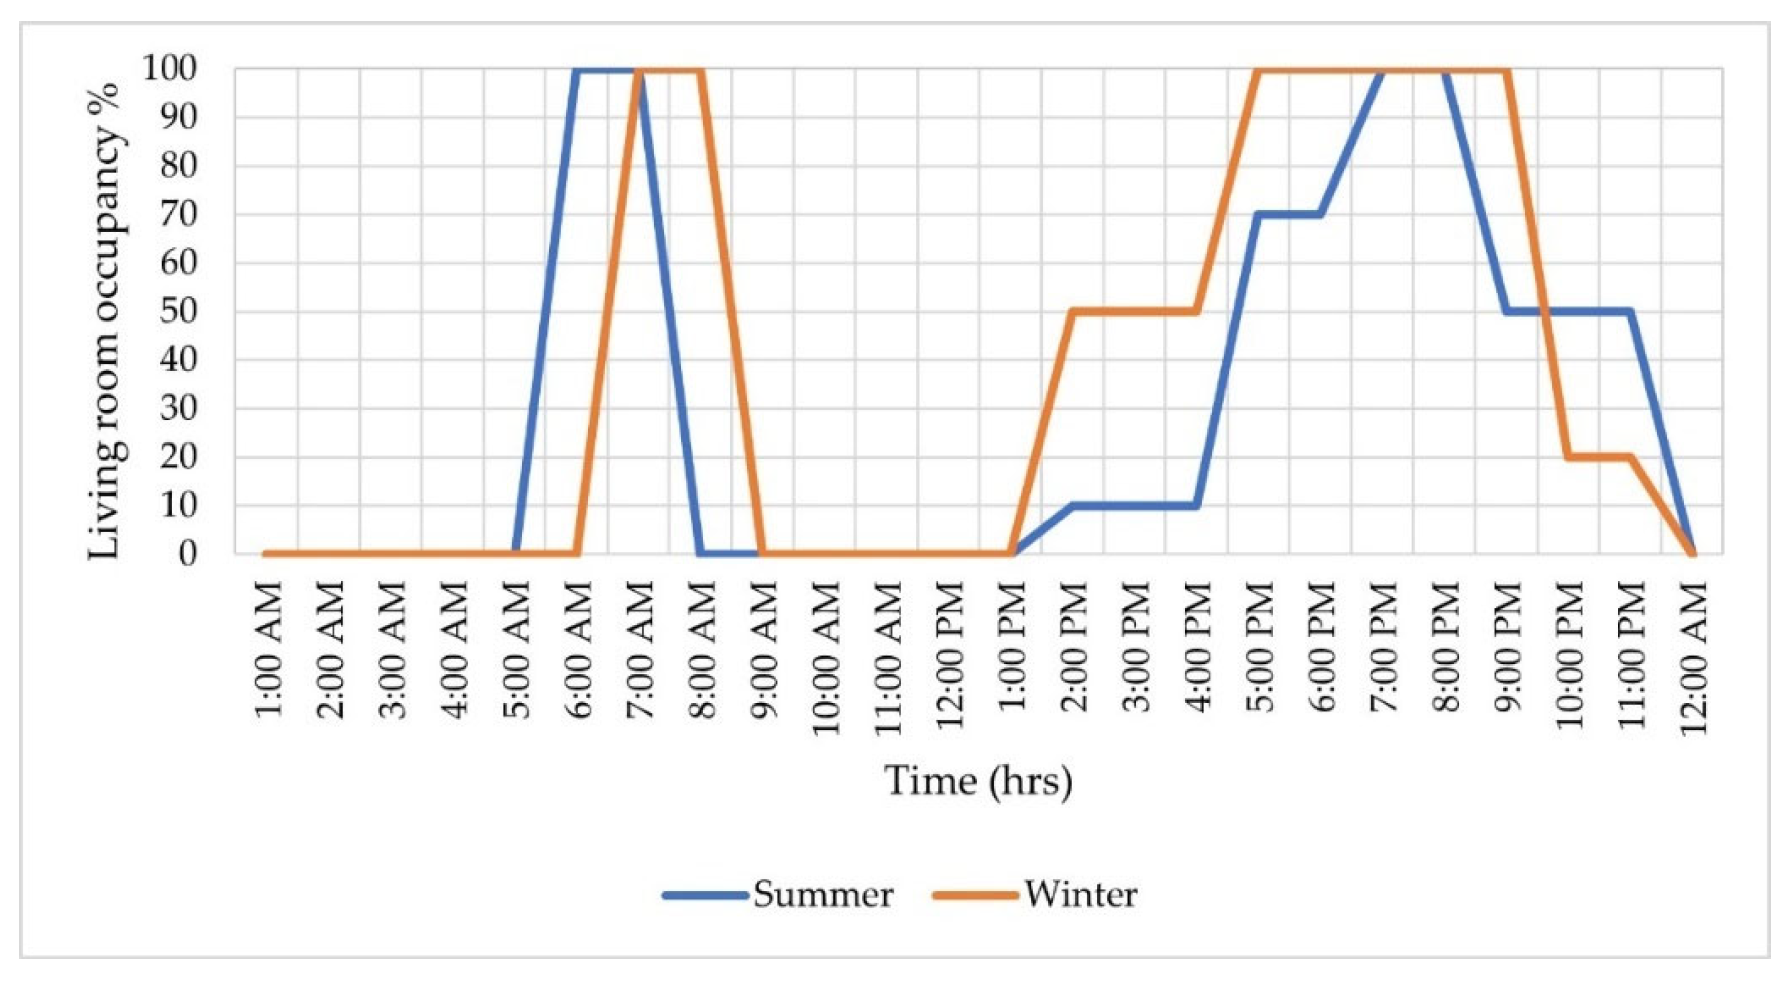
| Schedules | See Appendix A (Figure A1 and Figure A2) | |||
| Internal load intensities and schedules | ||||
| Lighting *** | Installation power density (KW/m2) living rooms | 10 | 10 | 0.17 |
| Installation power density (KW/m2) bedrooms | 6 | 6 | 0.13 | |
| Installation power density (KW/m2) other | 2 | 2 | 0.9 | |
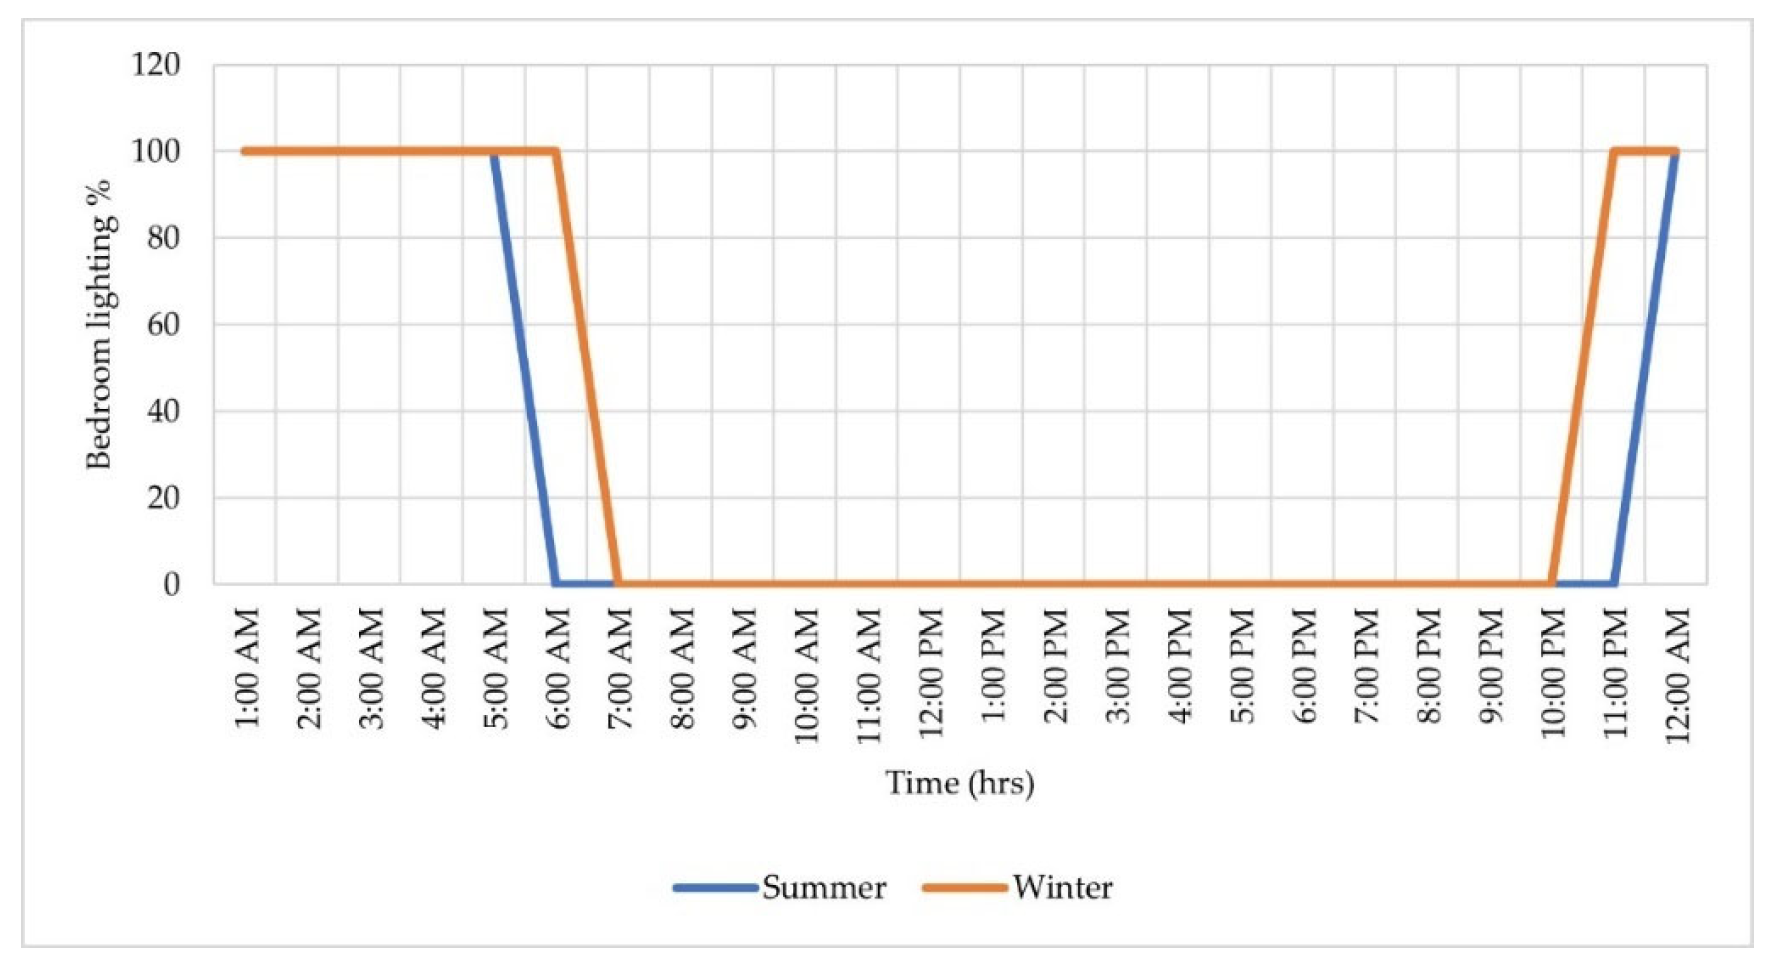
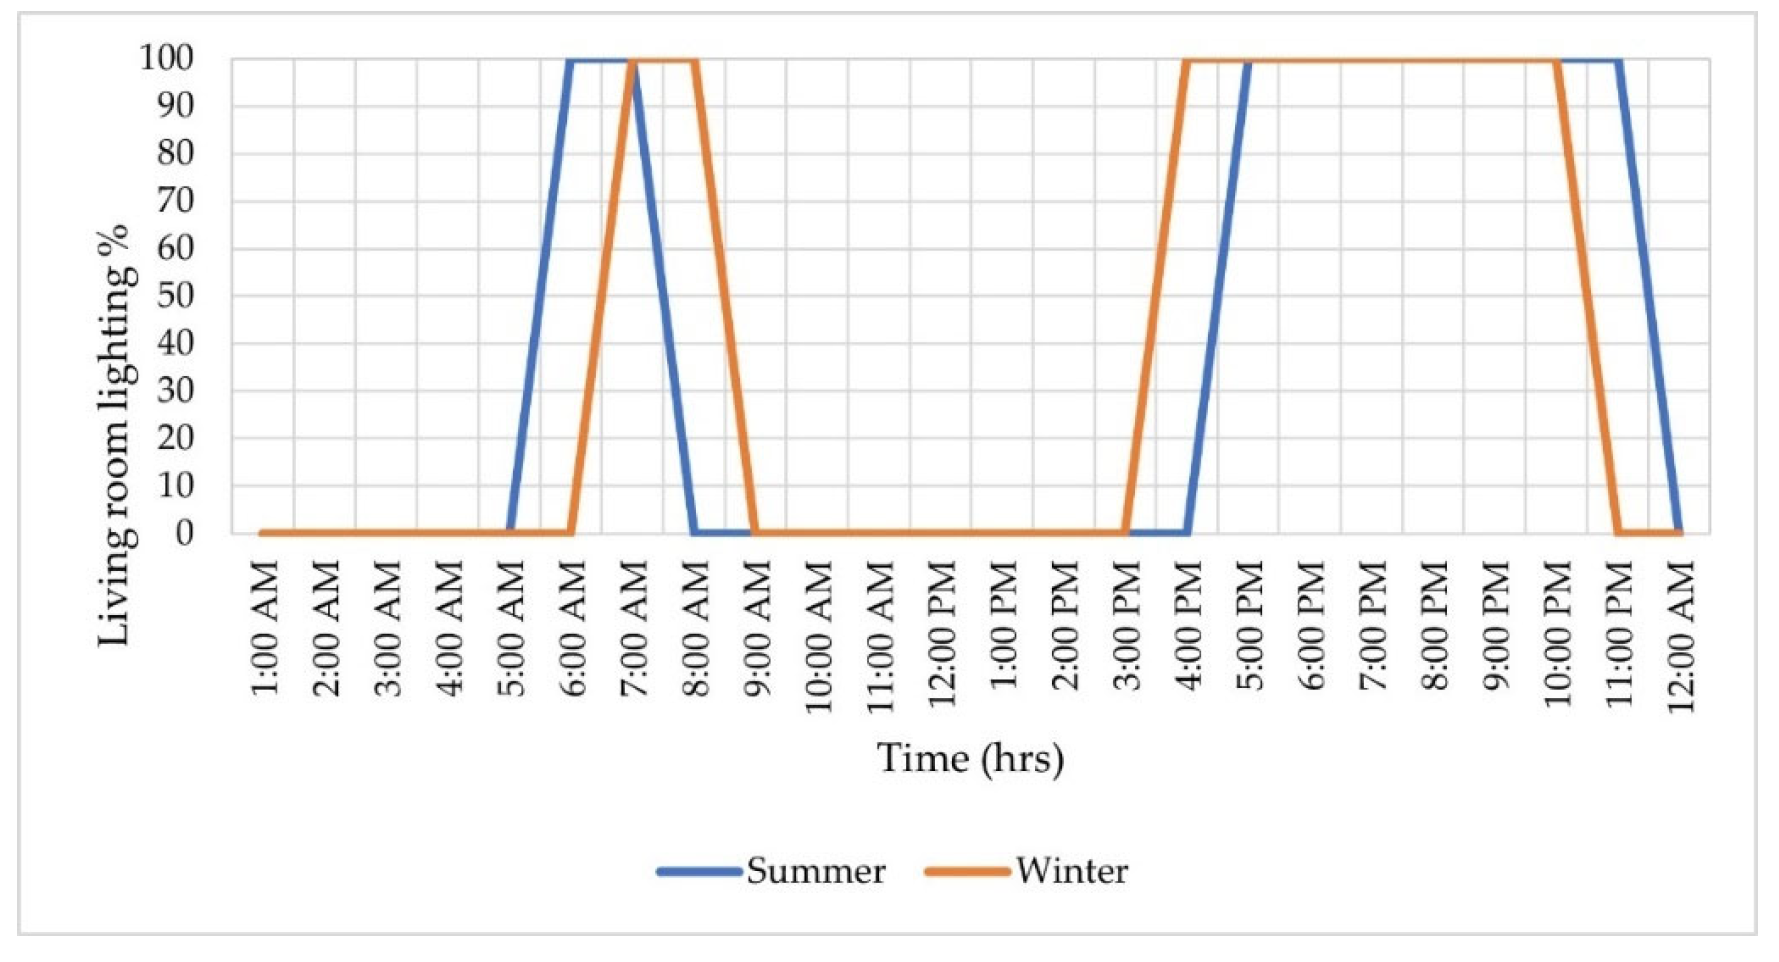
| Schedules | See Appendix A (Figure A3 and Figure A4) | |||
| Types | Mix of incandescent and halogen lamps | Mix of incandescent and halogen lamps | Compact fluorescent lamp CFL | |
| Plug loads | Average installation power density (W/m2) **** | 13–15 | 13–15 | 13–15 |
| DHW | Period 1 (October–April) (L/m2/day) | 0.35 | 0.35 | 0.35 |
| Period 2 (May–September) (L/m2/day) | 0.05 | 0.05 | 0.05 | |
| Schedules | See Appendix A (Figure A5) | |||
| Ventilation and air conditioning | Temperature setpoint (°C) | Heating 20, Cooling 22 | Heating 20, Cooling 22 | Heating 21, Cooling 23 |
| Coefficient of performance (COP) of air-conditioned units | 0.85 | 0.85 | 2 | |
| Types of air-conditioned units | Split and window units | |||
| Internal heat gains | ||||
| From lighting (W/m2) | 19 | |||
| From appliances (W/m2) | 12 | |||
| Activity (metabolic rate) | Metabolism level | 1.2 | ||
| Clothing | Summer | 0.5 | ||
| Winter | 1.0 | |||
| Scenarios | Location | Selected Materials | Thickness (m) | Conductivity (w/m-K) | Specific Heat Capacity (J/kg · k) | Density (kg/m3) |
|---|---|---|---|---|---|---|
| Package of passive scenarios | Roof | White acrylic paint * | 0.02 | 0.20 | 1500 | 1050 |
| External walls, internal insulations | EPS (expanded polystyrene) ** | 0.1 | 0.035 | 1400 | 25 | |
| Roof | XPS (extruded polystyrene) ** | 0.1 | 0.034 | 1400 | 35 |
| Surfaces | Building 7 | Building 8 | Building 9 |
|---|---|---|---|
| Roof area (m2) | 891.85 | 370.77 | 773.5 |
| Item | Specification | |
|---|---|---|
| Component materials | ||
| Cells per module | 72 | |
| Cell type | Monocrystalline | |
| Cell dimensions of the active area | (1700 mm × 997 mm) | 1.69 m2 |
| Cell dimensions of total area | (1755 mm ×1038 mm) | 1.82 m2 |
| Weight | 19.5 kg | |
| Performance under standard test conditions | ||
| Maximum power | Pmax | 350 Wp |
| Open circuit voltage | Voc | 44.2 V |
| Maximum power point voltage | Vmpp | 37.6 V |
| Short circuit current | Isc | 3.02 A |
| Maximum power point current | Impp | 2.75 A |
| Module efficiency | m | 19.3% |
| Thermal characteristics | ||
| Temperature coefficient of short circuit (A/K) * | 0.0015402 | |
| Temperature coefficient of open circuit voltage (VK) ** | 0.13702 | |
| Module Area (m2) | Total Number of Rows | Number of Modules in Rows | Total Number of Modules | Total Installed Capacity (kW) | Total Modules Area (m2) | |
|---|---|---|---|---|---|---|
| Building 7 | 1.82 | 4 | 6 | 24 | 8 | 44 |
| Building 8 | 1.82 | 3 | 5 | 15 | 5 | 27 |
| Building 9 | 1.82 | 3 | 4 | 12 | 4 | 22 |
| Inverter Parameters | Type |
|---|---|
| For PV power (kW) | 4.0–8.0 |
| Maximum usable input current (MPPT 1/MPPT 2) (A) | 18/18 |
| Total max. DC current (A) | 36 |
| Max. array short circuit current (1.25 Imax) (MPPT 1/MPPT 2) (A) | 22.5/22.5 |
| Operating voltage range (V) | 80–600 |
| Maximum power point voltage Vmpp (V) | 600 |
| Short circuit current Isc (A) | 22.5 |
| Maximum power point current Impp (A) | 18 |
| Maximum output power (kW) | 5 |
| MPP voltage range | 240–480 |
| Number of MPPT (V) | 2 |
| Maximum efficiency (%) | 96.9 |
| No. | Solar Collector Types * | Optical Efficiency (%) | Collector Gross Area (m2) | Collector Aperture Area (m2) | Fr (τα) Coefficient | Fr UL Coefficient (W/m2)/°C | Temperature Coefficient for FrUL (W/m2)/°C | Source |
|---|---|---|---|---|---|---|---|---|
| 1 | Unglazed flat-plate collectors | 95 | 4.367 | 4.367 | 0.816 | 0.84 | 0.03 | SRCC 100-2004-012A |
| 2 | Glazed flat-plate collectors | 82.4 | 2.31 | 2.05 | 0.71 | 3.95 | 0 | SPF C300 |
| 3 | Tubular evacuated collectors | 76 | 2.28 | 2 | 0.56 | 15.763 | 0 | DIN 011-7S113R |
| Validation Criteria | ||
|---|---|---|
| NMBE (%) | CV(RMSE) (%) | |
| R. Building 7 | −0.02 | 1.02 |
| R. Building 8 | 0.02 | 0.93 |
| R. Building 9 | 0.01 | 0.5 |
| Building 7 | Building 8 | Building 9 | ||||
|---|---|---|---|---|---|---|
| Electricity (kWh/year) | Electricity (%) | Electricity (kWh/year) | Electricity (%) | Electricity (kWh/year) | Electricity (%) | |
| Electricity Consumption | 10,501.0 | 100.0 | 6354.9 | 100.0 | 5168.4 | 100.0 |
| Electricity Generation | 12,642.0 | 120.4 | 7992.6 | 125.8 | 6380.0 | 123.4 |
| Self-consumption | 8187.4 | 78.0 | 4822.9 | 75.9 | 3882.4 | 75.1 |
| Power Conversion + Losing | 2149.1 | 20.5 | 1358.8 | 21.4 | 1084.6 | 21.0 |
| Electricity Coming from Utility | 2313.6 | 22.0 | 1532.0 | 24.1 | 1285.9 | 24.9 |
| Surplus Electricity Going to Utility | 2141.0 | 20.4 | 1637.7 | 25.8 | 1211.6 | 23.4 |
| Strategy | Description | ** Energy Improvements (%) | *** Compatibility with Egyptian Energy Code | *** Compatibility with the Limits of the Interventions Allowed in Heritage Grade B | ||||
|---|---|---|---|---|---|---|---|---|
| Building 7 | Building 8 | Building 9 | Visual | Physical | Spatial | |||
| * Passive strategy | A set of passive scenarios (nocturnal cooling, solar and thermal control) | 48.2 | 38.3 | 56.3 | ✓+ | ✓+ | ✓+ | ✓+ |
| Active non-energy generating | LED lighting | 12.7 | 11.9 | 1.8 | ✓+ | ✓+ | ✓+ | ✓+ |
| VRF HVAC systems | 23.3 | 18.5 | 33.4 | ✓+ | ✓+ | ✓+ | ✓+ | |
| Active energy-generating | Application of PV modules | See Figure 10 and Table 9 | ✓+ | ✓+ | ✓+ | ✓+ | ||
| Application of ST collectors | See Figure 11 | ✓+ | ✓+ | ✓+ | ✓+ | |||
| Nearly-ZEB case | Combination of passive and active (LED+ VRF) scenarios | 66.4 | 59.9 | 60.7 | ✓+ | ✓+ | ✓+ | ✓+ |
| Application of PV modules | See Table 9 | ✓+ | ✓+ | ✓+ | ✓+ | |||
| Application of two unglazed solar collectors | See Figure 11b | ✓+ | ✓+ | ✓+ | ✓+ | |||
Publisher’s Note: MDPI stays neutral with regard to jurisdictional claims in published maps and institutional affiliations. |
© 2021 by the authors. Licensee MDPI, Basel, Switzerland. This article is an open access article distributed under the terms and conditions of the Creative Commons Attribution (CC BY) license (https://creativecommons.org/licenses/by/4.0/).
Share and Cite
Ibrahim, H.S.S.; Khan, A.Z.; Serag, Y.; Attia, S. Towards Nearly-Zero Energy in Heritage Residential Buildings Retrofitting in Hot, Dry Climates. Sustainability 2021, 13, 13934. https://doi.org/10.3390/su132413934
Ibrahim HSS, Khan AZ, Serag Y, Attia S. Towards Nearly-Zero Energy in Heritage Residential Buildings Retrofitting in Hot, Dry Climates. Sustainability. 2021; 13(24):13934. https://doi.org/10.3390/su132413934
Chicago/Turabian StyleIbrahim, Hanan S. S., Ahmed Z. Khan, Yehya Serag, and Shady Attia. 2021. "Towards Nearly-Zero Energy in Heritage Residential Buildings Retrofitting in Hot, Dry Climates" Sustainability 13, no. 24: 13934. https://doi.org/10.3390/su132413934
APA StyleIbrahim, H. S. S., Khan, A. Z., Serag, Y., & Attia, S. (2021). Towards Nearly-Zero Energy in Heritage Residential Buildings Retrofitting in Hot, Dry Climates. Sustainability, 13(24), 13934. https://doi.org/10.3390/su132413934