Article

Research on Coupling Coordination and the Development of Green Shipping and Economic Growth in China

School of Economics and Management, China University of Mining and Technology, University RD. 1, Xuzhou 221116, China
*
Author to whom correspondence should be addressed.
Sustainability 2021, 13(24), 13901; https://doi.org/10.3390/su132413901
Submission received: 12 October 2021 / Revised: 6 December 2021 / Accepted: 12 December 2021 / Published: 16 December 2021

Abstract

:
The shipping industry is an important indicator of economic development, and it is closely related to economic growth. At present, China’s economy has moved from a high-speed growth stage to a high-quality development stage. The popularization of the green shipping concept also creates higher requirements for sustainable economic development. The core innovation point of this paper is to construct an index system of green shipping and economic growth in China, and to measure the coupling coordination degree and relative development degree of the two through the comprehensive development index in the form of overall and regional division. This is rarely covered in the existing literature. By constructing an index system for green shipping and economic growth, this paper calculates a comprehensive development index for the two systems and studies the degree of coupling coordination and relative development of the comprehensive system. The results show that, first, during the observation period, the comprehensive system of green shipping and economic growth in China has maintained a growth trend, rising from a near imbalance to a good coordination level, and the two have developed into a synchronous state. Second, the development of the Yangtze River Delta has been relatively rapid, closely followed by that of the Pearl River Delta, while the Bohai Rim area has seen the slowest development. Since 2010, China’s comprehensive system of 11 coastal provinces has mostly left the imbalanced state and it entered the coordination state by 2019. The results of the study provide some suggestions for the coordinated development of green shipping and economic growth.

1. Introduction

The shipping transportation mode takes the ship as the carrier and transports goods from the place of production to the place of consumption by waterway [1]. According to statistics from the United Nations Conference on Trade and Development, approximately 80% of the global trade volume is completed by sea transportation [2]. The development of the shipping industry also brings serious environmental pollution. The shipping industry produces a large amount of carbon dioxide (CO2), sulfur dioxide (SO2) and particulate matter (PM) in production and operation activities, and thus, construction of a green shipping network is urgently needed [3]. China’s economy has moved from a high-speed development stage to a high-quality development stage, and current economic development work is focused on a strict “ecological priority, green development” concept, including increased energy conservation and emission reduction. In 2011, the International Maritime Organization adopted an amendment to Annex VI of the “International Convention for the Prevention of Pollution from Ships” that includes new ship energy efficiency rules. In 2018, China’s Ministry of Transport issued the “implementation plan for a ship air pollutant emission control zone”. The successive promulgation of laws and regulations shows that the concept of “green shipping” is being widely considered at all levels in China. The implementation of green shipping can effectively control pollution emissions and achieve environmental friendliness. Therefore, the purpose of this paper is to study the coupling changes of green shipping and economic growth in China, explore the mutual coordination between the two in the development process, provide countermeasures and suggestions for the sustainable development of green shipping and the economy in China, and explore the road of green transformation of the shipping industry in the future.

2. Literature Review

At present, research on the coupling coordination and development of green shipping and economic growth is relatively limited, as more research adopts the perspective of green shipping or examines the coupling and coordination of other fields with the economy.

2.1. Ships Reduce Emissions and Consumption

Existing studies have shown that ship deceleration can reduce emissions and consumption and achieve green shipping [4]. Therefore, a large number of studies have examined green shipping from the perspective of ship management. Dedes and Qi [5,6] argued that fuel consumption and exhaust emissions can be reduced by redesigning the ship propulsion system or sacrificing the service level. Elizabeth and Abadie [7,8] found that the installation of scrubbers can adapt to new ship emission regulations. By studying ship and fleet sizes with different market penetration levels, Santos [9] quantified the impact of changes in these parameters on the profits of shipping companies by adopting indicators such as fuel cost, time charter cost, emission control area and installation propulsion power of ships. Ren [10] established a sustainability evaluation standard system for marine alternative fuel and considered hydrogen as the optimal option. Christodoulou [11] believes that in order to improve the energy efficiency of ship operations, slow steaming has a great potential for greenhouse gas emission reductions with a parallel decrease in fuel consumption and related costs for the shipping companies. Tang [12] built an ultrahigh dimensional optimization model of ship energy management, and this evaluation system can strictly meet the requirements and constraints of ports and ships. Vitali [13] proposed a method for coupling meteorological and voyage data that lays a foundation for the more accurate prediction of fuel consumption and emissions.

2.2. Green Port Management

The loading, unloading, handling, storage and distribution of shipping are inseparable from the port, and the docking and navigation activities of ships also produce pollution. Therefore, green port management is central to energy conservation and emission reduction in the shipping industry. Yang [14] believed that the electric tyred gantry crane could have a positive impact on the green construction of international hub ports. He [15] realized the optimal trade-off between time and energy savings by coordinating the scheduling of three kinds of loading and unloading equipment. Aregall [16] argued that green port construction should be carried out through technological improvement, infrastructure development and the formulation of monitoring programs. Correcher [17] proposed a mixed integer linear programming formula and heuristic algorithm that can optimize port berth allocation. Tseng [18] analyzed the factors affecting green ports and believed that environmental regulation and economic leverage were the two most critical. Lam [19] felt that green ports should manage and balance the three bottom lines of economic prosperity, social well-being and environmental quality. Comi [20] considered that the application of liquefied natural gas is a very interesting solution in the port in sea transport, namely the electrification of port docks and liquefied natural gas (LNG). Munim [21] proposed a multicriteria decision-making framework considering five green port management practice indicators.

2.3. Green Shipping Policy Regulation

The global environmental pollution caused by the large number of ships and their exhaust emissions has attracted extensive attention from governments, industry associations and academia, and corresponding regulatory departments and related green shipping policies have emerged at this historical moment. Nadine [22] argued that if no regulatory measures are implemented, carbon dioxide emissions from international shipping, which are currently unregulated, will increase significantly. Lee [23] analyzed the impact of a shipping carbon tax on the global economy and believed that China would suffer the greatest loss in real GDP. Dessens [24] evaluated a global emissions trading scheme for international shipping and believed that this method would reduce CO2 emissions by 65% by 2050. Wang and Shi [25,26] argued that different emission trading systems and marketization measures could be effective for energy conservation and emission reduction. Konstantinus [27] investigated the potential of short sea shipping (SSS) in an African context, identifying the barriers and enablers of SSS to support international trade in the Southern African Development Community region, and highlighting policy initiatives related to SSS development. Hu [28] proposed a method to systematically rank and select different decarbonization technical measures for shipping industry decarbonization. Raze [29] believed that regulatory pressure has generated green innovations that have enhanced the environmental and economic performance of European SSS companies and led to a win–win situation for all parties involved.

2.4. Coupling Coordination between Other Fields and the Economy

The existing literature on the coupling and coordination of green shipping and the economy in China is still limited, as more studies focus on coupling coordination between green innovation, the marine ecological environment and the economy. Ge [30] investigated the regional characteristics, performance differences and spatial effects of coupling coordination between an innovation system and an economic development system in China. Han [31] took Dalian City as an example to measure the coupling coordination mechanism between the gross ecosystem product and the regional economy. Wang [32] studied the spatiotemporal evolution in the coupling coordination of marine with technological, economic and environmental systems in China. Li [33] used the coupling coordination model to evaluate the sustainability of nine central cities in China. Song and Lin [34,35] analyzed the coupling coordination relationship between marine ecology and the economy, believing that the relationship between them has developed from a severe or moderate imbalance to barely balanced.

2.5. Review of Research Status

Reviewing the existing research results, most of the existing research on green shipping only considers unilateral shipping, ignoring that green shipping construction is composed of multiple parts in a real environment. As an important link for China to achieve pollution prevention and promote the construction of an ecological civilization, it is more realistic to consider multiple dimensions of “green shipping” at the same time. In addition, given the high concern about shipping ecology, the question arises as to whether the relationship between green shipping and economic growth is coordinated and whether the relative development degree is balanced.
In view of these considerations, in order to answer the question concerning the relationship between green shipping and economic growth and development in China, this paper takes China as a whole and 11 coastal provinces as the research object. The three dimensions of green channels, green ports and green ships in the green shipping subsystem are considered as well as economic development scale, quality and structure in the economic growth subsystem. By combing the interaction mechanism of the two systems, the weight is calculated by the entropy method and by calculating the coupling coordination index and relative development index, this paper studies the coupling coordination relationship and relative development degree of the two, in order to measure the leading or lagging level of their current development in China. Regional development differences are then explored among the Bohai Rim area, the Yangtze River Delta and the Pearl River Delta. We aim to provide a theoretical basis for the sustainable development of China’s shipping and economy.

3. Methods

3.1. Entropy Weighting

Because each index has different dimensions and units and there are positive and negative points, to evaluate the research object scientifically, referring to the research results of Zhou [36], standardization processing was first carried out and then the entropy value method was adopted to weight the index.
Step 1: Standardize the index:
x i j = { x i j min ( x i j ) max ( x i j ) min ( x i j ) ,   W h e n   x i j   i s   a   p o s i t i v e   i n d e x max ( x i j ) x i j max ( x i j ) min ( x i j ) ,   W h e n   x i j   i s   a   n e g a t i v e   i n d e x
Step 2: Calculate the weight of index j in the region x :
P i j = x i j i = 1 x i j
Step 3: Calculate the information entropy of index j :
E j = 1 ln n i = 1 ( P i j ln P i j )
where n represents the number of index j .
Step 4: Calculate the difference coefficient of index j :
d j = 1 E j
The greater the value of d j , the more important the index is and the higher the contribution to the system.
Step 5: Calculate the weight of the index:
ω j = d j j = 1 d j ,   ω j [ 0 , 1 ] ,   j = 1 ω j = 1  

3.2. Comprehensive Development Index Model

Based on the above index weights, the comprehensive development index model of the green shipping and economic growth subsystem was constructed:
{ f ( x ) = i = 1 ω j X i g ( y ) = i = 1 ω j Y i
T = α f ( x ) + β g ( y )
where f ( x ) and g ( y ) represent the development index of green shipping and economic growth subsystems, respectively; X i and Y i are the standardized values of each index under the system, and T is the comprehensive system development index. Since both are equally important in the development process, α = β = 1 / 2 .

3.3. Coupling Coordination Model of the Comprehensive System

Based on the research of Ge [30], a coupling coordination model was introduced to measure the coordination degree between green shipping and economic growth in the development process:
C = 2 f ( x ) · g ( y ) [ f ( x ) + g ( y ) ] 2 ,   C [ 0 , 1 ]
D = C · T ,   D [ 0 , 1 ]
where C represents the coupling degree of the system between green shipping and economic growth, and D represents the coupling coordination degree of the system. The greater the value of D is, the more coordinated the development of the system is.

3.4. Relative Development Degree Model

Referring to the research of Sun [37], the relative development degree model was introduced to measure the development status of green shipping and economic growth:
H = f ( x ) g ( y )
where H represents relative development.
According to the above model and with reference to the ranking results of Shu and Zhang [38,39], the coupling coordination classification standard and coordinated development type between green shipping and economic growth are shown in Table 1.
This section introduces the entropy method, coupling coordination index model and relative development index model to be used in the following article, and defines the classification standard and coordinated development type between green shipping and economic growth.

4. Construction of a Green Shipping and Economic Growth Index System

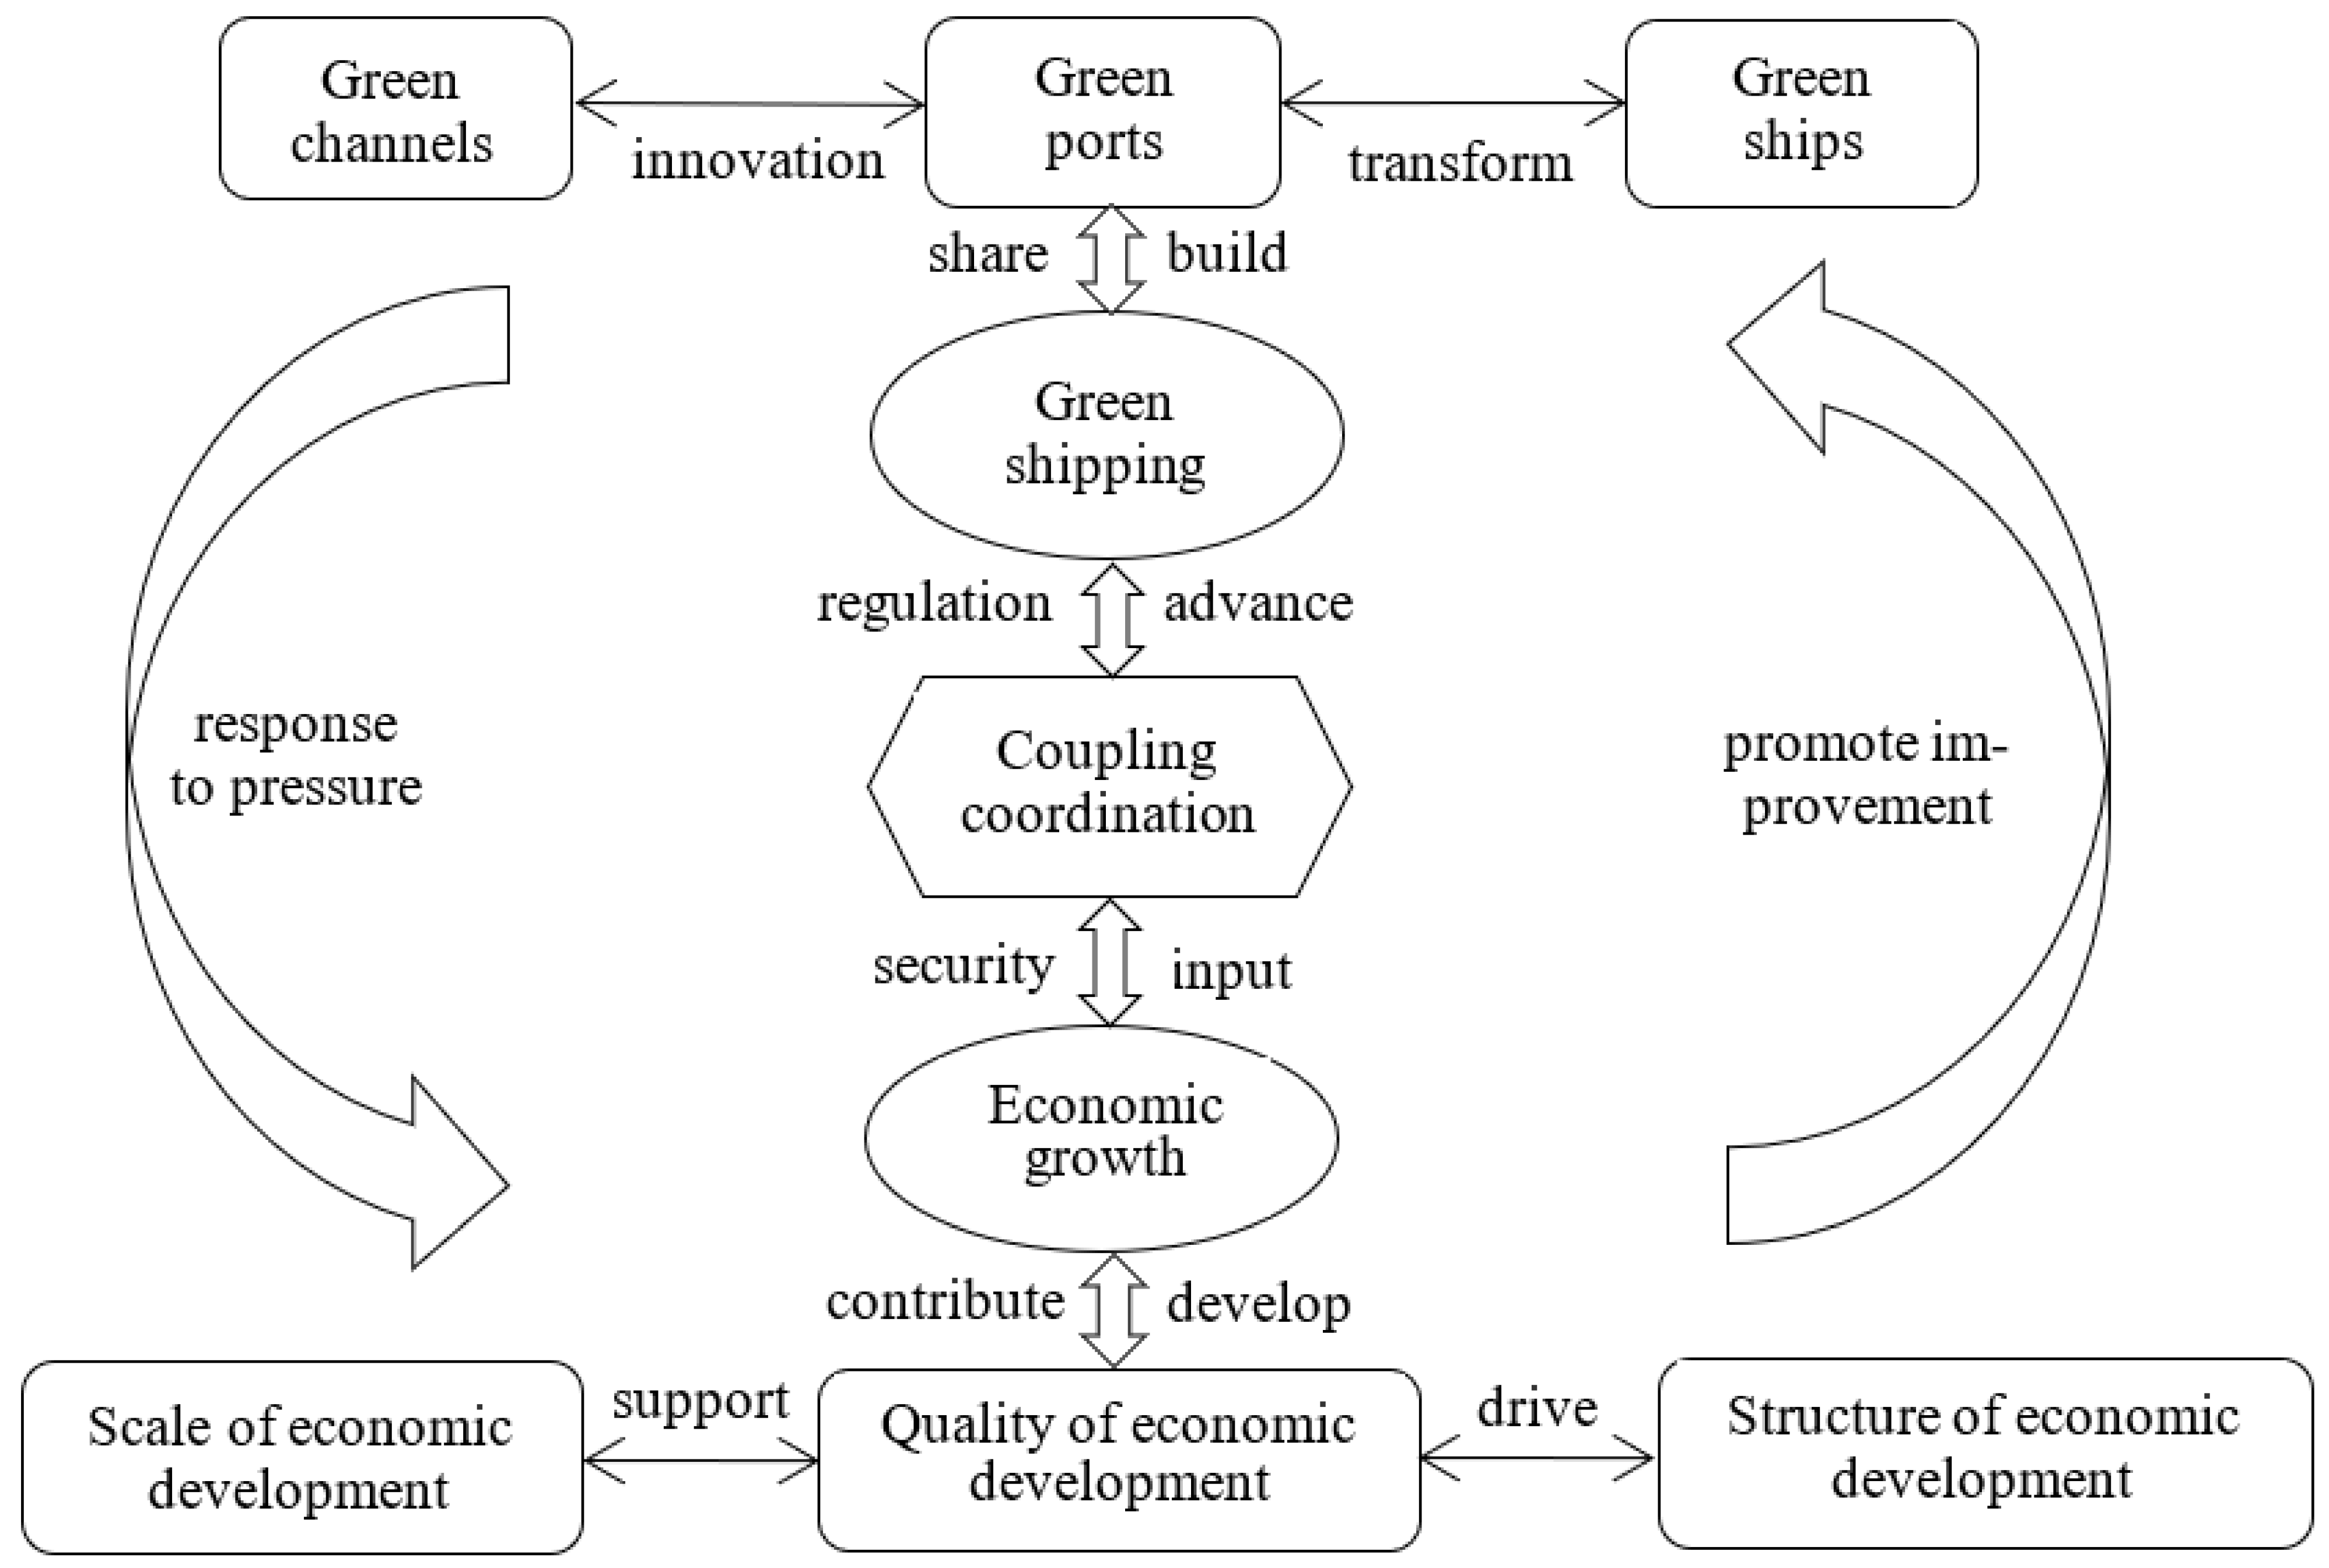
4.1. Mechanism for Coupling Coordination between Green Shipping and the Economic Growth Subsystem

With the increasing importance of environmental protection, energy conservation and emissions reduction in production and life, it is unreasonable to solely consider the economic output benefits when constructing green shipping and economic growth subsystems; these should be comprehensively formulated according to the actual situation. Therefore, this paper constructs a green shipping subsystem considering three elements: green channels, green ports and green ships [40]. With reference to studies on the coupling coordination of ecosystems, port logistics, regional logistics, high-quality marine development and economic growth by Wang, Song, Li and Liu [41,42,43,44], the economic growth subsystem was also constructed considering three aspects: economic development scale, quality and structure.
In the process of developing green shipping, due to environmental regulations requirements, additional investment is needed to improve ships, develop ports and optimize waterways. On the one hand, such investment will bring certain pressure to bear on economic growth, while on the other hand, it can also ensure the high-quality of such economic growth. Economic growth can bring green shipping, and by increasing investment, green shipping will be further promoted. With reference to the research results of Han [31], Wang [32] and Liu [44], the mechanism is shown in Figure 1.

4.2. Index System of Green Shipping and Economic Growth

Based on the above coupling coordination mechanism for the green shipping and economic growth subsystem, following the principle that the indicators must be scientific, systematic, dynamic and generally comparable, this paper selects 15 representative indicators from the three dimensions of green shipping and 10 representative indicators from the three dimensions of economic growth to measure the coupling coordination status of the two systems.
(1)
Index system of green shipping
Since green shipping covers energy conservation and emissions reduction, environmental governance, ecological protection, guarantee measures and input, this paper chooses the following indexes for quantification based on the application of other indicators in relevant literature:
(A)
Green channels
a. Grade channel mileage [40]: advanced navigation mileage of the channel.
b. Proportion of grade channel mileage: the proportion of advanced channel mileage in total channel mileage.
c. Wastewater discharge per unit output value (reverse index) [39,43]: total wastewater discharge/GDP. The lower the index value is, the better the channel’s protection is.
d. Chemical oxygen demand per unit output value (reverse index) [44]: total chemical oxygen demand/GDP. The lower the index value is, the better the channel’s ecological environment is.
e. Investment in waterway environmental protection [43,44]: the total investment of the government in waterway environmental protection.
(B)
Green ports
f. Number of berths in newly built and reconstructed (expanded) wharves [41]: to alleviate the lack of port capacity or to solve the need for small berths.
g. New carrying capacity: the port’s annual increase in freight carrying capacity.
h. The proportion of 10,000 DWT berths in production berths [41]: the number of 10,000 DWT berths/the number of production berths. The higher the index is, the stronger the port carrying capacity is, and the higher the current quality is.
i. Port cargo turnover [42]: the cargo transportation volume in the composite unit of weight and distance.
j. Employment in water transport (reverse index) [42,43,44]: a lower index is better, as it indicates the use of green port automation.
k. Investment in water transport construction [44]: the government’s investment in the construction of fixed assets for water transport.
(C)
Green Ships
l. Average net carrying capacity: net carrying capacity/total number of ships.
m. Average ship power [40]: total ship power/total number of ships.
n. Energy consumption of ocean and coastal freight enterprises (reverse index): standard coal consumed by shipping enterprises per thousand tons of nautical miles.
o. The proportion of container throughput in cargo throughput [41,43]: container throughput/port cargo throughput. Because container transport has better cargo integrity, in this paper, the greater the value of this index is, the less pollution from ships.
(2)
Index system of economic growth
Since economic growth covers investment, labor and productivity, we should not only consider the increase in economic aggregate, but also the improvement and optimization of the economic structure and economic quality. Therefore, on the basis of previous studies, this paper selects the following 10 indexes for analysis:
(A)
Scale of economic development
a. Per capita GDP [39,41,42]: GDP/total population.
b. Per capita actual utilization of foreign capital [41]: actual utilization of foreign capital/total population.
c. Per capita fiscal revenue [39]: fiscal revenue/total population.
d. GDP growth rate [44]: %.
(B)
Quality of economic development.
e. Per capita investment in fixed assets [42,43]: total investment in fixed assets/total population.
f. Total retail sales of social consumer goods per capita [41]: total retail sales of social consumer goods/total population.
g. Trade dependence (reverse index) [42,44]: total imports and exports/GDP, which captures the degree to which the economy depends on foreign trade. According to the current situation of China’s foreign trade, the index is defined as a reverse index.
(C)
Structure of economic development
h. The proportion of primary industry (reverse index): added value of primary industry/GDP. According to the current development of China’s primary, secondary and tertiary industries, the index is set as a reverse index.
i. The proportion of secondary industry [43,44]: the added value of secondary industry/GDP.
j. The proportion of tertiary industry [39,43,44]: the added value of tertiary industry/GDP.
A green shipping and economic growth index system was constructed by combing the action mechanism of the two systems in the section. A total of 25 representative indexes were included in the system. The results of the coupling coordination and relative development degree are detailed below.

5. Analysis Results

5.1. Weight Calculation

Due to the great differences in the level of economic development and the late start of green shipping in China, people’s cognition of “green” is relatively weak, and some indexes were not included in the statistical system in the early stage. Studies on the coupling coordination between green shipping and economic growth are also lacking. In order to ensure the comparability of the indexes, this paper selects the data of the 10 years from 2010 to 2019 for measurement.
Data were obtained from the “National Economic and Social Development Statistical Bulletin” published by the National Bureau of Statistics, the Statistical Yearbooks of 11 coastal provinces and cities, and the “China Port Statistical Yearbook”.
According to Formulas (1)–(5), the weight results are shown in Table 2.

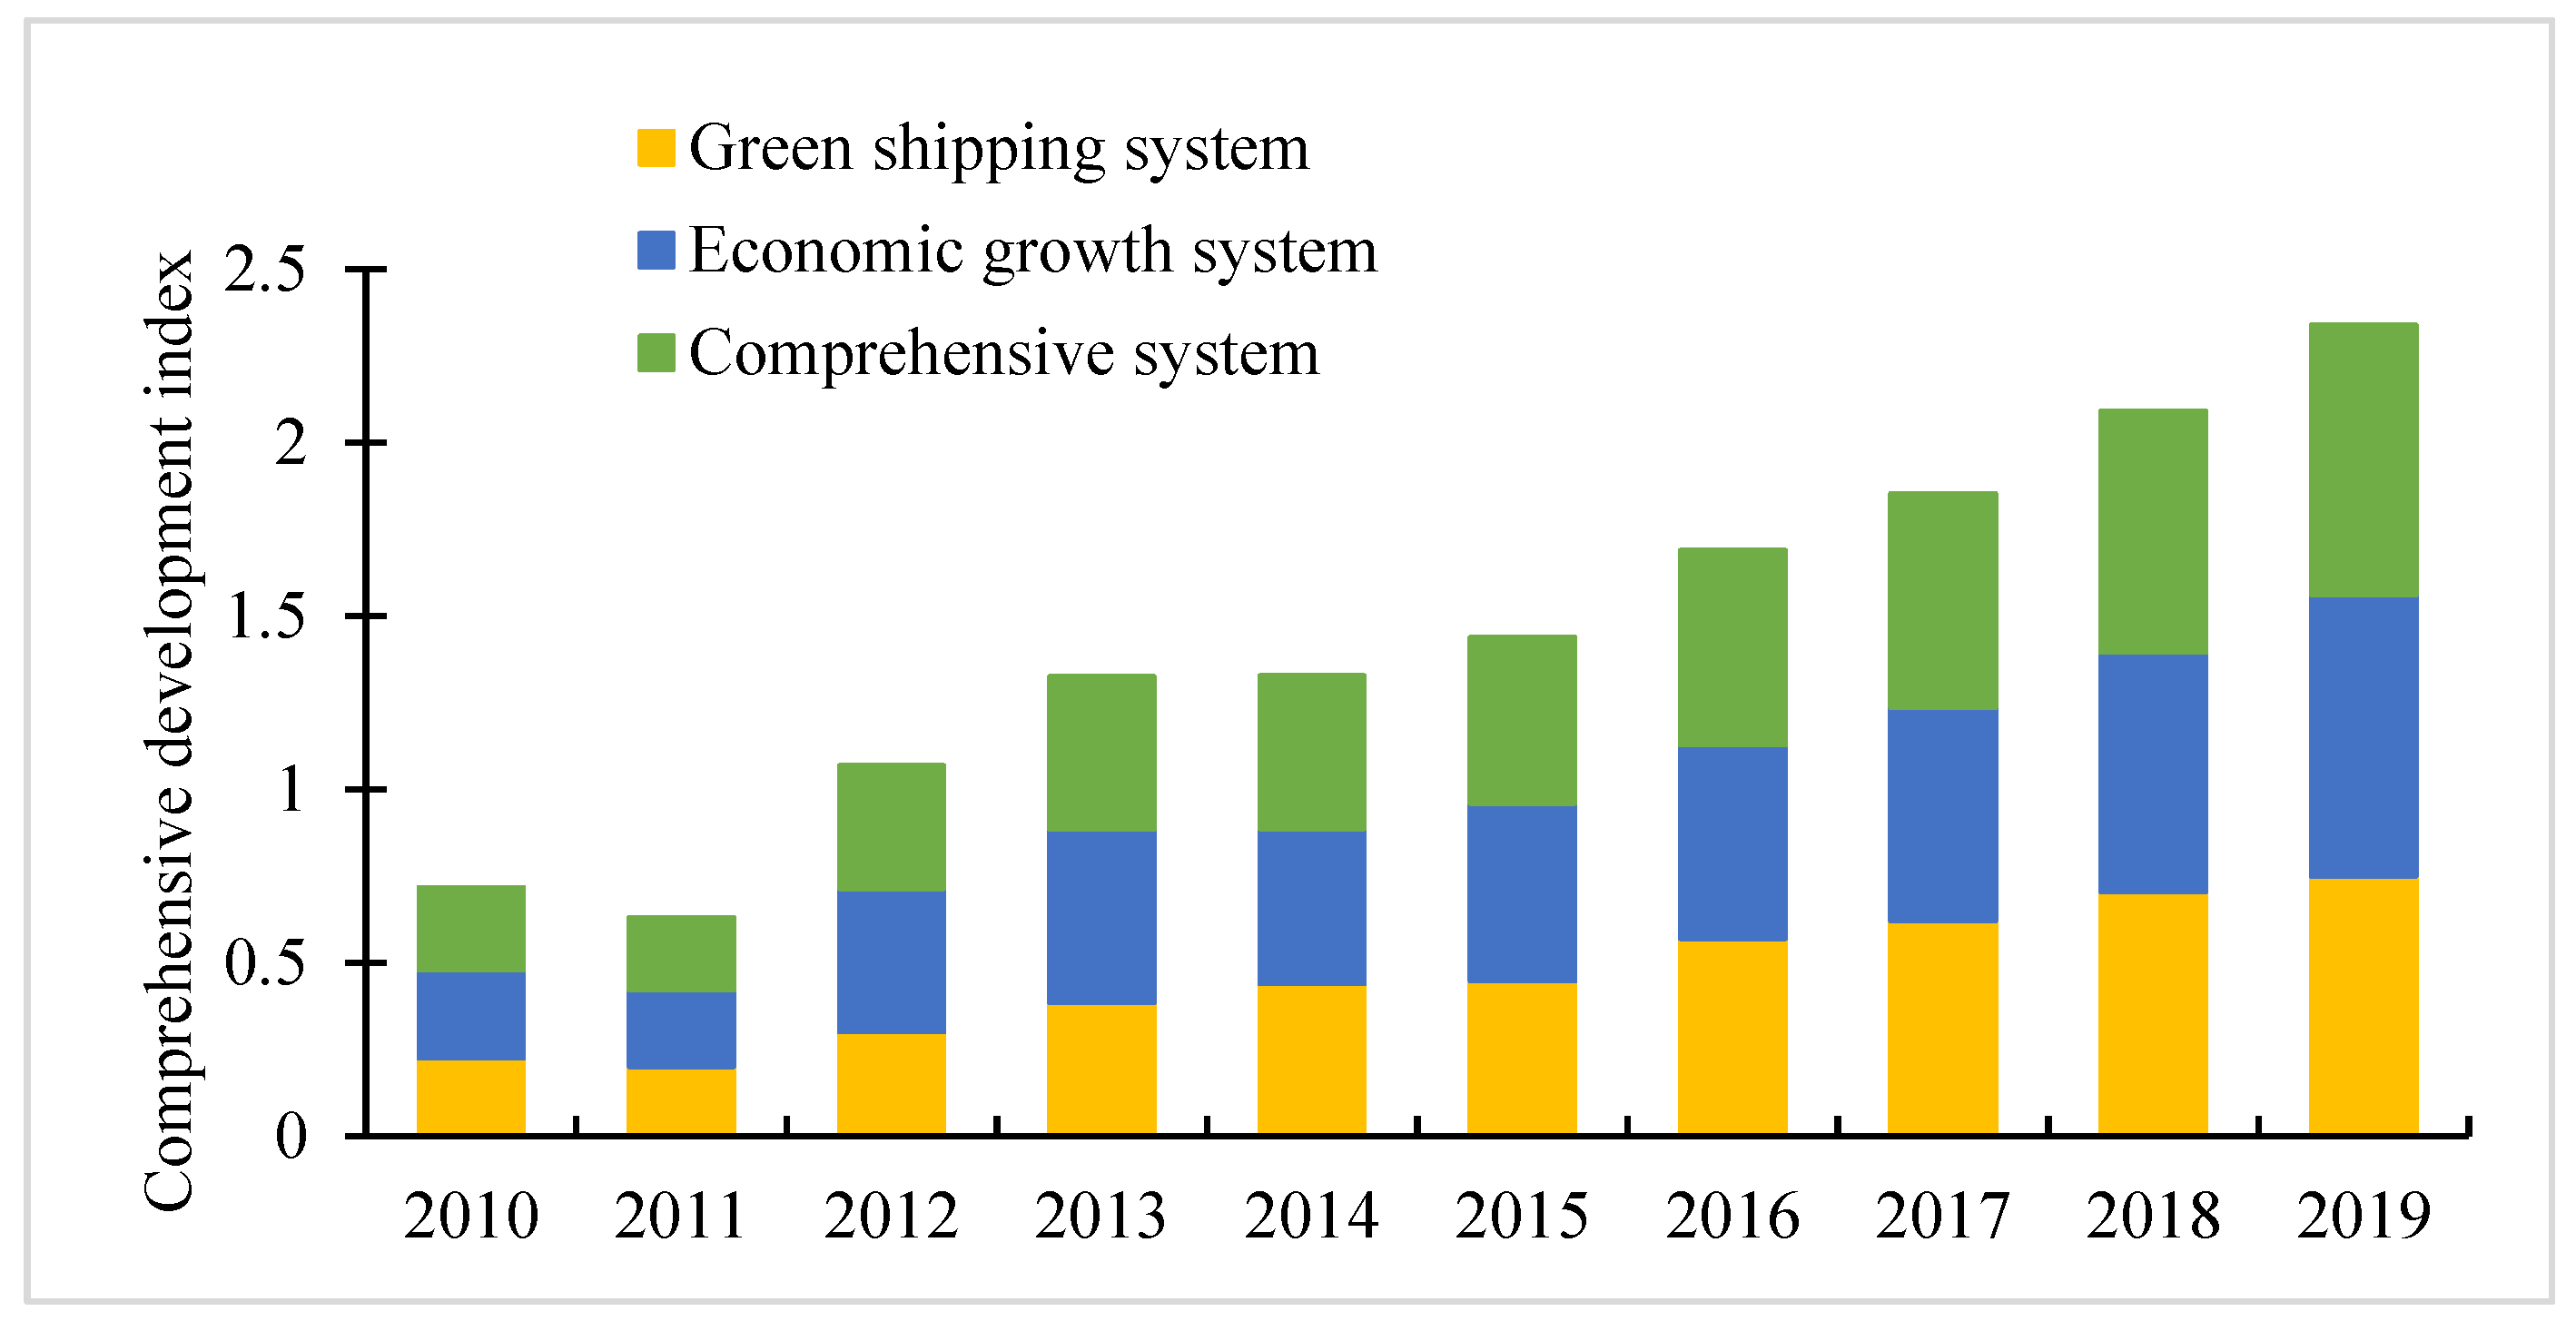
5.2. Comprehensive Development Index Analysis

According to the results calculated by the entropy method above, the system development index of green shipping and economic growth and the comprehensive system development index were obtained using Formulas (6) and (7), as shown in Figure 2.
As shown in Figure 2, during the observation period, the development index of the comprehensive system of green shipping and economic growth maintained an increasing trend, with an average annual growth of 22.56%. Considering the change in the growth rate, the change in the development index had obvious characteristics representing different stages.
From 2010 to 2011, under the continuous impact of the global economic crisis, China’s shipping industry suffered a challenging winter. The development index of the comprehensive system and the two subsystems declined slightly, with declines of 12.1%, 11.1% and 12.6%, respectively. With the improvement of external conditions and the recovery of the macroeconomy, the three development indexes significantly improved in 2011–2014. The growth rate of the economic growth subsystem was significantly higher than that of the green shipping subsystem during this period, which indicates that economic growth contributed more to promote the comprehensive index, while the slow growth of the green shipping subsystem hindered further improvement of the comprehensive system development index. Since 2014, the shipping industry has gradually expanded investment in waterway environmental protection, improved the quality of waterways, improved port infrastructure construction, and optimized ship structures. The development indexes of the two subsystems gradually shrank and began to converge in 2016, and the development index of the comprehensive system entered its second obviously rising stage.
Since the two subsystems are not synchronized in the actual development process, the comprehensive system has a certain degree of disordered evolution. Continuing to explore the coupling coordination relationship between green shipping and economic growth can help to judge and evaluate the harmony and unity in their development process and promote the green and healthy development of the shipping industry.

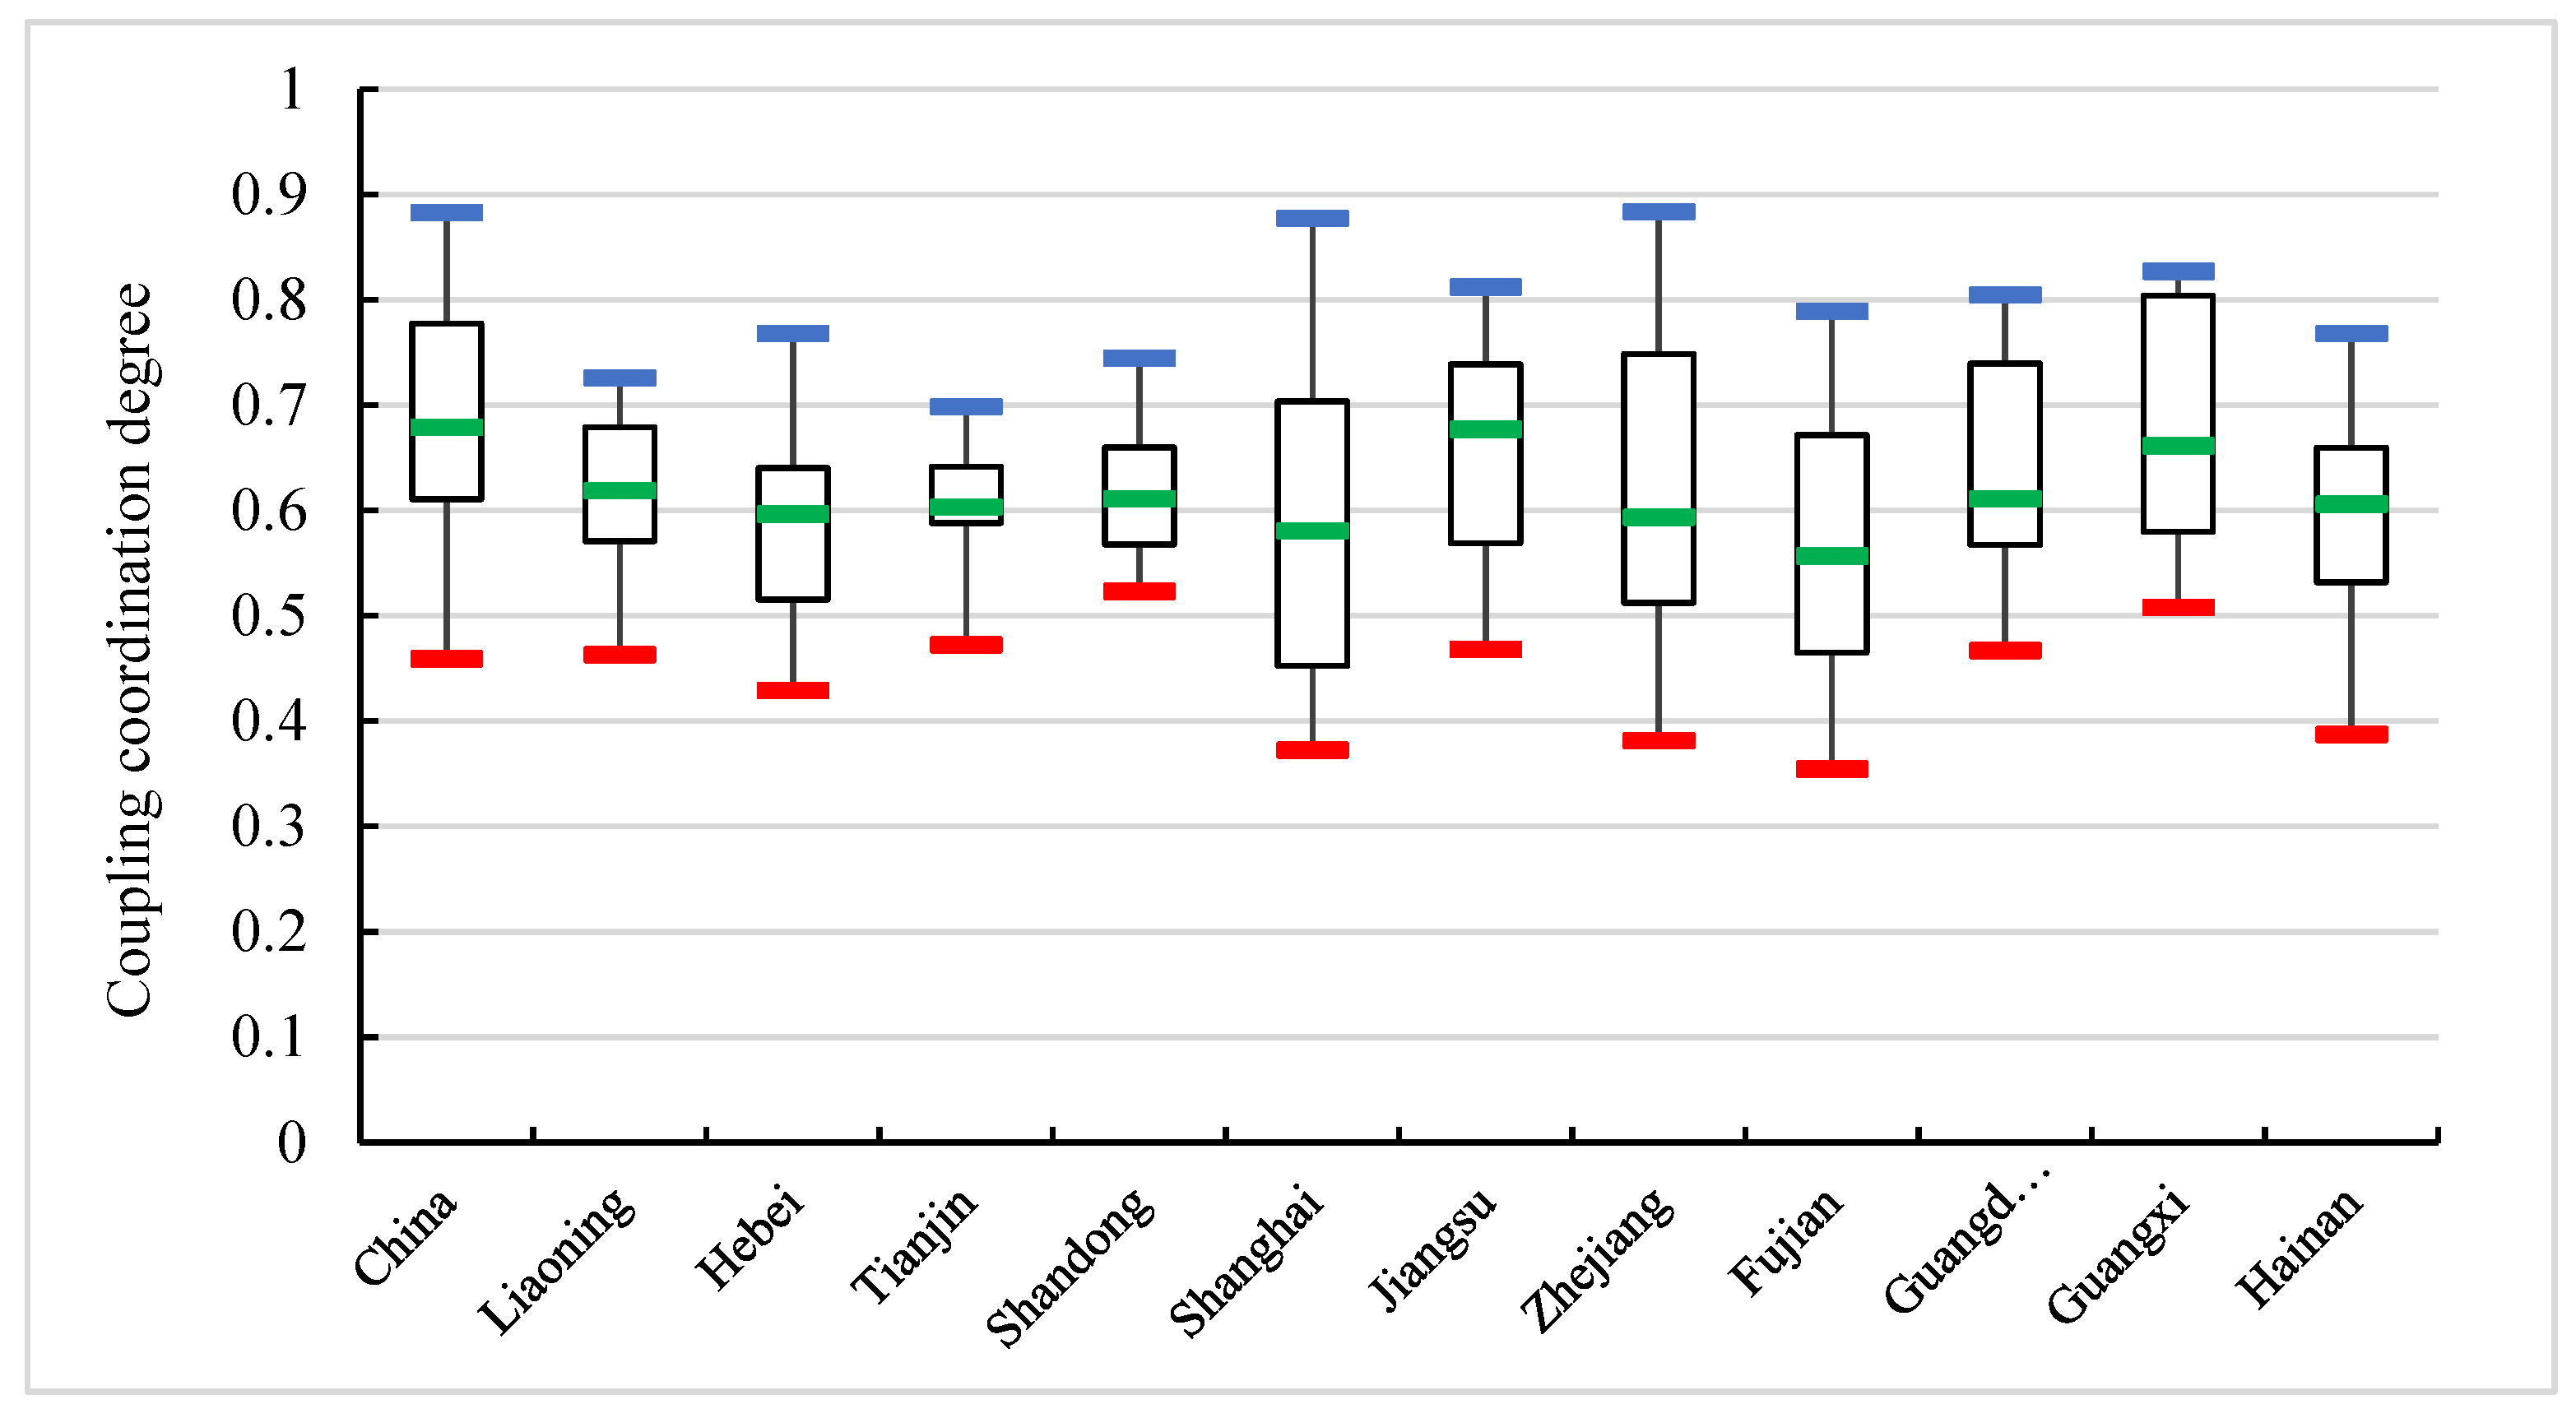
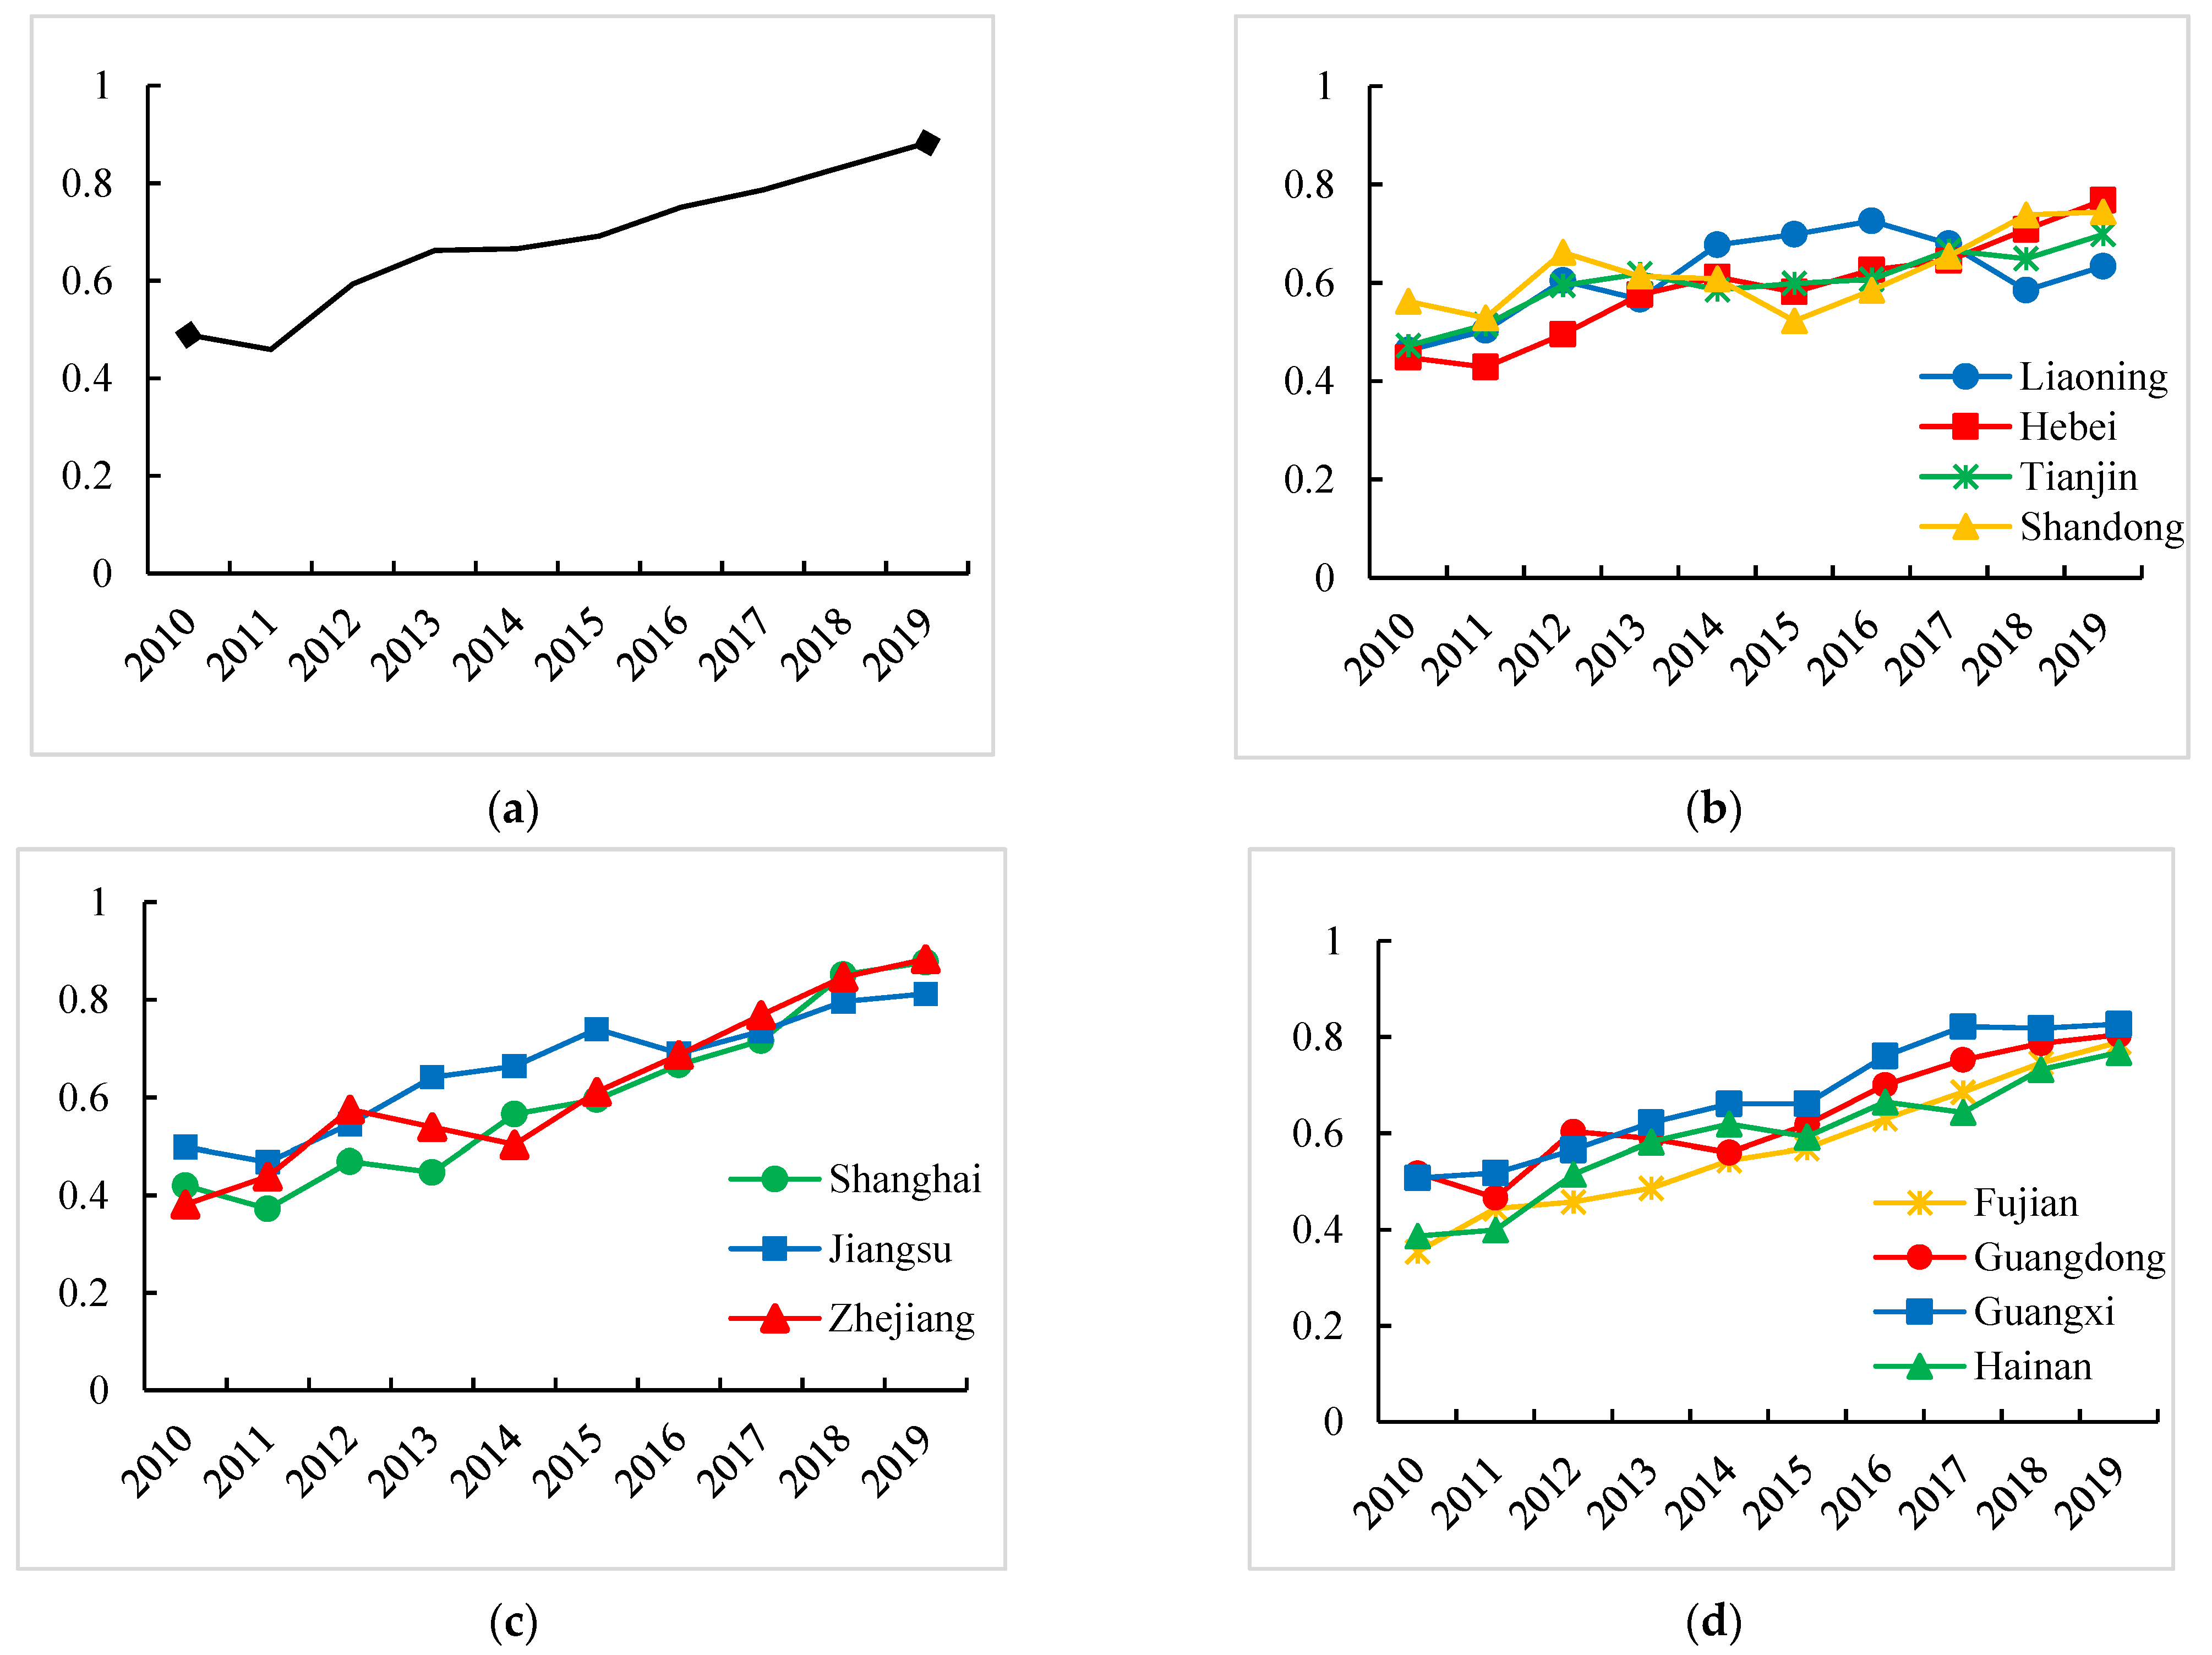
5.3. Analysis of Coupling Coordination

Substituting the development index into Formulas (8) and (9), the coupling coordination degree of green shipping and economic growth in China and the 11 coastal provinces can be obtained, as shown in Figure 3 and Figure 4.
Boxplots can not only show the mean level of the coupling coordination degree but also reflect the dispersion of each region during the observation period.
Figure 3 and Figure 4 show that the coupling coordination degree between green shipping and economic growth in China fluctuates and rises, with an average annual growth rate of approximately 8%, from the verge of the maladjustment level in 2010 to a good coordination level in 2019. Considering the averages, the national level was higher than that of the 11 coastal provinces, reflecting that the overall planning and macro-control forces can better grasp the development direction of the two.
In terms of spatial distribution, the “box” in the Bohai Rim area is short, the range is small, and there is a certain degree of confusion. Taking Liaoning Province as an example, the coupling coordination degree of the comprehensive system showed a sharp decline after reaching a peak value of 0.73 in 2016. The reason for this is that the province’s green shipping system has grown rapidly, but its economic growth has lagged behind, with a sharp decline of 22.4% since 2016. In Hebei, Tianjin and Shandong, the growth rate was slower, and the change was not obvious. In 2019, the annual growth rate of the comprehensive system was only 7.1%, 4.8% and 3.2%, respectively. The main reason for this is that the overall economic growth level of the region is slow, which lowers the comprehensive coordination of the whole period.
In the Yangtze River Delta, Shanghai and Zhejiang have the longest “box”, which indicates that their coordinated development level was low and coordination was poor in the early stage; however, they developed rapidly in the middle stage, and all the indicators had reached a high level in the most recent period. In 2019, the coupling coordination degree in the two provinces reached 0.88, equal to that of the whole country. The coupling coordination mean of Jiangsu Province was the highest (0.66), which is close to the national level, and its range was small (0.34), indicating that it was at a good coordination level. Mainly due to the developed shipping conditions and numerous ports in the province, green shipping and economic growth basically maintain a high degree of synchronization in the Jiangsu Province.
The Pearl River Delta region had the most similar development trend between provinces, basically maintaining a growth trend and reaching a peak in 2019. Among them, Fujian Province had the largest increase, with a range of 0.43, and Guangxi saw the smallest increase, with a range of 0.32. The average value of Guangdong was 0.64, slightly lower than that of Jiangsu, mainly due to the poor performance of some economic growth indicators. Although Hainan’s annual growth rate has reached 9.8%, the overall coordination level of its comprehensive system is relatively low, the benefit of green shipping is not obvious, and its economic growth level needs to be improved.
It should be pointed out that in the last five years of the observation period, except for the Liaoning Province, increases in the coupling coordination of varying degrees occurred in China and in the other 10 provinces and cities, and all reached a peak value in 2019. Therefore, it can be inferred that China generally and the other coastal provinces discussed are likely to maintain this trend in the future, but there is still room for the coordinated evolution of green shipping and economic growth to a higher level.
To sum up, the coupling coordination between green shipping and economic growth in the three regions shows a rising trend, but there are significant regional differences. During the whole observation period, the highest value in the Bohai Rim was at an intermediate coordination level, which was far behind that in the Yangtze River Delta. In the Yangtze River Delta and Pearl River Delta, the “box” was longer, the range was larger, and the coupling coordination of the comprehensive system had experienced a development level increase from low to high, and the gap between green shipping and economic growth has gradually narrowed. The Yangtze River Delta region has the fastest development speed and as the coupling coordination shows, a greater degree of dispersion. The main reason for this lies in the obvious gap between the economic development levels, the inconsistent degree of coordination, and the wide difference in investment and attention given to green shipping of the three regions. On the one hand, economic development can bring more investment to the shipping industry and improve the efficiency of the innovative use of green shipping technology. On the other hand, the progress of green shipping is the result of healthy economic development, which shows that China not only pays attention to economic benefits in the development process, but that it also steadily improves the social and ecological benefits.

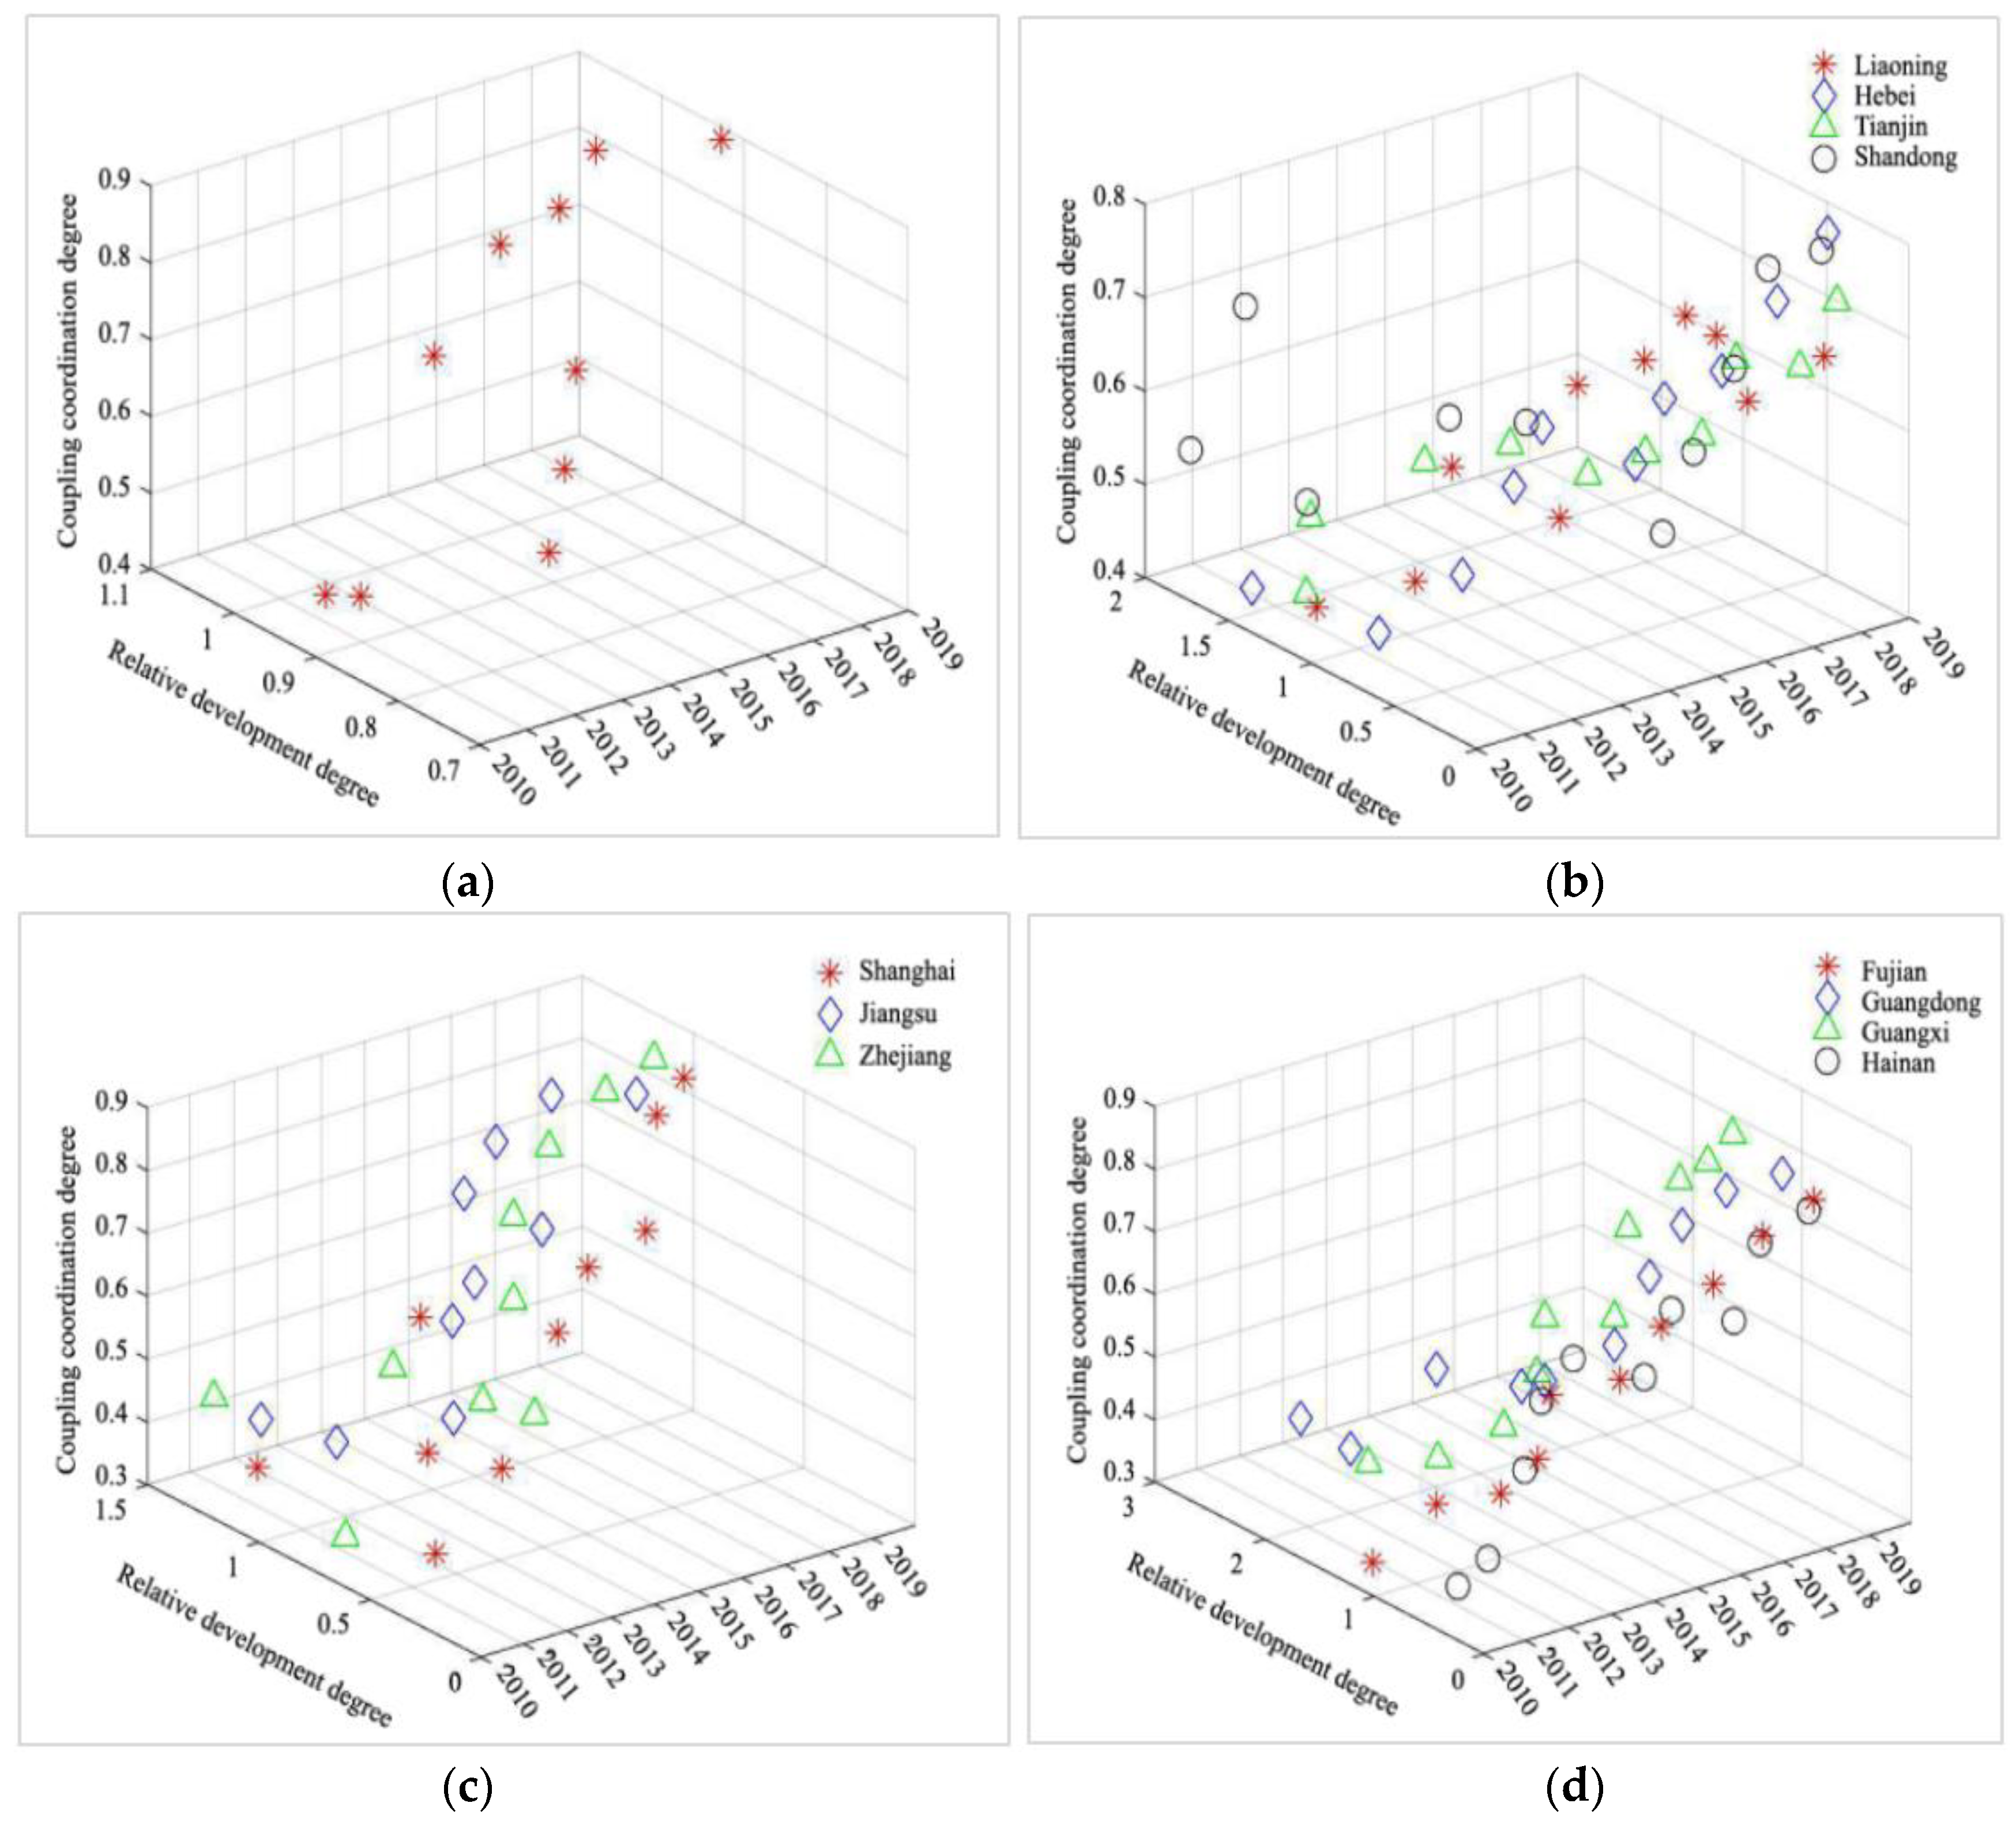
5.4. Analysis of Relative Development

To further explore the internal relationship between green shipping and economic growth, based on the above coupling coordination analysis, the development index was substituted into Formula (10), and the relative development degree of the comprehensive system of China and the 11 coastal provinces was obtained, as shown in Figure 5.
According to the classification criteria in Table 1, it can be seen from Figure 5 that the development types of green shipping and economic growth in China and the 11 coastal provinces are constantly changing.
Macroscopically, the development of green shipping and economic growth in China is relatively stable. Despite the lagging level of green shipping in the early stage, the development in the later stage is relatively consistent and gradually transitions from an antagonistic imbalanced state to a synchronous type in the primary, intermediate and good coordination levels. The main reason for this stability is that it is easier to control the development status of the two at the national level, and the central government can adjust the development strategy in a timely manner so that green shipping and economic growth can promote each other and achieve common progress.
The relative development of green shipping and economic growth in the Bohai Rim area is basically lagging behind the level of green shipping under different coordination states. In Liaoning Province, the H value was less than 0.8 except for 2010, when the H value was 0.96. In the early observation period, the H value of the other three provinces was slightly greater than 0.8. Since 2015, the area has lagged behind in green shipping. This shows that the provinces are paying more attention to economic growth and that the management of green shipping was lax in the later period.
The relative development of green shipping and economic growth in the Yangtze River Delta shows that the three provinces and cities have entered the coordinated development level earlier and are in a state of either synchronous development or with one side leading. For example, the H value of Jiangsu Province from 2014 to 2019 was between 0.81 and 1.30, which places it in a state of synchronization or leading economic growth. The H value of Zhejiang from 2015 to 2019 was between 0.83–1.06, which is at the level of synchronous development. Shanghai entered the synchronous development state slightly later, but the H value was mostly between 0.7 and 0.8, indicating that green shipping has had sufficient progress.
The relative development of green shipping and economic growth in the Pearl River Delta region mainly reflects the large differences in the development level of the provinces. Hainan is consistently lagging behind in green shipping; and after a short period of antagonism, Fujian has also entered the lag level of green shipping. Guangdong has moved from an economic growth lag to a running in or synchronous development level. Guangxi exhibits the most stable development, and it has mostly been in a state of running in or synchronous development. The main reason for this stability is that there are great differences in economic development across the Pearl River Delta region, the starting points for green shipping in the different provinces can be high or low, and the provinces are experiencing different effects of their development strategies.
By comparing the two time points in 2010 and 2019, the development types of green shipping and economic growth in China and in the 11 coastal provinces are shown in Table 3.
In 2010, all areas were in the exploration stage, shipping environmental protection had a mismatch between inputs and outputs, and most areas in China were in a barely coordinated state. By 2019, these same regions were basically transformed into either leading or synchronous development of green shipping and economic growth. The above results show that during the observation period, great changes took place in the driving force of comprehensive system coordination between China and the coastal provinces, reflecting the increasingly close relationship between China’s green shipping and economic growth and an increasing emphasis on green shipping.
Based on the methods in Section 3 and the index system in Section 4, the weight of each index was calculated, and the coupling coordination and relative development of China’s green shipping and economic growth from the aspects of time and space were analyzed in this section.
In general, the relative development evolution trend of green shipping and economic growth in the three regions are relatively synchronous, gradually changing from the antagonistic type in the maladjusted state to the synchronous type in the coordinated state, and this balanced development has been improved qualitatively and has entered a deeper level of coordination. In terms of time, the relative development types of the two were gradually optimized. From the perspective of space, the coordinated development type shows that the Yangtze River Delta is better than the Pearl River Delta, and the Bohai Rim is relatively weak. The main reason for this is that the Yangtze River Delta has strong economic strength, a high level of science and technology, early implementation of green shipping measures, more investment and rapid development. The Pearl River Delta has obvious geographical advantages, and the degree of international cooperation is increasingly strengthened, but the level of coordination needs to be improved. The Bohai Rim has less investment in technological innovation of the shipping industry, lax management, slow economic growth and a lagging response to green shipping, resulting in its relative development level lagging behind the other two regions.

6. Conclusions and Discussion

6.1. Conclusions

By constructing the index system of green shipping and economic growth, this paper uses the coupling coordination model and the relative development model to analyze the change and difference characteristics of the coordinated development of China’s comprehensive system as a whole and of 11 coastal provinces. The conclusions are as follows:
(1) The comprehensive development index of green shipping and economic growth has always maintained a growing trend, but under the influence of the unbalanced development of the two systems, it showed obvious stage characteristics, which were most significant from 2011 to 2014, and there was a certain degree of disorderly evolution.
(2) Due to the slow economic growth in the Bohai Rim, the overall change range of the coupling coordination was small in the whole observation period; moreover, the management of green shipping was relatively lax, leading to a lag level of green shipping under different coordination states for most of the time observed.
(3) In the Yangtze River Delta, Shanghai and Zhejiang have taken proper measures to deal with the coordination relationship between green shipping and economic growth, and the development speed was fast in the middle and late period. Therefore, as the coordination indexes reach a high level, the coupling coordination level of the Jiangsu province remains highly synchronous most of the time. This region has strong economic strength and a high level of science and technology. Green shipping and economic growth have entered into synchronous development or a leading state earlier.
(4) Coupling coordination in the Pearl River Delta region basically maintained an increasing trend and reached a peak in 2019. Fujian saw the largest increase, while Guangxi saw the smallest. The average level of coupling coordination degree in Guangdong was slightly lower than that in Jiangsu. The regional economic development differs greatly, and the coordination was poor. Different development strategies and measures bring different effects, thus leading to a wide gap in the relative development degree of the two.
(5) In 2010 and 2019, it can be found that the coupling coordination of green shipping and economic growth in China and the coastal provinces had entered a higher level from different degrees of imbalance or forced coordination, and the relative development had changed from an antagonistic or lag state to a synchronization or leading state. The driving force of the system coordination has undergone a major change.

6.2. Suggestions

The paper analyzes the coupling coordination and relative development relationship between the green shipping and economic growth systems in China and coastal provinces from the perspective of three regions and a time series evolution. Based on the above conclusions, the paper offers the following suggestions:
(1) In the case of slowing domestic economic growth, attention should be given to the promoting effect of green innovation in the shipping industry, and measures such as reasonable route setting, channel structure optimization, port and shipping alliance development, and ship technology innovation should be taken to broaden the channels of green shipping and to improve the development level of green shipping systems.
(2) A high standard of green shipping policies should be introduced to strengthen ecological environmental protection, monitoring and pollution control. The process of green port construction should be sped up and the supervision of green ships strengthened. It should be noted that most of China’s coastal areas are still lagging behind in green shipping, so it is important to promote the transformation and upgrading of the traditional shipping industry to lay a foundation for the further improvement of green shipping.
(3) Adjust measures to local conditions, highlight strengths and compensate for weaknesses. In each province, the starting point for a green shipping system is different, the level of economic development is different, and the comprehensive system may not be balanced. It is necessary to strengthen the existing advantages in coordination, explore favorable conditions for green shipping, improve weak links, formulate reasonable development strategies, explore the development mode of green shipping with regional characteristics, and promote high-quality coordination in comprehensive systems.

6.3. Discussion

The research of this paper supplements the existing literature on the interaction between green shipping and economic growth in China and provides a theoretical basis for regional shipping and economic sustainable development. However, due to the limitations of knowledge levels and data availability, this paper fails to comprehensively study the development status of green shipping in China, and further scientific selection of indicators needs to be improved. For example, in the construction of the green port indicators, the proportion of renewable energy used in port operation, the change of port fuel emissions, the input–output ratio of port to environmental protection, and the incentive measures of port to shipping enterprises with low emissions and high environmental protection can be included. In the construction of green ship indicators, the speed limit and emissions of ships, the proportion of ships with scrubbers, and the proportion of ships using environmentally friendly fuels are taken into account. The above contents will be further discussed in future research, in order to build a more reasonable green shipping index system.
It is an important research direction for green shipping in the future to explore the driving factors of the green behavior of shipping enterprises, form an effective local development path, and open up the transformation channel of green shipping that recognizes that “clear water and green mountains are golden hills and silver hills” and “clear sea and blue sky are golden hills and silver hills”.
In brief, a good green shipping system is a cornerstone for the further healthy development of the shipping economy. Only by protecting shipping ecology, reducing energy consumption and improving technical efficiency can economic growth truly realize sustainable development and benefit future generations.

Author Contributions

Conceptualization, X.L. and G.D.; methodology, G.D.; software, G.D. and J.C.; formal analysis, X.L.; investigation, J.C.; data curation, G.D. and J.C.; writing—original draft preparation, G.D.; writing—review and editing, X.L.; visualization, J.C.; supervision, X.L. All authors have read and agreed to the published version of the manuscript.

Funding

This research was funded by the Fundamental Research Funds for the Central Universities, grant number 2020ZDPYSK02. The APC was funded by the fund.

Institutional Review Board Statement

Not applicable.

Informed Consent Statement

Not applicable.

Data Availability Statement

Not applicable.

Acknowledgments

The authors wish to thank Quanlong Liu for his support in writing and revising the article and the anonymous reviewers for their suggestions, which were most useful in revising the paper.

Conflicts of Interest

The authors declare no conflict of interest.

References

  1. Lun, Y.H.V.; Lai, K.H.; Daniel, N.C.T.; Wong, C.W.Y.; Cheng, T.C.E. Editorial:researh in shipping and transport logistics. Int. J. Shipp. Transp. Logist. 2011, 3, 1–5. [Google Scholar]
  2. Bao, T.T.; Lian, F.; Yang, Z.Z. Research review of shipping management. J. Traffic Transp. Eng. 2020, 20, 55–69. [Google Scholar]
  3. Zhen, L.; Zhuge, D.; Wang, X.F. Researches on green ports and shipping management: An overview. Syst. Eng. Theory Pract. 2020, 40, 2037–2050. [Google Scholar]
  4. Wang, S.; Meng, Q. Sailing speed optimization for container ships in a liner shipping network. Transp. Res. Part E Logist. Transp. Rev. 2012, 48, 701–714. [Google Scholar] [CrossRef]
  5. Dedes, E.K.; Hudson, D.A.; Stephen, R.T. Assessing the potential of hybrid energy technology to reduce exhaust emissions from global shipping. Energy Policy 2012, 40, 204–218. [Google Scholar] [CrossRef]
  6. Qi, X.T.; Song, D.P. Minimizing fuel emissions by optimizing vessel schedules in liner shipping with uncertain port times. Transp. Res. Part E Logist. Transp. Rev. 2012, 48, 863–880. [Google Scholar] [CrossRef]
  7. Elizabeth, H.L.; Carl, F.R.; Gunnar, S.E. Sulphur abatement globally in maritime shipping. Transp. Res. Part D Transp. Environ. 2017, 57, 303–313. [Google Scholar]
  8. Abadie, L.M.; Nestor, G.; Ibon, G. Adapting the shipping sector to stricter emissions regulations: Fuel switching or installing a scrubber? Transp. Res. Part D Transp. Environ. 2017, 57, 237–250. [Google Scholar] [CrossRef]
  9. Santos, T.A.; Soares, C.G. Methodology for ro-ro ship and fleet sizing with application to short sea shipping. Marit. Policy Manag. 2017, 44, 859–881. [Google Scholar] [CrossRef]
  10. Ren, J.Z.; Liang, H.W. Measuring the sustainability of marine fuels: A fuzzy group multi-criteria decision making approach. Transp. Res. Part D Transp. Environ. 2017, 54, 12–29. [Google Scholar] [CrossRef]
  11. Christodoulou, A.; Woxenius, J. Sustainabitity short sea shipping. Sustainability 2019, 11, 2874. [Google Scholar] [CrossRef] [Green Version]
  12. Tang, R.L.; An, Q.; Xu, F.; Zhang, X.D.; Li, X.; Lai, J.G.; Dong, Z.C. Optimal operation of hybrid energy system for intelligent ship: An ultrahigh-dimensional model and control methods. Energy 2020, 211, 119077. [Google Scholar] [CrossRef]
  13. Vitali, N.; Jasna, P.O.; Soares, G. Coupling voyage and weather data to estimate speed loss of container ships in realistic conditions. Ocean. Eng. 2020, 210, 106758. [Google Scholar] [CrossRef]
  14. Yang, Y.C.; Chang, W.M. Impacts of electric rubber-tired gantries on green port performance. Res. Transp. Bus. Manag. 2013, 8, 67–76. [Google Scholar] [CrossRef]
  15. He, J.L.; Huan, Y.F.; Yan, W.; Wang, S.A. Integrated internal truck, yard crane and quay crane scheduling in a container terminal considering energy consumption. Expert Syst. Appl. 2015, 42, 2464–2487. [Google Scholar] [CrossRef]
  16. Aregall, M.G.; Rickard, B.; Monios, J. A global review of the hinterland dimension of green port strategies. Transp. Res. Part D Transp. Environ. 2018, 59, 23–34. [Google Scholar] [CrossRef]
  17. Correcher, J.F.; Thomas, V.D.B.; Ramon, A.V.; Greet, V.B. The berth allocation problem in terminals with irregular layouts. Eur. J. Oper. Res. 2019, 272, 1096–1108. [Google Scholar] [CrossRef]
  18. Tseng, P.H.; Pilcher, N. Evaluating the key factors of green port policies in Taiwan through quantitative and qualitative approachess. Transp. Policy 2019, 82, 127–137. [Google Scholar] [CrossRef] [Green Version]
  19. Lam, J.S.L.; Li, K.X. Green port marketing for sustainable growth and development. Transp. Policy 2019, 84, 73–81. [Google Scholar] [CrossRef]
  20. Comi, A.; Polomeni, A. Assessing the potential of short sea shipping and the benefifits in terms of external costs: Application to the Mediterranean basin. Sustainability 2020, 12, 5383. [Google Scholar] [CrossRef]
  21. Munim, Z.H.; Friese, H.S.; Dushenkoa, M. Identifying the appropriate governance model for green port management: Applying analytic network process and best-worst methods to ports in the Indian ocean rim. J. Clean. Prod. 2020, 268, 122156. [Google Scholar] [CrossRef]
  22. Nadine, H.; Setareh, K. Accounting for carbon dioxide emissions from international shipping: Burden sharing under different UNFCCC allocation options and regime scenarios. Marine Policy 2011, 35, 682–691. [Google Scholar]
  23. Lee, T.C.; Chang, Y.T.; Paul, T.W.L. Economy-wide impact analysis of a carbon tax on international container shipping. Transp. Res. Part A Policy Pract. 2013, 58, 87–102. [Google Scholar] [CrossRef]
  24. Dessens, O.; Anger, A.; Barker, T.; Pyle, J. Effects of decarbonising international shipping and aviation on climate mitigation and air pollutions. Environ. Sci. Policy 2014, 44, 1–10. [Google Scholar] [CrossRef]
  25. Wang, K.; FuX, W.; Luo, M.F. Modeling the impacts of alternative emission trading schemes on international shipping. Transp. Res. Part A Policy Pract. 2015, 77, 35–49. [Google Scholar] [CrossRef] [Green Version]
  26. Shi, Y.B. Reducing greenhouse gas emissions from international shipping: Is it time to consider market-based measures? Mar. Policy 2016, 62, 123–134. [Google Scholar] [CrossRef]
  27. Konstantinus, A.; Zuidgeest, M.; Cristodoulou, A. Barriers and Enablers for Short Sea Shipping in the Southern African Development Community. Sustainability 2019, 11, 1532. [Google Scholar] [CrossRef] [Green Version]
  28. Hu, H.T.; Yuan, J.; Nian, V. Development of a multi-objective decision-making method to evaluate correlated decarbonization measures under uncertainty-The example of international shipping. Transp. Policy 2019, 82, 148–157. [Google Scholar] [CrossRef]
  29. Raza, Z. Effects of regulation-driven green innovations on short sea shipping’s environmental and economic performance. Transp. Res. Part D Transp. Environ. 2020, 84, 102340. [Google Scholar] [CrossRef]
  30. Ge, P.F.; Han, Y.N.; Wu, X.X. Measurement and evaluation of the coupling coordination between innovation and economic development in China. Quant. Tech. Econ. Res. 2020, 10, 101–117. [Google Scholar]
  31. Han, Z.L.; Zhao, Y.Q.; Yan, X.L.; Zhong, J.Q. Coupling coordination mechanism and spatial-temporal relationship between gross ecosystem product and regional economy: A case study of Dalian. Econ. Geogr. 2020, 40, 1–10. [Google Scholar]
  32. Wang, Y.S.; Li, Y.H.; Jie, X.M.; Li, Y.L.; Li, G.J.; Wang, W.T. Coupling between marine technology, economy and environment systems in China. China Popul. Resour. Environ. 2020, 30, 168–176. [Google Scholar]
  33. Li, W.W.; Yi, P.T. Assessment of city sustainability-coupling coordinated development among economy, society and environment. J. Clean. Prod. 2020, 256, 120453. [Google Scholar] [CrossRef]
  34. Song, M.L.; Pan, X.F.; Pan, X.Y. Sustainable Marine Resource Utilization in China: A Comprehensive Evaluation; Elsevier: Amsterdam, The Netherlands, 2019. [Google Scholar] [CrossRef]
  35. Lin, Y.Q. Coupling analysis of marine ecology and economy: Case study of Shanghai, China. Ocean. Coast. Manag. 2020, 195, 105278. [Google Scholar] [CrossRef]
  36. Zhou, D.; Zhou, M.X. Coupling level difference and coupling path of human capital and economic growth in five urban agglomerations. Stat. Decis. 2020, 20, 67–71. [Google Scholar]
  37. Sun, J.F.; Li, S.T.; Ji, X.M.; Qin, W.S.; Wang, F.X. Evaluation and optimization of coordinated development of cultural resources and tourism industry in Shandong Province. Econ. Geogr. 2019, 39, 207–215. [Google Scholar]
  38. Shu, X.L.; Gao, Y.B.; Zhang, Y.X.; Yang, C.Y. Study on the coupling relationship and coordinated development between tourism industry and ecological civilization city. China Popul. Resour. Environ. 2015, 25, 82–90. [Google Scholar]
  39. Zhang, X.; Bai, F.C. Study on the coupling relationship between marine resources environment system and marine economic system in Guangdong Province. Ecol. Econ. 2018, 34, 75–80. [Google Scholar]
  40. Zhan, B.; Lu, Y.C. Design of comprehensive evaluation index system for green shipping development in Hubei Province. Water Transp. Manag. 2017, 39, 24–28. [Google Scholar]
  41. Wang, J.; Deng, Y. Relationship of coupling coordination between port logistics and direct hinterland economy: A case study on nine seaport-type national logistics hubs. J. Ind. Technol. Econ. 2020, 11, 62–68. [Google Scholar]
  42. Song, A.H. Evaluation of coordination degree between regional logistics industry and economic development. Stat. Decis. 2020, 16, 126–129. [Google Scholar]
  43. Li, J.Y.; Chen, X. Research on the coupling coordinating relationship of marine economy, marine science and technology innovation and marine ecological environment in coastal areas of China. Ocean. Dev. Manag. 2020, 10, 56–61. [Google Scholar]
  44. Liu, B.; Long, R.Y.; Zhu, C.G.; Sun, X.X.; Pan, K.Y. Comprehensive measurement of the index system for marine economy high-quality development in Jiangsu Province. Econ. Geogr. 2020, 40, 104–113. [Google Scholar]
Figure 1. Mechanism of green shipping and economic growth subsystem.
Sustainability 13 13901 g001
Figure 2. Comprehensive development index of green shipping and economic growth. Data sources: “National Economic and Social Development Statistical Bulletin” and “China Port Statistical Yearbook” for the relevant years, calculated by formulas.
Sustainability 13 13901 g002
Figure 3. Box plot of the coupling coordination degree between green shipping and economic growth.
Sustainability 13 13901 g003
Figure 4. Line chart of the coupling coordination degree between green shipping and economic growth. Data sources: “National Economic and Social Development Statistical Bulletin”, “China Port Statistical Yearbook” and the statistical yearbooks of the provinces and cities for the relevant years. (a) China, (b) Bohai Rim area, (c) Yangtze River Delta, (d) Pearl River Delta.
Sustainability 13 13901 g004
Figure 5. Relative development degree of green shipping and economic growth. (a) China, (b) Bohai Rim area, (c) Yangtze River Delta, (d) Pearl River Delta.
Sustainability 13 13901 g005
Table 1. Coupling coordination classification standard and coordinated development type between green shipping and economic growth.
Coupling Coordination Degree (D)Coordination TypeRelative Development Degree (H)Development Types
0~0.09Extreme maladjustmentH < 0.8
0.8 ≤ H ≤ 1.2
H > 1.2
Green shipping lags behind
Antagonistic type.
Economic growth lags behind.
0.1~0.19Serious maladjustment
0.2~0.29Moderate maladjustment
0.3~0.39Mild maladjustment
0.4~0.49On the verge of maladjustment
0.5~0.59Grudging coordinationH < 0.8
0.8 ≤ H ≤ 1.2
H > 1.2
Green shipping lags behind.
Running in type.
Economic growth lags behind.
0.6~0.69Primary coordinationH < 0.8
0.8 ≤ H ≤ 1.2
H > 1.2
Green shipping lags behind.
Synchronous type.
Economic growth lags behind.
0.7~0.79Intermediate coordinationH < 0.8
0.8 ≤ H ≤ 1.2
H > 1.2
Green shipping leads.
Synchronous type.
Economic growth leads.
0.8~0.89Good coordination
0.9~1High quality coordination
Table 2. Index weights for the green shipping and economic growth subsystem.
SubsystemDimensionEvaluating IndexWeight
Green shippingGreen channelsGrade channel mileage0.068
Proportion of grade channel mileage0.082
Wastewater discharge per unit output value (−)0.053
Chemical oxygen demand per unit output value (−)0.061
Investment in waterway environmental protection0.082
Green portsNumber of berths in newly built and reconstructed (expanded) wharves0.112
New carrying capacity0.050
The proportion of 10,000 DWT berths in production berths0.070
Port cargo turnover0.048
Employment in water transport (−)0.046
Investment in water transport construction0.050
Green shipsAverage net carrying capacity0.051
Average ship power0.069
Energy consumption of ocean and coastal freight enterprises (−)0.066
The proportion of container throughput in cargo throughput0.091
Economic growthScale of economic developmentPer capita GDP0.104
Per capita actual utilization of foreign capital0.071
Per capita fiscal revenue0.098
GDP growth rate0.143
Quality of economic developmentPer capita investment in fixed assets0.101
Total retail sales of social consumer goods per capita0.106
Trade dependence (−)0.067
Structure of economic developmentThe proportion of primary industry (−)0.077
The proportion of secondary industry0.105
The proportion of tertiary industry0.127
Data sources: ”National Economic and Social Development Statistical Bulletin” and “China Port Statistical Yearbook” for the relevant years; some data are calculated.
Table 3. Development types of green shipping and economic growth in China and in the 11 coastal provinces.
YearDevelopment TypesAreasYearDevelopment TypesAreas
2010Mild maladjustmentGreen shipping lags behindZhejiang, Hainan2019Primary coordinationGreen shipping lags behindLiaoning, Tianjin
Antagonistic typeFujianIntermediate coordinationGreen shipping leadsHebei, Shandon, Fujian, Hainan
On the verge of maladjustmentAntagonistic typeChina, Liaoning, Tianjin, Shanghai, Jiangsu
Good coordinationSynchronous typeChina, Shanghai, Jiangsu, Zhejiang, Guangdong
Economic growth lags behindHebei
Grudging coordinationRunning in typeGuangxi
Economic growth lags behindShandong, GuangdongEconomic growth leadGuangxi
Data sources: “National Economic and Social Development Statistical Bulletin”, “China Port Statistical Yearbook” and statistical yearbooks of the provinces and cities for the relevant years.
Publisher’s Note: MDPI stays neutral with regard to jurisdictional claims in published maps and institutional affiliations.

