Article

Does Shade Impact Coffee Yield, Tree Trunk, and Soil Moisture on Coffea canephora Plantations in Mondulkiri, Cambodia?

1
Department of Forest Botany, Dendrology and Geobiocoenology, Mendel University in Brno, 613 00 Brno, Czech Republic
2
Faculty of Forestry Science, Royal University of Agriculture, Phnom Penh P.O. Box 2696, Cambodia
*
Author to whom correspondence should be addressed.
Sustainability 2021, 13(24), 13823; https://doi.org/10.3390/su132413823
Submission received: 27 October 2021 / Revised: 7 December 2021 / Accepted: 9 December 2021 / Published: 14 December 2021
(This article belongs to the Special Issue Agroforestry and Sustainable Agricultural Production)

Abstract

:
Shade is a natural condition for coffee plants; however, unshaded plantations currently predominate in Asia. The benefits of shading increase as the environment becomes less favorable for coffee cultivation, e.g., because of climate change. It is necessary to determine the effects of shade on the yield of Coffea canephora and on the soil water availability. Therefore, three coffee plantations (of 3, 6, and 9 ha) in the province of Mondulkiri, Cambodia, were selected to evaluate the effect of shade on Coffea canephora yields, coffee bush trunk changes, and soil moisture. Our study shows that shade-grown coffee delivers the same yields as coffee that is grown without shading in terms of coffee bean weight or size (comparing average values and bean variability), the total weight of coffee fruits per coffee shrub and the total weight of 100 fruits (fresh and dry). Additionally, fruit ripeness was not influenced by shade in terms of variability nor in terms of a possible delay in ripening. There was no difference in the coffee stem diameter changes between shaded and sunny sites, although the soil moisture was shown to be higher throughout the shaded sites.

1. Introduction

Coffee is one of the most traded crops, and it has a total yearly consumption of 9 billion kilograms around the world. Coffee available on international markets originates from the species Coffea arabica (arabica) and Coffea canephora (robusta) [1]. Coffee crops are highly sensitive to climate change [2]. Areas suitable for growing coffee are expected to decrease by 21% in Ethiopia [3] and by more than 90% in Nicaragua under global warming [4]. Arabica crops have already declined in the Tanzanian highlands and India under increasing temperatures [5,6]. In the face of climate change, robusta is more adaptable than arabica and able to thrive in warmer and lower land conditions [7]; however, it is more susceptible to low temperatures than arabica [8]. The optimum mean annual temperature range for arabica (18−23 °C) is lower than that for robusta (22−26 °C) [7]. Robusta is popular in blends; it is used to produce instant coffee [7] and it can be grown successfully from sea level to an elevation of 1400 m [7]. Arabica trees are generally less vigorous and productive and have higher production costs than robusta trees; however, arabica is a higher-quality beverage and dominates the high-quality specialty coffee market [9,10]. For both species, a short dry period lasting 2–4 months, corresponding to the quiescent growth phase, is important for triggering flowering [11]. The roots of robusta coffee are shallower [8]; thus, it is less tolerant of dry conditions than arabica but grows well in soils that are wetter and shallower. In each case, changes in the prevailing climatic conditions will have a significant effect on the condition of the arabica and robusta coffee plants and the prevalence of pests and diseases [7].
Similar to arabica coffee trees, robusta trees have a natural adaptation to shade because the species originates from the understory of African forests [8]; therefore, growing coffee in agroforestry systems naturally brings many benefits. Coffee agroforestry systems promote the conservation of natural resources, landscape diversity [12] and biodiversity [13,14]. Moreover, trees in agroforestry systems mitigate excess carbon [15], are sources of economic diversification by providing fuel wood, timber or fruits, and protect the soil [8,16]. Although tree species diversity in agroforestry coffee plantations was lower than that in forest reserves [17], agroforestry coffee plantations are still areas of greater diversity than monocultural plantations or other agricultural land. Moreover, shaded plants can avoid heat stress and high light intensity [18]. Shading reduces the mean air and soil temperatures and increases the air humidity; furthermore, the soil temperatures fluctuate more markedly in non-shaded areas [19]. Shade trees may compete with coffee for resources such as light, water, and soil nutrients [20]. Our prior research [19] reported that the soil conditions were drier at the beginning and end of the dry season in the shaded areas. Although water supply is important for coffee production, it is difficult to know how future changes in rainfall patterns will impact coffee production because consolidated models of rainfall changes have a high degree of uncertainty [21].
One of the reasons why farmers changed agroforestry coffee plantations to monoculture ones was the incidence of diseases. The occurrence of the coffee berry borer and coffee leaf rust in coffee crops in agroforestry plantations highlights the benefits of monoculture coffee planting, which enables higher chemical inputs and pruning and high coffee plant density [13,22]. However, a consensus has not been reached on the higher incidence of these diseases in agroforestry coffee plantations, with some authors indicating that the coffee leaf rust incidence decreased with increasing shade and others recommending intermediate levels of shading [23,24,25], whereas other studies did not detect any interdependence between coffee leaf rust and shade [26,27,28].
An increase in production is another reason for reducing agroforestry coffee areas. The effect of shade on coffee quality has been widely documented for arabica coffee and appears to be highly site-dependent [29]. Some studies [30,31] reported that arabica coffee shrubs grown in agroforestry produce lower yields than those grown under full sun. Intense light has been shown to reduce fruit loads and cause lower yields because of longer internodes, fewer fruiting nodes, lower flower induction, and larger bean size [32,33,34]. On the other hand, arabica coffee grown under shade (60%) gave a higher yield (419 kg ha−1) than sun-grown coffee (259 kg ha−1) [35]; shade cover between 23% and 38% had a positive effect on arabica coffee yield and increasing yield could be maintained with cover up to 48%, while production may decrease under shade cover >50% [12]. The optimal cover percentage for high yields from arabica was between 30 and 45% [36], and arabica coffee yield was higher in plants grown under shade than in those grown under sun, with the main benefits of shading including higher coffee bean weight, larger beans, higher antioxidant activity, higher total phenolic content, and higher chlorogenic acid content [18]. According to the authors of [37], shaded arabica beans are heavier and have a better liquor taste than those developed in direct sunlight. It is assumed that shade delays the ripening of berries and makes it more uniform, thus yielding beans of better quality than sun-grown arabica coffee [35,38,39]. Previous studies have focused on the influence of shade on arabica yield; however, empirical studies on the impact of shade on robusta coffee plants are notoriously few [40].
Agroforestry is seen as an opportunity to maintain the fertility of productive areas in the face of a changing climate; therefore, knowledge of the impact of shading on the yield of robusta coffee is extremely important as decreasing yield is one of the reasons why farmers do not grow coffee within the agroforestry system. On the other hand, changes in coffee stem diameter can indicate if the coffee plant is suffering from a lack of water, which can be caused by water competition with shade trees. For this reason, three coffee plantations were chosen for the investigation, in the province of Mondulkiri, Cambodia. They all grow robusta on both shaded and sunny sites. The main questions of this study were as follows. (i) Is the coffee yield and coffee bean size or weight higher or lower in the shaded parts of the plantations? (ii) Is the size and weight of coffee beans more homogenous in the shade? (iii) Is there any difference in coffee fruit ripeness between shaded and sunny sites? (iv) How does shade influence coffee trunk diameter changes and soil moisture?

2. Materials and Methods

2.1. Study Area Description

This study was carried out on three coffee plantations in Senmonorom Municipality in the province of Mondulkiri, Cambodia (Figure 1). The dominant soil type in all research areas is latosol. The soil texture is clayey throughout the profile [
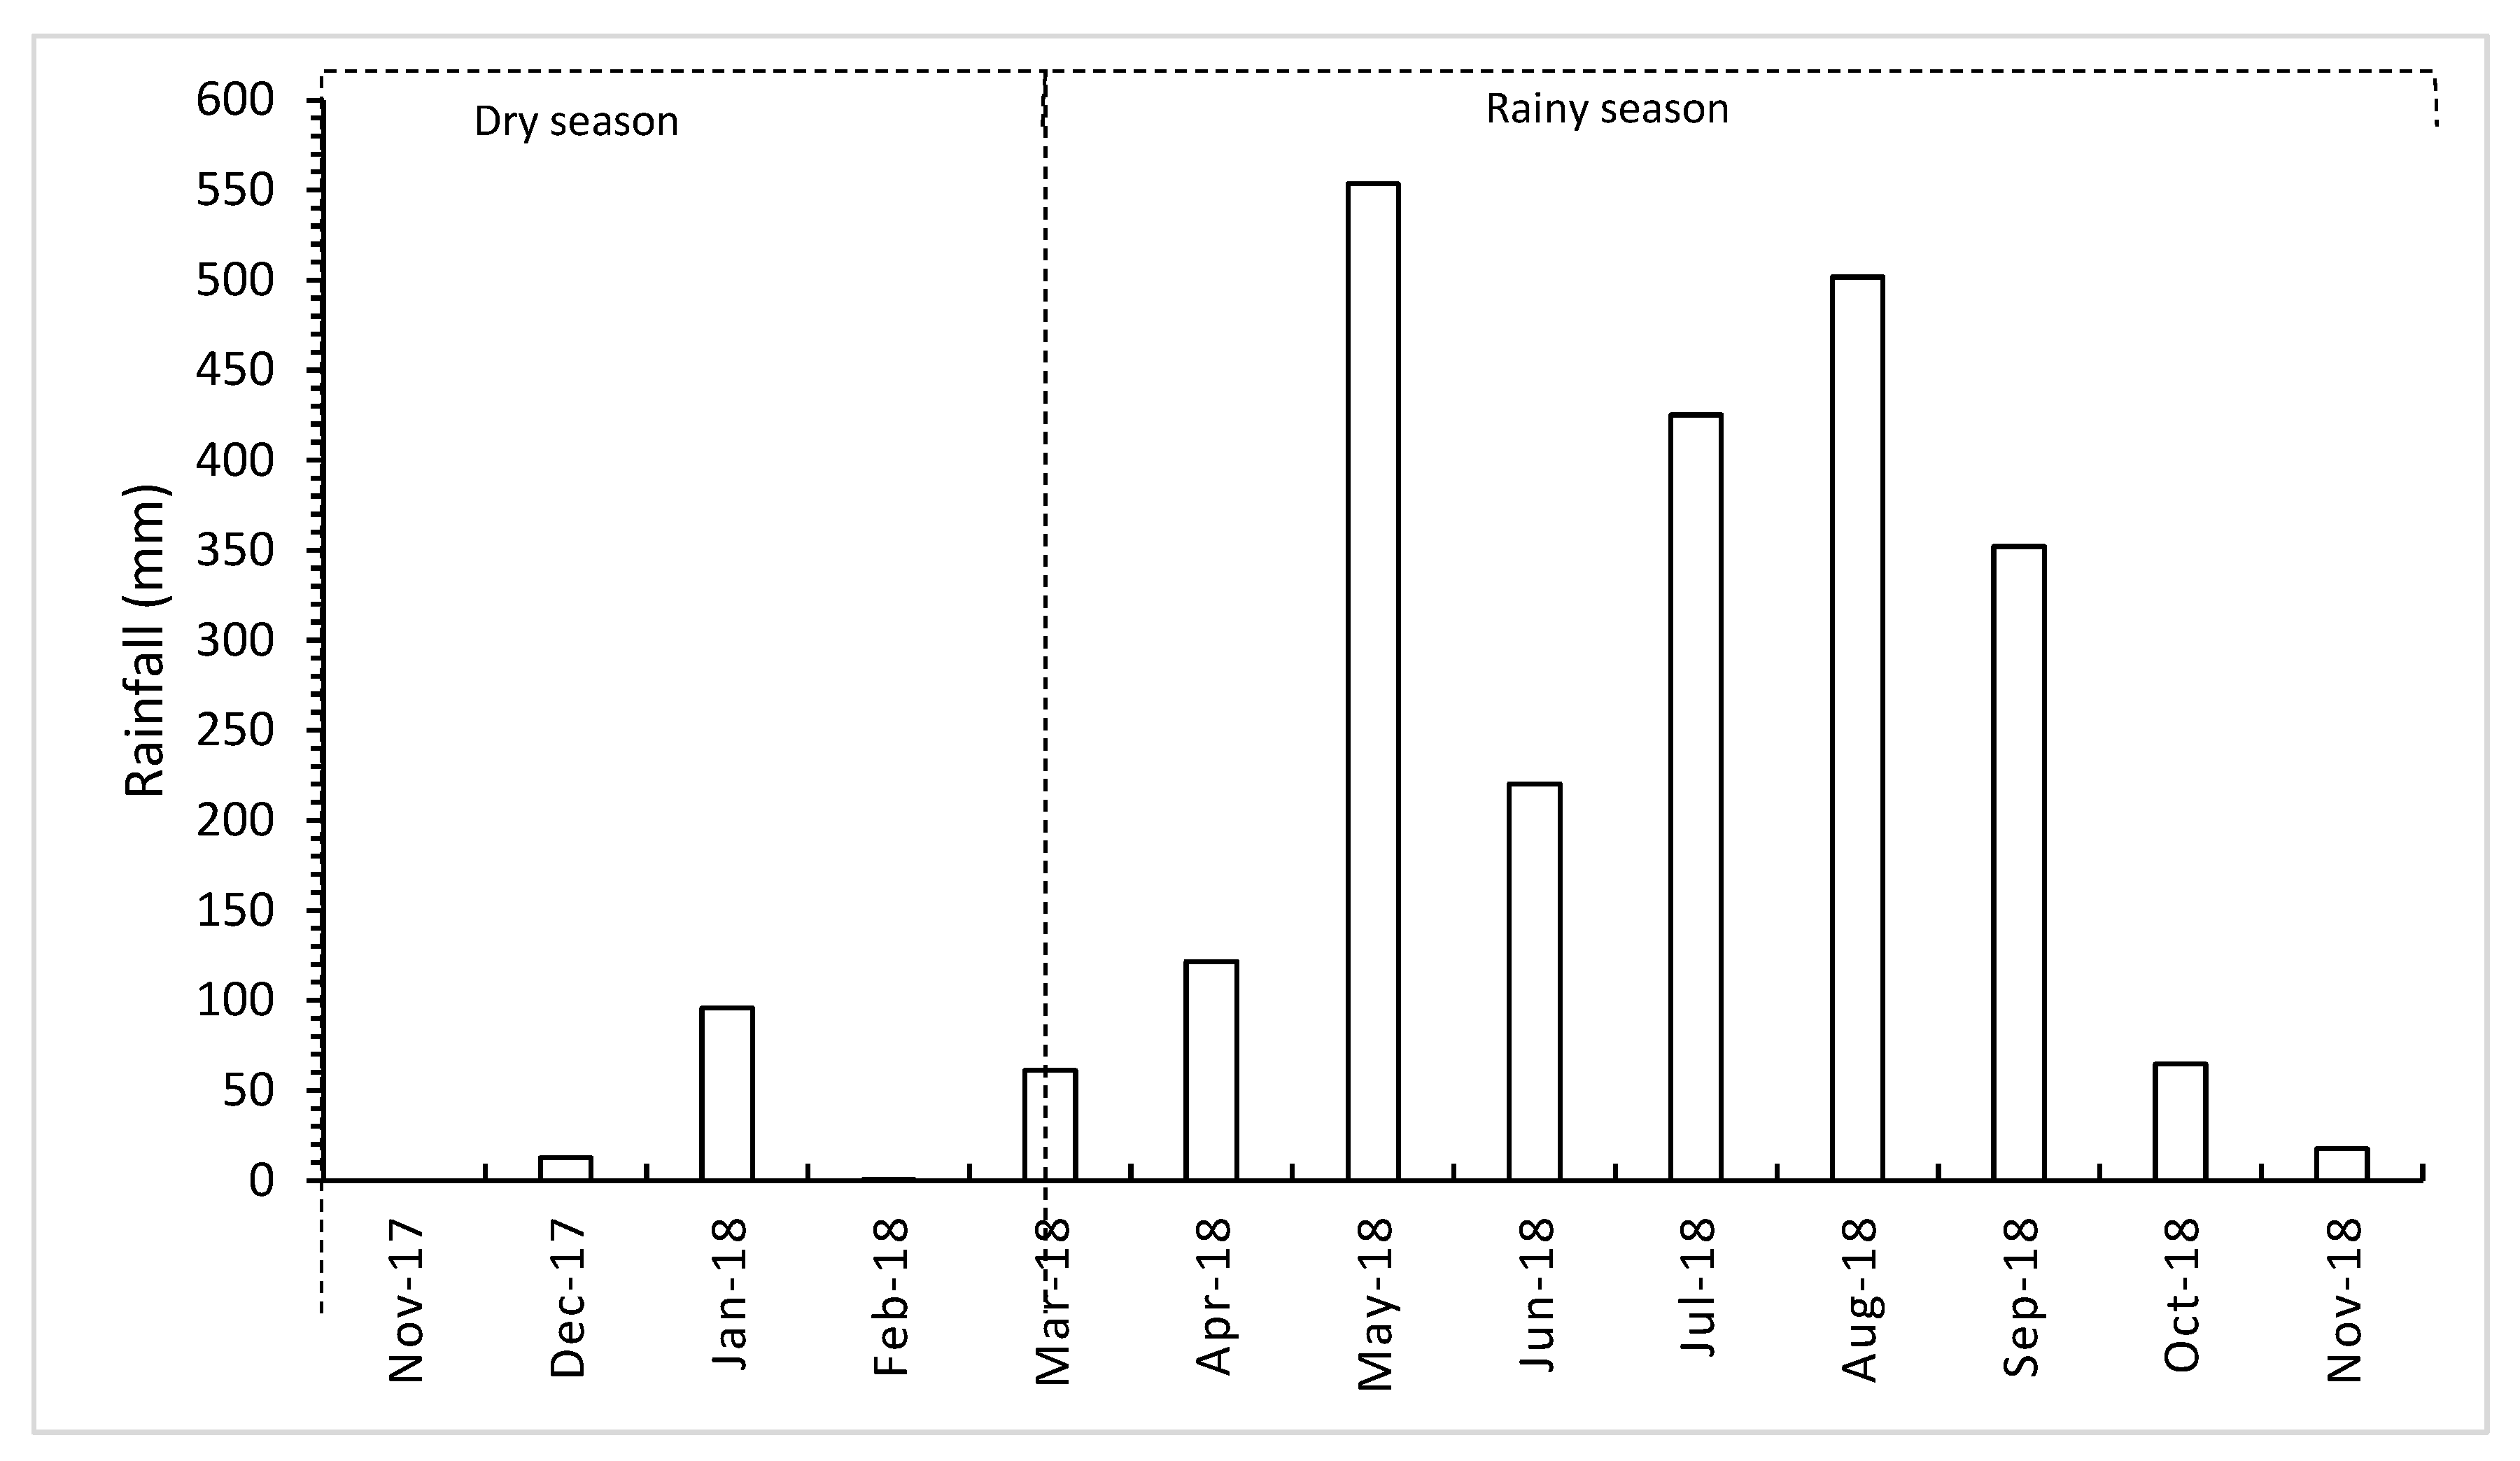
41]. Senmonorom is situated in a tropical climate where the annual mean temperature is 22.9 °C, and the mean annual rainfall is 2203 mm. The highest amount of rainfall occurs in August; the highest temperatures are observed in April, and the lowest temperatures occur in January. According to information collected from coffee growers, the coffee flowering period in the study area generally occurs in March at the end of the dry season and the harvest is in November at the beginning of the dry season.
All three plantations selected for this research grow robusta coffee in monoculture and agroforestry systems. The average altitude of the studied plantations is 700 m above sea level, and the slope on which the coffee plants are grown is 5%. Slope exposure to sunshine is from the southwest. The distance between coffee shrubs was 3 × 3 m in all studied plantations. Shade trees are irregularly distributed on the agroforestry sites, and they are not pruned.
Study Plantation 1 is located 7.2 km northeast of the municipality of Senmonorom (12°29′ N, 107°13′ E). Coffee in this study plot is grown in an area of 3 hectares (ha). The main shade trees in the plantation are lychee (Litchi chinensis Sonn), durian (Durio zibethinus Merr.), and avocado (Persea americana Mill.). The average quantity of shade was 44 ± 21% (mean ± standard deviation). Study Plantation 2 is located 3.5 km northeast of the municipality of Senmonorom (12°28′ N, 107°12′ E). In total, there are 9 ha of coffee plantations. The main shade species in the plantation are banana (Musa spp.), durian, and avocado. The average quantity of shade was 44 ± 13%. Study Plantation 3 is located 3.9 km northeast of the municipality of Senmonorom (12°27′ N, 107°12′ E). Coffee in this study plot is grown in an area of 6.3 ha. The main shade trees in the plantation are cassia tree (Senna siamea (Lam.) Irwin et Barneby) and durian. The average quantity of shade range was 43 ± 16%.
Shaded and sunny sites were selected according to a visual evaluation in the field. Selected study plots in the shaded sites ranged from 20–70% shade. The levels of shade were determined by hemispherical photographs from fisheye photos taken from the center of each coffee measurement plot, on a shaded site at a height of 2 m (using a Canon EOS 550D camera with a Sigma 4.5mm f/2.8 EX DC lens) at the same times that data were collected. The photographs were intentionally underexposed by two stops (−2EVs), as shown by the authors of [42]. Photographs were classified using the IsoData method in ImageJ version 1.48v. Finally, canopy openness values were calculated from each photograph, employing CIMES v9 [43].

2.2. Coffee Measurement

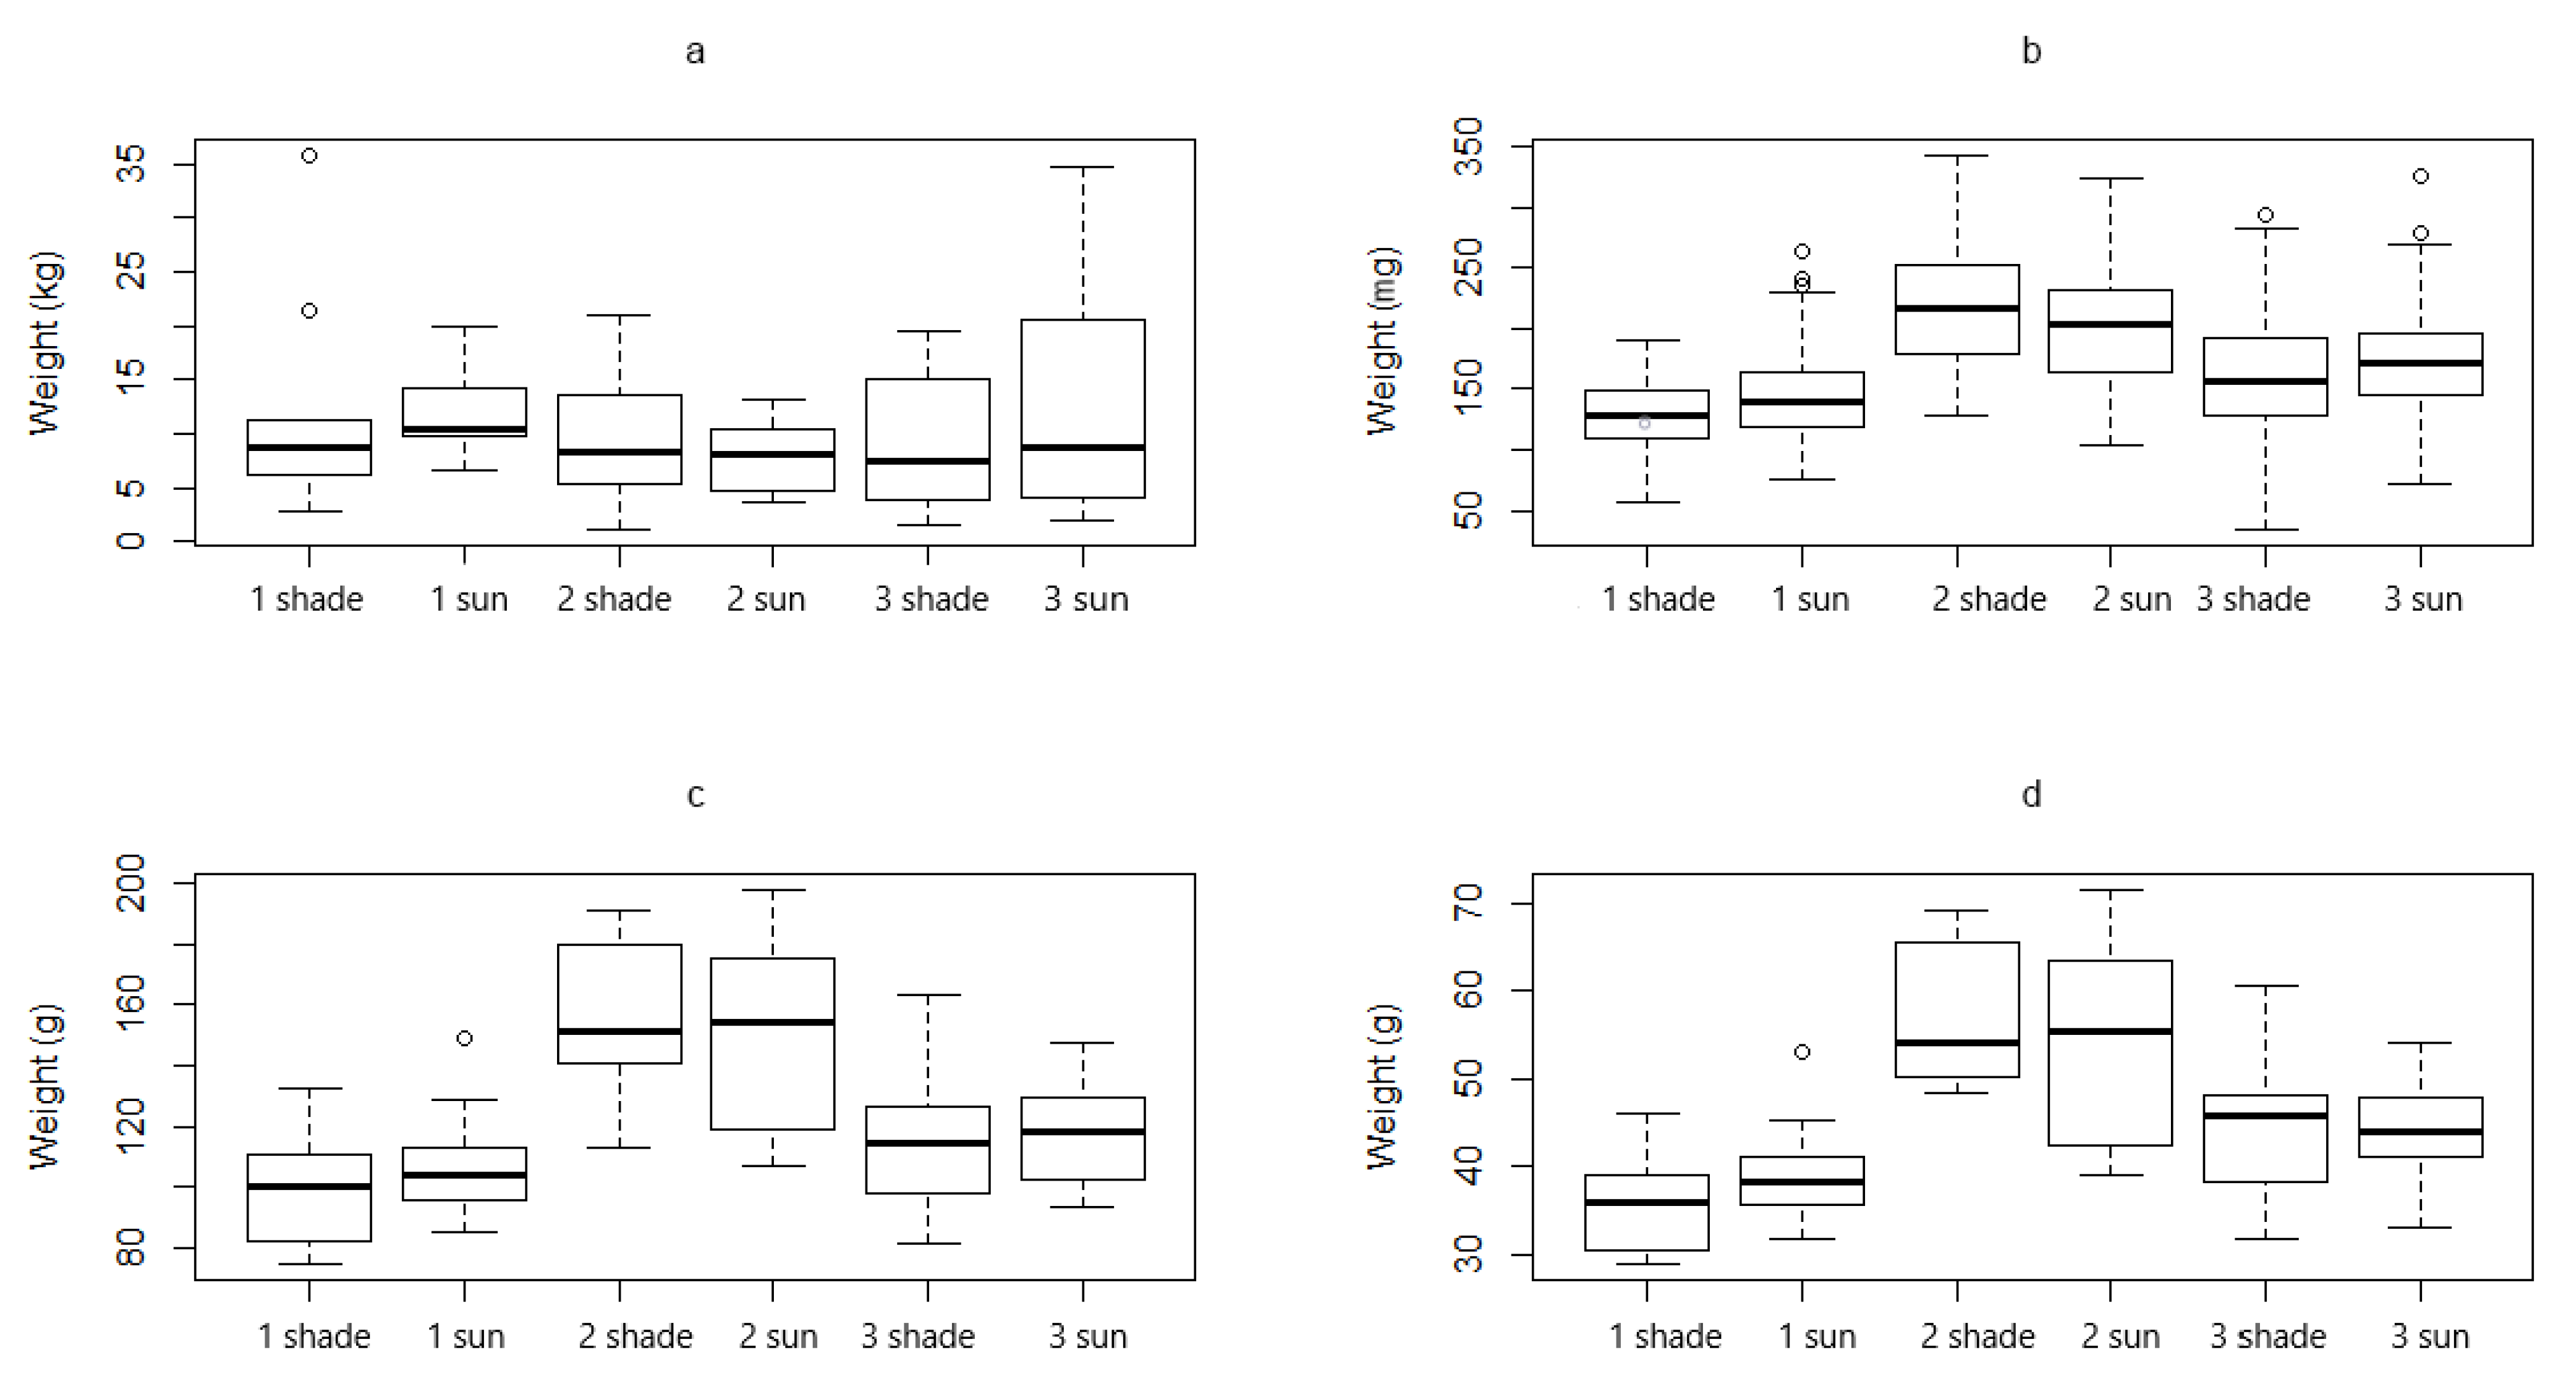
The coffee yield measurements were performed in November and December 2017. A total of four research plots were selected in each plantation, with two in the shaded sites and two in the sunny sites. Five coffee shrubs were randomly selected in each study plot, a total of 10 shrubs in the shaded and 10 shrubs in the sunny sites. All fruits of the selected coffee shrubs were picked up to determine the total yield from each coffee shrub. The total weight of the fresh fruit was determined immediately after harvest. A sample of one hundred randomly selected fruits was taken from each harvested coffee shrub. The weight of the coffee samples was measured as the fresh weight (immediately after harvest) and dry weight (dried to a constant weight). Of the total sample of 100 dry fruits, 10 fruits were randomly selected and peeled to measure the weight, length, and width of each coffee bean. To assess the maturity of the fruits, 5 coffee plants in shaded sites and 5 coffee plants in sunny sites were selected for each plantation. A sample of 100 randomly selected fruits was picked up from each of 5 coffee shrubs; subsequently, the number of ripe fruits was determined.

2.3. Microclimatic Data

Meteorological data collection took place for one year (27 November 2017 to 23 November 2018). In each study plot, 2 soil moisture sensor TMS-3 dataloggers (TOMST s.r.o., Prague, Czech Republic) were installed at a depth of 0.5 m. Rainfall was continuously measured at an open plot in Study Plantation 3 with a rain gauge (Rain-O-Matic Professional (mm), (Pronamic, Ringkøbing, Denmark)). Based on the measurements and the studied literature, the dry and wet seasons were determined as follows: the dry season was from 27 November 2017 to 16 March 2018 and the rainy season was from 17 March 2018 to 23 November 2018. Air temperature (°C) and relative air humidity (%) were continuously monitored (Minikin THI (EMS Brno, Czech Republic)) at a sunny site in Study Plantation 3, and the interval between measurements was one hour.
The total rainfall in the study plot during the measurement period was 2427 mm. The highest rainfall amount recorded over a calendar month at the site was 553 mm in May 2018, with the peak of highest daily rainfall of 125 mm on 11 May. Additionally, the total number of days in the year with ≥1 mm of precipitation was 143 days. The measured rainfall is shown in Figure 2. The annual average temperature was 22.9 °C, the minimum temperature was observed on 27 December 2017 (15 °C), and the maximum temperature was observed on 14 April 2018 (36 °C). Regarding air humidity, the annual average was 87.2% (Figure 3).

2.4. Coffee Stem Diameter Increment and Soil Moisture Measurement

Data on the coffee diameter increments were measured for a period of one year (from 27 November 2017 to 23 November 2018). The dendrometers were installed in each study plantation on 2 coffee plants in the shaded sites and on 2 coffee plants in the sunny sites. Measurements were performed for coffee plants with synchronized phenology stages. The increments in the coffee stem diameters were monitored using stem-diameter sensors (PDS40 SDI, (EMS Brno, Czech Republic)), which were noninvasively fixed to the coffee shrubs at a height of approximately 1.5 m. The measurements were taken at intervals of one hour.
To measure the soil moisture in the study area, one TMS 4 datalogger for soil moisture measurements was installed in each study plantation near one of the coffee plants in the shaded and sunny sites. The depth necessary for installation was 0.5 m. All data could not be downloaded from the microdendrometer and Tomst datalogger in Study Plantation 2 and from one microdendrometer in Study Plantation 3 because of the loss of measuring instruments.

2.5. Statistic Evaluation

Statistical analyses focused on the effect of shade on measured parameters (bean weight, projected area, length, and width) of coffee beans. As our data were collected in multiple levels (plantations–plot–shrub–fruit–bean), we used mixed-effect models that allowed us to specify an appropriate multilevel structure. Moreover, we found during our exploratory analysis that variance varied within plantations or shade/sun plots. We used a Bayesian approach to analyze these complex models and assumed a normal distribution of errors. Shade effect, plantation, and their interaction were used as fixed effect variables. Their effect was studied on both mean value and standard deviation (sigma). We tried two variants of random effect—the complex variant encompasses all three levels (plot/tree/fruit) and a simpler variant with just tree/fruit levels. Finally, we decided to use a simpler variant in all reported analyses as we found that the effect of plot was small relative to tree/fruit.
All models were fitted using statistical modeling and the high-performance statistical computation platform Stan [44] through the brms package, version 2.14.4 [45,46], within an R software environment [47]. We used default brms priors, 4 chains and 6000 iterations for each model. For final models, we reported the effect estimate, its 89% highest-density intervals (HDI), and the probability of direction. Additional analyses were provided for bean ripeness. These are proportional data; therefore, binomial (Bernoulli) distribution was used. Moreover, the structure of the random effect was simpler as the effect of fruit was no more applicable. For bean ripeness, we were interested also in whether there is a difference in variability between sun/shade shrubs. We analyzed this by specifying three variants of random effect and we compared those three models using the leave-one-out information criterion (LOOIC). To deal with high K Pareto values, we used the moment_match argument or reloo option when necessary. Again, Bayesian models were used within the R software environment [47]. The final model formula in brms syntax was specified (response ~ shade + plantation + (1|tree/fruit), sigma ~ shade + plantation), where the response was one of weight, area, length or width.

3. Results

3.1. Coffee Yield

Shade did not have an influence on the weight or size of the coffee beans (comparing average values and bean variability). However, the beans differed significantly based on the plantation (in mean values and mostly in variability). Plantation 2 yielded significantly larger and heavier beans than Plantations 1 and 3 (Table 1, Table 2, Table 3 and Table 4; Figure 4b).
There was no significant difference in the total weight of fresh coffee fruits per coffee shrub between the shaded and sunny sites or between coffee plantations (Figure 4a, Table 5). There was also no difference in weight of the 100 fresh or dry fruits between the shaded and sunny sites. We found that on Plantation 2, the coffee fruits were heavier both in the dry and wet states (see Figure 4c,d and Table 5).

3.2. Coffee Fruit Ripeness

A general trend in fruit ripeness differences was not demonstrated between shaded and unshaded coffee bushes. The exception is Plantation 1, which had fewer ripe grains on the shaded shrubs (Figure 5, Table 6). A strong effect of plantations was observed on the occurrence of mature fruits. Plantation 2 had a lower proportion of overall mature grains than the other plantations. There is no influence of shade on the ripeness variability (Table 7).

3.3. Coffee Stem Diameter Increment and Soil Moisture

There was no observed difference in coffee-stem diameter increment between sunny and shaded sites, nor between plantations (p > 0.05, using ANOVA). However, a significant difference was observed between the diameter increment of the coffee shrubs among seasons (p = 0.021, using Student’s t-test), which is also evident from Figure 6. Some coffee bushes in both shaded and sunny sites showed a negative increment. The monthly average coffee-stem diameter changes (during the day) in December 2017 (dry season) (Figure 7a–c) were higher than those in May 2018 (rainy season) (Figure 8a–c). The changes were slightly more pronounced in the sunny sites than in the shade. The changes in coffee stem sizes reached the maximum diameter early in the morning and the minimum in the evenings, which findings correspond with the daily temperature and humidity trends (Figure 7d).
The soil moisture was higher in the shaded sites. The soil moisture was below the limit for water deficit (30%) in the sunny site in Plantation 3 almost constantly throughout the measurement period from 27 November 2017 to 3 May 2018. On the other hand, the soil moisture in shaded sites oscillated around 50%, which is the limit for water excess, from July to November (Figure 6). Water deficit was defined as <30% of volumetric soil moisture, and water excess at >50%, as in the study by [48].

4. Discussion

The main questions of this study were whether the size and weight of coffee beans and fruits are influenced by shade and if the yield per coffee shrub is higher for shaded or sunny sites. The results indicate that there is no difference in these parameters between shaded and sunny sites. We found that some yield parameters, such as the weight and size of coffee beans, the weight of 100 fresh and dry coffee fruits, and the proportion of mature fruits in the samples were influenced by the plantation conditions. However, within the same plantation, differences were not observed between shaded and sunny sites. These findings indicate that planting robusta coffee in agroforestry systems will not cause losses in yield for individual plants. These findings are very important and should be considered when deciding whether to grow coffee in agroforestry or monocultural systems because the loss of yield is one of the main arguments for growing coffee in monoculture plantations.
The number of studies examining the effect of shade on robusta yield and bean size is limited. For example, a meta-analysis [40] found that shade trees positively affected the growth and yield of Coffea canephora plants. According to this synthesis, providing shade had positive impacts on older robusta shrubs (mean of 16 years) but had either insignificant or negative effects on younger shrubs. On the other hand, several studies have examined the effect of shade on arabica yield although their conclusions are not the same. Some authors point to a higher yield in coffee monoculture. For example, in Brazil, arabica yield in an agroforestry system (514.8 kg ha–1 of dry berries) was lower than that in a monoculture system (2442.8 kg ha–1) [30]. A Venezuelan study [49] found that by increasing the number of shade trees from 259 to 353 per ha, the yield was reduced by 26%, and by increasing the number of shade trees from 419 to 561 per ha, the yield was reduced by 100%. Researchers in Costa Rica concluded that a density of 100 trees of Cordia alliodora per ha maintained the same yields of arabica coffee found in plots without shade control; with higher densities, a decrease in yield was observed [31]. Other authors found that a certain degree of shading increased the arabica coffee yield. A study conducted in Mexico concluded that shade tree cover from 23% to 38% had a positive effect on coffee yield, shade ranging from 38 to 48% maintained the yield, and shade cover greater than 50% decreased the yield [12]. Similarly, a study in Costa Rica found coffee yields were optimized at 40% shade cover.
Looking at coffee-bean size, our findings correspond to a southern Colombia study on arabica that found that shade did not affect coffee-bean size [50]. However, other authors found that arabica plants grown under shade developed larger and heavier beans than those grown in full sun [18,37,39].
Coffee cultivation in agroforestry systems represents the potential of diversifying production and, thereby, farming incomes [51]. According to the authors of [52], intercropping coffee with shade trees shows no negative relationship with economic performance for smallholder coffee systems. Moreover, income from other products, including income from timber, can provide an extra source of income, which is an opportunity to increase economic resilience [16,52]. For example, intercropping coffee and banana appears to be more profitable than coffee mono-cropping [53]. On the other hand, labor costs can be a major barrier to the adoption of complex agroforestry systems [54].
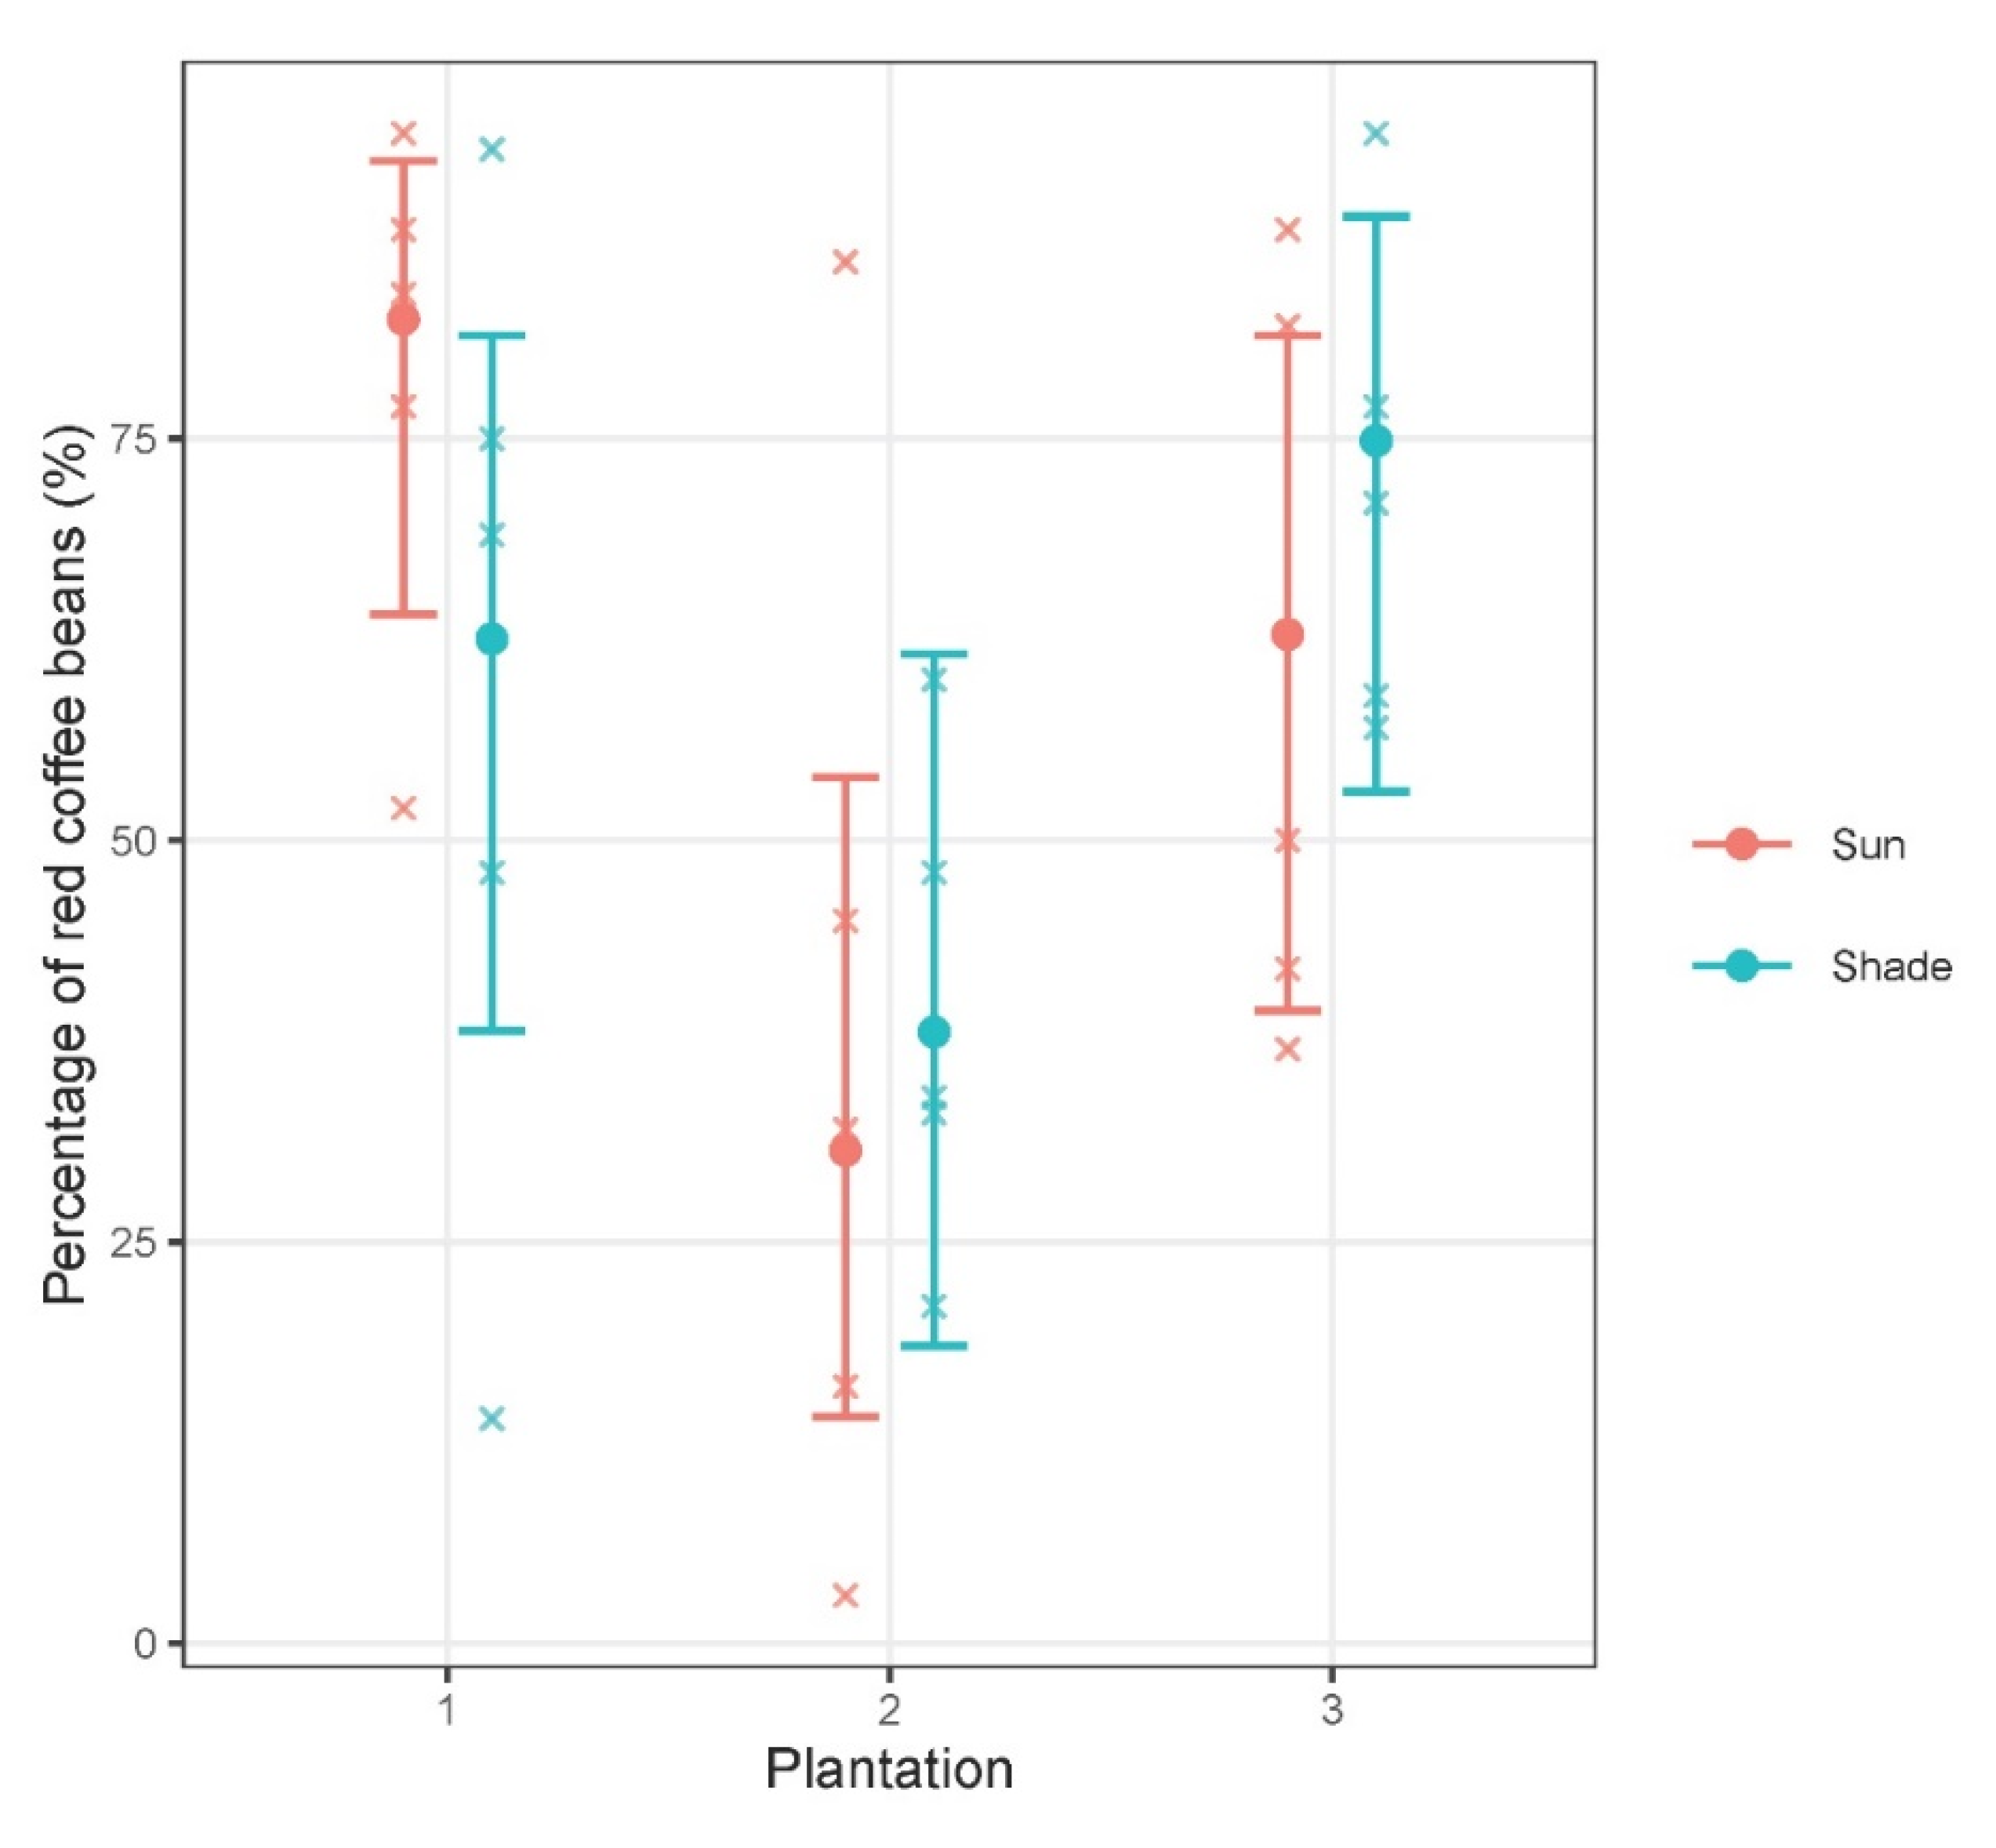
Another question in our study was whether there was any difference in the coffee fruit ripeness in shaded and sunny sites. During the dry processing of coffee, beans are classified, among other variables, according to size and weight [55]. For this reason, variability in seed size and weight is very important for growers. Multiple studies [35,38,39] found that growing under shade delays the ripening process of arabica. According to the authors of [39], arabica berries ripen faster in full sun than in shade due to exposure to higher temperatures. This trend was not confirmed for Plantation 1 but was noticeable for the remaining two studied plantations. According to Muschler [35], at low-elevation coffee sites with high temperatures, the reduction of temperature extremes through shading may have played a dominant role in the uniform growth and ripening of arabica berries. However, our work does not show that shade has an effect on the variability of robusta fruit ripening.
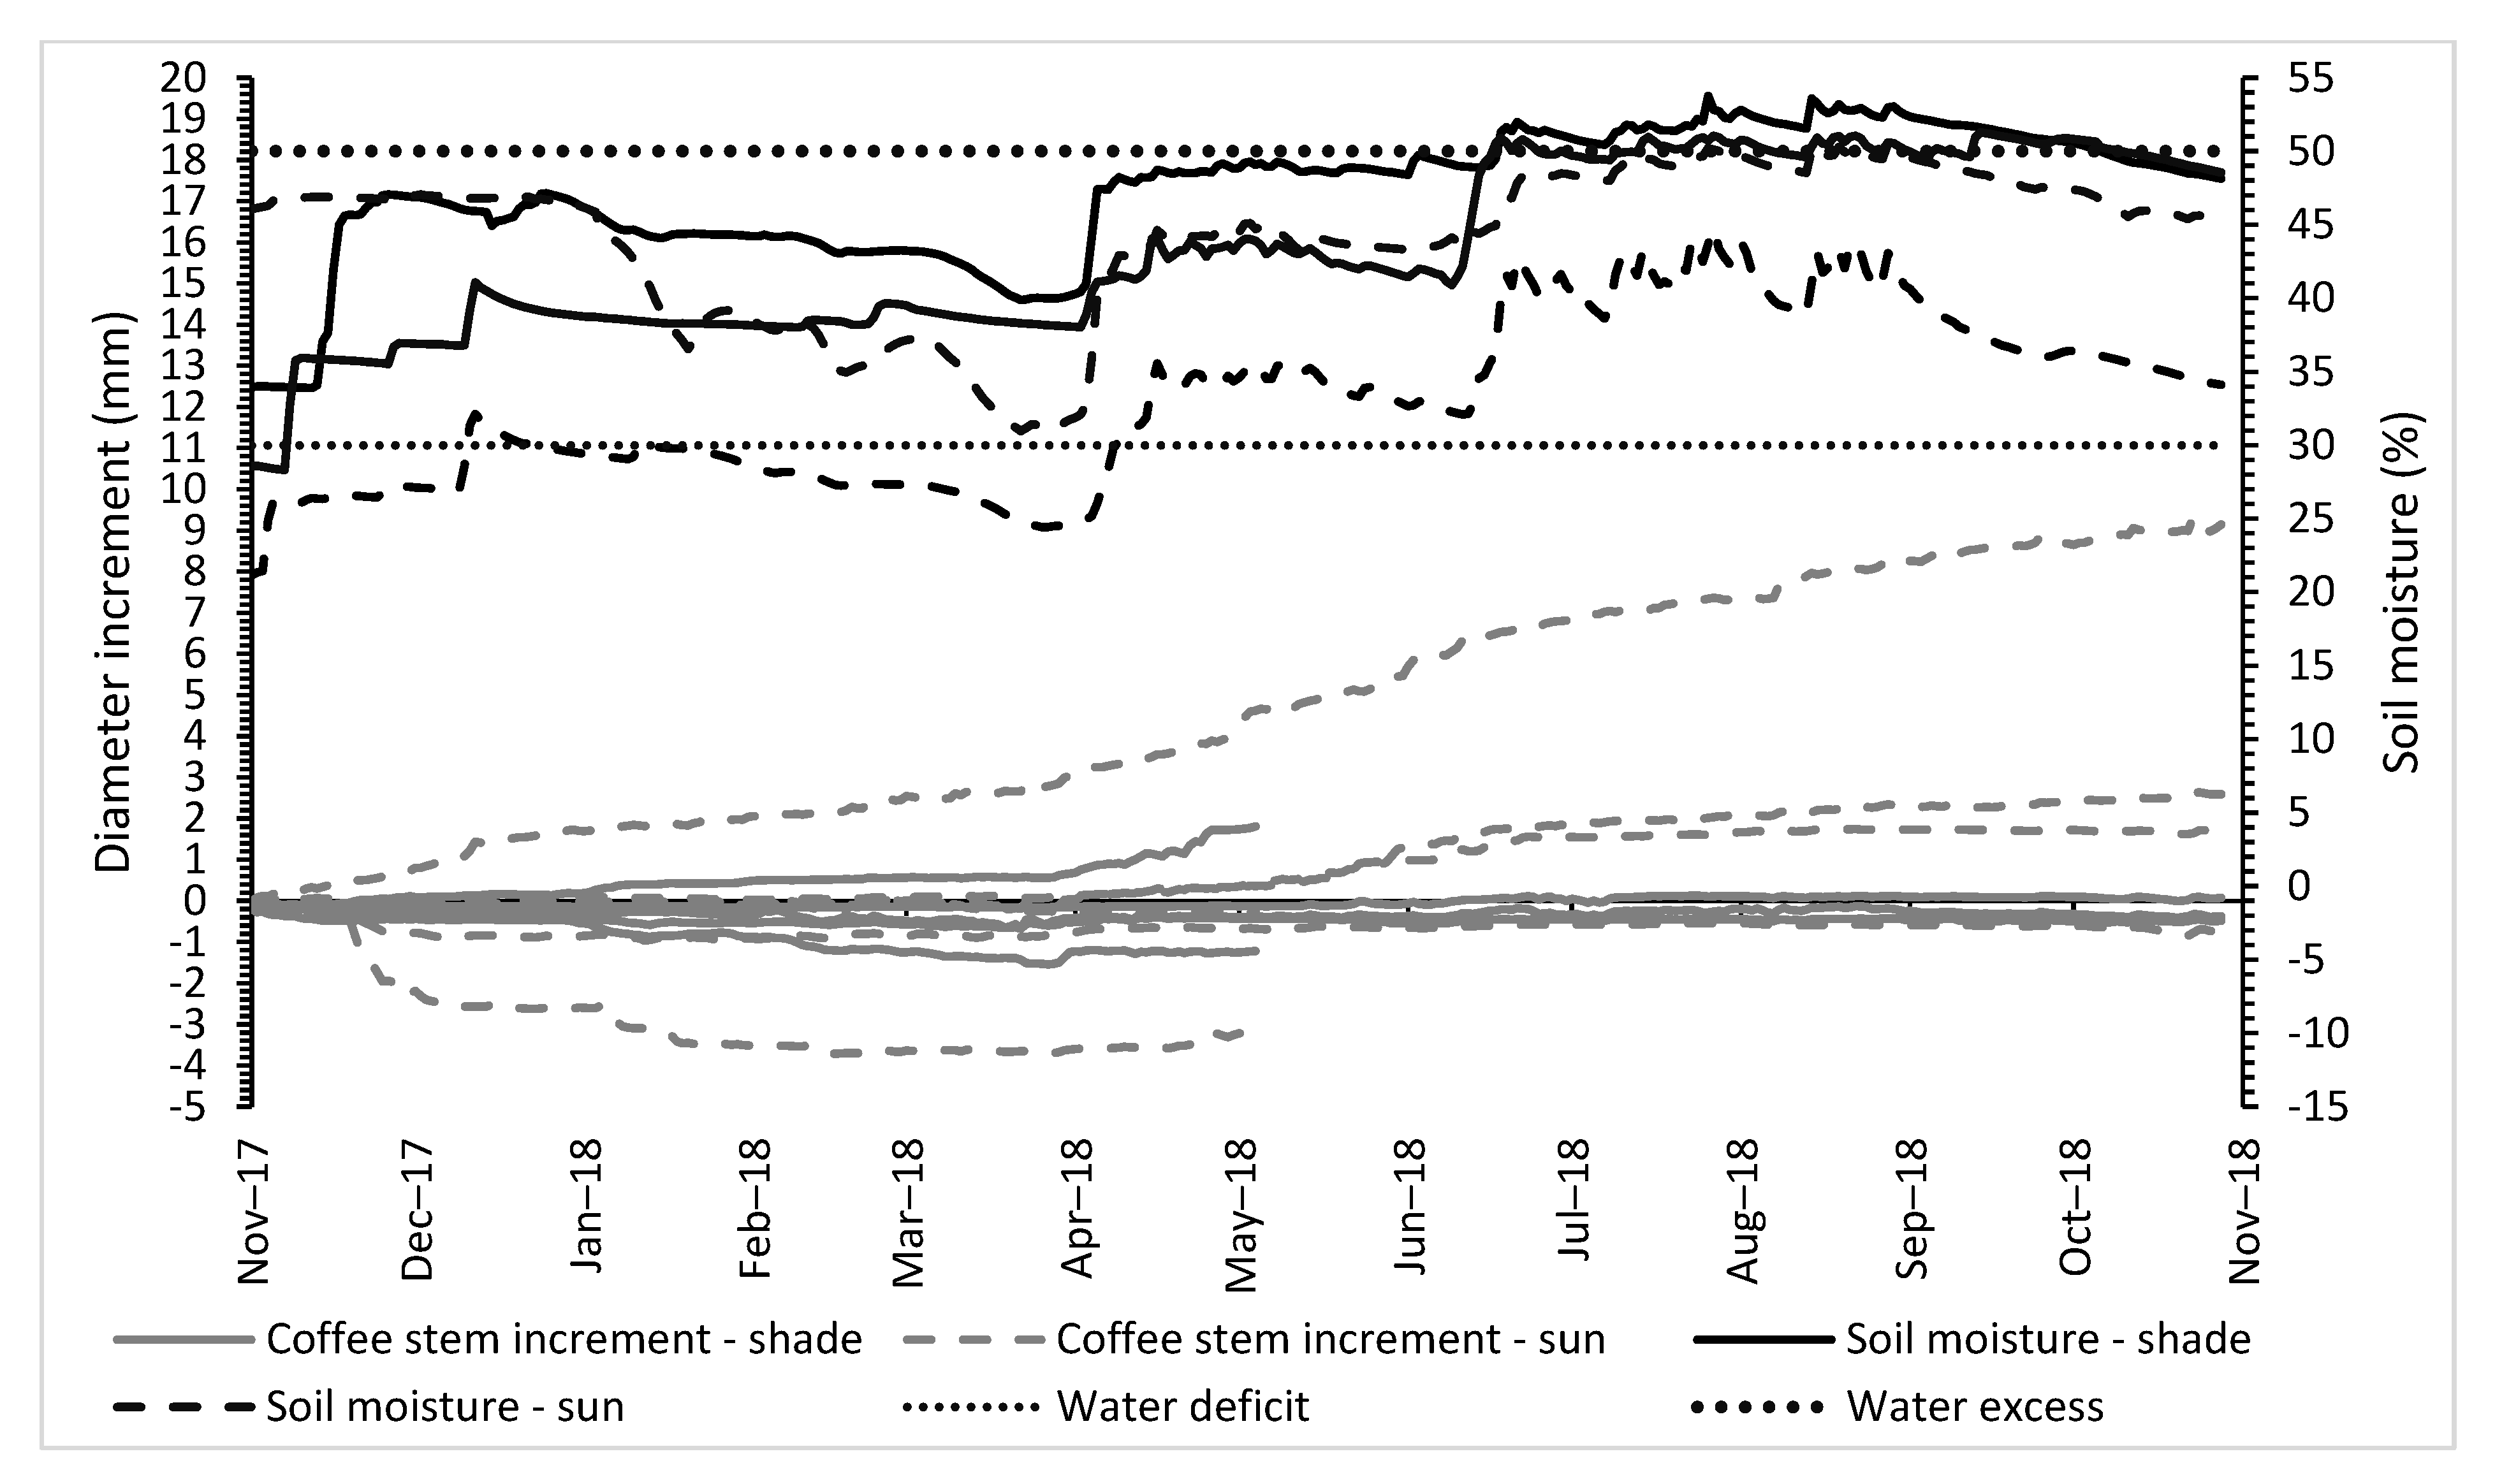
Another question we sought to answer was how shade influences coffee stem diameter increment and soil moisture in shaded and sunny sites. We did not observe differences in the coffee stem diameter between the two conditions. However, soil moisture was higher in the shaded sites. These results show that the plants were not affected by the lower soil moisture in sunny sites or higher soil moisture in shaded sites, which may indicate that competition for water did not occur between coffee tree and shade tree roots in the studied plantations. Our prior research [19] indicated that competition for water can occur between shade trees and coffee tree roots at a depth of 40 cm, which was based on measurements performed in agroforestry plantations in Peru, where the soil water availability was lower on shaded sites than on sunny sites during the dry season. This hypothesis was not confirmed during our measurement period in Cambodia, where higher soil moisture was present in the shaded site at a depth of 0.5 m, even during the dry season. Our results, showing that soil moisture was higher in shaded sites, are in accordance with other authors’ results for arabica coffee [56,57]; this fact could be explained by the litter layer reducing the evaporative loss of soil water and shading decreasing the solar energy available for evaporation [58]. Another possible explanation is that shade increases moisture inputs through the horizontal interception of mist or clouds [59].
Some coffee plants from both a shaded and a sunny site presented a decrease in stem diameter. Water stress could be an indicator of stem diameter fluctuation in perennial trees [60]. Microclimate temperatures can impact the stem diameter of coffee plants [61]. Even though the annual average temperature in the area of study was within the optimal range suitable for coffee cultivation, during the dry season, temperatures dropped as low as 15 °C. Past research found that the stem diameter of Coffea canephora both narrowed and widened when temperatures dropped to 19 °C [62]. Some studies presented a higher increment of coffee-stem diameter during the rainy season [61,63] and restrained growth during the dry period [61]. In addition, the authors of [64] related the early contraction of nectarine trunk diameter as a result of water stress. According to the authors of [
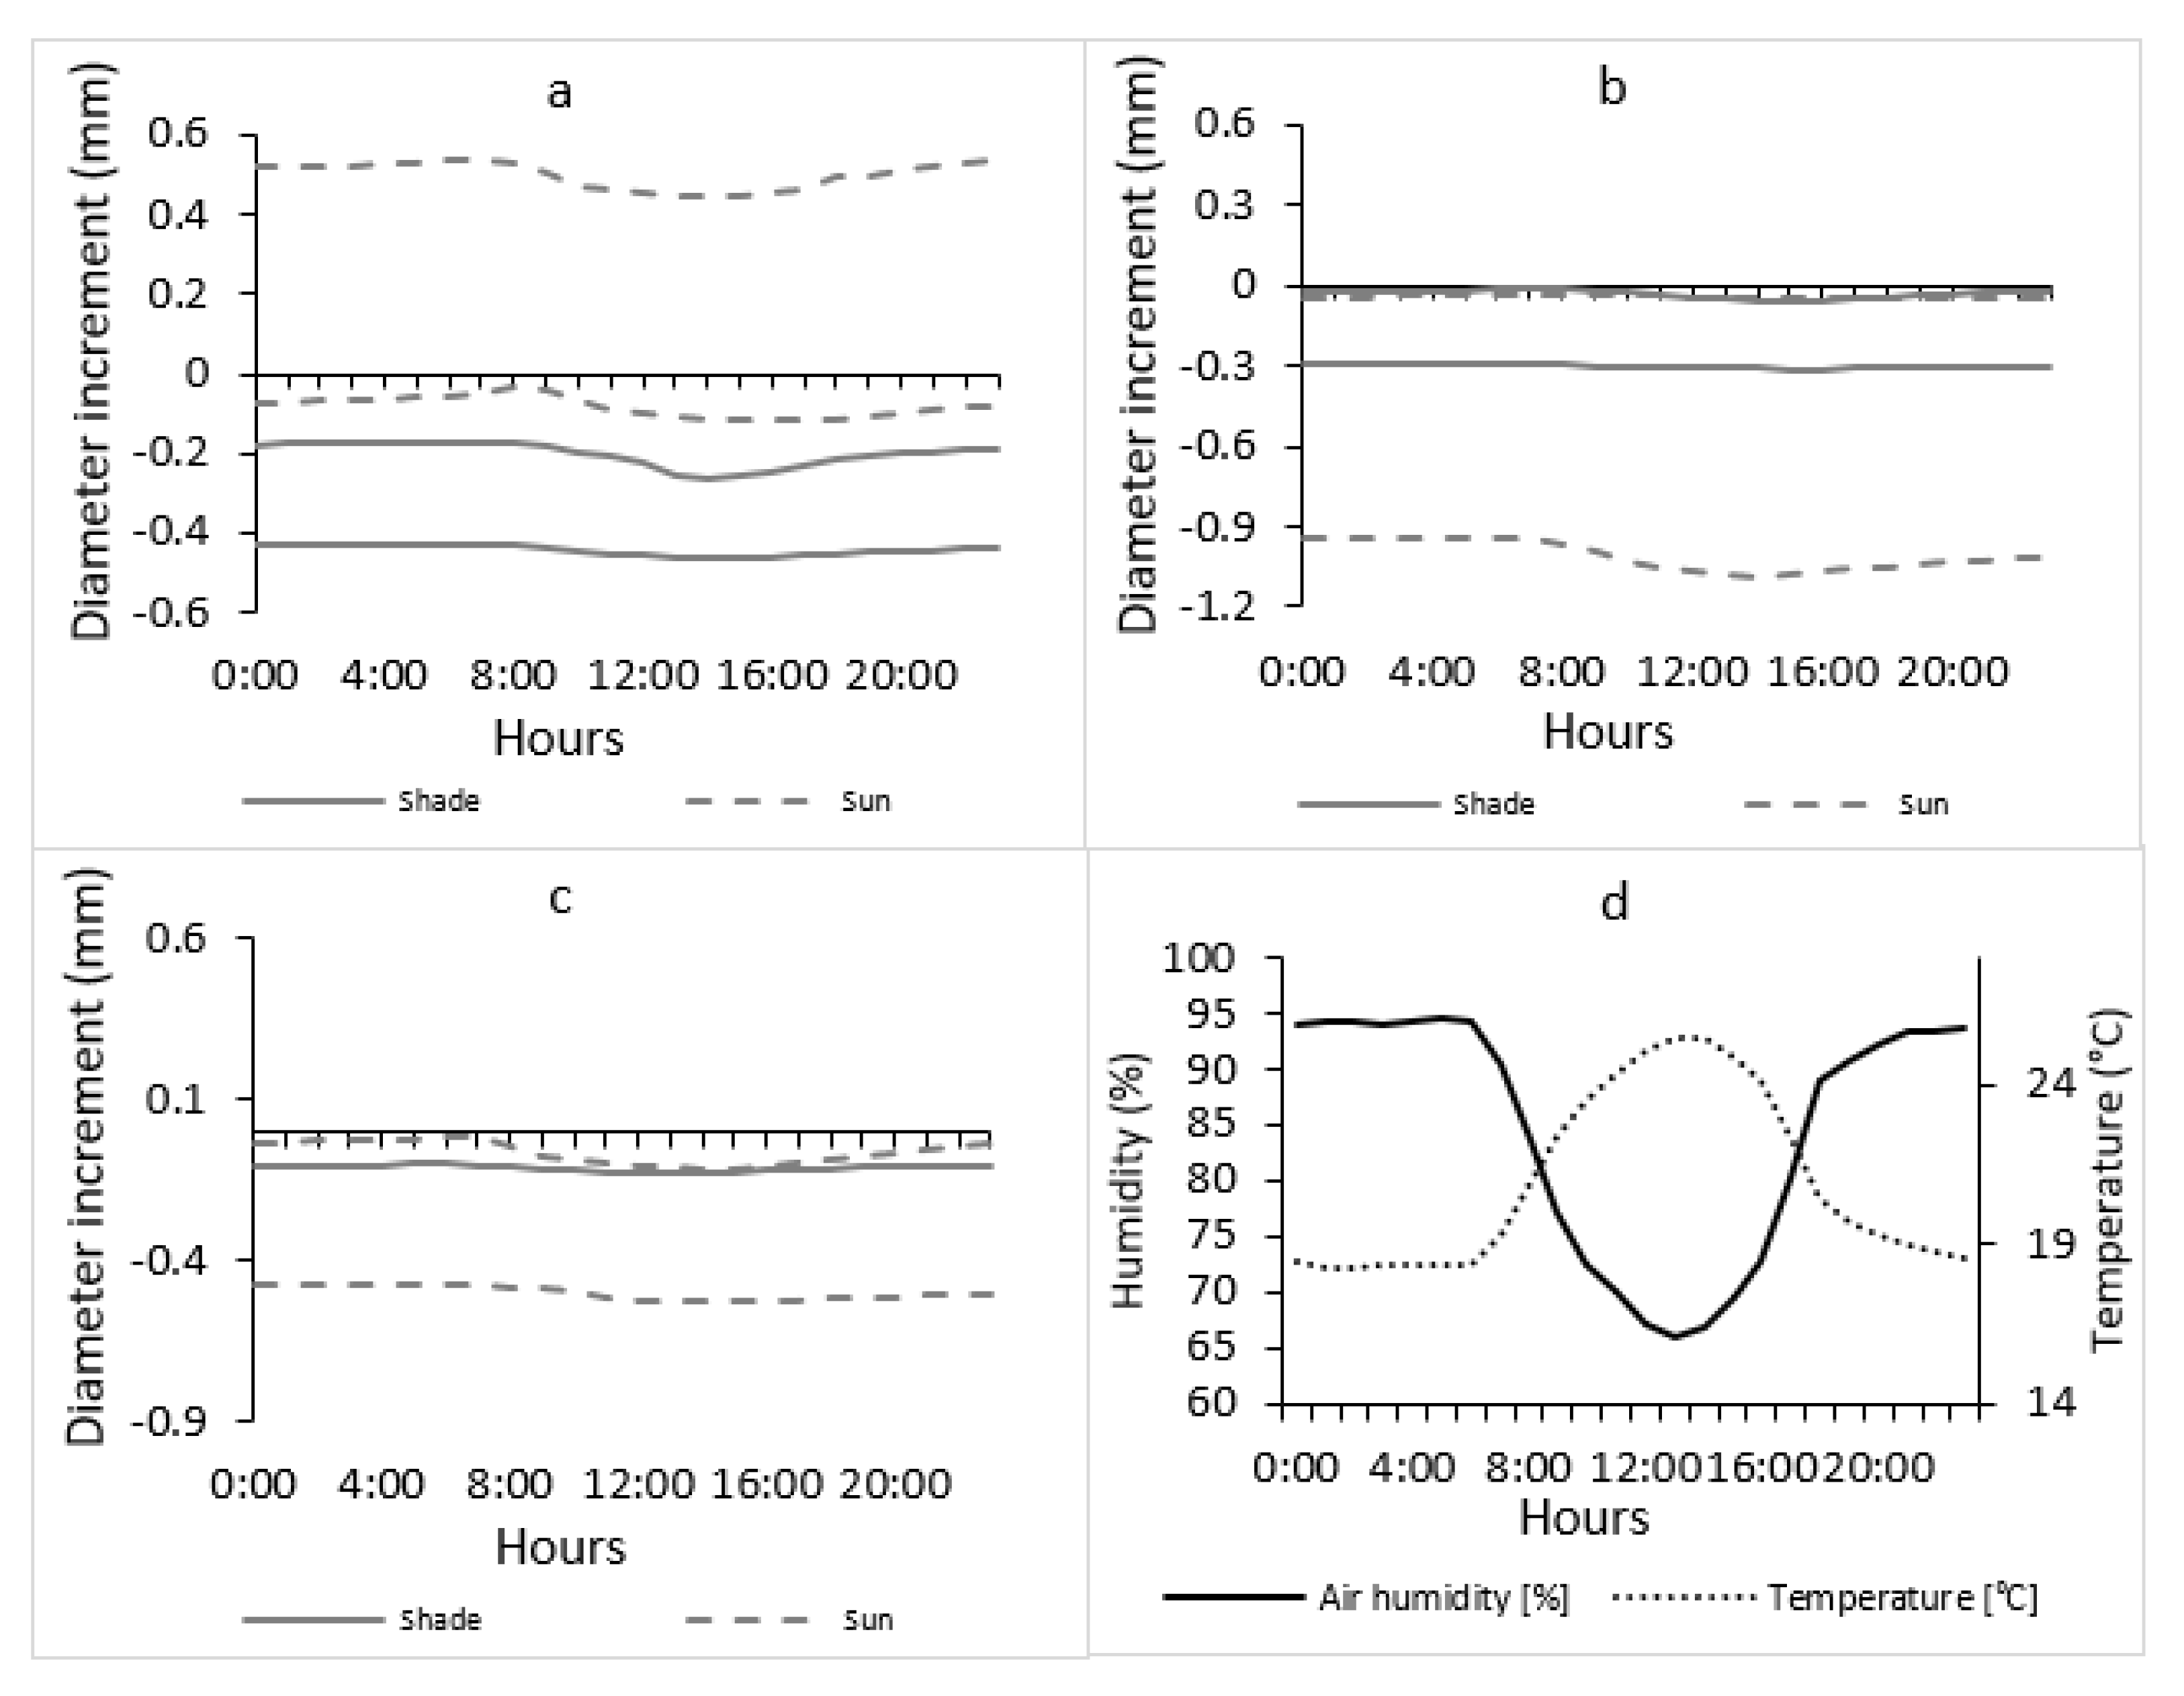
61], in active phase of vegetative growth of coffee, during the morning (8 AM to 9 AM) stomatal conductance was relatively high and decreased gradually. During the inactive growth phase, the stomata were closed for most of the diurnal period. In our study, in the morning the trunk of the coffee tree shrinks and, after 12 PM, it grows again. The changes in coffee trunk diameter are visibly connected (especially in the dry season) with the curves of air humidity and temperature on studied localities. These daily changes were more pronounced on sunny sites.
Durian, litchi, avocado, and cassia trees are multi-purpose tree species found in studied agroforestry plantations. All provide for income diversification by giving fruits and leaves for human consumption or fodder. Litchi is a deep-rooted, evergreen fruit crop that conserves degraded lands [65] and increases soil-available zinc (Zn), manganese (Mn), copper (Cu), and iron (Fe) [66]. Cassia is a Fabaceae species and has the ability to fix nitrogen (N) and improve soil fertility [67], which are properties comparable with Inga species (also Fabaceae) and are widely used as shading trees in coffee plantations in the Americas.
Some researchers [12] have advised arabica producers to grow arabica coffee under shade trees with approximately 50% shade cover; although this practice does not lead to a significant decrease in yields, it has additional economic benefits derived from other products extracted from the plantations. Our results also suggest planting robusta on shaded plantations because in our study, coffee agroforestry systems neither decreased the coffee bean size nor the yield per plant and they did not influence the level of coffee fruit ripeness. In any case, it is necessary to find out which level of shade is most suitable for robusta coffee. Additionally, our study shows that there is no difference in the coffee stem diameter changes between shaded and sunny sites, although the soil moisture was lower at sunny sites.
Agroforestry coffee plantations have many non-commercial functions that help to increase biodiversity, decrease erosion, and contribute to higher landscape values. Moreover, coffee has proven to be highly sensitive to climate change [2] and the mitigation of its effects is another reason for adopting agroforestry. The importance of robusta coffee is increasing, as evidenced by its growing share of world coffee production: it rose from 37% in 2016 to 47% in 2021 [68]. Based on our findings, it seems unreasonable to change robusta agroforestry plantations to monocultural ones in order to increase yield. Agroforestry can increase labor costs [54] but the adoption of appropriate planting schemes and suitable shade species can minimize these costs. Growing coffee in the shade has many benefits, and our study is another in a series confirming that agroforestry systems are a good choice for today’s world.

5. Conclusions

Our results imply that shading does not affect coffee yield (in terms of coffee bean weight or size, total weight of coffee fruits per shrub, and weight per 100 fruits), the variability of coffee bean sizes, and the fruit weight or ripeness of Coffea canephora in the studied plantations (of 3, 6, and 9 ha). Soil moisture plays a crucial role under conditions of higher temperatures and low precipitation, and it was higher throughout shaded sites. Although the soil moisture in sunny sites was for some periods lower than 30% (water deficit) and in shaded sites was higher than 50% (water access), the coffee-stem diameter changes were the same in the shaded and sunny sites. Taking into account the ecological attributes and ecosystem service benefits of agroforestry, such as increased biodiversity [13,14] and landscape diversity [12], providing soil protection [8], increasing the carbon stock [15], and providing sources of fuel wood and construction material [8], we suggest maintaining and planting Coffea canephora in agroforestry shade-based systems, as coffee producers transition away from monoculture plantations.

Author Contributions

Conceptualization, L.E., H.H., P.M., M.K. and Y.G.C.; methodology, L.E., H.H., P.M. and D.V.; software, D.V.; validation, P.M.; formal analysis, D.V. and L.E.; investigation, M.K., Y.G.C., H.H., S.L., W.K., P.N., S.K., P.J. and P.M.; resources, S.K.; data curation, L.E. and D.V.; writing—original draft preparation L.E., M.K. and Y.G.C.; writing—review and editing, H.H., P.M., W.K. and S.K.; visualization, L.E.; supervision, H.H. and P.M.; project administration, H.H. and L.E.; funding acquisition, H.H. and L.E. All authors have read and agreed to the published version of the manuscript.

Funding

This research was funded by Mendel University in Brno and contributions from the Czech Development Agency, grant numbers DP-2019-047-DO-11420 (Support for Practical Education and Final Thesis Elaboration at the Faculty of Forestry, Royal University of Agriculture, Cambodia) and 22/2017/08 (Strengthening of Practical Education, Field Research and Scientific Publication on Faculty of Forestry, Royal University of Agriculture, Cambodia), and from the Czech Ministry of Foreign Affairs, grant number 2020-PKVV-014 (Innovation of Study Program and Support for Practical Final Theses at the Faculty of Forestry at the Royal University of Agriculture, Cambodia).

Institutional Review Board Statement

Not applicable.

Informed Consent Statement

Not applicable.

Acknowledgments

The authors are grateful to the students and employees of the Royal University of Agriculture, Cambodia for their support during the fieldwork at the time of data collection. We thank the farmers Chay Mao, Om Pheap (Coffee Plantation), and Nget Chan Raksmey for their willingness to participate and for providing their plantations for research. Finally, we thank Kay Van Damme for help with language corrections.

Conflicts of Interest

The authors declare no conflict of interest.

References

  1. International Coffee Organization. The Current State of the Global Coffee Trade|#CoffeeTradeStats. 2016. Available online: http://www.ico.org/monthly_coffee_trade_stats.asp (accessed on 3 January 2020).
  2. Bunn, C.; Läderach, P.; Rivera, O.O.; Kirschke, D. A bitter cup: Climate change profile of global production of Arabica and Robusta coffee. Clim. Chang. 2015, 129, 89–101. [Google Scholar] [CrossRef] [Green Version]
  3. Moat, J.; Williams, J.; Baena, S. Resilience potential of the Ethiopian coffee sector under climate change. Nat. Plants 2017, 3, 1–14. [Google Scholar] [CrossRef]
  4. Läderach, P.; Ramirez–Villegas, J.; Navarro-Racines, C.; Zelaya, C.; Martinez–Valle, A.; Jarvis, A. Climate change adaptation of coffee production in space and time. Clim. Chang. 2017, 141, 47–62. [Google Scholar] [CrossRef] [Green Version]
  5. Craparo, A.C.W.; van Asten, P.J.A.; Läderach, P.; Jassogne, L.T.P.; Grab, S.W. Coffea arabica yields decline in Tanzania due to climate change: Global implications. Agric. For. Meteorol. 2015, 207, 1–10. [Google Scholar] [CrossRef] [Green Version]
  6. Jayakumar, M.; Rajavel, M.; Surendran, U.; Gopinath, G.; Ramamoorthy, K. Impact of climate variability on coffee yield in India—With a micro-level case study using long-term coffee yield data of humid tropical Kerala. Clim. Chang. 2017, 145, 335–349. [Google Scholar] [CrossRef]
  7. Waller, J.M.; Bigger, M.; Hillocks, R.J. Coffee Pests, Diseases and Their Management; CABI: Wallingford, UK, 2007. [Google Scholar]
  8. Wintgens, J.N. Coffee: Growing, Processing, Sustainable Production. A Guidebook for Growers, Processors, Traders, and Researchers; WILEY-VCH Verlag GmbH & Co. KGaA: Corseaux, Switzerland, 2004. [Google Scholar]
  9. DaMatta, F.M.; Ronchi, C.P.; Maestri, M.; Barros, R.S. Coffee: Environment and Crop Physiology. In Ecophysiology of Tropical Tree Crops; Nova Science Publishers: New York, NY, USA, 2010; pp. 181–216. [Google Scholar]
  10. DaMatta, F.M.; Avila, R.T.; Cardoso, A.A.; Martins, S.C.; Ramalho, J.C. Physiological and agronomic performance of the coffee crop in the context of climate change and global warming: A review. J. Agric. Food Chem. 2018, 66, 5264–5274. [Google Scholar] [CrossRef]
  11. Haarer, A.E. Modern Coffee Production; Leonard Hill: London, UK, 1958. [Google Scholar]
  12. Soto-Pinto, L.; Perfecto, I.; Castillo-Hernández, J.; Caballero-Nieto, J. Shade effect on coffee production at the northern Tzeltal zone of the state of Chiapas, Mexico. Agric. Ecosyst. Environ. 2000, 80, 61–69. [Google Scholar] [CrossRef]
  13. Perfecto, I.; Rice, R.A.; Greenbergr, R.; Van der Voort, M.E. Shade Coffee: Disappearing Refuge for Biodiversity. Bioscience 1996, 46, 596–608. [Google Scholar] [CrossRef] [Green Version]
  14. Moguel, P.; Toledo, V.M. Biodiversity Conservation in Traditional Coffee Systems of Mexico. Conserv. Biol. 1999, 13, 11–21. [Google Scholar] [CrossRef]
  15. Ehrenbergerová, L.; Cienciala, E.; Kučera, A.; Guy, L.; Habrová, H. Carbon stock in agroforestry coffee plantations with different shade trees in Villa Rica, Peru. Agrofor. Syst. 2016, 90, 433–445. [Google Scholar] [CrossRef]
  16. Ehrenbergerová, L.; Šeptunová, Z.; Habrová, H.; Tuesta, R.H.P.; Matula, R. Shade tree timber as a source of income diversification in agroforestry coffee plantations, Peru. Bois Forets Trop. 2019, 342, 93–103. [Google Scholar] [CrossRef]
  17. Negawo, W.J.; Beyene, D.N. The role of coffee based agroforestry system in tree diversity conservation in eastern Uganda. Landsc. Ecol. 2017, 10, 1–18. [Google Scholar] [CrossRef] [Green Version]
  18. Somporn, C.; Kamtuo, A.; Theerakulpisut, P.; Siriamornpun, S. Effect of shading on yield, sugar content, phenolic acids and antioxidant property of coffee beans (Coffea arabica L. cv. Catimor) harvested from north-eastern Thailand. J. Sci. Food Agric. 2012, 92, 1956–1963. [Google Scholar] [CrossRef] [PubMed]
  19. Ehrenbergerová, L.; Šenfeldr, M.; Habrová, H. Impact of tree shading on the microclimate of a coffee plantation: A case study from the Peruvian Amazon. Bois Forets Trop. 2017, 4, 13–22. [Google Scholar] [CrossRef] [Green Version]
  20. Siles, P.; Harman, J.M.; Vaast, P. Effects of Inga densiflora on the microclimate of coffee (Coffea arabica L.) and overall biomass under optimal growing conditions in Costa Rica. Agrofor. Syst. 2010, 78, 186–269. [Google Scholar] [CrossRef]
  21. Intergovernmental Panel on Climate Change. An IPCC Special Report on Climate Change, Desertification, Land Degradation, Sustainable Land Management, Food Security, and Greenhouse Gas Fluxes in Terrestrial Ecosystems. Available online: https://www.ipcc.ch/srccl/ (accessed on 10 November 2020).
  22. Coyner, M.S. Agriculture and Trade in Nicaragua; Foreign Agriculture Service: Washington, DC, USA, 1960.
  23. Eskes, A.B. The effect of light intensity on incomplete resistance of coffee to Hemileia vastatrix. Neth. J. Plant Pathol. 1982, 88, 191–202. [Google Scholar] [CrossRef]
  24. Kushalappa, A.C. Advences in coffee rust researche. Annu. Rev. Phytopathol. 1989, 27, 503–531. [Google Scholar] [CrossRef]
  25. Staver, C.; Guharay, F.; Monterroso, D.; Muschler, R.G. Designing pest-suppressive multistrata perennial crop systems: Shade-grown coffee in Central America. Agrofor. Syst. 2001, 53, 151–170. [Google Scholar] [CrossRef]
  26. Soto-Pinto, L.; Perfecto, I.; Caballero-Nieto, J. Shade over coffee: Its effects on berry borer, leaf rust and spontaneous herbs in Chiapas, Mexico. Agrofor. Syst. 2002, 55, 37–45. [Google Scholar] [CrossRef]
  27. Salgado, B.G.; Macedo, R.L.G.; Carvalho, V.L.D.; Salgado, M.; Venturin, N. Progress of rust and coffee plant cercosporiose mixed with grevilea, with ingazeiro and in the full sunshine in Lavras MG. Cienc. Agrotecnologia 2007, 31, 1067–1074. [Google Scholar] [CrossRef]
  28. Ehrenbergerová, L.; Kučera, A.; Cienciala, E.; Trochta, J.; Volařík, D. Identifying key factors affecting coffee leaf rust incidence in agroforestry plantations in Peru. Agrofor. Syst. 2018, 92, 1551–1565. [Google Scholar] [CrossRef]
  29. Tolessa, K.; D’heer, J.; Duchateau, L.; Boeckx, P. Influence of growing altitude, shade and harvest period on quality and biochemical com- position of Ethiopian specialty coffee. J. Sci. Food Agric. 2017, 97, 2849–2857. [Google Scholar] [CrossRef] [PubMed]
  30. Campanha, M.M.; Santos, R.H.S.; De Freitas, G.B.; Martinez, H.E.P.; Garcia, S.L.R.; Finger, F.L. Growth and yield of coffee plants in agroforestry and monoculture systems in Minas Gerais, Brazil. Agrofor. Syst. 2004, 63, 75–82. [Google Scholar] [CrossRef]
  31. Hernández, G.O.; Beer, J.; von Platen, H. Rendimiento de café (Coffea arabica cv Caturra), producción de madera (Cordia alliodora) y análisis financiero de plantaciones con diferentes densidades de sombra en Costa Rica. Agrofor. Am. 1997, 4, 8–13. [Google Scholar]
  32. Avelino, J.; Barboza, B.; Araya, J.C.; Fonseca, C.; Davrieux, F.; Guyot, B.; Cilas, C. Effects of slope exposure, altitude and yield on coffeequality in two altitude terroirs of Costa Rica, Orosi and Santa María de Dota. J. Sci. Food Agric. 2005, 85, 1869–1876. [Google Scholar] [CrossRef]
  33. Guyot, B.; Gueule, D.; Manez, J.C.; Perriot, J.J.; Giron, J.; Villian, L. Influence de l’altitude et de l’ombrage sur la qualitedes cafes Arabica. Plant. Rech. Dev. 1996, 3, 272–283. [Google Scholar]
  34. Salazar, E.I. Calidad de Coffea arabica Bajo Sombra de Erythrina poeppigiana a Diferentes Elevaciones en Costa Rica. Master’s Thesis, Centro Agronómico Tropical de Investigación y Enseñanza, Turrialba, Costa Rica, 1999. [Google Scholar]
  35. Muschler, R.G. Shade improves coffee quality in a sub-optimal coffee zone of Costa Rica. Agrofor. Syst. 2001, 85, 131–139. [Google Scholar] [CrossRef]
  36. Muschler, R.G. Sombra o sol para un cafetal sostenible: Un nuevo enfoque de una vieja discusión. In Memorias del 18vo Simposio Latinoamericano de Caficultura; Editorama S.A.: San José, Costa Rica, 1997; pp. 471–476. [Google Scholar]
  37. Bote, A.D.; Struik, P.C. Effects of shade on growth, production, and quality of coffee (Coffea arabica) in Ethiopia. J. Hortic. For. 2011, 3, 336–341. [Google Scholar]
  38. Alemu, M.M. Effect of Tree Shade on Coffee Crop Production. J. Sustain. Dev. 2015, 8, 66–70. [Google Scholar] [CrossRef]
  39. Vaast, P.; Van Kanten, R.; Siles, P.; Dzib, B.; Franck, N.; Harmand, J.M. Shade: A Key Factor for Coffee Sustainability and Quality; Association Scientifique Internationale du Café (ASIC): Allenwinden, Switzerland, 2006; pp. 887–896. [Google Scholar]
  40. Piato, K.; Lefort, F.; Subía, C.; Caicedo, C.; Calderón, D.; Pico, J.; Norgrove, L. Effects of shade trees on robusta coffee growth, yield and quality. A meta-analysis. Agron. Sustain. Dev. 2020, 40, 1–13. [Google Scholar] [CrossRef]
  41. White, P.F.; Oberthur, T.; Pheav, S. The Soils Used for Rice Production in Cambodia; International Rice Research Institute: Manila, Philippines, 1997; ISBN 978-971-22-0094-6. [Google Scholar]
  42. Beckschäfer, P.; Seidel, D.; Kleinn, C.; Xu, J. On the exposure of hemispherical photographs in forests. iForest 2013, 6, 228–237. [Google Scholar] [CrossRef] [Green Version]
  43. Gonsamo, A.; Walter, J.M.; Pellikka, P. CIMES: A package of programs for determining canopy geometry and solar radiation regimes through hemispherical photographs. Comput. Electron. Agric. 2011, 79, 207–215. [Google Scholar] [CrossRef]
  44. Stan Development Team. Stan Modeling Language Users Guide and Reference Manual 2020. Available online: https://mc-stan.org (accessed on 11 December 2020).
  45. Bürkner, P.-C. brms: An R Package for Bayesian Multilevel Models Using Stan. J. Stat. Softw. 2017, 80, 1–28. [Google Scholar] [CrossRef] [Green Version]
  46. Bürkner, P.-C. Advanced Bayesian Multilevel Modeling with the R Package brms. R J. 2018, 10, 395–411. [Google Scholar] [CrossRef]
  47. R Core Team. R: A Language and Environment for Statistical Computing; R Foundation for Statistical Computing: Vienna, Austria, 2020; p. 12. Available online: https://www.R-project.org/ (accessed on 20 January 2021).
  48. Bermúdez-Florez, L.N.; Cartagena-Valenzuela, J.R.; Ramírez-Builes, V.H. Soil humidity and evapotranspiration under three coffee (Coffea arabica L.) planting densities at Naranjal experimental station (Chinchiná, Caldas, Colombia). Acta Agron. 2018, 67, 402–413. [Google Scholar] [CrossRef]
  49. Escalante, E.E. Coffee and agroforestry in Venezuela. Agrofor. Today (ICRAF) 1995, 7, 5–7. [Google Scholar]
  50. Bosselmann, A.S.; Dons, K.; Oberthur, T.; Olsen, C.S.; Ræbild, A.; Usma, H. The influence of shade trees on coffee quality in small holder coffee agroforestry systems in Southern Colombia. Agric. Ecosyst. Environ. 2009, 129, 253–260. [Google Scholar] [CrossRef]
  51. Rice, R.A. Agricultural intensification within agroforestry: The case of coffee and wood products. Agric. Ecosyst. Environ. 2008, 128, 212–218. [Google Scholar] [CrossRef]
  52. Jezeer, R.E.; Santos, M.J.; Boot, R.G.; Junginger, M.; Verweij, P.A. Effects of shade and input management on economic performance of small-scale Peruvian coffee systems. Agric. Syst. 2018, 162, 179–190. [Google Scholar] [CrossRef]
  53. Van Asten, P.J.; Wairegi, L.W.; Mukasa, D.; Uringi, N.O. Agronomic and economic benefits of coffee–banana intercropping in Uganda’s smallholder farming systems. Agric. Syst. 2011, 104, 326–334. [Google Scholar] [CrossRef]
  54. Craswell, E.T.; Sajjapongse, A.; Howlett, D.J.B.; Dowling, A.J. Agroforestry in the management of sloping lands in Asia and the Pacific. In Directions in Tropical Agroforestry Research. Forestry Sciences; Nair, P.K.R., Latt, C.R., Eds.; Springer: Dordrecht, The Netherlands, 1998; Volume 53. [Google Scholar] [CrossRef]
  55. Luna González, A.; Macías Lopez, A.; Taboada Gaytán, O.R.; Morales Ramos, V. Cup quality attributes of Catimors as affected by size and shape of coffee bean (Coffea arabica L.). Int. J. Food Prop. 2019, 22, 758–767. [Google Scholar] [CrossRef] [Green Version]
  56. Suárez de Castro, F.; Montenegro, L.; Aviles, C.; Moreno, M.; Bolaños, M. Efecto del sombrío en los primeros años de vida de un cafetal. Café El Salvador 1961, 31, 317–350. [Google Scholar]
  57. Morais, H.; Caramori, P.H.; Maria, A.; Ribeiro, D.A.; Gomes, J.C. Microclimatic characterization and productivity of coffee plants grown under shade of pigeon pea in Southern Brazil. Pesqui. Agropecuária Bras. 2006, 41, 763–770. [Google Scholar] [CrossRef] [Green Version]
  58. Beer, J.W. Production and Competitive Effects of the Shade Trees Cordia alliodora and Erythrina poeppigiana in an Agroforestry System with Coffea arabica. Ph.D. Thesis, University of Oxford, Oxford, UK, 1992. [Google Scholar]
  59. Willey, R.W. The use of shade in coffee, cocoa and tea. Hortic. Abstr. 1975, 45, 791–798. [Google Scholar]
  60. Diaz, Y.; Torrecillas, A.; Rodriguez, P. Stem diameter fluctuations as stress indicator in fruit trees and its use in irrigation management. Cultiv. Trop. 2015, 36, 59–66. [Google Scholar]
  61. Barros, R.S.; da Se Mota, J.W.; Da Matta, F.M.; Maestri, M. Decline of vegetative growth in Coffea arabica L. in relation to leaf temperature, water potential and stomatal conductance. Field Crops Res. 1997, 54, 65–72. [Google Scholar] [CrossRef]
  62. Partelli, F.L.; Marré, W.B.; Falqueto, A.R.; Vieira, H.D.; Cavatti, P.C. Seasonal Vegetative Growth in Genotypes of Coffea canephora, as Related to Climatic Factors. J. Agric. Sci. 2013, 5, 108–116. [Google Scholar] [CrossRef] [Green Version]
  63. Solorzano, N.; Querales, D. Crecimiento y desarrollo del café (Coffea arabica) bajo la sombra de cinco especies arbóreas. Rev. For. Latinoam. 2010, 25, 61–80. [Google Scholar]
  64. Rosa Sánchez, J.M.; Conesa Saura, M.D.; Domingo Miguel, R.; Pérez Pastor, A. Contracción temprana de diámetro del tronco. Un nuevo indicador altamente sensible al estrés hídrico en nectarinos extratempranos. In III Workshop en Investigación Agroali-mentaria—WiA3.14, Cartagena, Colombia, 12–13 May 2014; Universidad Politécnica de Cartagena, Servicio de Documentación: Cartagena, Colombia, 2014; pp. 143–146. ISBN 978-84-697-1358-7. [Google Scholar]
  65. Rathore, A.C.; Mehta, H.; Sharma, N.K.; Gupta, A.K.; Alam, N.M.; Islam, S.; Dogra, P. Performance of litchi (Litchi chinensis Sonn.) based agri-horticultural land uses in rainfed condition on degraded lands in North Western Himalayas, India. Agrofor. Syst. 2020, 94, 2225–2236. [Google Scholar] [CrossRef]
  66. Sarkar, S.; Das, D.K.; Singh, A. Soil micronutrients status of different agroforestry systems in north Bihar. J. Pharmacogn. Phytochem. 2020, 9, 355–358. [Google Scholar]
  67. Logah, V.; Tetteh, E.N.; Adegah, E.Y.; Mawunyefia, J.; Ofosu, E.A.; Asante, D. Soil carbon stock and nutrient characteristics of Senna siamea grove in the semi-deciduous forest zone of Ghana. Open Geosci. 2020, 12, 443–451. [Google Scholar] [CrossRef]
  68. Foreign Agricultural Service. Coffee: World Markets and Trade; United States Department of Agriculture, 2021. Available online: https://apps.fas.usda.gov/psdonline/circulars/coffee.pdf (accessed on 15 November 2020).
Figure 1. Map of the study area and plantations where the research was conducted.
Sustainability 13 13823 g001
Figure 2. Monthly precipitation from November 2017 until November 2018 in Study Plantation 3.
Sustainability 13 13823 g002
Figure 3. Daily average air temperature and humidity in Study Plantation 3 at the sunny site.
Sustainability 13 13823 g003
Figure 4. (a) The total weight of coffee fruits per coffee shrub (kg), (b) weight of individual coffee beans (mg), (c) weight of 100 fresh coffee fruits (g), (d) weight of 100 dry coffee fruits (g) for shaded and sunny sites for all studied plantations.
Sustainability 13 13823 g004
Figure 5. Proportion of mature fruits from the total number of fresh fruits on the coffee shrub, by shade and plantation. Mean values, their 89% credible intervals, and measured values are shown.
Sustainability 13 13823 g005
Figure 6. Coffee stem diameter increment and soil moisture in studied plantations divided by shaded and sunny sites from 27 November 2017 to 3 May 2018. Water deficit <30% and water excess as >50% of soil moisture.
Sustainability 13 13823 g006
Figure 7. The monthly average coffee stem diameter changes during the day for each plantation (ac) and the monthly average air humidity and temperature (d) during the day in December 2017 (dry season).
Sustainability 13 13823 g007
Figure 8. The monthly average coffee-stem diameter changes during the day in shaded and sunny sites on the studied plantation (ac) and the monthly average air humidity and temperatures (d) during the day in May 2018 (wet season).
Sustainability 13 13823 g008
Table 1. The influence of shade on the mean value and variability of coffee bean weight and the differences between plantations. Sigma = standard deviation.
Parameters Impacting Coffee Bean Weight (mg)EstimateHDI 89%Probability of Direction (%)
Intercept—mean value for sun and Plantation 3161.63(149.20, 174.06)100.0
Difference for shade3.76(−8.65, 15.91)68.9
Difference for Plantation 1−27.93(−43.16, −12.46)99.8
Difference for Plantation 243.97(28.77, 58.66)100.0
Sigma (log link): estimate for sun and Plantation 32.79(2.70, 2.89)100.0
Sigma (log link): difference for shade−0.09(−0.18, 0.00)93.1
Sigma (log link): Difference for Plantation 1−0.35(−0.47, −0.24)100.0
Sigma (log link): Difference for Plantation 20.17(0.05, 0.29)99.0
Model with interaction shade: plantation
Difference for shade: Plantation 1 (Interaction)5.44(−26.4, 34.74)61.8
Difference for shade: Plantation 2 (Interaction)−26.87(−58.45, 1.83)92.4
Random effect: tree SD 28.19 (23.59, 33.31); tree/fruit SD 26.24 (24.65, 27.78). Significant differences are indicated in bold.
Table 2. Influence of shade on the mean value and variability of coffee bean area and the differences between plantations. Sigma = standard deviation.
Parameters Impacting Coffee Bean Area (mm2)EstimateHDI 89%Probability of Direction (%)
Intercept—mean value for sun and Plantation 345.11(42.66, 47.66)100.0
Difference for shade0.62(−1.83, 3.18)65.3
Difference for Plantation 1−5.68(−8.74, −2.60)99.7
Difference for Plantation 210.64(7.46, 13.73)100.0
Sigma (log link): estimate for sun and Plantation 31.40(1.29, 1.50)100.0
Sigma (log link): difference for shade0.04(−0.06, 0.13)72.78
Sigma (log link): Difference for Plantation 1−0.69(−0.81, −0.58)100.0
Sigma (log link): Difference for Plantation 2−0.22(−0.33, −0.10)99.9
Model with interaction shade: plantation
Difference for shade: Plantation 1 (Interaction)3.34(−2.89, 9.37)81.0
Difference for shade: Plantation 2 (Interaction)−1.81(−8.38, 4.26)68.8
Random effect: tree SD 5.79 (4.84, 6.78); tree/fruit SD 5.24 (4.93, 5.55). Significant differences are indicated in bold.
Table 3. Influence of shade on the mean value and variability of coffee bean length and the differences between plantations. Sigma = standard deviation.
Parameters Impacting Coffee Bean Length (mm)EstimateHDI 89%Probability of Direction (%)
Intercept—mean value for sun and Plantation 38.48(8.23, 8.73)100.0
Difference for shade0.17(−0.07, 0.44)86.6
Difference for Plantation 1−0.82(−1.11, −0.49)100.0
Difference for Plantation 21.17(0.85, 1.47)100.0
Sigma (log link): estimate for sun and Plantation 3−0.81(−0.92, −0.71)100.0
Sigma (log link): difference for shade0.09(0.00, 0.19)93.2
Sigma (log link): Difference for Plantation 1−0.56(−0.68, −0.45)100.0
Sigma (log link): Difference for Plantation 2−0.28(−0.40, −0.17)100.0
Model with interaction shade: plantation
Difference for shade: Plantation 1 (Interaction)0.59(0.00, 1.24)93.7
Difference for shade: Plantation 2 (Interaction)0.28(−0.32, 0.93)76.8
Random effect: tree SD 0.58 (0.48, 0.68); tree/fruit SD 0.55 (0.52, 0.59). Significant differences are indicated in bold.
Table 4. Influence of shade on the mean value and variability of coffee bean width and the differences between plantations. Sigma = standard deviation.
Parameters Impacting Coffee Bean Width (mm)EstimateHDI 89%Probability of Direction (%)
Intercept—mean value for sun and Plantation 36.70(6.48, 6.91)100.0
Difference for shade−0.00(−0.21, 0.23)50.1
Difference for Plantation 1−0.20(−0.47, 0.06)89.2
Difference for Plantation 20.61(0.33, 0.86)99.9
Sigma (log link): estimate for sun and Plantation 3−1.02(−1.12, −0.92)100.0
Sigma (log link): difference for shade0.02(−0.07, 0.12)66.4
Sigma (log link): Difference for Plantation 1−0.50(−0.61, −0.39)100.0
Sigma (log link): Difference for Plantation 2−0.18(−0.30, −0.07)99.2
Model with interaction shade: plantation
Difference for shade: Plantation 1 (Interaction)0.01(−0.48, 0.58)51.5
Difference for shade: Plantation 2 (Interaction)−0.54(−1.07, −0.01)94.5
Random effect: tree SD 0.50 (0.42, 0.58); tree/fruit SD 0.40 (0.37, 0.42). Significant differences are indicated in bold.
Table 5. Effect of shade and plantation on the total weight of coffee fruits per coffee shrub and on the wet and dry weights of 100 fruits. Analyses are based on a two-way frequentists ANOVA, including the interaction between shade and plantation.
ParameterEstimate95% CIp Value
Total weight of coffee fruits per coffee shrub (kg)
Intercept—mean value for sun and Plantation 39.08(4.30, 13.90)<0.0001
Difference for shade3.88(−2.88, 10.60)0.2548
Difference for Plantation 12.66(−4.10, 9.42)0.4334
Difference for Plantation 20.54(−6.22, 7.30)0.8733
Difference for shade: Plantation 1 interaction−3.51(−13.2, 6.18)0.4709
Difference for shade: Plantation 2 interaction−5.51(−15.1, 4.05)0.2528
Weight of 100 fruits—wet (g)
Intercept—mean value for sun and Plantation 3116(102, 131)<0.0001
Difference for shade2.1(−18.6, 22.8)0.8390
Difference for Plantation 1−18.7(−39.4, 2.1)0.0764
Difference for Plantation 238.9(18.2, 59.6)0.0004
Difference for shade: Plantation 1 interaction8.2(−21.1, 37.5)0.5750
Difference for shade: Plantation 2 interaction−4.4(−33.7, 24.9)0.7630
Weight of 100 fruits—dry (g)
Intercept—mean value for sun and Plantation 344.7(39.6, 49.9)<0.0001
Difference for shade−0.4(−7.7, 6.9)0.9130
Difference for Plantation 1−8.9(−16.2, −1.6)0.0178
Difference for Plantation 211.8(4.5, 19.1)0.0020
Difference for shade: Plantation 1 interaction3.8(−6.5, 14.2)0.4600
Difference for shade: Plantation 2 interaction−2.2(−12.5, 8.1)0.6700
Significant differences are indicated in bold.
Table 6. Influence of shade, plantation, and their interaction on the proportion of ripe fruits among the total fruit number (model #m.Ripeness.shade.shrub). Mean values and their 95% credible intervals are shown. Estimates of differences and their HDIs are on the logit scale.
ParameterEstimateHDI 95%Probability of Direction (%)
Shade—sun0.56(−1.20, 2.26)75.4
Plantation 1–31.03(−0.77, 2.68)87.7
Plantation 2–3−1.35(−3.14, 0.25)94.9
Shade 1: Plantation 1−1.61(−4.16, 0.75)90.0
Shade 1: Plantation 2−0.19(−2.57, 2.11)56.3
Table 7. Influence of shade on the ripeness variability.
Model IDModel SpecificationELPD DifferenceLOOICLOOIC SE
m.Ripeness.shrubshade × plantation + (1|Shrub_ID)0.0212.23.7
m.Ripeness.shade.shrubshade × plantation + (shade|Shrub_ID)−14.3240.89.7
m.Ripeness.simpleshade × plantation−345.6903.4182.3
Publisher’s Note: MDPI stays neutral with regard to jurisdictional claims in published maps and institutional affiliations.

