1. Introduction
The automotive industry has always been a significant contributor to the global economy since it represents one of the largest manufacturing industries [
1]. In Europe, this industry represents 6.1% of the total workforce and large percentage [
2] of total production and capital investment in the manufacturing sector–a turnover over 7% of EU gross domestic product (GDP) [
3]. Due to the high number of companies operating in the manufacturing sector, competitiveness between them has been increasing, motivating the awareness that to remain active in the market and to differentiate from different competitors, they would have to invest in innovation techniques among their operational areas [
4]. The insufficiency of control over the processes/activities carried out in a company affects its operating results and process performance, driving the company to identify which are the most affected areas that need to be improved. One of the strategies that has been adopted by companies over the past decades is the measurement of process performance, as well as the use of tools that allows the visualization and monitoring of their status [
5].
Measurement is a fundamental tool for all companies and institutions, since the result directly impacts the way of executing the processes and the behavior of those who make part of it, setting them at an evaluation stage in relation to the objectives set by the organization [
6]. Hence, performance measurement systems (PMS) were introduced [
7], which allows the visualization and analysis of the performance of the different processes [
8]. In order to achieve a proper performance of such types of systems, it is necessary to define key performance indicators (KPIs) [
9,
10]. KPIs are, undoubtedly, the essential measurement and control tools within all the processes of an organization. These indicators allow identifying if the activities are being carried out efficiently, and help optimizing all the resources involved [
11]. KPIs must reflect the corporate strategy and competitive factors of the organization, and they must focus on the method to achieve results [
12,
13]. KPIs have also to be meaningful, coherent, objective driven, and a standard for objectively comparing different organizations [
14].
However, the process of selecting KPIs can be difficult since there is a wide range of alternatives from which, in order to obtain the greatest benefit, an adequate number must be chosen. Therefore, it is important to define the main concepts of the decision-making process and select the most suitable KPIs. This can be achieved by resorting to analytic network process (ANP) [
15]. Therefore, many professionals are relying on decision-making methodologies [
16,
17,
18], such as ANP, to review which are the aspects or criteria that must be considered in management, in order to obtain a greater benefit for the company.
In previous studies, the ANP model has been used to assist the decision-maker in the process of selecting KPIs, being identified as a valuable and powerful tool for management, since it uses the decision-makers input to prioritize KPIs logically and consistently [
19]. However, just a small number of studies concerning the application of the ANP to prioritize KPIs for manufacturing industry were identified [
19,
20,
21,
22]. Specifically in the automotive tool, die and molding industry, where only one study was identified [
23]. However, this study focused on the development of generic KPIs for smart factories and tested their method in several industries and only one of those industries comprised injection molding.
The automotive tool, die, and molding industry is a specific industry with unique characteristics. Although most KPIs are general in nature and can be easily modeled to different processes, industry specific KPIs would allow maintaining a good alignment with the strategy and processes of tool, die, and molding manufacturing processes.
Therefore, the objective of this research is the development of a method to help the decision-making process in the selection of appropriate KPIs for the mold industry. To achieve this goal, employing the ANP model to map the relationships between the various dimensions of performance evaluation is proposed. The aim is to assist in the selection of KPIs aligned with the strategic objectives. This type of study is highly useful for this sector, since it has unique characteristics, and this type of application has been unexplored. Through the application of the decision model, it is possible to obtain a list of KPIs ordered by degree of importance, consequently assisting the decision-maker.
This article is divided into 6 different sections.
Section 2 a theoretical review of the performance evaluation methodologies and KPI selection processes is made. The methodology proposed in the performance evaluation and KPI selection process is presented in
Section 3, and in
Section 4 it is applied though the realization of a case study in an automotive press molding industry, where the results and implementation process of the KPIs are discussed.
Section 5 addresses the discussion and analysis of results. Finally, in
Section 6, overall conclusions are given.
2. Literature Review
2.1. Performance Evaluation and Performance Measures
Due to the high competitiveness environment in which the industry finds itself in, the interest in techniques and tools that enable better control and supervision of the companies’ performance has been steadily growing [
24]. The research for techniques and tools for controlling and visualizing performance allows companies to identify gaps in their processes, allowing an improved management of their resources, enhancing possible improvements in them [
11]. The use of KPIs emerges as a tool to evaluate and quantify the performance of the processes, regarding a set of previously established objectives [
25]. The use of these metrics has been embraced in several areas such as education, agriculture [
26], financial service [
27], transport [
28], industry [
29], healthcare [
30], supply chain [
31], risk management [
32], quality control [
33], maintenance [
34], and construction [
35], among others.
Currently, many different metrics are employed for measuring the performance in almost all types of processes. However, sometimes these happen to be erroneous and used incorrectly, leading companies to work with wrong measures and be incorrectly monitored. Inadequate metrics can lead to problems such as poor information concerning the root causes of many problems [
36] or poor alignment between the strategic and operational levels of companies [
37,
38]. Hence, the use of inaccurate or inadequate indicators causes companies to fail in meeting the initially established objectives.
The use of key performance indicators (KPIs) as a metric to control has been much more recurrent due to the fast growth and adaptation of companies to the concepts of Industry 4.0, which aims to access information through technological means, greatly facilitating the use of KPIs [
39]. Therefore, the use of KPIs becomes a tool of great importance for management, since through its use it becomes possible to separate non-useful from useful information, offering company managers a transparent view, and possible paths on how they can improve these processes [
11]. However, KPIs can also be used in the risk analysis area, as they demonstrate where problems are located in processes that cause delays and malfunctions in the company (bottleneck) [
40]. Accordingly, KPIs are metrics that define the state of the process to be studied in comparison to a previously established objective [
41].
2.2. Multicriteria Analysis to Support Decision in Choosing KPIs
Performance evaluation can be defined as a systematic activity, which consists of quantifying, effectively and efficiently, a concept or an action. Consequently, the activity of measuring the performance of the processes involves the use of performance measurement systems (PMS) in order to take advantage and benefit from the available information, hence changing companies by making them open organizations in terms of sharing information [
42]. For companies to benefit from PMS, it is crucial that these systems present clear definitions of the performance of activities and that the metrics are highly accurate. Hence, it is essential that a rigorous selection of KPIs is used to control the activities that are being carried out [
43]. However, selecting KPIs is a complex task for companies, in addition to being one of the most key aspects in the development and use of PMS, the choice should be very restrictive since only a small number of KPIs should be selected. The restrictive selection is done as it is intended to avoid overloading the PMS with irrelevant information, allowing companies to obtain a clear view of the performance of their activities. However, it is a common practice to choose a higher number of KPIs for measuring the company’s performance by its managers, since there are is high number of KPIs available for them to choose [
43].
Since the number of KPIs to be selected represents a finite number and its selection decision process implies the analysis of different factors to be taken into account, it is possible to state that the process is characterized as a multiple criteria decision making (MCDM) [
44,
45]. Through model application, it is possible to identify which KPIs are most relevant for measuring the company’s performance. In literature, the most common MCDM models include the elimination et choice translating reality (ELECTRE) model; the technique for order of preference by similarity to ideal solution (TOPSIS) model; the analytic hierarchy process (AHP) model [
46]; and the fuzzy AHP model [
47].
Table 1 shows the main use of such models in literature.
By observing the results in
Table 1, it is possible to verify that there is a higher incidence of studies regarding the application of the AHP model. As for its use, the application of decision models is comprehensive to a wide range of areas in the KPI selection process.
2.3. Analytic Network Process
The use of analytical network process (ANP) in decision problems, specifically in problems related to performance measurement, is still very poor in the scientific literature. However, in the study [
56], it was possible to verify the application of ANP in the scope of decision problems, having presented some of the application areas of the ANP, as well as some examples of its use. With the realization of this study, it was possible to conclude that the areas where the application of ANP is more common are business and financial management. Hence, in
Table 2 several studies in which the ANP was applied in the KPI selection process can be observed, as well as their area of application.
The identified studies where the ANP was used to assist the selection of KPIs appears to be quite comprehensive as to their areas of application. However, a limitation in the research is found regarding the application area, and no studies of the application of the ANP model were identified in the automotive press molding industry.
The ANP is an MCDM considered a generalization of AHP. The ANP was developed by Saaty in 1980 to assist in the decision-making process in problems where a need exists to relate the elements in the clusters, but also relate the different clusters [
61]. The largest difference between the AHP and the ANP is the fact that the ANP does not require a linear hierarchical structure, but rather a structure where it is possible to relate the different elements of the several hierarchical levels, modeling the decision problem in a network structure. In addition to this differentiating aspect, the ANP also presents a feedback relationship between the different hierarchical levels of the structure. Therefore, when using the network structure, where all factors and criteria that influence the decision are included, it is possible to identify the feedback relationships that exist not only within the clusters themselves (internal dependency) but also among others (external dependency) [
52,
64].
The ANP’s most known advantage is that the method allows comparisons to be made not only between elements within the same cluster but also between elements of different clusters, considering the impact of these dependencies through feedback, leading this method to show more reliable results. However, since this method considers different existing dependencies, as well as the impact they have on each other, carrying out a large number of comparisons is required and, consequently, generates problems of inconsistency [
57,
65]. Hence, ANP captures the inherent complexity of decision problems instead of forcing them into a hierarchy simplification, such as in the case of AHP or TOPSIS [
66]. Since the automotive tool, die, and molding industry is a specific industry with distinctive characteristics and many KPIs, an ANP decision model with many comparisons could be a solid contribution to the literature.
3. Methodology for KPI Selection
3.1. Proposed ANP Model to Select KPIs for Mold Manufacturing
To aid in the KPI selection process an ANP decision model is used, since it can evaluate the influences that KPIs have on each other, either directly or indirectly (feedback relations) [
52,
64]. The proposed ANP model, as depicted in
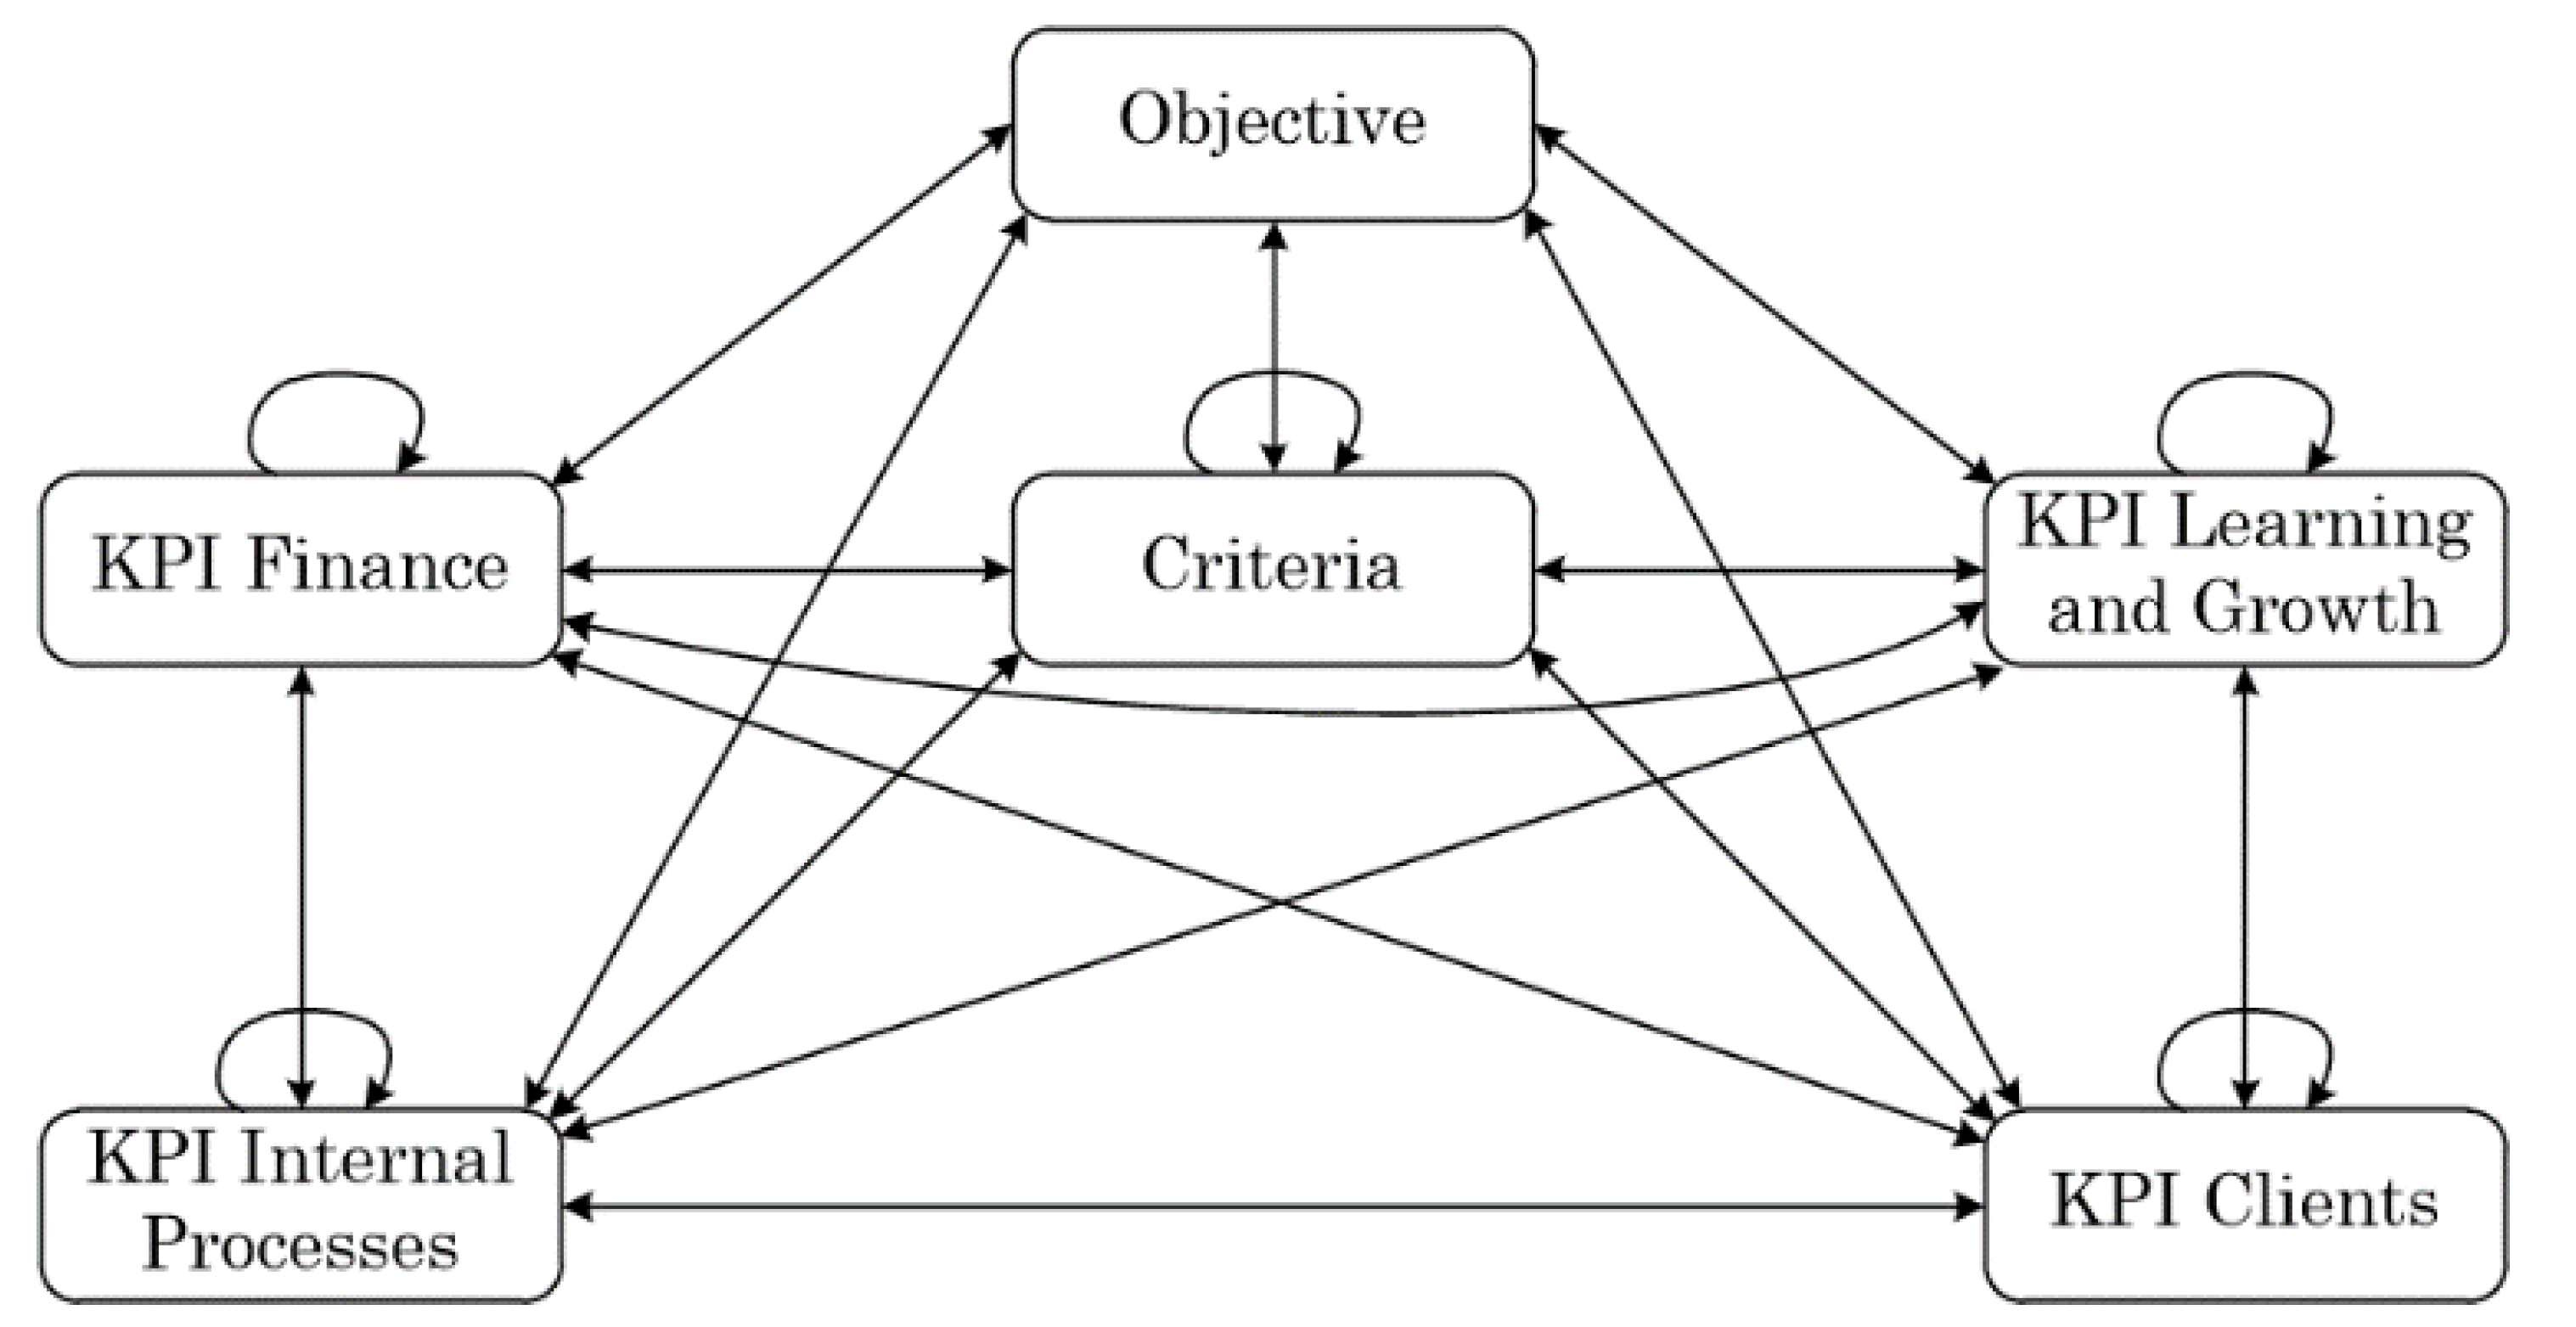
Figure 1, consists of three sets of clusters: objective, criteria, and alternatives.
The “objective” cluster consists of a single element, which is the objective of the problem: “the identification of KPIs that allow monitoring performance of the mold manufacturing process”.
The objective is fulfilled through the selection of alternatives (i.e., KPIs) evaluated through a set of criteria. The “criteria” cluster consists of a set of factors that influence the decision-making process, from the set of alternatives presented to the decision-maker. The existence of criteria ensures that the decision-maker considers different aspects when choosing between different alternatives. The set of criteria selected was based on a research process in the scientific literature, with the following criteria and respectively associated identified objectives [
61]:
Costs: reduce;
Productivity: increase;
Quality: increase;
Employee satisfaction: increase;
Safety: increase;
Learning and growth: increase;
Customer satisfaction: increase.
The “alternatives” cluster is made of the several alternatives available for the decision-maker to make a choice. Thus, KPIs represent the alternatives that the decision-maker has. The arrangement between those clusters in the structure of network instead of a hierarchy due to the high number of existing KPIs that are adequate to mold manufacturing performance measurement (in
Section 3.3 we address the KPI identification in more detail). Since cluster size should not exceed nine elements [
67], developing the ANP model led to arranging KPIs in Balanced Scorecard (BSC) categories [
68,
69]:
Financial: It includes financial KPIs, such as profit and return on investment, allowing shareholders to verify the company’s financial success;
Internal processes: In this perspective there are KPIs that reflect the effectiveness and efficiency of the operations carried out in the company, ensuring that they meet the expectations and requirements imposed by both the company itself and the customer. An example of KPIs used in this perspective can be productivity and efficiency;
Learning and growth: It refers to the infrastructure and available resources that the company holds, whether physical, human, or organizational procedures. Therefore, KPIs related to the performance of employees and their development within the company are used, such as employee satisfaction, hours of training, and retention rate;
Customers: This category is based on the necessary measures to satisfy the requirements imposed by the customer and to remain competitive in the market. As such, customer oriented KPIs are used, such as customer satisfaction and customer retention.
Apart from splitting the “alternatives” cluster into four BSC clusters, another reason for selecting ANP instead of AHP was the dependencies among cluster elements. Before model implementation, direct and reciprocal dependencies must be identified [
70]. In
Section 3.4.1 the procedure to map dependencies is explained.
3.2. The Proposed Method for Selecting and Implementing KPIs
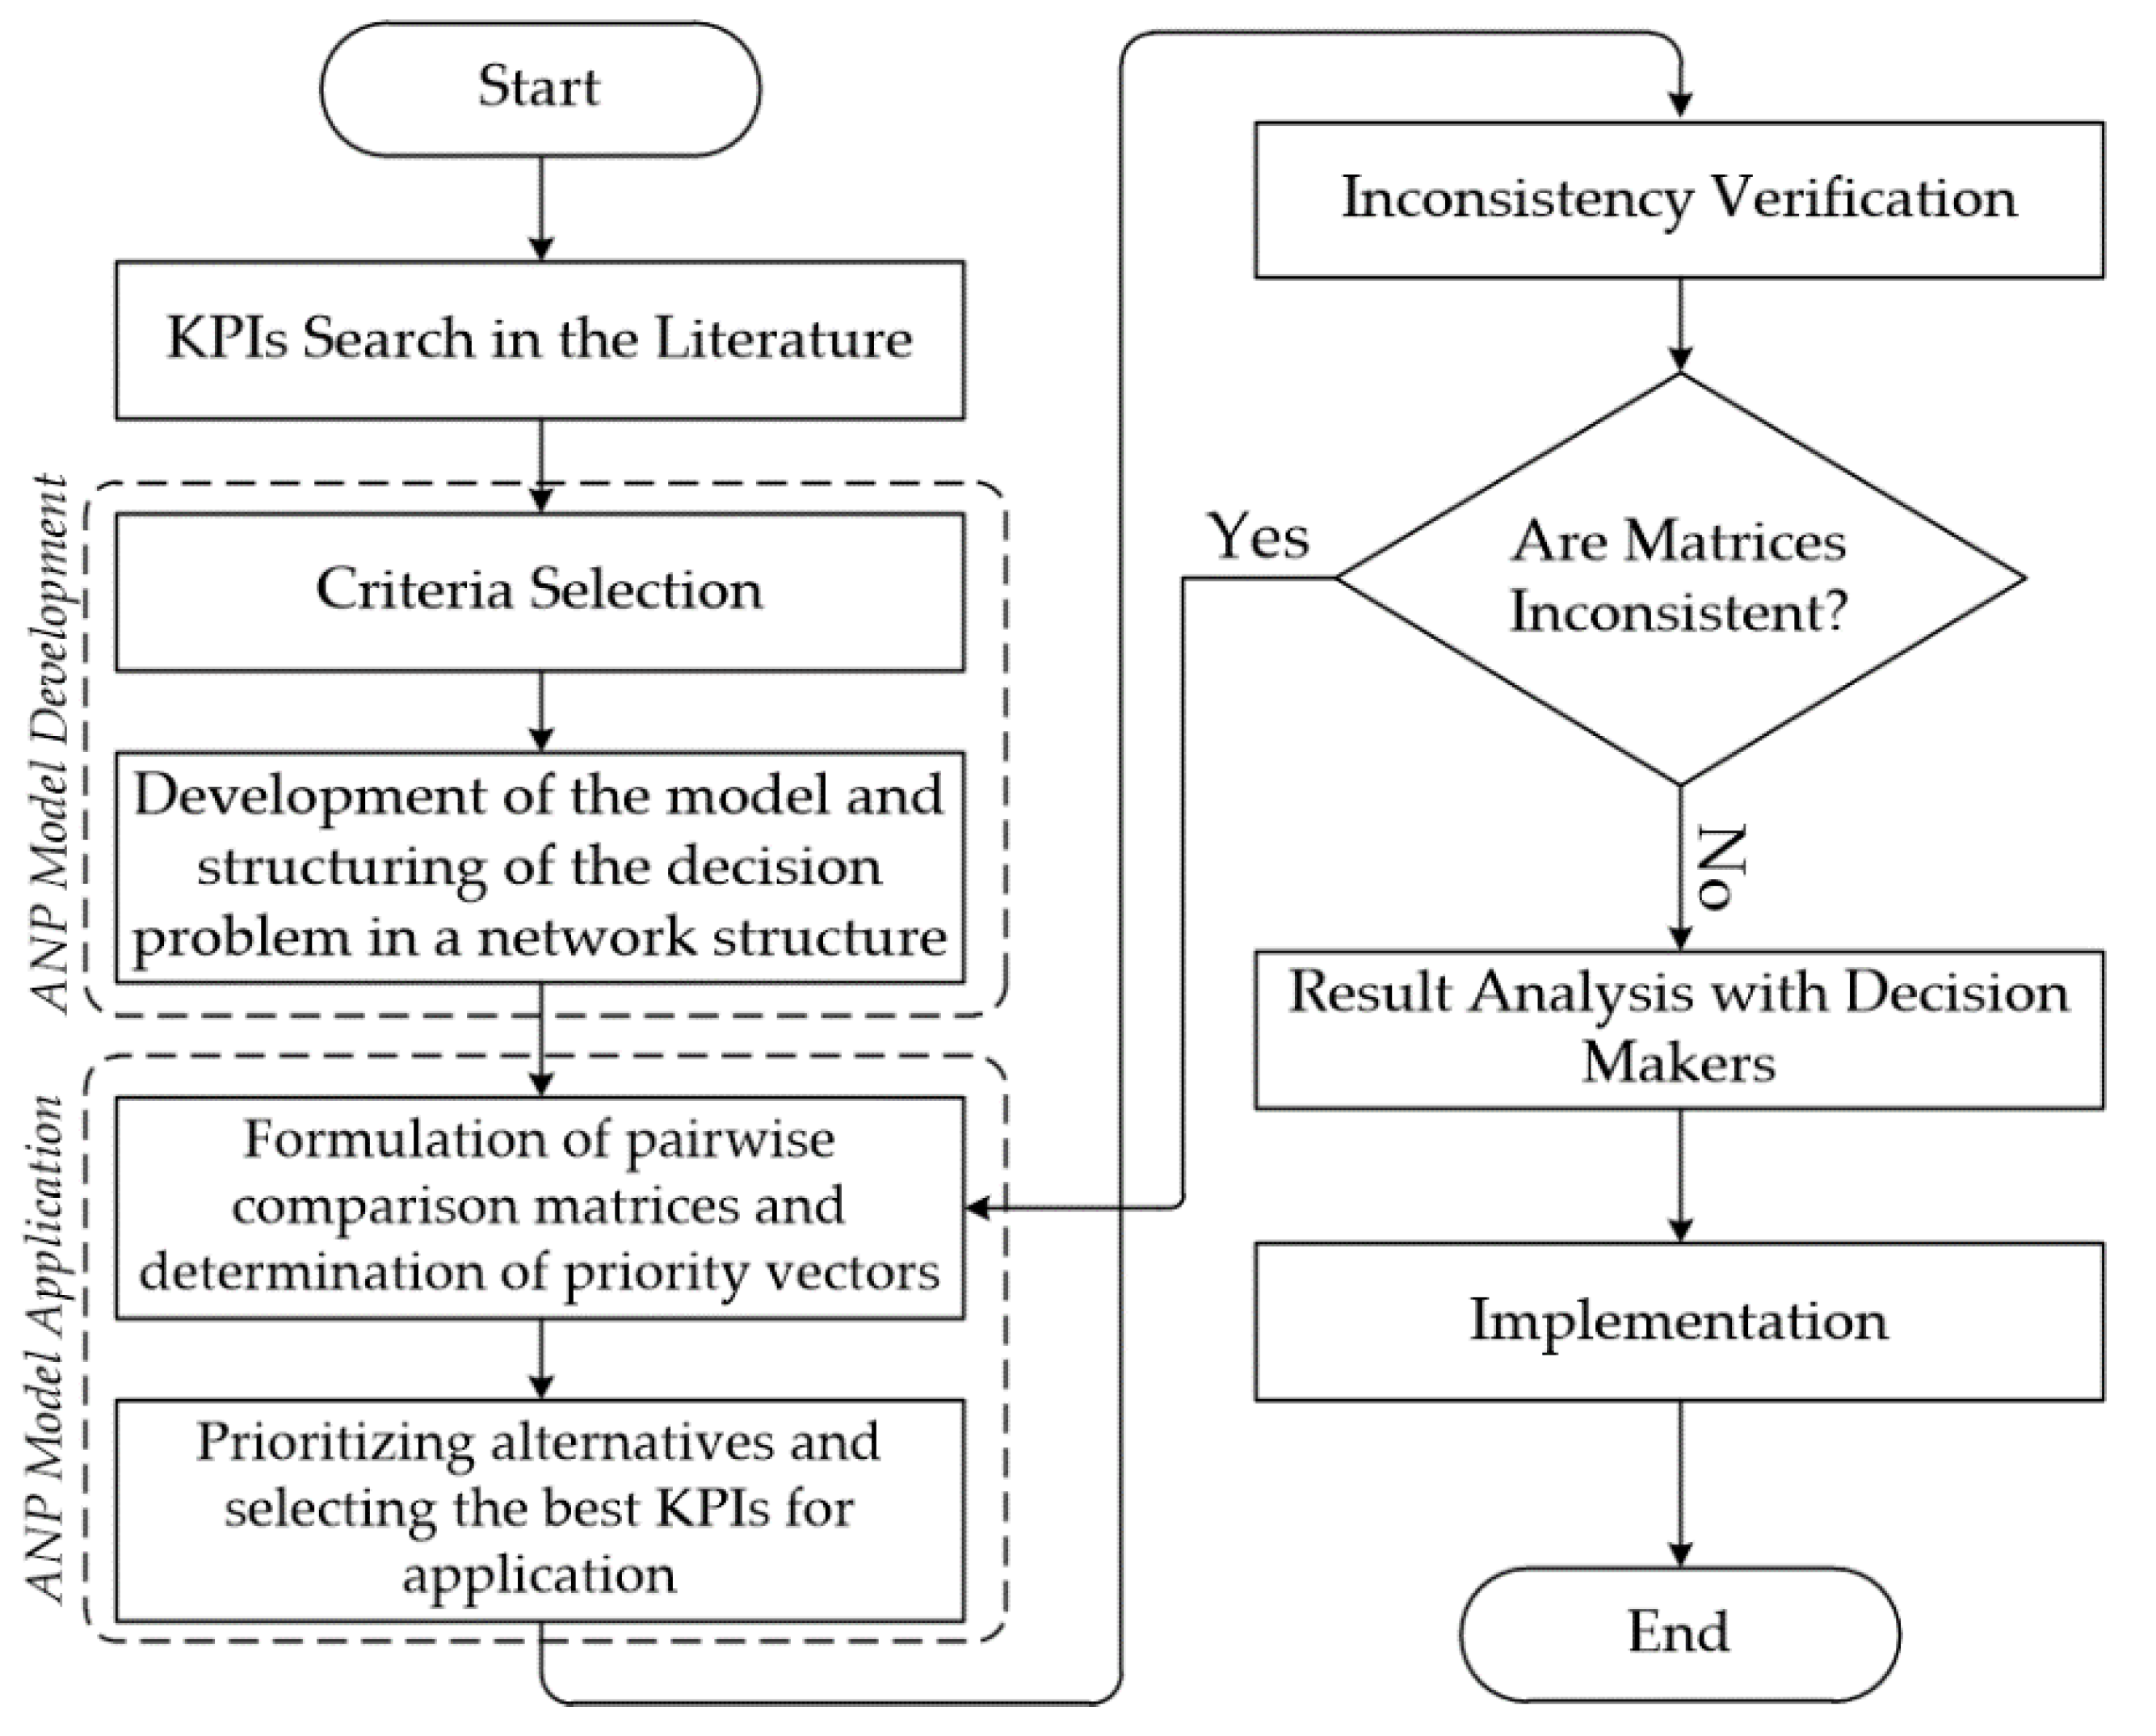
In order to assist the selection process of KPIs using the suggested ANP model, the method depicted in
Figure 2 is proposed. The KPIs selection process starts with the identification of KPIs in literature. Subsequent steps are organized in two phases: model development and model application. In the first phase, criteria to evaluate alternatives is researched in literature and selected. Then, dependencies among objects (objective, criteria, and KPIs) are mapped. The subsequent phase consists in obtaining pairwise comparisons correspondent to objects’ relationships. After the ANP model is developed and applied, one must verify the matrices’ inconsistencies. When matrices are consistent, results must be analyzed and discussed with decision-makers. Last, after selecting the necessary KPIs, then they are implemented.
3.3. KPIs Applied in the Manufacturing and Mold Industry
In order to identify the existing KPIs in the manufacturing and mold industries a literature review was conducted. The research carried out was based on publisher search engines such as Science Direct, Emerald Insight, and Springer, where terms such as “mold casting KPIs”; “KPI manufacturing industry”; “KPI industry”; and “Performance indicators manufacturing industry” were mostly searched.
As many as 58 KPIs were identified through this search that can be observed in
Table 3, these being related to industry, which comprise areas such as planning, project management, financial, logistics, environmental, quality, production, and security. Although the objective was to determine KPIs for manufacturing and mold industry, the identified KPIs are general in nature and transversal to other industry sectors. Through this literature review it was not possible to identify industry specific KPIs for mold manufacturing. However, the correct application of KPIs requires their correct adaptation to the manufacturing and business processes.
3.4. Development and Implementation of the ANP Decision Model
The ANP development and implementation process is performed in the following steps [
43]:
where
is the individual pairwise comparison of elements I and j; and
is the
reciprocal value.
3.4.1. Development of the Model and Structuring of the Decision Problem in a Network Structure
The first phase of the ANP is the formulation of the problem. The problem must be defined very clearly and transformed into a logical system. This structure is developed through the opinions of experts and the decision-makers who face the problem. This information can be obtained through interviews, questionnaires, brainstorming, focus group interviews, and the Delphi Method [
54,
64].
To map the relationships and dependencies between elements, a matrix was prepared where the six different clusters that make up the model (objective, criteria, alternative 1, alternative 2, alternative 3, and alternative 4) are represented with their respective elements in rows and columns. The matrix is read from rows to columns, that is, if the element represented in the row influences the element presented in the column, this influence should be marked with an X, as it is possible to verify in the example of
Table 4.
In this example, it can be observed that the element under analysis is the “KPI-utilized capacity” belonging to the alternative cluster 1 (KPI of the internal processes category). By analyzing the internal dependencies, it is possible to conclude that changes (either increase or decrease) in the value of “KPI-capacity utilized” cause changes in the values of “KPI-number of nonconformities”, and this relationship is represented by an X. In this case, by increasing the percentage of occupied capacity in the company, this means performing a greater number of tasks and processes, which naturally leads to a greater number of nonconformities.
Having identified the clusters and the respective elements that make the ANP model (see
Section 3.1), it is possible to model the same through the SuperDecisions software [
78], reducing the complexity of the structuring the model [
21,
64]. SuperDecisions software is a decision-making software which works based on two MCDM method and developed by Saaty and Saaty [
78]. In
Figure 2 is presented the proposed ANP structure for KPI selection.
3.4.2. Formulation of Pairwise Comparison Matrices and Determination of Priority Vectors
The second phase of the ANP implementation is similar to the one of AHP, where pairwise comparisons are carried out. Comparisons are made between the elements of the clusters and the objective established, to verify the impact they have, and between elements that have internal and external relations to the clusters. To identify which comparisons are necessary, the relationships between the elements of the clusters is verified. The existence of relationships between elements can be observed when elements have an impact on each other when the same objective is intended to be achieved [
66].
Therefore, to aid the decision-making process, relationships between elements are identified by an expert in the area, consequently reducing the number of comparisons needed to be made.
Once the pairwise comparisons are performed, it is possible to form a comparison matrix that expresses the importance of each element. However, to obtain the relative weight of each of the elements, it is necessary to normalize the data. Once normalized, it is necessary to assess the inconsistency of the process, that is, during the process of pairwise comparisons and assessment between elements the decision-maker may be incorrectly assigning weights since they are subjectively expressed, not following a consistent logic. After the consistency of the process is verified, it is possible to proceed to the next phase [
66].
3.4.3. Development of the Supermatrix
The supermatrix is the tool responsible for obtaining priorities in a network structure system, where interdependent influences between its elements exist. The supermatrix is a matrix subdivided into other matrices, which represent the relationships between the clusters in the structure [
60]. There are 3 types of supermatrix in the ANP [
54,
64]: unweighted supermatrix, weighted supermatrix, and the limit supermatrix.
3.4.4. Prioritizing Alternatives and Choosing the Best
With the limit supermatrix it is possible to select the best alternative since the values that are present in the column of alternatives represent the weights/priorities attributed to each one. The alternative that presents the greatest value should be the one that best suits the resolution of the problem in question, based on the perspective of the decision-maker [
54,
64].
4. The Case Study: Automotive Press Molding Industry
This section focuses on the presentation of the case study carried out at an automotive press molding industry, where there was the necessity to implement a small number of KPIs to better manage their activities and processes but also to focus resources, whether human, financial, or material, on the areas that need it most.
4.1. Company Characterization
This case study was conducted in a mold and stamping production unit that belongs to a European vehicle manufacturer. This mold and stamping production unit is independently managed and located in Portugal, and has a presence in five other countries, producing molds and stampings for the main manufacturer. Due to the increasing diversity of vehicle models and the increase of revenues, the production unit needed to increase its production capacity leading to high levels of complexity in its processes.
In this context, the ANP model and the proposed methodology were implemented to assist the decision-making process in choosing the KPIs to be used for monitoring the processes.
4.2. Data Gathering
Data collection was conducted using a triangulation approach in order to cover different perspectives of the object of study [
80]. Hence, this stage encompassed the development of interview protocols and the conduction of semi-structured interviews. The first interview protocols were based on literature review findings, where the KPIs were validated with mold industry experts. Later interview protocols were based on pairwise comparisons from the ANP model, where the model was implemented.
The semi-structured interviews were conceived to capture additional information such as industry specific procedures and missing information from the literature findings. On later stages, the same approach was used to validate results from pairwise comparison matrices and inconsistency verification (see steps 5 to 7 in
Section 3.4) and results validation.
In this case study, the following respondents were selected:
These seven respondents were selected since they have an important role in daily base operations, having on average 10 years of experience, each, in their role. Therefore, the selected respondents represent a group of experts and coordinators from all areas of the industrial unit, enabling to obtain information with the greatest possible value.
Interviews were conducted in a semi-structured way, not only to obtain information on the previously defined KPIs but also to identify possible KPIs to be used and their details. The interview was divided into two different parts, being the first part the identification of existing KPIs, as well as all their details (periodicity, database, type of measurement). The second part of the interview aimed to identify new KPIs that could be used to measure the overall performance of the company’s activities.
Most of the KPIs currently being used are categorized as part of the internal and financial processes, therefore excluding KPIs that could integrate the categories of learning and growth and customers. However, they are not being used in a strategic perspective since they are not implemented in the top manager’s monitoring dashboard, making it difficult to monitor the overall performance of the company’s activities and processes.
In the second phase of the interview, it was possible to list 29 KPIs, 10 belonging to the financial category, 15 to internal processes, 2 to learning and growth, and 2 to the customer. By analyzing the results, it is possible to conclude that the majority of KPIs are represented in the financial and internal processes categories, being these the most important categories, from the point of view of the respondents, for measuring the general performance of the company.
When comparing the KPIs currently applied by the company and the KPIs identified by the respondents with the different KPIs in the different areas present in the scientific literature, it is possible to conclude that the areas of logistics, maintenance, and sustainability are the least focused to measure performance in the company, even though several activities are carried out on those categories.
In this case study, the objective is to develop and apply the ANP decision model in the process of selecting KPIs. However, since the number of KPIs is considerable (58 KPIs), and since there are limitations in the ANP model in comparing more than 9 elements per matrix, it was necessary to reduce the KPIs to be used in the ANP model. To reduce the number of KPIs, a questionnaire was prepared, with the main objective to obtain the individual opinions of each of the respondents on the importance of the listed KPIs to assess the company’s overall performance. This questionnaire was addressed to the same respondents previously mentioned, being presented with four different tables, according to the BSC categories, with the KPIs indicated by them previously for measuring the company’s general performance, and the KPIs listed from the scientific literature. In the questionnaire, an importance scale from 1 to 5 was presented for the respondents to be able to express their opinion regarding the listed KPIs. The criteria applied for selecting KPIs was the importance and the coverage of the BSC perspectives. Only KPIs classified as important (importance level 4) and very important (importance level 5) were selected. In
Table 5 are presented the obtained 17 KPIs.
Since the selected KPIs cover all the BSC categories, no additional procedures were devised. However, as a future refinement for the model the KPI pre-selection procedure can be improved using TOPSIS in order to select the most important KPIs according to the organization’s priority [
31,
81].
After selecting the KPIs that will integrate the model, it is possible to proceed with the structuring and application of the ANP model.
4.3. Application of the ANP Decision Model
To carry out comparisons and subsequent selection of KPIs, the company’s stakeholder was designated as the decision-maker. The stakeholder has been within the Volkswagen group for about 16 years, having extensive knowledge of most of the processes carried out in the group.
4.3.1. Development of the Model and Structuring of the Decision Problem in a Network Structure
The “objective” cluster consists of a single element, defined by the person responsible for implementing the KPIs in the company. The objective of the problem to which the model intends to provide an answer is to improve the performance of activities carried out in the company, by using KPIs.
The “criteria” cluster is composed of a set of elements (criteria) that aim to influence the decision-making process of the decision-maker, by presenting him with different perspectives. The criteria selected in this case study are represented in
Section 3.4.
Finally, the “alternatives” cluster covers the entire set of alternatives that the decision-maker has at his disposal to choose from. The elements present in each of the alternatives are consequently the KPIs of each category, as indicated in
Table 5.
4.3.2. Formulation of Pairwise Comparison Matrices and Determination of Priority Vectors
In order to reduce the number of comparisons to be made by the decision-maker, the relationships between the elements of the different clusters were verified by conducting a questionnaire to the planning supervisor since he has an overview of all processes and activities carried out in the company.
Table 6 shows an example, where it is intended to illustrate how the relationships were identified by the planning supervisor. The relationships between elements can be identified in the matrix, in which if the element represented in the line influences the element in the column, its relationship will be identified with an X. To better explain this example, the elements of each cluster are represented by a coded symbol, i.e., O1 is the element of the criteria “objective”, C1 to C7 represents the criteria of the cluster “criteria” and F1, F2, and F3 represents the three KPIs of the cluster “alternative 1”.
Before performing the identification of relationships between the elements, the number of necessary comparisons to be made as well as the number of matrices were calculated. It was found that there would be necessary to make 125 comparison matrices and 1275 comparisons between the several elements of the model. However, when applying this methodology, it was possible to reduce the value to about 75 comparison matrices and 299 the number of comparisons to be made. Through the application of this methodology, it was possible to reduce the number of comparisons to be made by the decision-maker by circa 80%.
When presenting the ANP model to the decision-maker, the different clusters were identified and the elements were explained individually (criteria and KPIs) so that the top manager could present the necessary model knowledge to make the comparisons as logical as possible. Then, the objective of applying the model was presented, which would be to obtain the prioritization of the listed KPIs so that it could assist its decision-making process in selecting the KPIs for monitoring the company’s overall performance.
All 299 comparisons were made, and some inconsistencies were identified while performing the inconsistency analysis. As the existence of inconsistencies impairs the authenticity of the result that can be obtained with the application of the model, it was necessary to convert the inconsistent matrices into consistent ones. Through meetings with the decision-maker, concepts such as what are inconsistencies and how they originate were explained. Consequently, when making new comparisons and analyzing the consistency ratio, the process became consistent. When analyzing the entire process of inconsistence verification, it was found that there was a greater difficulty on the part of the decision-maker when making comparisons concerning the elements of the cluster alternative 2, since it presented a higher number of inconsistent matrices.
4.3.3. Development of the Supermatrix
Supermatrix have in their structure all elements of the clusters, with existing relationships being represented. The supermatrix was developed using the SuperDecisions software, where the ANP was modeled obtaining all supermatrix automatically.
4.3.4. Prioritizing Alternatives and Choosing the Best
When obtaining the limit supermatrix, it is possible to verify the importance that each element of the different alternatives presents for the defined objective. When verifying the last column of the limit supermatrix, the importance/weight that the KPIs and criteria must achieve the objective are verified, being these values represented in
Table 7. The higher the value displayed by the elements in the column, the more importance it will have to achieve the objective.
By observing the results in
Table 7, it is possible to conclude that, according to the decision of the decision-maker, the KPIs of the “financial” category are more important since they are in the top four (in terms of importance). Subsequently, it is possible to confirm that the KPIs related to the category “customers” are more important, followed by the KPIs of the category “internal processes”. Consequently, if the decision-maker proceeds to select the 10 most important KPIs, the KPIs from the “learning and growth” category would not be included since these are less important.
In addition, it is also possible to verify the importance attached to the established criteria.
Table 8 shows the criteria ordered according to the importance attributed by the decision-maker in the decision process.
The “cost” criterion is the most important for the decision-maker, presenting a standardized value much higher than the other criteria. The second and third most criteria are “quality” and “productivity”, with only a slight discrepancy concerning the importance attributed to them. Then, greater importance was given to the criteria “customer satisfaction” and “learning and growth”, in the same situation as the previous criteria. Finally, importance was attributed to the criteria “employee satisfaction” and “safety”, with a minimum difference in the importance attributed to them.
5. Results Validation
After the ANP model was applied, the obtained results were validated with decision-makers (i.e., the case study participants). Through the application of the ANP decision model, it was possible to obtain the ranking of the KPIs of the different categories (alternatives), regarding the importance attributed to them, and considering all the existing influences in the model’s network structure. However, the model only aims to assist the decision-maker in his decision-making process, by presenting results based on facts. The results obtained from the application of the ANP model were presented to the decision-maker, indicating the fact that the results of the model are merely a suggestion for solving the problem in question. Therefore, the decision-maker proceeded to validate and select a set of KPIs to measure the company’s overall performance.
The KPIs represented in
Table 9 were selected by the decision-maker, showing the order of prioritization of the 17 pre-selected KPIs. However, the order of prioritization of the KPIs concerning the other KPIs belonging to the same cluster (normalized value) is also presented, excluding the importance that the KPIs of the other clusters may have and only visualize the importance for each category (normalized rank). Analyzing the 9 KPIs chosen by the decision-maker, 6 do belong to the set of 17 KPIs pre-selected by the area coordinators, which were part of the ANP model. Of these 6 KPIs, it is possible to verify that 5 of them can be found in the list of the 10 KPIs that present greater importance in the total set of 17 KPIs. However, there are 3 KPIs that have no value in the columns since they are not included in the set of 17 KPIs pre-selected by the area responsible, and still were chosen to measure performance.
During the meeting at which the decision-maker indicated which KPIs he would choose to measure the company’s overall performance, the following points were discussed: “What was the reason that led him to choose KPIs that were not on the shortlist? What led him to choose KPIs with a different prioritization order?”. The decision-maker justified having chosen KPIs that were not on the list of 17 pre-selected KPIs (but that were specified in the total list of 58 KPIs) due to the fact that they were able to measure the performance of crucial company activities.
All three KPIs had a common element that led the top manager to choose them, which is the low difficulty of obtaining information and processing their data.
When addressing the question of why the decision-maker chose KPIs with a different order of prioritization, he justified choosing the KPIs according to the degree of general information transmitted to measure the company’s performance and the ease of gathering/analyzing data.
Finally, the application of ANP in this study showed a few disadvantages such as the large number of comparisons needed and consequently inconsistency problems. The data gathering process also has some disadvantages such as the lack of consensus among the respondents when listing the 17 KPIs. Regarding the bibliographic research, a small number of studies concerning the application of ANP in the process of selecting KPIs in manufacturing industries proved to be a limitation of this study.
6. Conclusions
The use of KPIs allows companies to monitor the performance of their activities and processes so that improvements can be made, by investing in human, material, and financial resources. However, to avoid overprocessing, a small number of KPIs must be selected to focus on the processes and activities that need to be monitored. The aim of this study was to research and develop an ANP decision model in the process of selecting KPIs, applied to the mold manufacturing sector in the automotive sector, as well as identifying and implement methodologies that would allow its development and implementation. During the initial research, it was possible to verify that the use of decision models is quite common to solve problems related to the prioritizing of KPIs, especially the decision models ELECTRE, TOPSIS, AHP, and ANP. Therefore, this study aimed not only to assist the decision-maker to choose KPIs to monitor and improve the performance in an automotive industry but also to enhance scientific studies.
Methodologies that allow the development and simplification of the ANP model were identified, such as the organization of the KPIs into the four categories of the BSC, a pre-selection of KPIs that aims to reduce the number of KPIs to integrate the model, and the identification of relationships between the elements present in the model structure. Through the application of this set of methodologies, it was possible to develop the ANP model applied to the selection of KPIs, in a simplified manner. The ANP model was developed using the SuperDecisions software, which allows to structure and apply the model.
In this study, the application of an ANP model in the KPI selection process was proposed, since it allows making comparisons between the elements and clusters presented in the model, making it possible to have feedback relationship between the different hierarchical levels. The structure of the ANP is composed of three different types of clusters (objective, criteria, alternatives), being the alternatives cluster divided into the four categories of the BSC since the set of elements present a high number of KPIs. The way ANP is structed is an advantage of its use since the different categories of the BSC include all areas from the company’s operations. Besides, the model also allowed the integration of a set of criteria that influenced the decision-maker when making comparisons.
Throughout the scientific research it was also possible to identify a list of KPIs that can be applied in the tool, die, and mold manufacturing industry, covering their most operation areas. This study allowed the development of an ANP model to prioritize KPIs and therefore assist the decision-maker in this type of problems. To validate the decision model, a case study was carried out at a tool, die, and mold manufacturing industry, where data gathering methodologies were applied. These methodologies not only include listing the KPIs, but also to pre-select them and identify their relationships. Therefore, when applying these methodologies, it was possible to simplify the model by reducing the number of KPIs to be integrated from 58 to 17 (these 58 KPIs being the aggregation of the 58 KPIs listed from the literature and the 29 KPIs obtained from the interviews). By developing and applying the ANP model, it was possible to select a set of 9 KPIs from a total of 17 under analysis, assisting the decision-maker in its analysis.
Future work will address three aspects of the proposed models: the improvement of the KPIs pre-selection method, validation of results using sensitivity analysis, and test and validation of the proposed model in other areas. One of the limitations of ANP models is the difficulty to perform a high number of comparisons because of the inconsistency problems. To address this limitation in the proposed model a pre-selection based on a Likert scale of each KPI was made. An alternative method to make the pre-selection could be based on Pareto’s Law, by selecting the more relevant KPIs, or using TOPSIS [
31,
81] or BWM models [
82]. Future research will aim at conducting sensitivity analysis to determine the boundaries in which the results are valid. In addition, although the model was developed and validated for the mold industry, future research could focus on model application in industry, since its core method can be replicated in other industry contexts.


