Article

Characteristics of Overburden Failure and Fracture Evolution in Shallow Buried Working Face with Large Mining Height

1
School of Engineering Management and Real Estate, Henan University of Economics and Law, Zhengzhou 450046, China
2
Geological Survey of Jiangsu Province, Nanjing 210018, China
*
Author to whom correspondence should be addressed.
Sustainability 2021, 13(24), 13775; https://doi.org/10.3390/su132413775
Submission received: 17 November 2021 / Revised: 5 December 2021 / Accepted: 12 December 2021 / Published: 14 December 2021

Abstract

:
In order to solve the issues of uncertain overburden failure height and water loss at the Daliuta coal mine, the collapse characteristics of overburden and the development height of water-conducting fractured zone were studied by using physical modeling, FLAC 3D numerical simulation, and field observation, which were used to verify each other. In order to quantitatively analyze the distribution characteristics of fracture rate of overlying rock mass in goaf, the overburden collapse image was binarized. The results showed that: (1) the failure characteristics of overburden in goaf obtained by the three research methods were roughly consistent, and the reliability of the results was high. The overburden failure height of No. 5−2 coal with large mining height was 137.32–153 m, which was 20.8–23.2 times the mining height. (2) The repeated mining of No. 5−2 coal intensified the further failure of the disturbed rock mass in the No. 2−2 coal goaf. (3) In the horizontal direction of the goaf, the fracture rate of rock mass was distributed in the shape of “saddle”. In the longitudinal direction of the goaf, the rock mass fracture rate decreased in a logarithmic function with the increase of the height from the mining coal seam. Overall, the conclusions are of engineering significance for accurately adopting water resources protection mining technology and reducing mine water inrush disasters.

1. Introduction

Longwall mining is one of the most widely used methods in underground coal mining. One of the most important advantages of this method is that it can mine coal resources efficiently and automatically. However, while mining coal resources by longwall mining, it also caused ecological environment damage such as groundwater loss, ground subsidence, and vegetation death, and even caused geological disasters such as water inrush and gas explosion, which seriously affected the safety and green mining of coal mines [1,2,3,4]. The coal seam overlying strata structure damage and fractures induced by mining lead to the changes of rock mechanics and hydraulic conditions, which is the main inducement of disasters caused by groundwater and gas flow [5]. Therefore, it is of great significance to grasp the failure characteristics of overlying strata induced by mining and the evolution laws of mining fractures for coal mine water disaster prevention and protection of groundwater resources.
The deformation and failure of overlying strata induced by longwall mining have been discussed by many researchers, and achieved fruitful results [6,7,8]. The failure of overburden strata induced by mining is the result of the combined effect of geological environment, mechanical environment, and engineering disturbance [9]. At present, the research methods used for overburden failure can be roughly divided into three categories: field measurements, theoretical calculation, and simulation analysis. Field measurements mainly include borehole flushing fluid leakage observation, borehole TV peeping, and microseismic monitoring [10,11]. Theoretical calculation is mainly an empirical formula calculation. Due to the poor accuracy of empirical formula, some scholars have improved the calculation method, such as division of overlying strata structure, establishment of roof fracture model and mechanical model of overhanging strata, etc. [12,13]. Simulation analysis is a hot spot in the research of overlying strata failure. It mainly includes similar material simulation test and numerical simulation. The numerical simulation mainly uses UDEC and FLAC3D software to carry out discrete element and finite difference numerical simulation [14]. Compared with field measurement, simulation analysis can more intuitively observe and study the whole dynamic change process of overburden deformation and failure [15]. In general, the above three research methods have their own advantages and disadvantages. In recent years, it has become a research trend to comprehensively compare and determine the failure characteristics of overlying by different methods.
Judging from the objects of previous research, it is mainly aimed at working faces with large burial depths and medium and small mining heights all over the world. After the mining of working face, the overlying strata are damaged to form “three zones”, and the height of overburden failure zone is generally 10~15 times the mining height. In fact, due to the influence of coal seam mining thickness, burial depth, stratigraphic dip, and overburden mechanical properties, the mining failure characteristics of overburden under different geological conditions and mining technology are quite different. Taking western China as an example, the coal fields here have geological characteristics such as shallow coal seams, large mining height, and weak cementation of the overlying strata, and their overlying strata mining failure laws are quite different from those of coal seams in other mining areas. In the mining process of shallow buried thick coal seams in western China, it has unique characteristics in working face ground pressure behavior, overburden deformation, and failure and mining fractures formation induced by overburden caving [16,17,18]. In 2020, coal production in western China accounted for about 80% of the country’s total production, and it is the main battlefield for China’s coal development. However, the region is located in an arid and semi-arid area, with water resources accounting for only 3.9% of the country’s total, and the ecological environment is fragile. Large mining height of fully mechanized technology is mostly adopted. This kind of high-intensity coal mining has led to a series of geological disasters and geological environment issues. In view of this situation, there is still a lack of research on overburden failure under the conditions of shallow buried depth, large mining height, and high-intensity mining in western China, which cannot meet the needs of safe and green mining in coal mines.
Therefore, taking the mining of typical working face in the Daliuta coal mine in the Shendong mining area as the engineering background, this paper comprehensively used the methods of similar simulation test, numerical simulation, and field detection to study the overburden caving law, movement and deformation characteristics, mining fractures distribution laws, and the influence laws of multi coal seam mining on each other. The research results have certain guiding significance for water disaster prevention and groundwater resources protection of shallow buried working faces in western China.

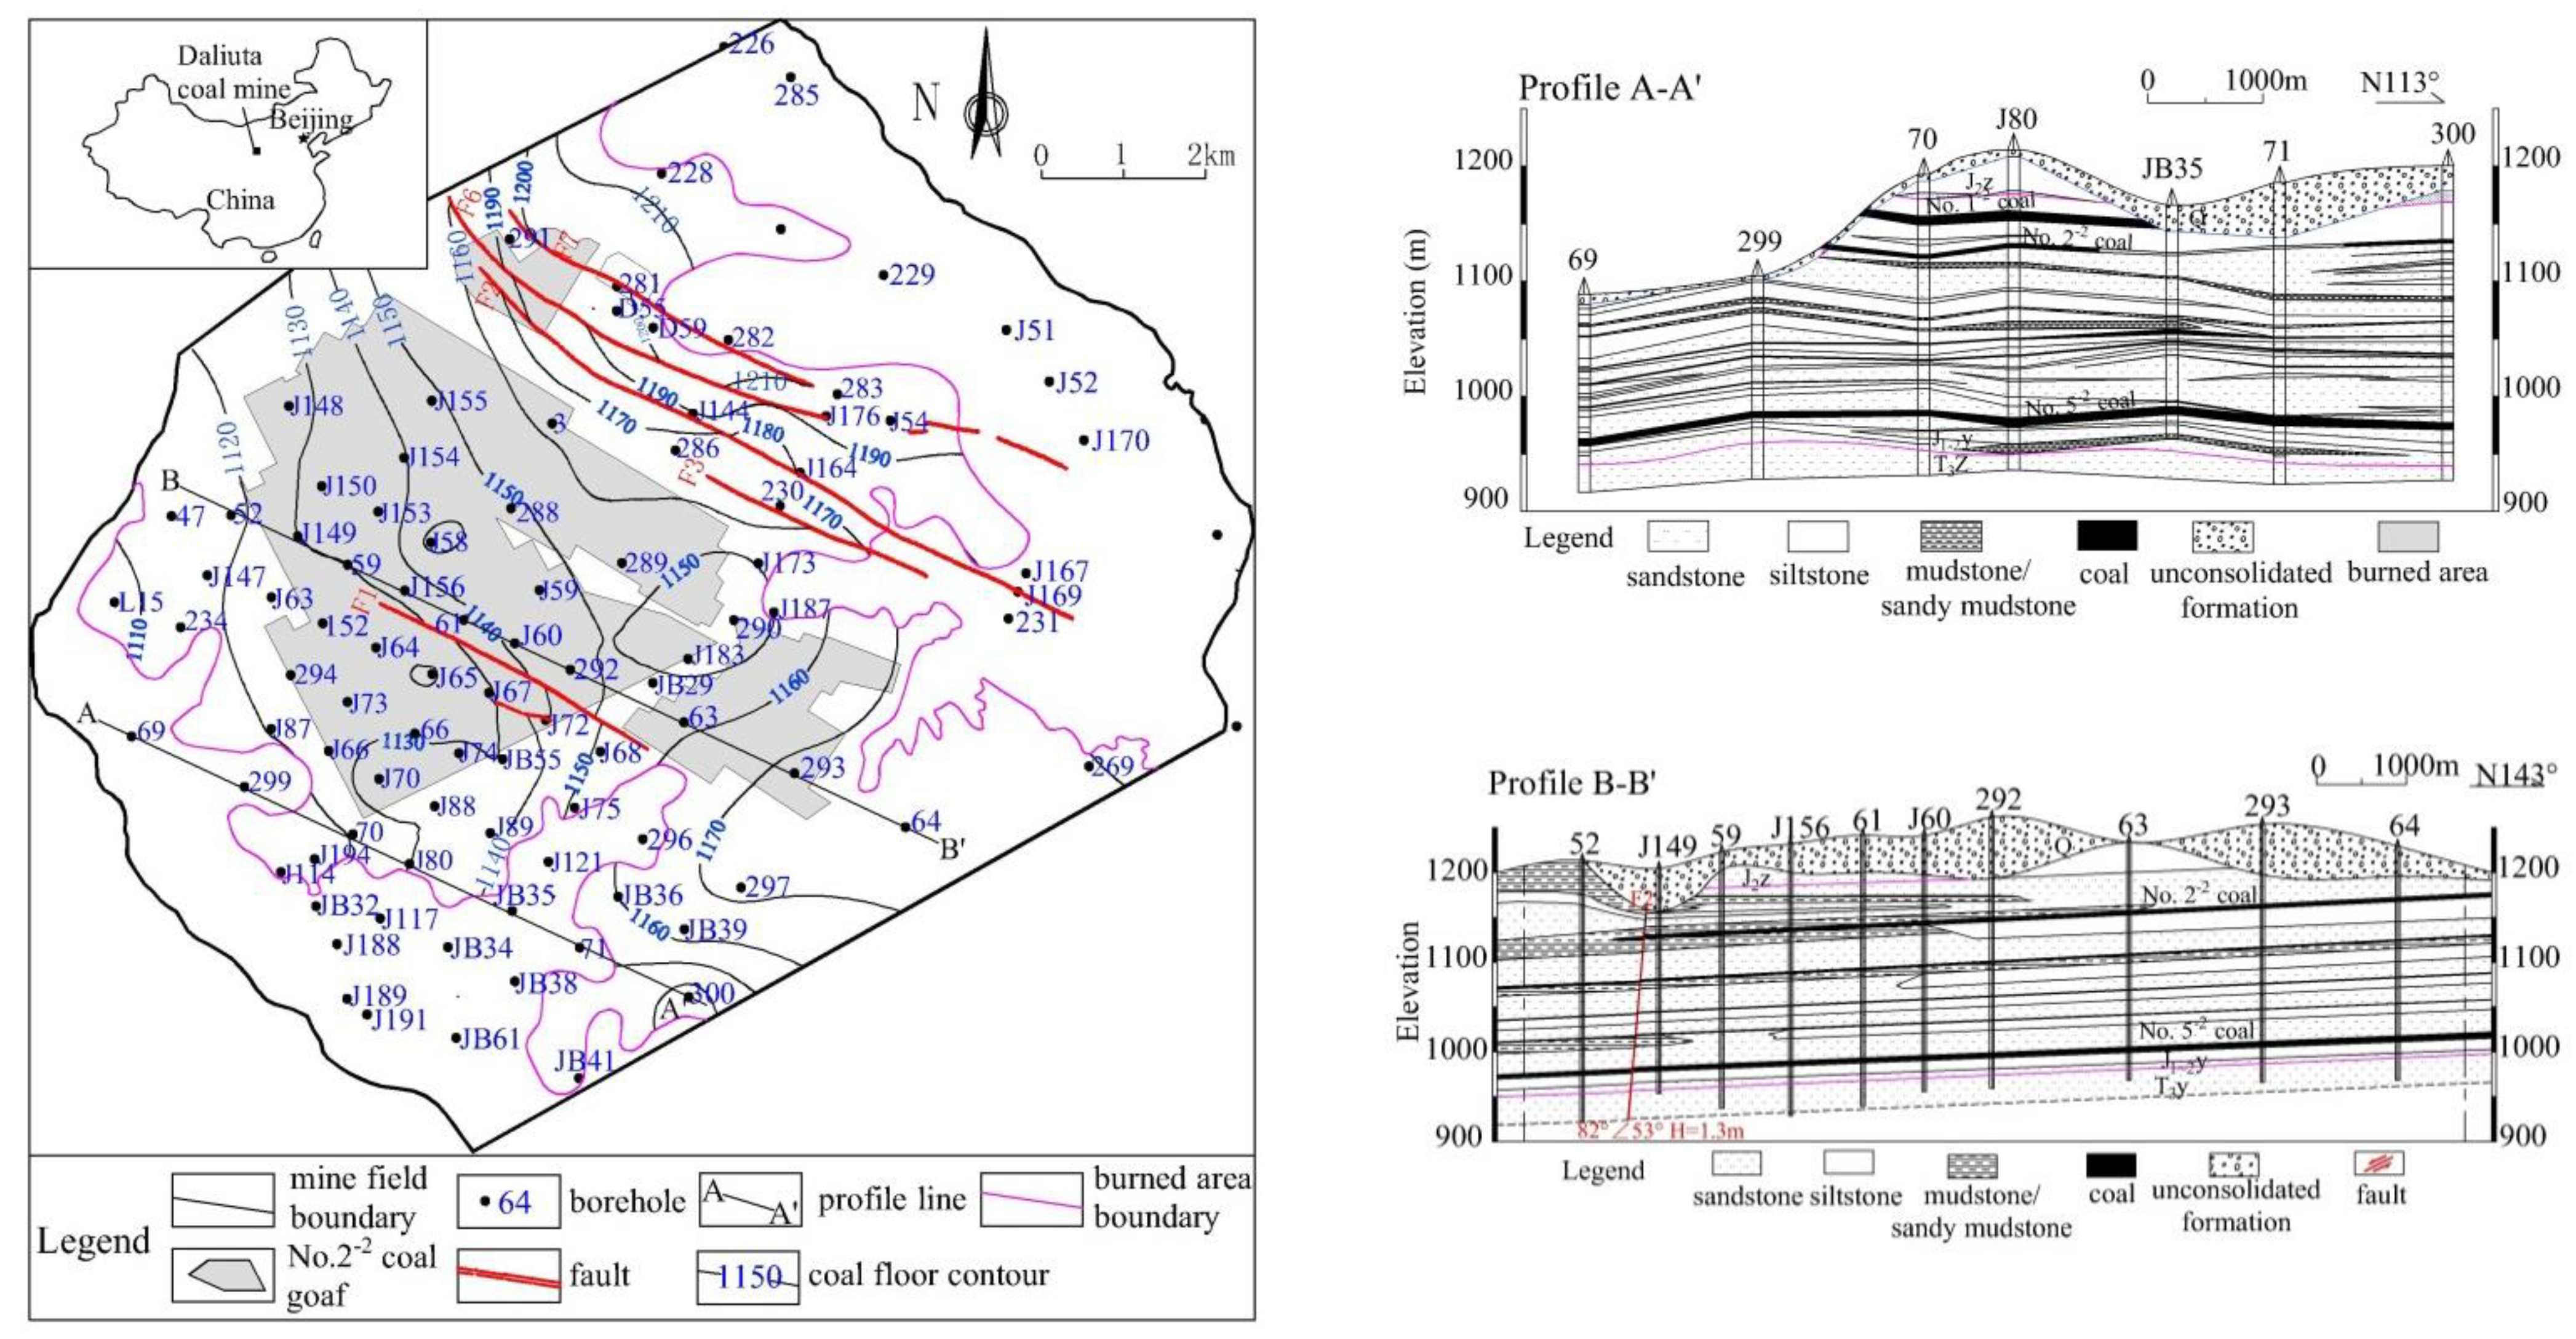
2. Geological Setting

The Daliuta coal mine is located in the Shendong Coalfield in Northern Shaanxi Province China. It is a large modern, high-yield and high-efficiency mine with an annual output of 20 million tons. The Daliuta coal mine is located in the southeast edge of Mu Us Desert. The annual average precipitation is only 300–400 mm, the evaporation is as high as 2000–2500 mm, the vegetation coverage is only 3–11%, water resources are scarce, and the ecology is very fragile. The geological structure is rather simple and there are few faults in this coal mine. Coal-bearing strata dip in the SW direction with a dip angle of 1°–5°. Coal resources in this coal mine are characterized by shallow burial depth, nearly flat-lying beds, and thick coal seam. The coal-bearing strata are located in the Jurassic Yan’an Formation, and the lithology is mostly fine sandstone, siltstone, sandy mudstone, a small amount of mudstone and medium-coarse sandstone. There are altogether nine minable coal seams in this coal mine, most of which are medium and thick coal seams, and No. 2−2 and No. 5−2 coal seams are the primary minable coal seams among them. Table 1 shows the basic geological parameters of primary minable coal seams in the Daliuta coal mine. Figure 1 shows the elevation contour of No. 2−2 coal floor and typical geologic profiles in the Daliuta coal mine. Coal seam roof is mainly composed of siltstone, sandstone, and sandy mudstone, mainly medium hard rock, the rock mass structure is mainly layered structure, and the rock quality is medium. Table 2 shows the division of engineering geological rock group in the Daliuta coal mine.
The aquifers in the Daliuta coal mine mainly include pore phreatic water in the Quaternary Salawusu Formation and fissure phreatic water in the middle Jurassic Zhiluo Formation. The Quaternary aquifer is composed of fine sand and sand gravel and the water level is approximately from 6.06 to 38 m beneath the ground surface and the thickness is 2.8–29.77 m. The hydraulic conductivity is generally from 0.105 to 14.82 m/d based on pumping test data. The fractured aquifer is poor in water abundance and its hydraulic conductivity is generally from 0.039 m/d to 0.514 m/d. Field investigations and long-term monitoring have found that coal mining causes obvious disturbance to aquifers. In some areas, the groundwater level has dropped severely, with even the aquifers having been drained, and well springs and rivers drying up.
The Daliuta coal mine has good coal seam occurrence conditions, which is especially suitable for mechanized mining. At present, the longwall comprehensive mechanized one-time full height mining method is widely used. The mining face is large in size, with a length of more than 200 m, a advancing distance of more than 3000 m, and a single-layer mining height of 4–7 m. Compared with the traditional working face, it has the advantages of large mining area at one time, fewer times of working face moving, and fast advancing speed (Generally more than 13 m/d) and high mining efficiency. The roof is managed by the caving method in the working faces.

3. Similar Simulation Experiment

3.1. Experimental Design

3.1.1. Engineering Geological Prototype

Based on the structural characteristics of coal seam overburden, the strata in 63# borehole on the profile B-B′ in the Daliuta coal mine was selected as the engineering geological prototype of this similar simulation experiment, as shown in Figure 1. According to the 63# borehole histogram, the overlying strata of No. 2−2 and No. 5−2 coal seams are mainly medium-grained sandstone, fine-grained sandstone, and siltstone, with similar mechanical properties and a small amount of mudstone, with a mudstone percentage of about 5%. The stratification characteristics of the strata were combined and homogenized, and a geological model basically consistent with the actual stratigraphic conditions was established. The average buried depth of No. 2−2 coal is 70.5 m and the thickness is 4.2 m. The buried depth of No. 5−2 coal is 227.7 m and the thickness is 6.6 m. The stratigraphic structure and its physical and mechanical parameters are shown in Table 2.

3.1.2. Determining the Model Frame and Similarity Constant

Based on current experimental and engineering geological prototype, the size of 2-D similar simulation experiment frame was chosen as 4200 × 200 × 2000 mm (length, width, and height). According to the similarity principle and the actual situation of this similar simulation experiment, the similarity constants were determined as follows:
(1)
Geometric similarity constant:
C l = Y m / Y p = Z m / Z p = 1 / 150
where Cl is the geometric similarity constant, Ym and Zm are the height and width of the mode, respectively, and Yp and Zp are the actual height and width.
(2)
Time similarity constant:
C t = T m / T p = C l = 1 / 7.75
where Ct is the time similarity constant, Tm is the mining time of the model working face, and Tp is the actual mining time.
(3)
Unit weight similarity constant:
C γ = γ mi / γ pi = 1 / 1.5
where Cγ is the unit weight similarity constant, γmi is the unit weight of the i-th layer in the model, and γpi is the actual unit weight of the layer.
(4)
Elastic modulus similarity constant:
C E = C σ = C l C γ = 1 / 225
where CE is the similarity constant of elastic modulus, and Cσ is the similar constant of uniaxial compressive strength.

3.1.3. Similar Model Materials and Fabrication

Fine sand, lime, gypsum, and water were selected as similar materials, and the proportion of similar materials was carried out to meet the requirements of mechanical similarity. Calculate the physical and mechanical properties of similar materials according to the physical and mechanical properties and similar constants of each stratum on the geological histogram (Table 3). Then select a closer proportion in the proportion table to determine the material proportion. Strata with different lithology were simulated according to the determined proportion of materials, and mica powder was laid between layers to simulate rock bedding. Coal and rock layers were laid horizontally and directly to the surface.

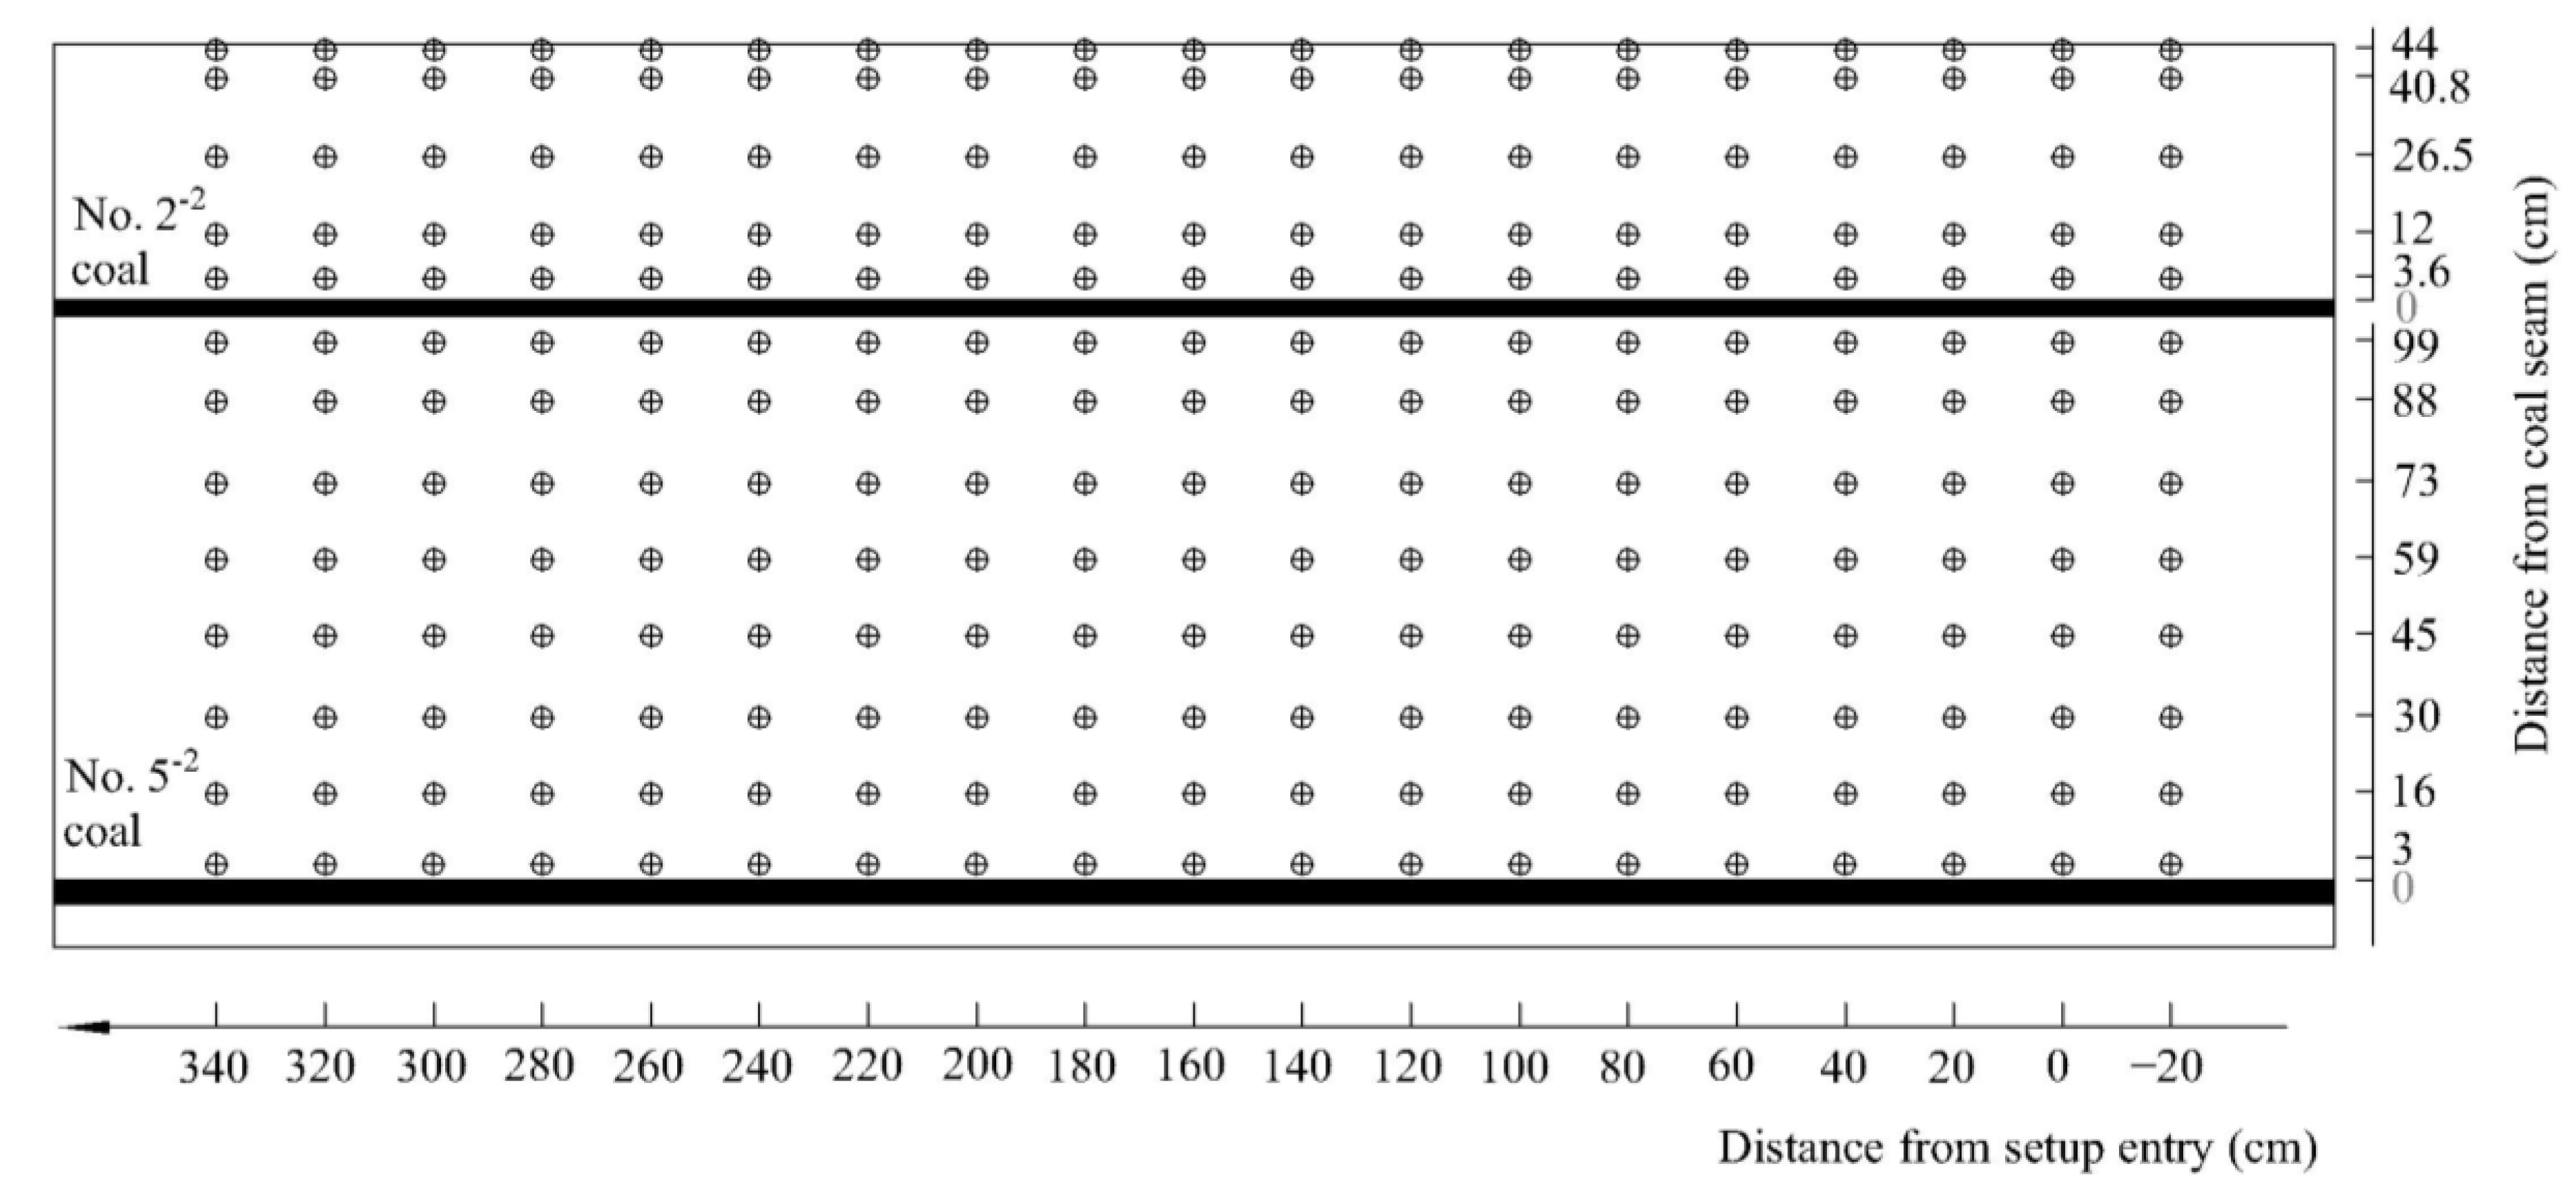
3.1.4. Layout of Displacement Monitoring Points

In order to obtain the displacement of the strata at different heights of the coal roof and the temporal and spatial evolution characteristics of the strata displacement during the mining process, displacement monitoring points were arranged on the surface of the model, with a total of 13 rows and 19 columns. The layout plan of the displacement measuring points is shown in Figure 2. The heights between the measuring points in rows 1–5 and No. 2−2 coal were 44, 40.8, 26.5, 12, and 3.6 cm, respectively. The heights of the measurement points in rows 6–13 from No. 5−2 coal were 99, 88, 73, 59, 45, 30, 16, and 3 cm, respectively. The horizontal distance between the two columns of measuring points was 20 cm, and the distance between the first row of measuring points was −20 cm away from the setup entry. During the mining process, the displacement of the overlying strata was monitored by an electronic theodolite with high accuracy.

3.1.5. Coal Seams Mining Sequence

In the similar model, No. 2−2 coal was mined first, and then No. 5−2 coal was mined. The one-time mining height of No. 2−2 coal was 2.8 cm, which was equivalent to the actual mining height of 4.2 m, and the mining height of No. 5−2 coal was 4.4 cm, which was equivalent to the actual mining height of 6.6 m. When the model was mining, 50 cm coal pillars were left at each end to eliminate the boundary effect, and the length of the two layers of coal was 320 cm. Figure 3 shows the pre-mining similar model.

3.2. Analysis of Similar Simulation Results

In order to facilitate the comparison with on-site measured data, the model test values were converted into on-site prototype values for description when analyzing similar simulation test results.

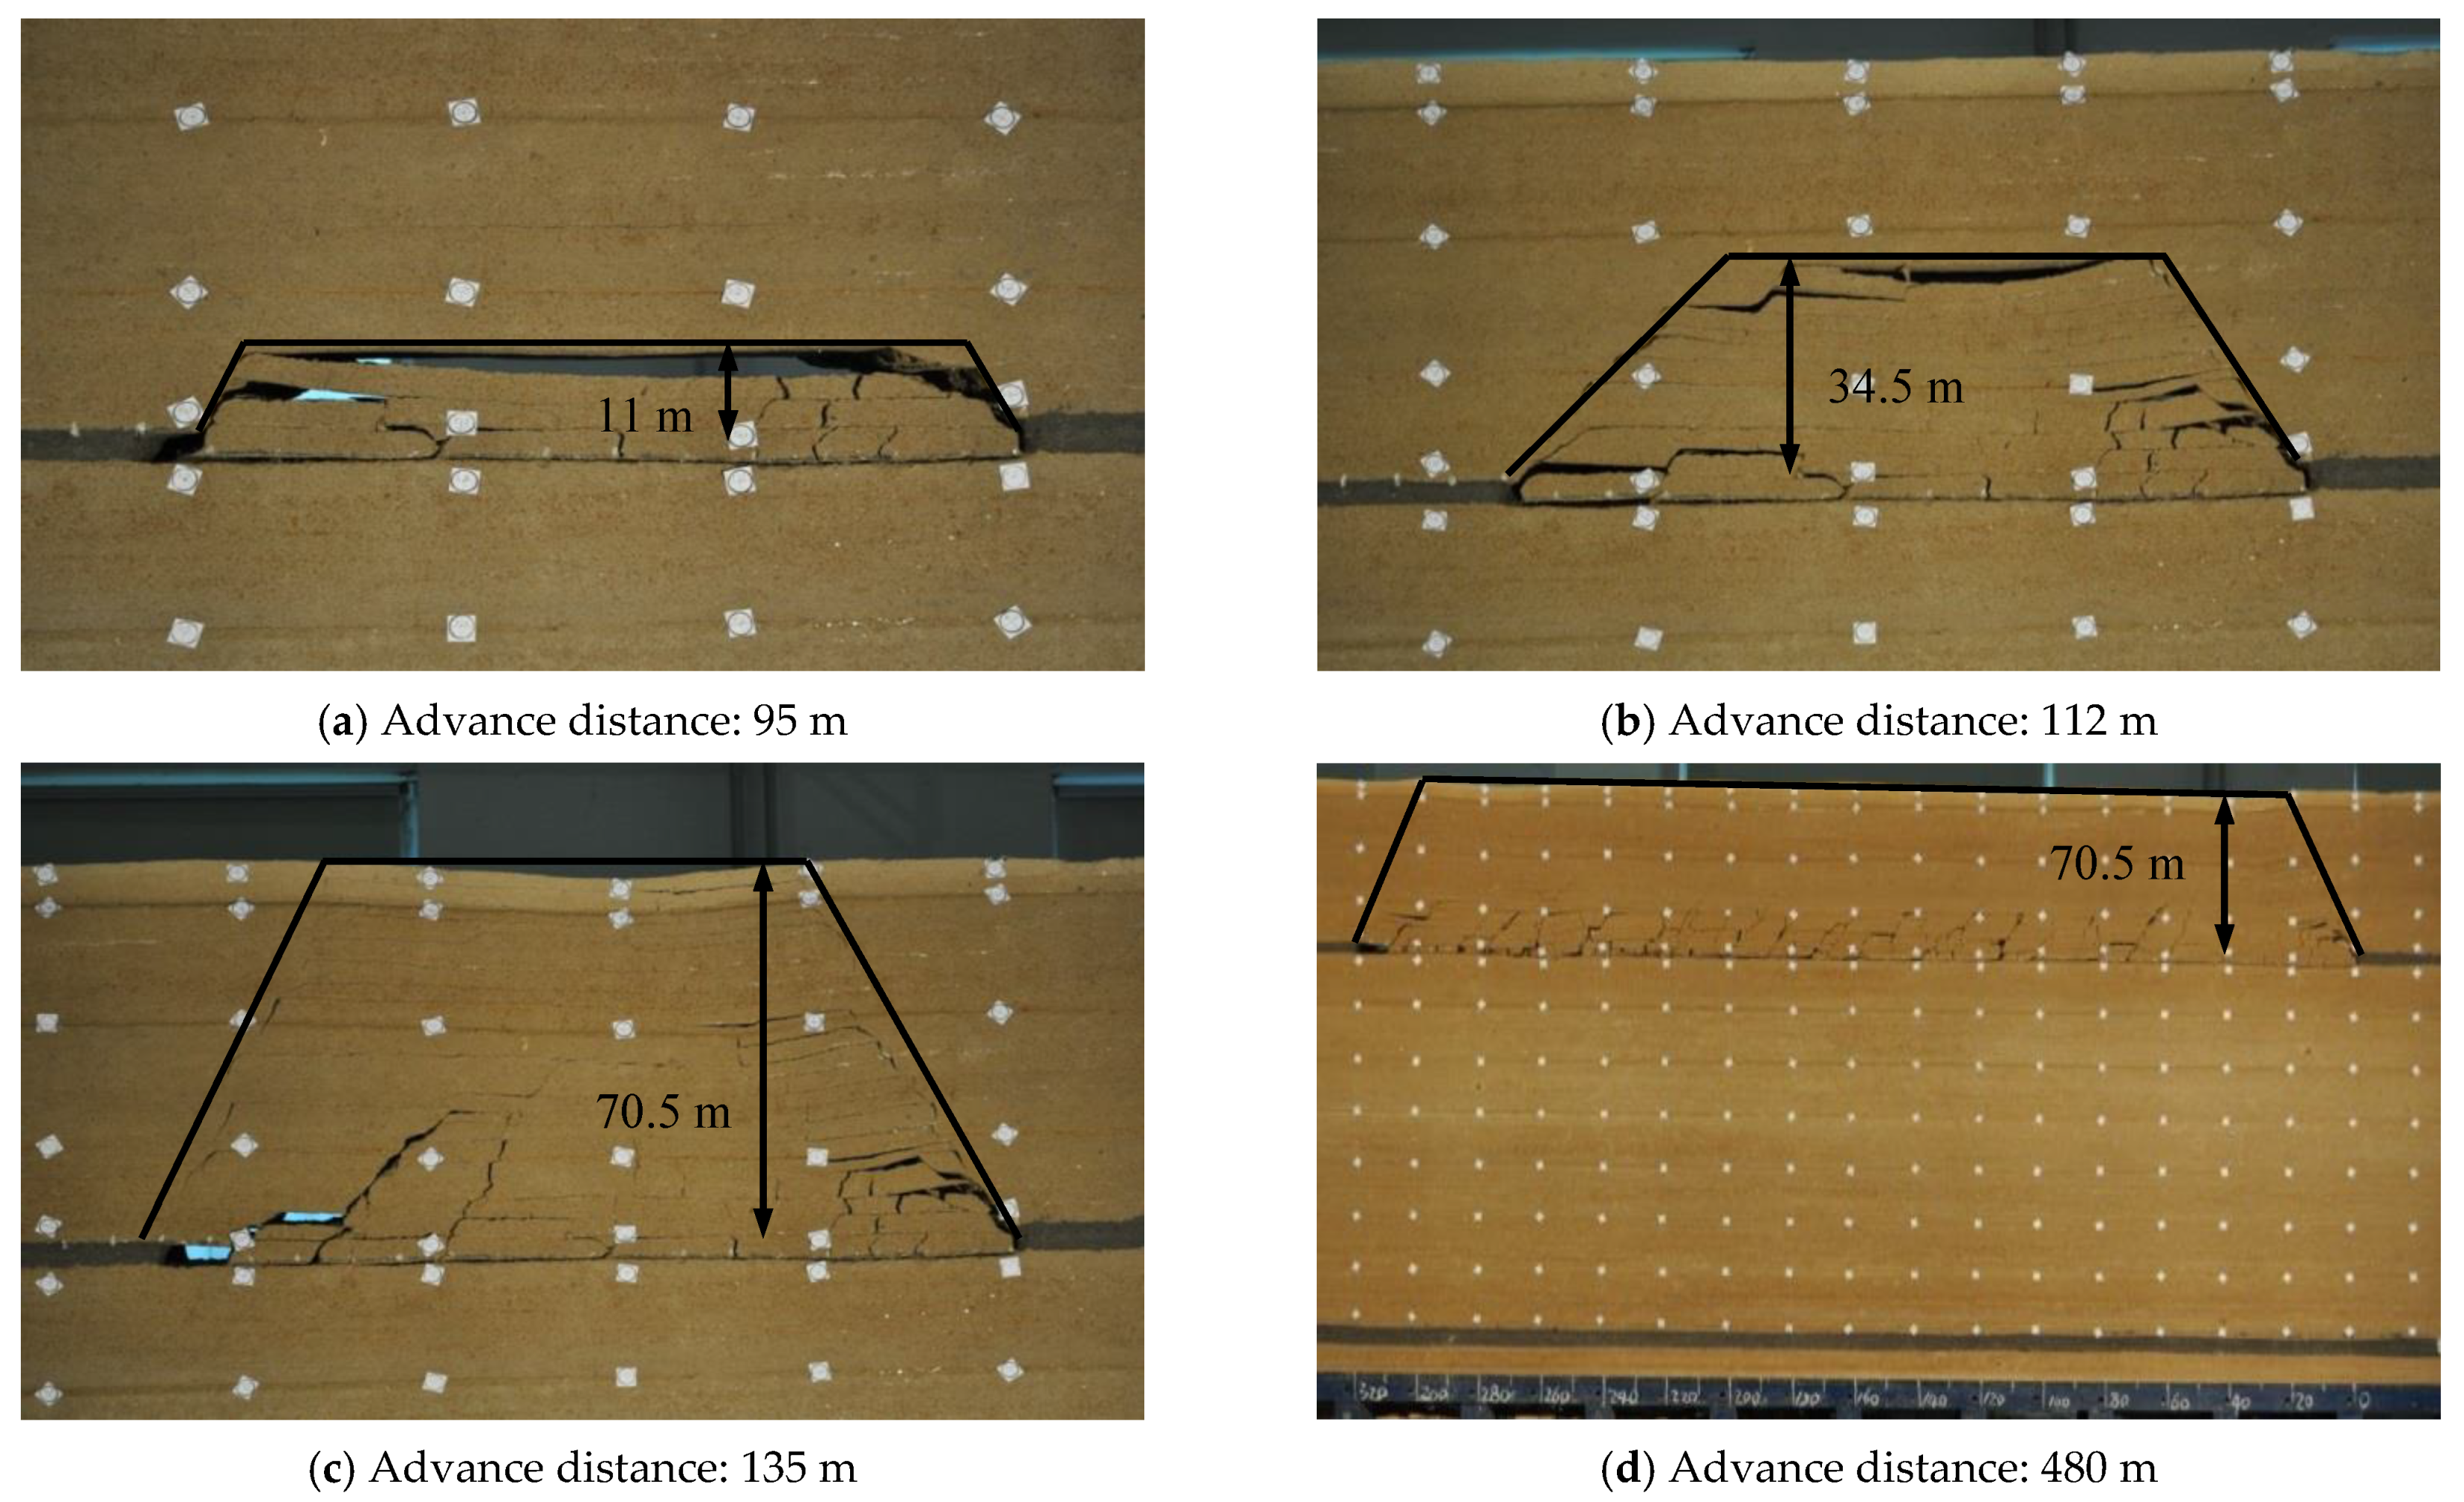
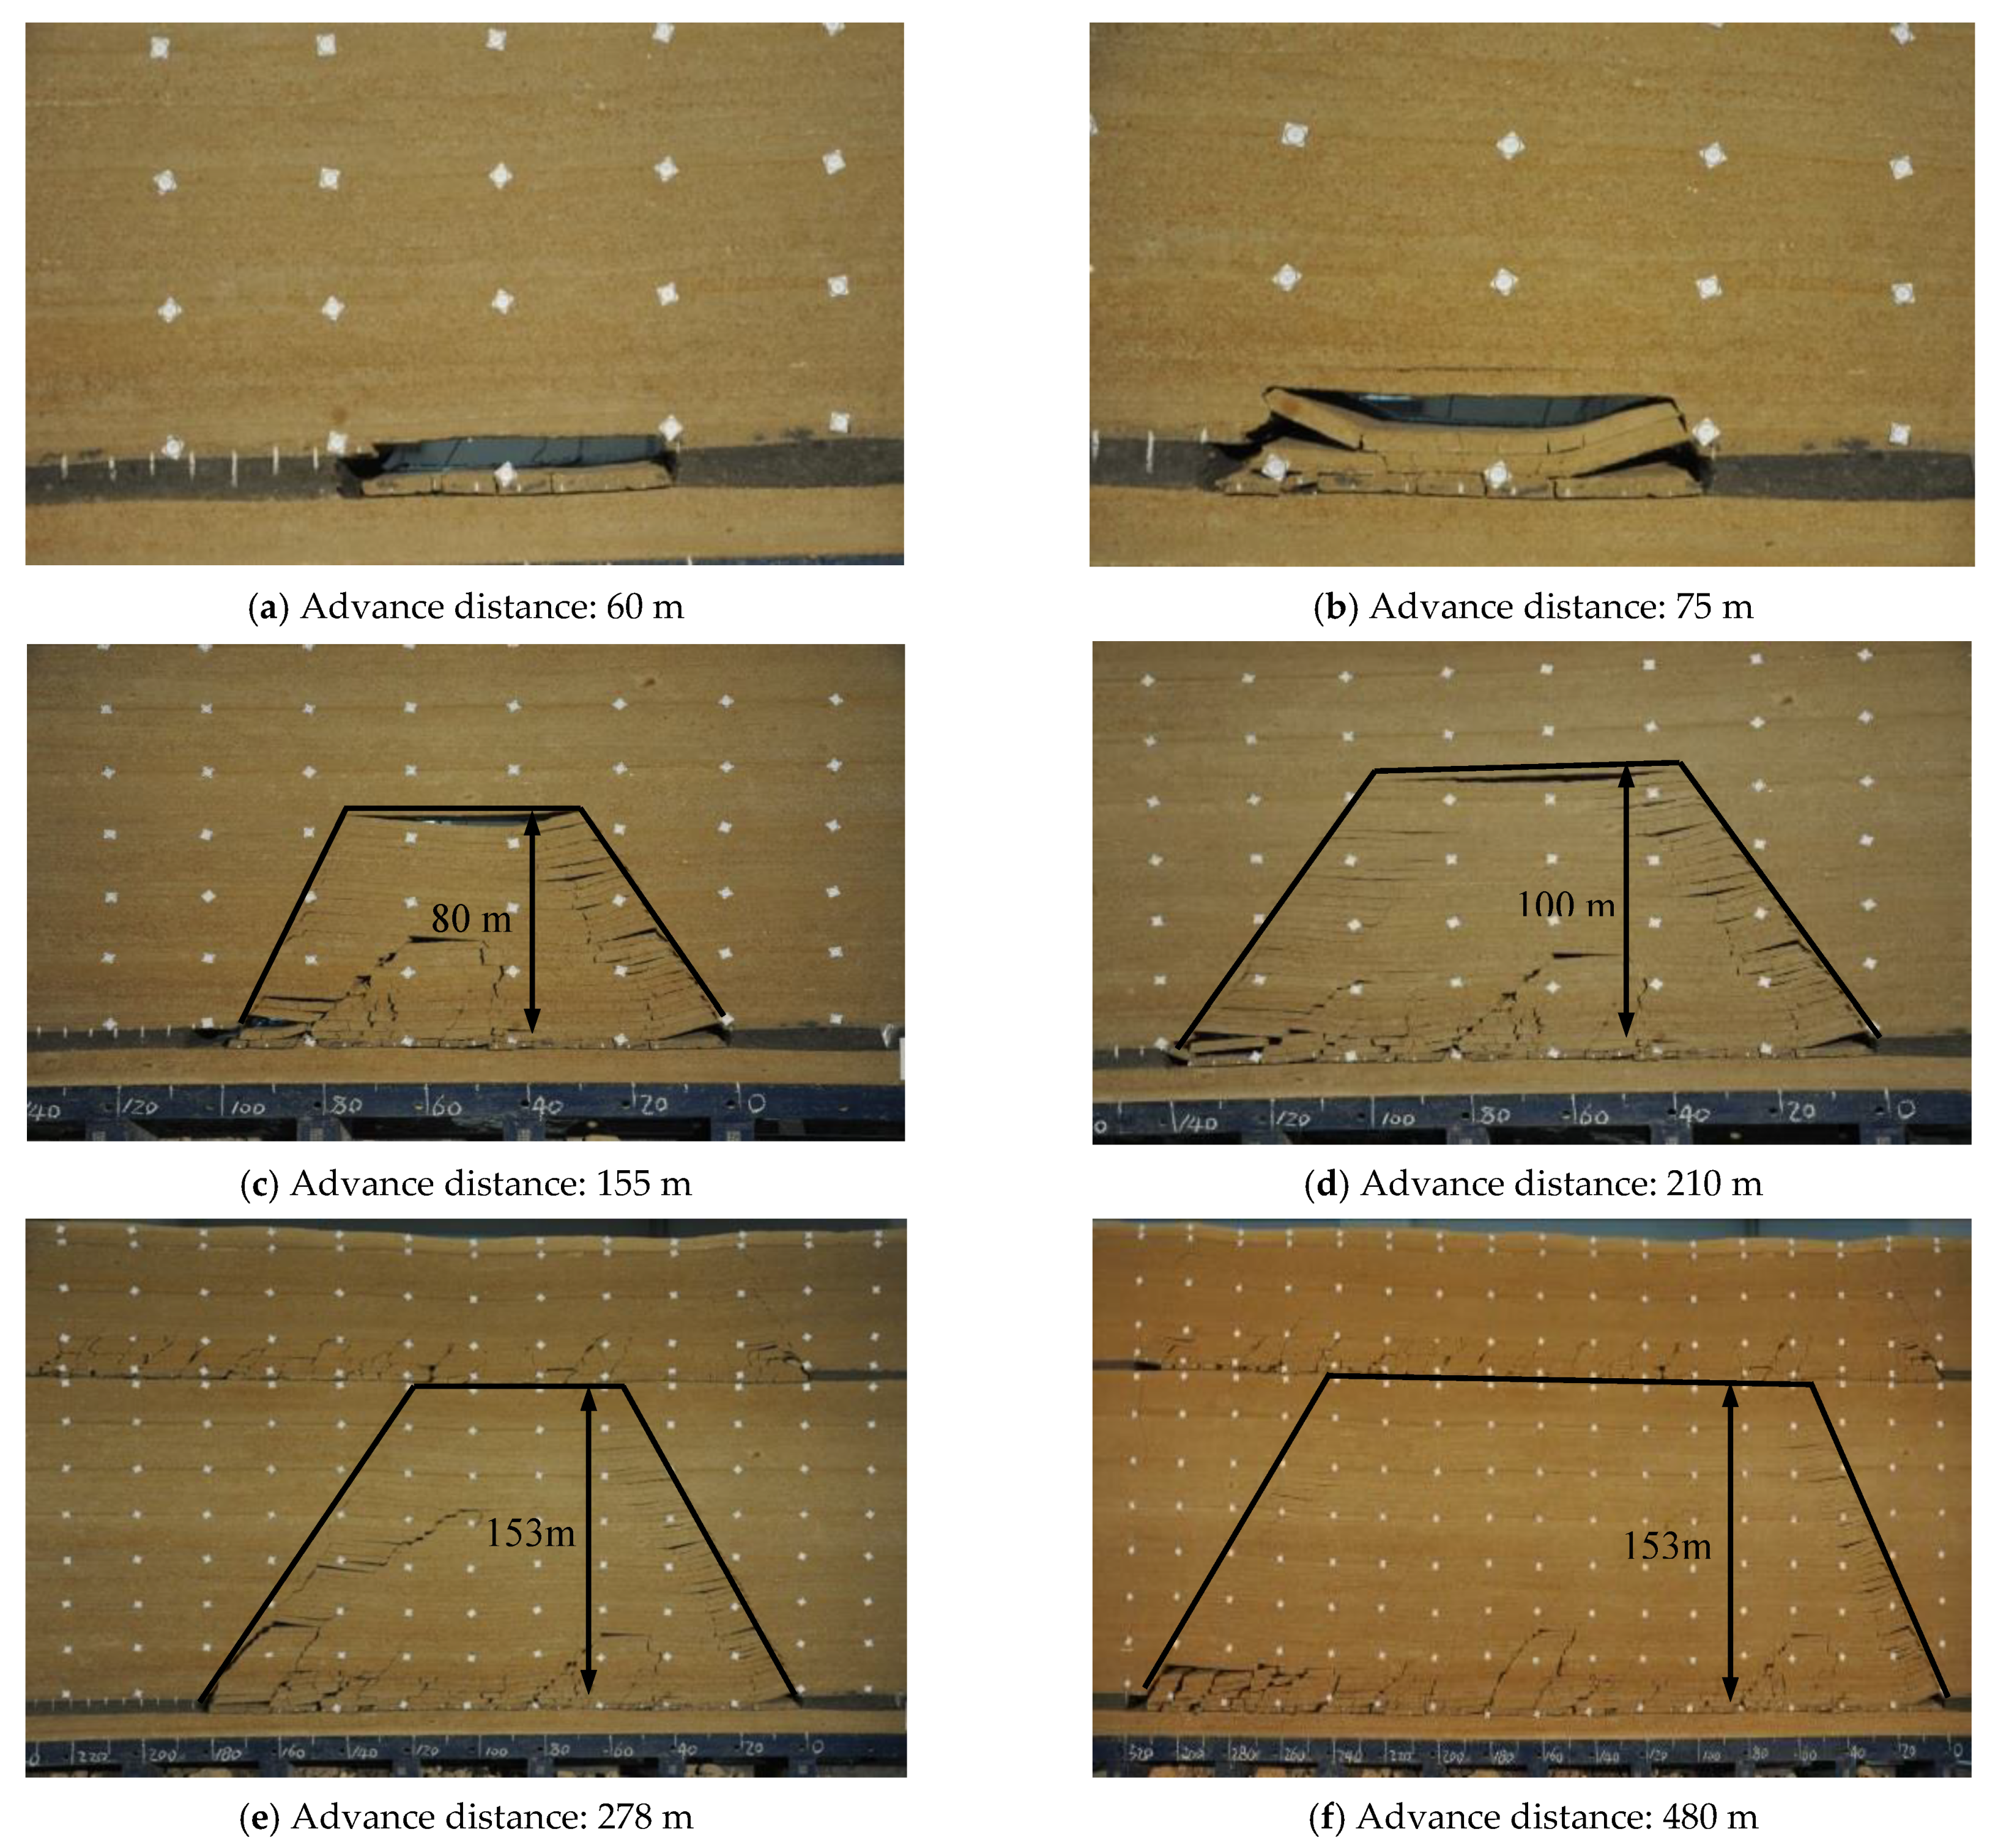
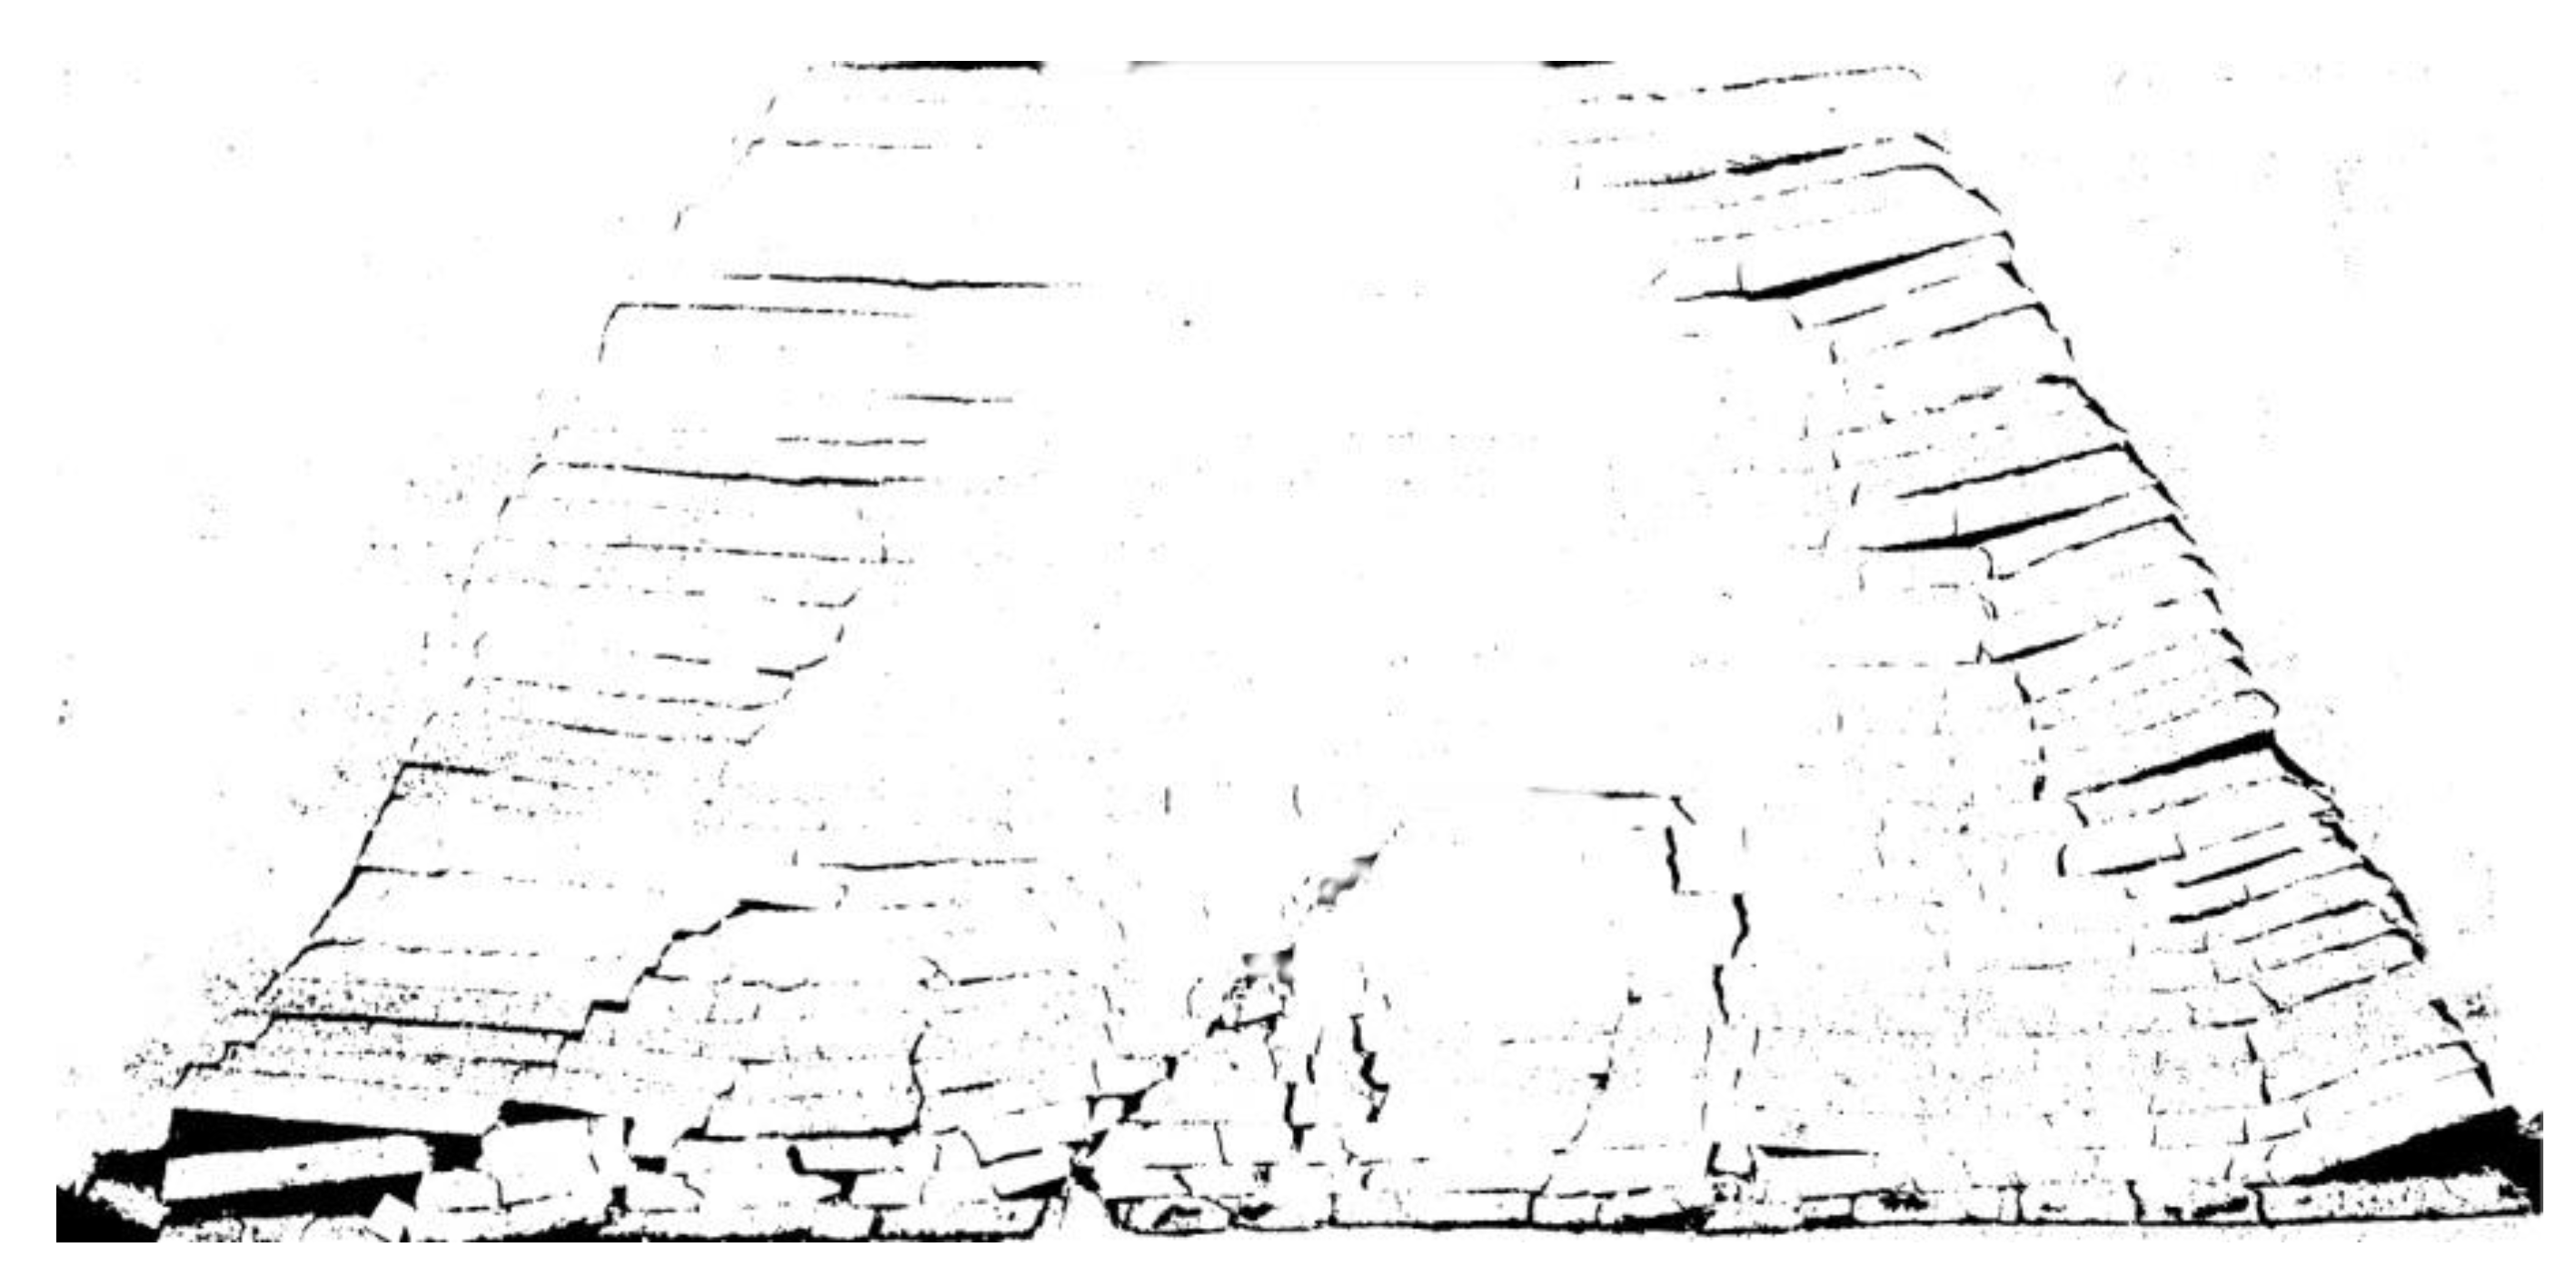
3.2.1. Simulation of Caving Process

When the working face advanced to 95 m, the collapse height reached 11 m, forming a large separation space with the upper stratum. When the working face of No. 2−2 coal advanced to 112 m, the collapse height was 34.5 m. When the working face advanced 135 m, the fine sandstone with higher strength broke, the overlying strata were cut along the full thickness of the coal wall, the water-conducting fractured zone developed to the surface, and ground fractures appeared on the surface. As the working face continued to advance, the roof collapsed periodically with a step distance of 20–25 m. When the working face advanced to 480 m, the mining was stopped, the overburden moved and broke, and finally formed a “two zone” structure of caving zone and fractured zone. The height of caving zone was 14.8 m, and the height of water conducting fractured zone was 70.5 m. An obvious longitudinal fractured zone was formed above the boundary of goaf, and the fractures in the middle of goaf were compacted and closed again. Figure 4 shows the simulated process of overlying strata caving evolution during the No. 2−2 coal seam excavation.
When the working face of No. 5−2 coal was advanced 60 m, the immediate roof collapsed, and the collapse height was 3 m. When the working face was advanced 75 m, the main roof collapsed for the first time, and the collapse height of overlying strata reached 9.0 m. With the continuous advance of the working face, the main roof collapsed periodically, and the average collapse step was 25 m. When the working face was advanced to 155 and 210 m, the overburden collapse height was 80 and 100 m, respectively. When the working face advanced 278 m, the main roof was broken for the 8th time, and the longitudinal fractured zone on the side of the working face penetrated the overburden and conducted to the No. 2−2 coal goaf. As the working face continued to advance, the longitudinal fractured zone on the side of the working face periodically conducted the overlying No. 2−2 coal goaf. When the working face advanced 480 m, the mining was stopped. The overburden failure space of the stope was trapezoidal, and the fracture opening and density in mining overburden rock on both sides of the goaf were significantly greater than that in the middle of the goaf. Figure 5 shows the simulated process of overlying strata caving evolution during the No. 5−2 coal seam excavation.

3.2.2. Development Laws of Mining Fractures

In order to quantitatively analyze the distribution laws of the fracture rate of overlying strata in the transverse and longitudinal direction of goaf, Image-Pro Plus image analysis software was used to binarize the overburden collapse image [19]. A digital camera was used to obtain images of overburden collapse during coal mining. Through the appropriate threshold selection, binary images that can well reflect the distribution characteristics of mining fractures in overburden collapse images can be obtained [20]. The binary processing of images of mining overburden fracture can clearly and effectively distinguish the fractures from the complete rock mass. The fracture areas are black and the areas outside the fractures are white. The unit of image analysis is pixels. The binarized image quantizes the pixels into 0 and 1. 1 represents the undamaged area and 0 represents the failure area, i.e., the fracture area. Select a certain area for analysis, and accumulate the ratio of 0 pixels to the area of the analysis area, which represents the fracture rate of the area.
Figure 6 shows the fracture distribution after binarization of overburden collapse image when the working face of No. 5−2 coal was advanced 210 m. It can be seen from Figure 6 that the caving rocks in the goaf were broken and scattered into blocks. The main roof was broken, but it still maintained layered structure, and the connectivity between fractures was good. The mining fractures were mainly high angle longitudinal fractures, with large opening and extension length, and small aperture of separation fractures. The collapse shape of the stope roof was trapezoidal, the fracture degree of overlying strata at both ends was much greater than that in the middle, forming two longitudinal fractured zones with large aperture and good connectivity.
According to Figure 6, a statistical analysis of the longitudinal and horizontal distribution of the overburden fracture rate within the mining overburden failure zone was carried out, as shown in Figure 7. It can be seen from Figure 7 that in the longitudinal direction, the fracture rate of rock mass in the caving zone was much larger than that in the fractured zone, and the distribution curve of fracture rate decreased rapidly. The fracture rate of the rock mass in the fractured zone decreased slightly along the longitudinal direction, and its distribution curve was relatively flat, especially in the upper part of the fractured zone, the rock mass fracture hardly changed. The average fracture rate of rock mass in the caving zone was about 25%, the average fracture rate of the rock mass at the bottom of the fractured zone was 8%, and the fracture rate of the rock mass at the top of the fractured zone is only about 0.5%. Fitting the statistical data of the rock fracture rate in the caving fracture zone in Figure 7a, it was found that the fracture rate (fr) decreased in a logarithmic function with the increase of the height (h) from the coal seam roof, and the correlation coefficient (R) was 0.86. The distribution of overburden fracture rate along the working face was “saddle” shape, forming a distribution law of high at both ends (average 18%) and low in the middle (minimum 3.3%), as shown in Figure 7b.

3.2.3. Movement and Deformation of Overlying Strata

According to the model surface displacement observation and on-site photographs, it can be known that the overburden in the mined-out area sank from the bottom up and down was nonlinear, and the movement patterns were all asymmetrical. At the initial stage of mining, due to the small collapse range caused by excavation, the subsidence of the overlying strata was small. With the continuous advancement of the working face, the subsidence range along the strike and longitudinal direction of the working face was gradually expanded, and each stratum had a large subsidence one after another. The continuity of strata movement in the caving zone was very poor, the subsidence curve jumped, and the maximum subsidence value was basically located at the place of roof pressurization. The subsidence of the roof strata in the fractured zone gradually decreased from bottom to top, the continuity of the subsidence curve increased, the shape of the subsidence curve was basically consistent, and the maximum subsidence value was basically in the goaf center.
The theodolite was used to observe the displacement of the overlying strata during the coal mining process, and the strata displacement data at the location of each row of measurement points were obtained. Then, the contour maps of overburden subsidence were drawn by using the Surfer software. Figure 8 shows the contour map of overburden subsidence during the excavation of No. 5−2 coal seam. The subsidence value of roof strata at different heights increased step by step, and the position of displacement mutation corresponded to the position of roof collapse. The overburden collapse area induced by the excavation of No. 2−2 coal seam extended to the surface, resulting in ground fractures and subsidence. The maximum surface subsidence was 2314 mm. The excavation of No. 5−2 coal caused the movement and deformation of overlying strata, and the influence degree of deformation decreased gradually with the increase of height. Within the overburden collapse space, the strata deformation was large, outside this range, the strata deformation was small and the deformation growth was slow. In the process of No. 5−2 coal excavation, the overlying strata movement and deformation range continuously expanded horizontally and longitudinally. When the No. 5−2 coal seam advanced 278 m, the overburden failure height reached the No. 2−2 coal goaf, and the deformation influence zone of No. 5−2 coal excavation began to extend to the No. 2−2 coal goaf. This caused the instability of surrounding rock in the upper No. 2−2 coal goaf, the increase of subsidence value and subsidence influence boundary from roof to surface, and the increase of discontinuous failure.
Figure 9 shows the change of vertical displacement of No. 2−2 coal overburden during the mining of No. 5−2 coal. When the working face of No. 5−2 coal advanced 278 m, the overburden displacement of No. 2−2 coal suddenly increased, and the main roof subsidence value increased from 3.56 to 6.86 m, with an increase of 3.3 m. The surface subsidence value increased from 2.31 to 5.85 m, with an increase of 3.54 m.

4. Numerical Simulation

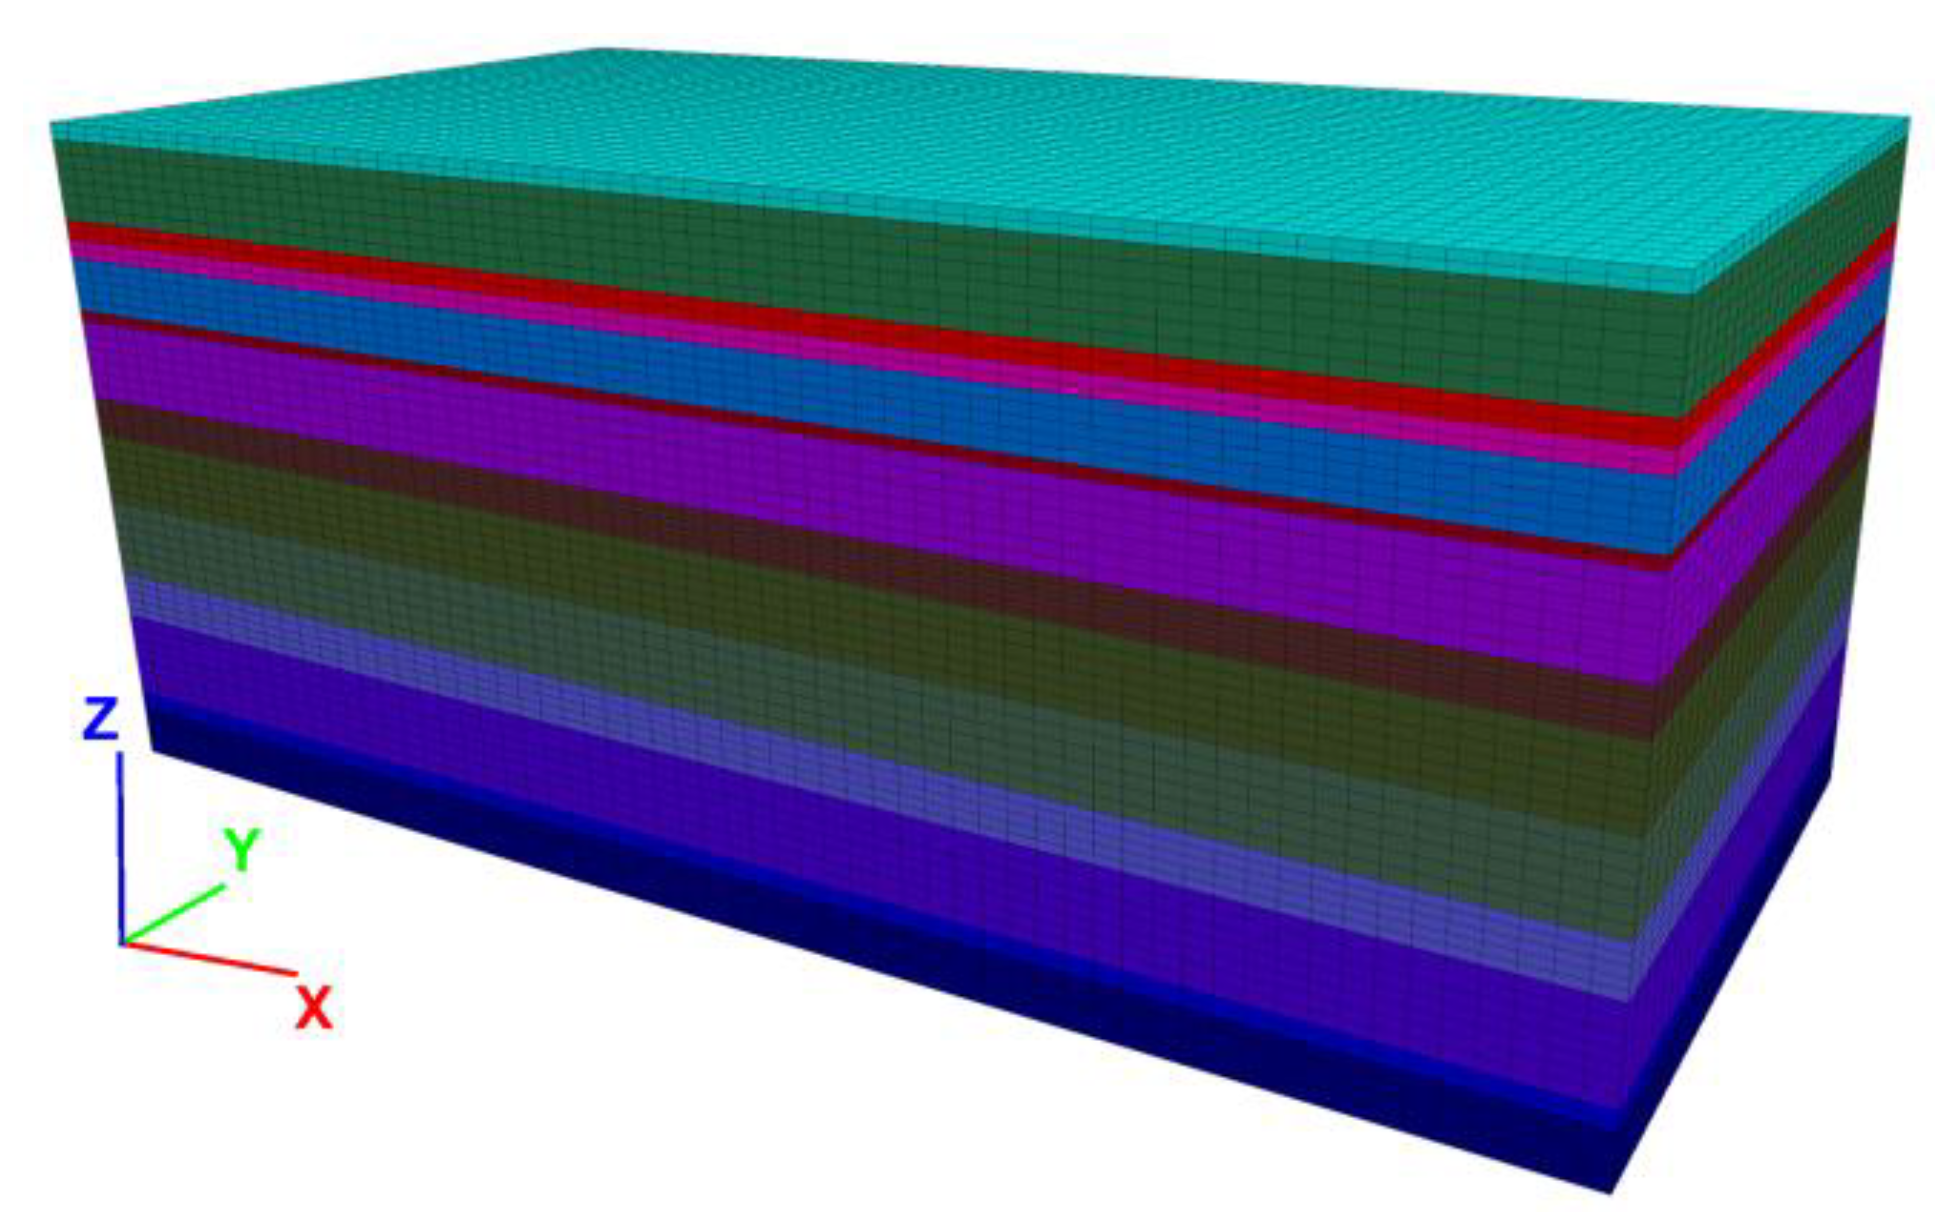
4.1. Numerical Model and Parameter Selection

The numerical calculation model is established according to the stratigraphic configuration in the similar model and is used mainly to study the failure laws of overlying strata and analyze the influence of multi coal seam mining on each other. Figure 10 shows the numerical model set by using the FLAC 3D software. The model is 600 m long (x-direction), 300 m wide (y-direction), and 254.3 m high (z-direction). The displacement boundary conditions are as follows: the displacement in the horizontal direction is fixed on the front, rear, left and right sides of the model, the displacement in the vertical and horizontal directions is fixed on the bottom of the model, and the upper boundary is a free boundary.
The mining scheme of No. 2−2 coal and No. 5−2 coal in the numerical model is as follows: the total advance distance of working face is 480 m in the x-direction and the length of working face is 200 m in the y-direction. Mining space is located in the center of this block and 60 m wide protective coal pillar in the x-direction and 50 m wide coal pillar in the y-direction are intentionally left to eliminate boundary effect. In the process of underground coal seam excavation, the overburden failure is mainly caused by shear stress and tensile stress. Mohr-Coulomb yield criterion in FLAC 3D considers both shear yield and tensile truncation, which can better reflect the shear and tensile failure characteristics of rock mass [21]. Therefore, Mohr-Coulomb constitutive model was adopted for this numerical calculation. The physical and mechanical parameters of rock samples in the Daliuta coal mine were measured in the laboratory and on-site with instruments and equipment, and the bulk density, tensile strength, elastic modulus, and other parameters of different lithological rocks were obtained as the basis for numerical simulation parameters assignment. The physical and mechanical parameters used in FLAC 3D simulation are shown in Table 4.

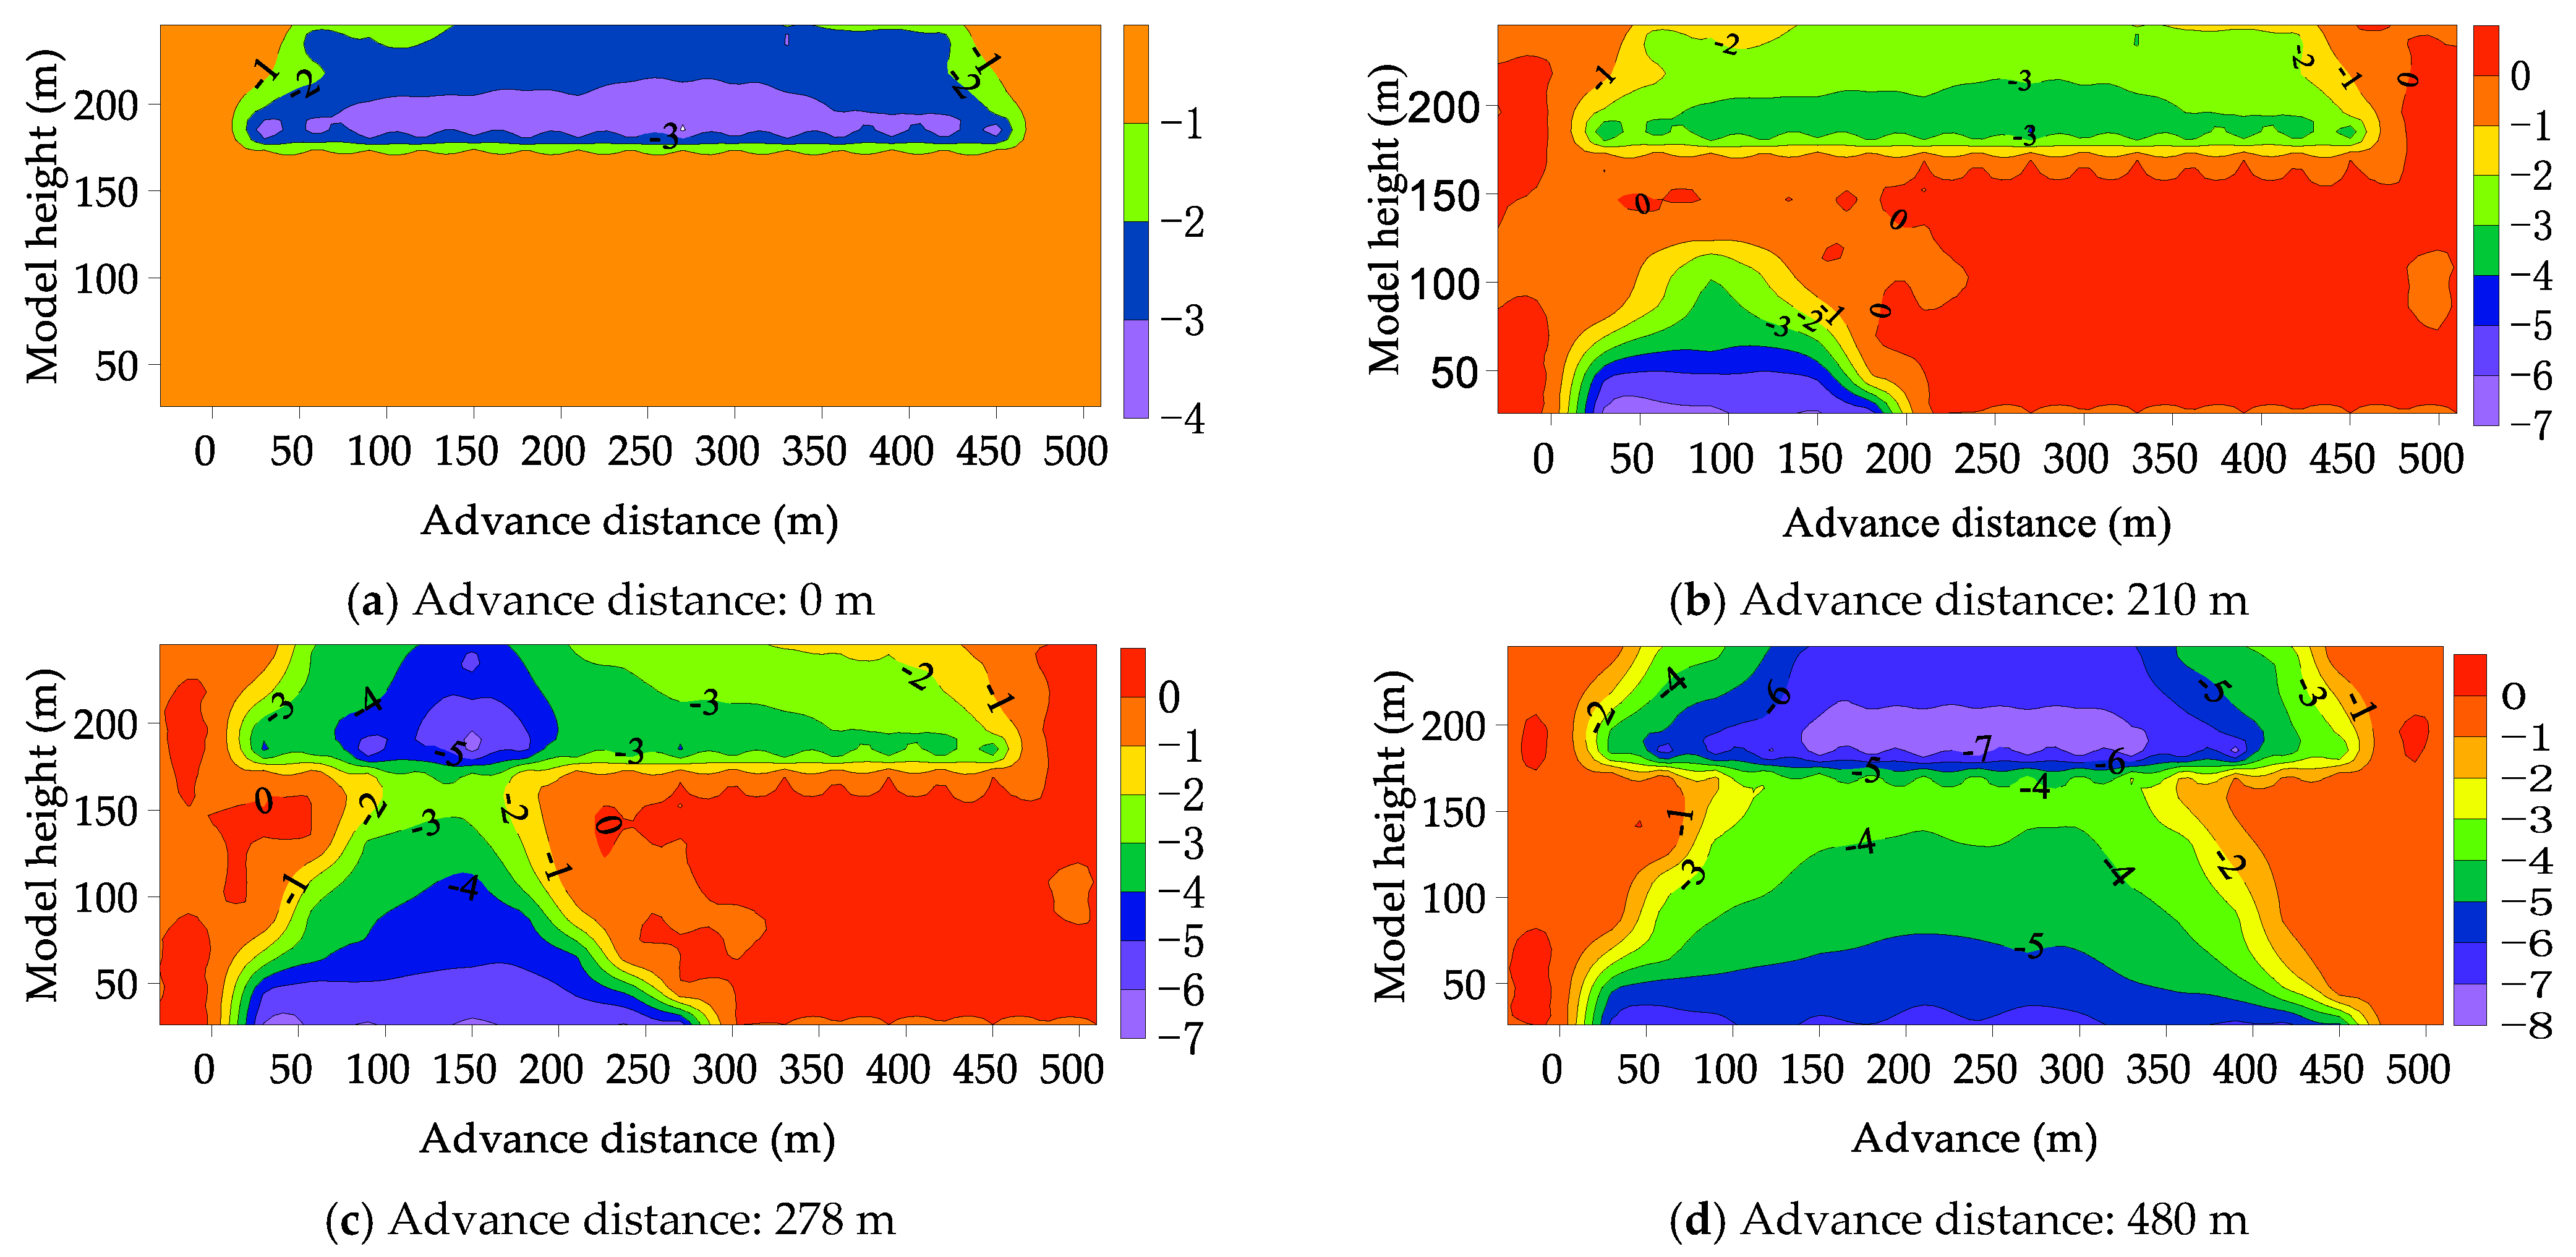
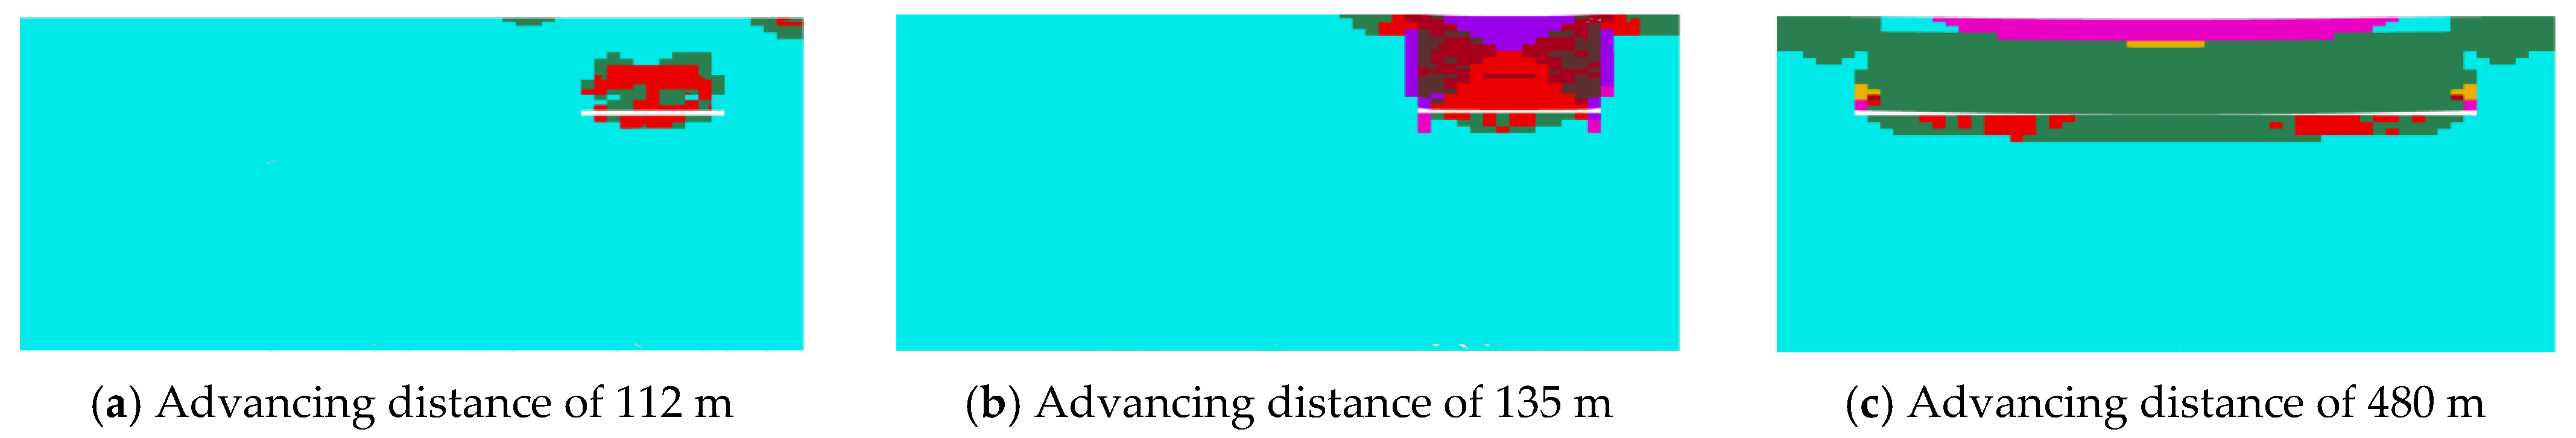
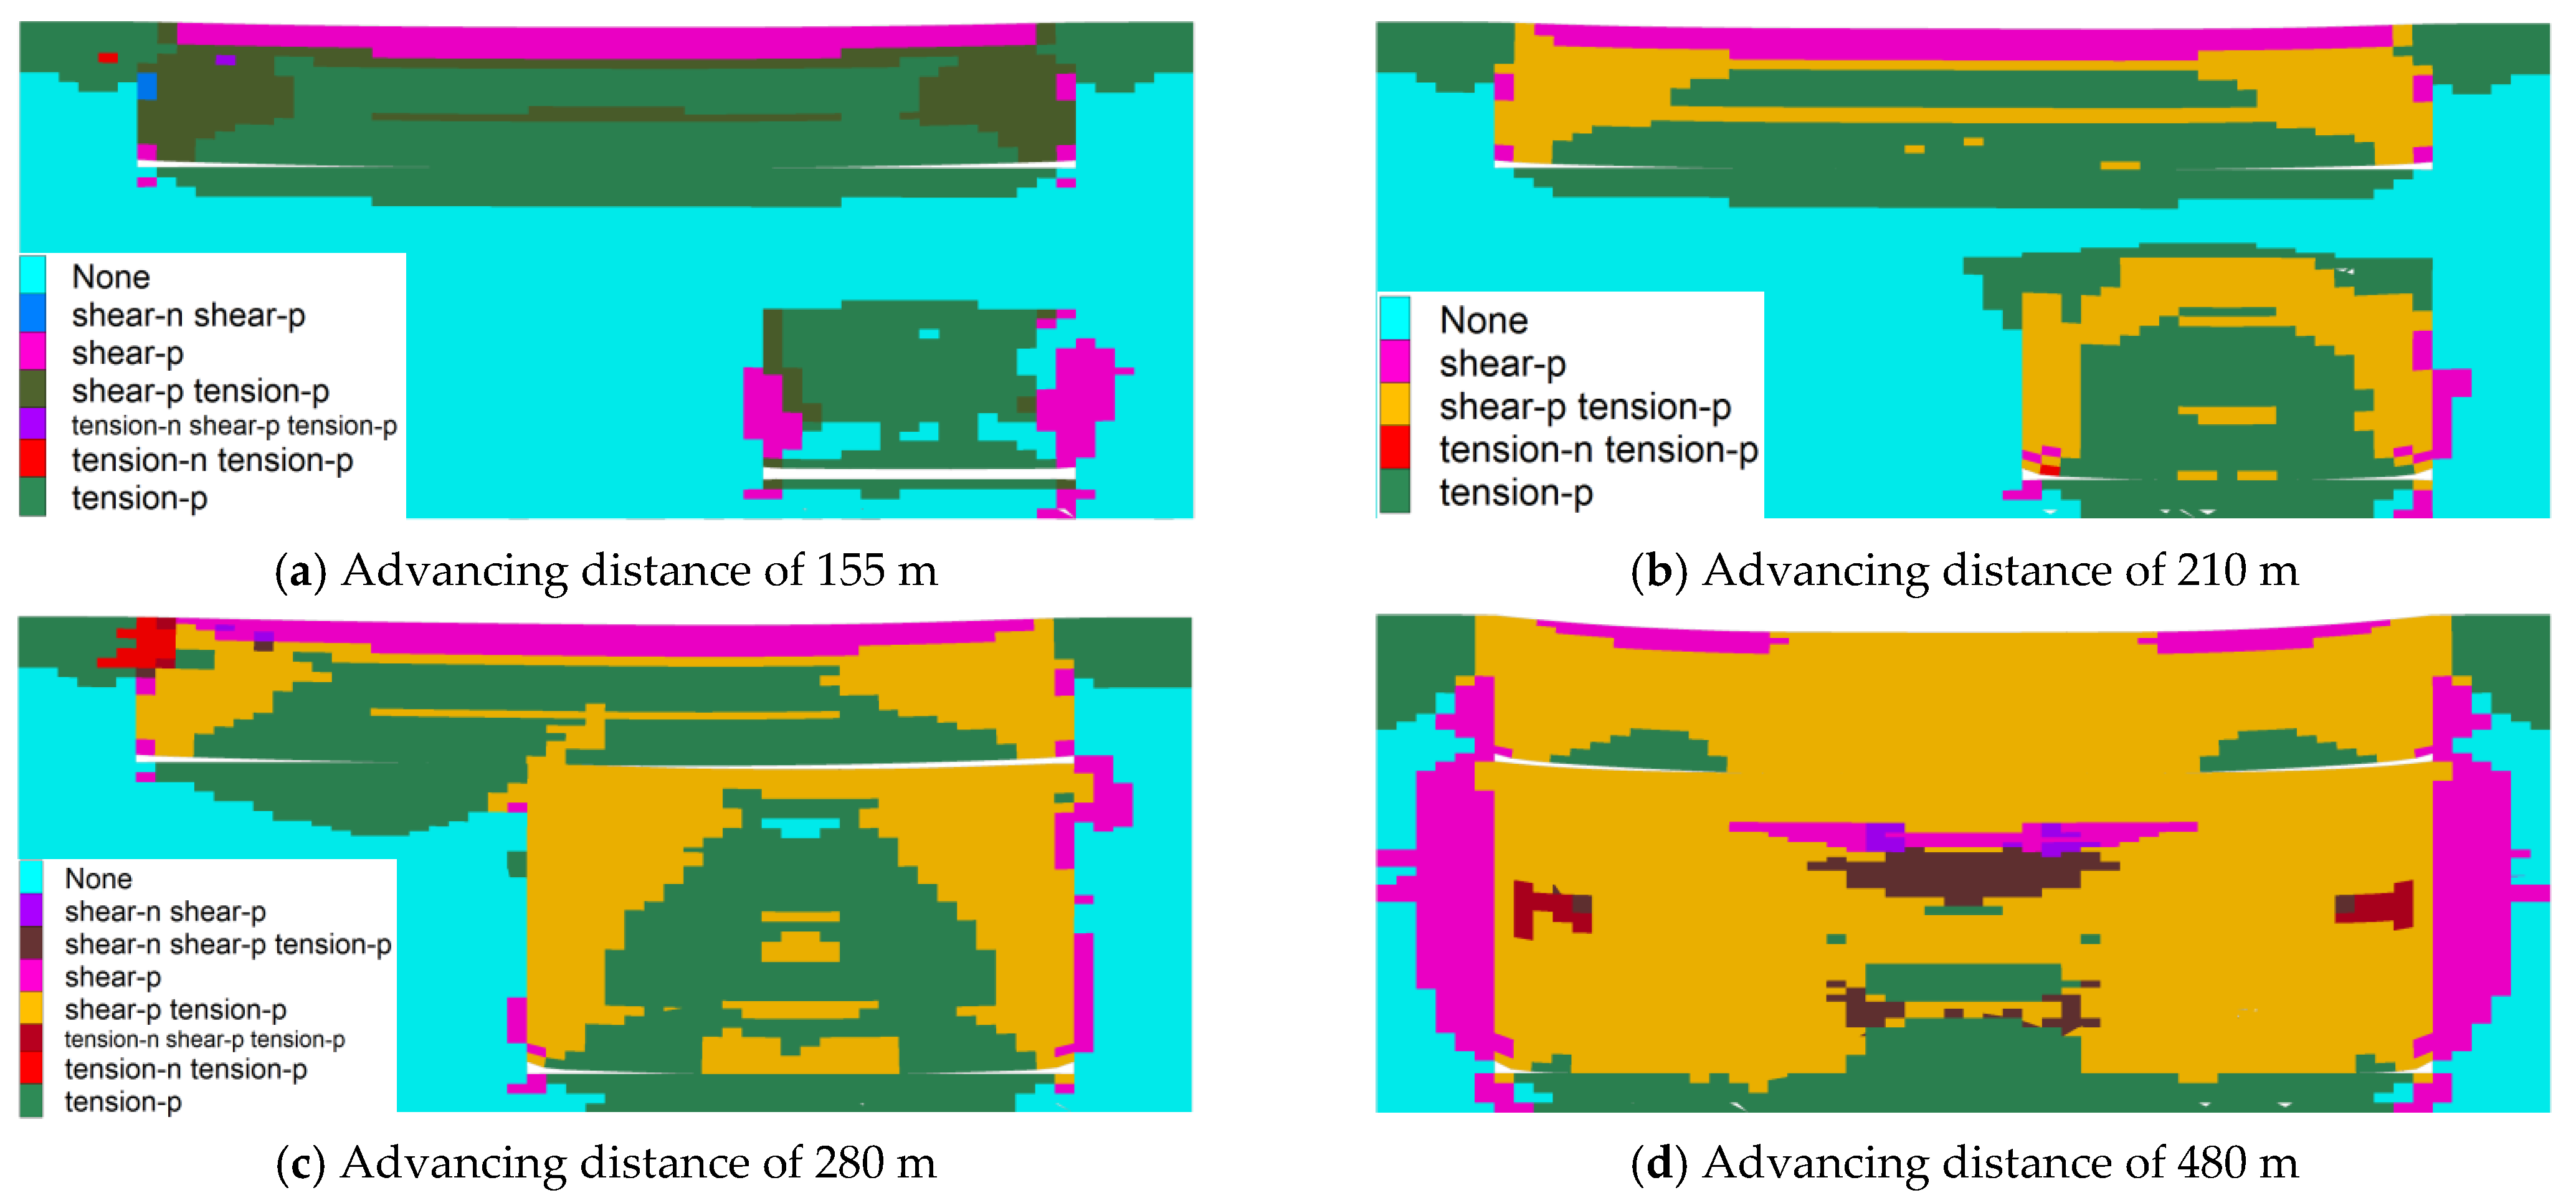
4.2. Caving Processes Simulation by FLAC 3D

The distribution of plastic zone in the numerical simulation results can reflect the failure of roof and floor strata after coal seam mining. A vertical cross-section at y = 150 m was chosen for the analysis of failure range and failure mode of the overlying strata, as shown in Figure 11 and Figure 12. When No. 2−2 coal advanced to 112 m, the overburden failure height reached 34.5 m, and when it advanced to 135 m, the overburden failure height reached the surface. As the working face continued to advance, the failure range of overburden was further expanded, only caving zone and fractured zone were formed, and there was no bending subsidence zone. When No. 5−2 coal advanced to 155 and 210 m, the overburden failure height was 81 and 105 m, respectively. When the mining distance reached 280 m, a new large area of roof caving occurred upward, all interlayer strata were broken, and the failure height of overburden reached No. 2−2 coal goaf. When the working face advanced to 480 m, the failure range of overburden was further expanded.
The failure modes of overlying rock mass in goaf were tensile failure, tensile shear failure, and shear failure, and the mining-induced fractures in each failure area were connected with each other. In addition, according to the failure mode of rock mass, the repeated mining of No. 5−2 coal had further broken the damaged rock mass in the No. 2−2 coal goaf. It can be seen that the numerical simulation results are consistent with the similar simulation.

5. Field Observation

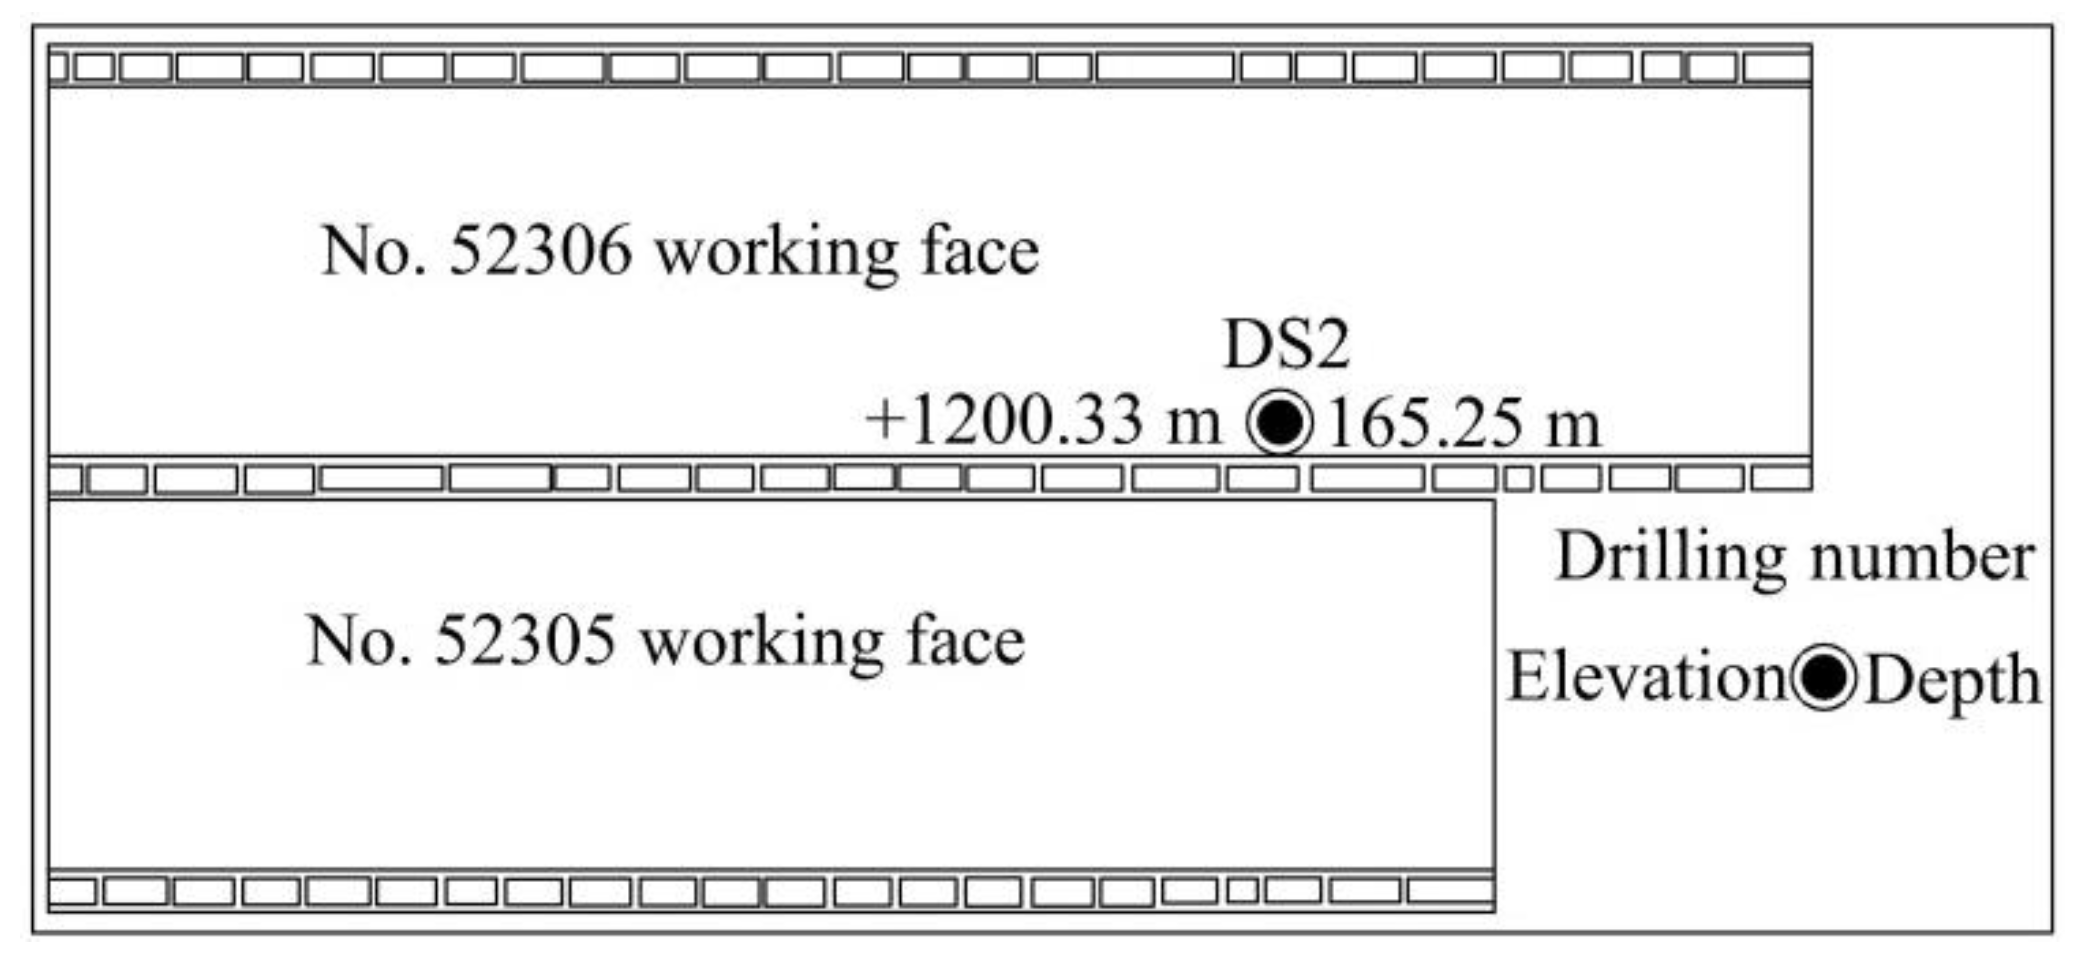
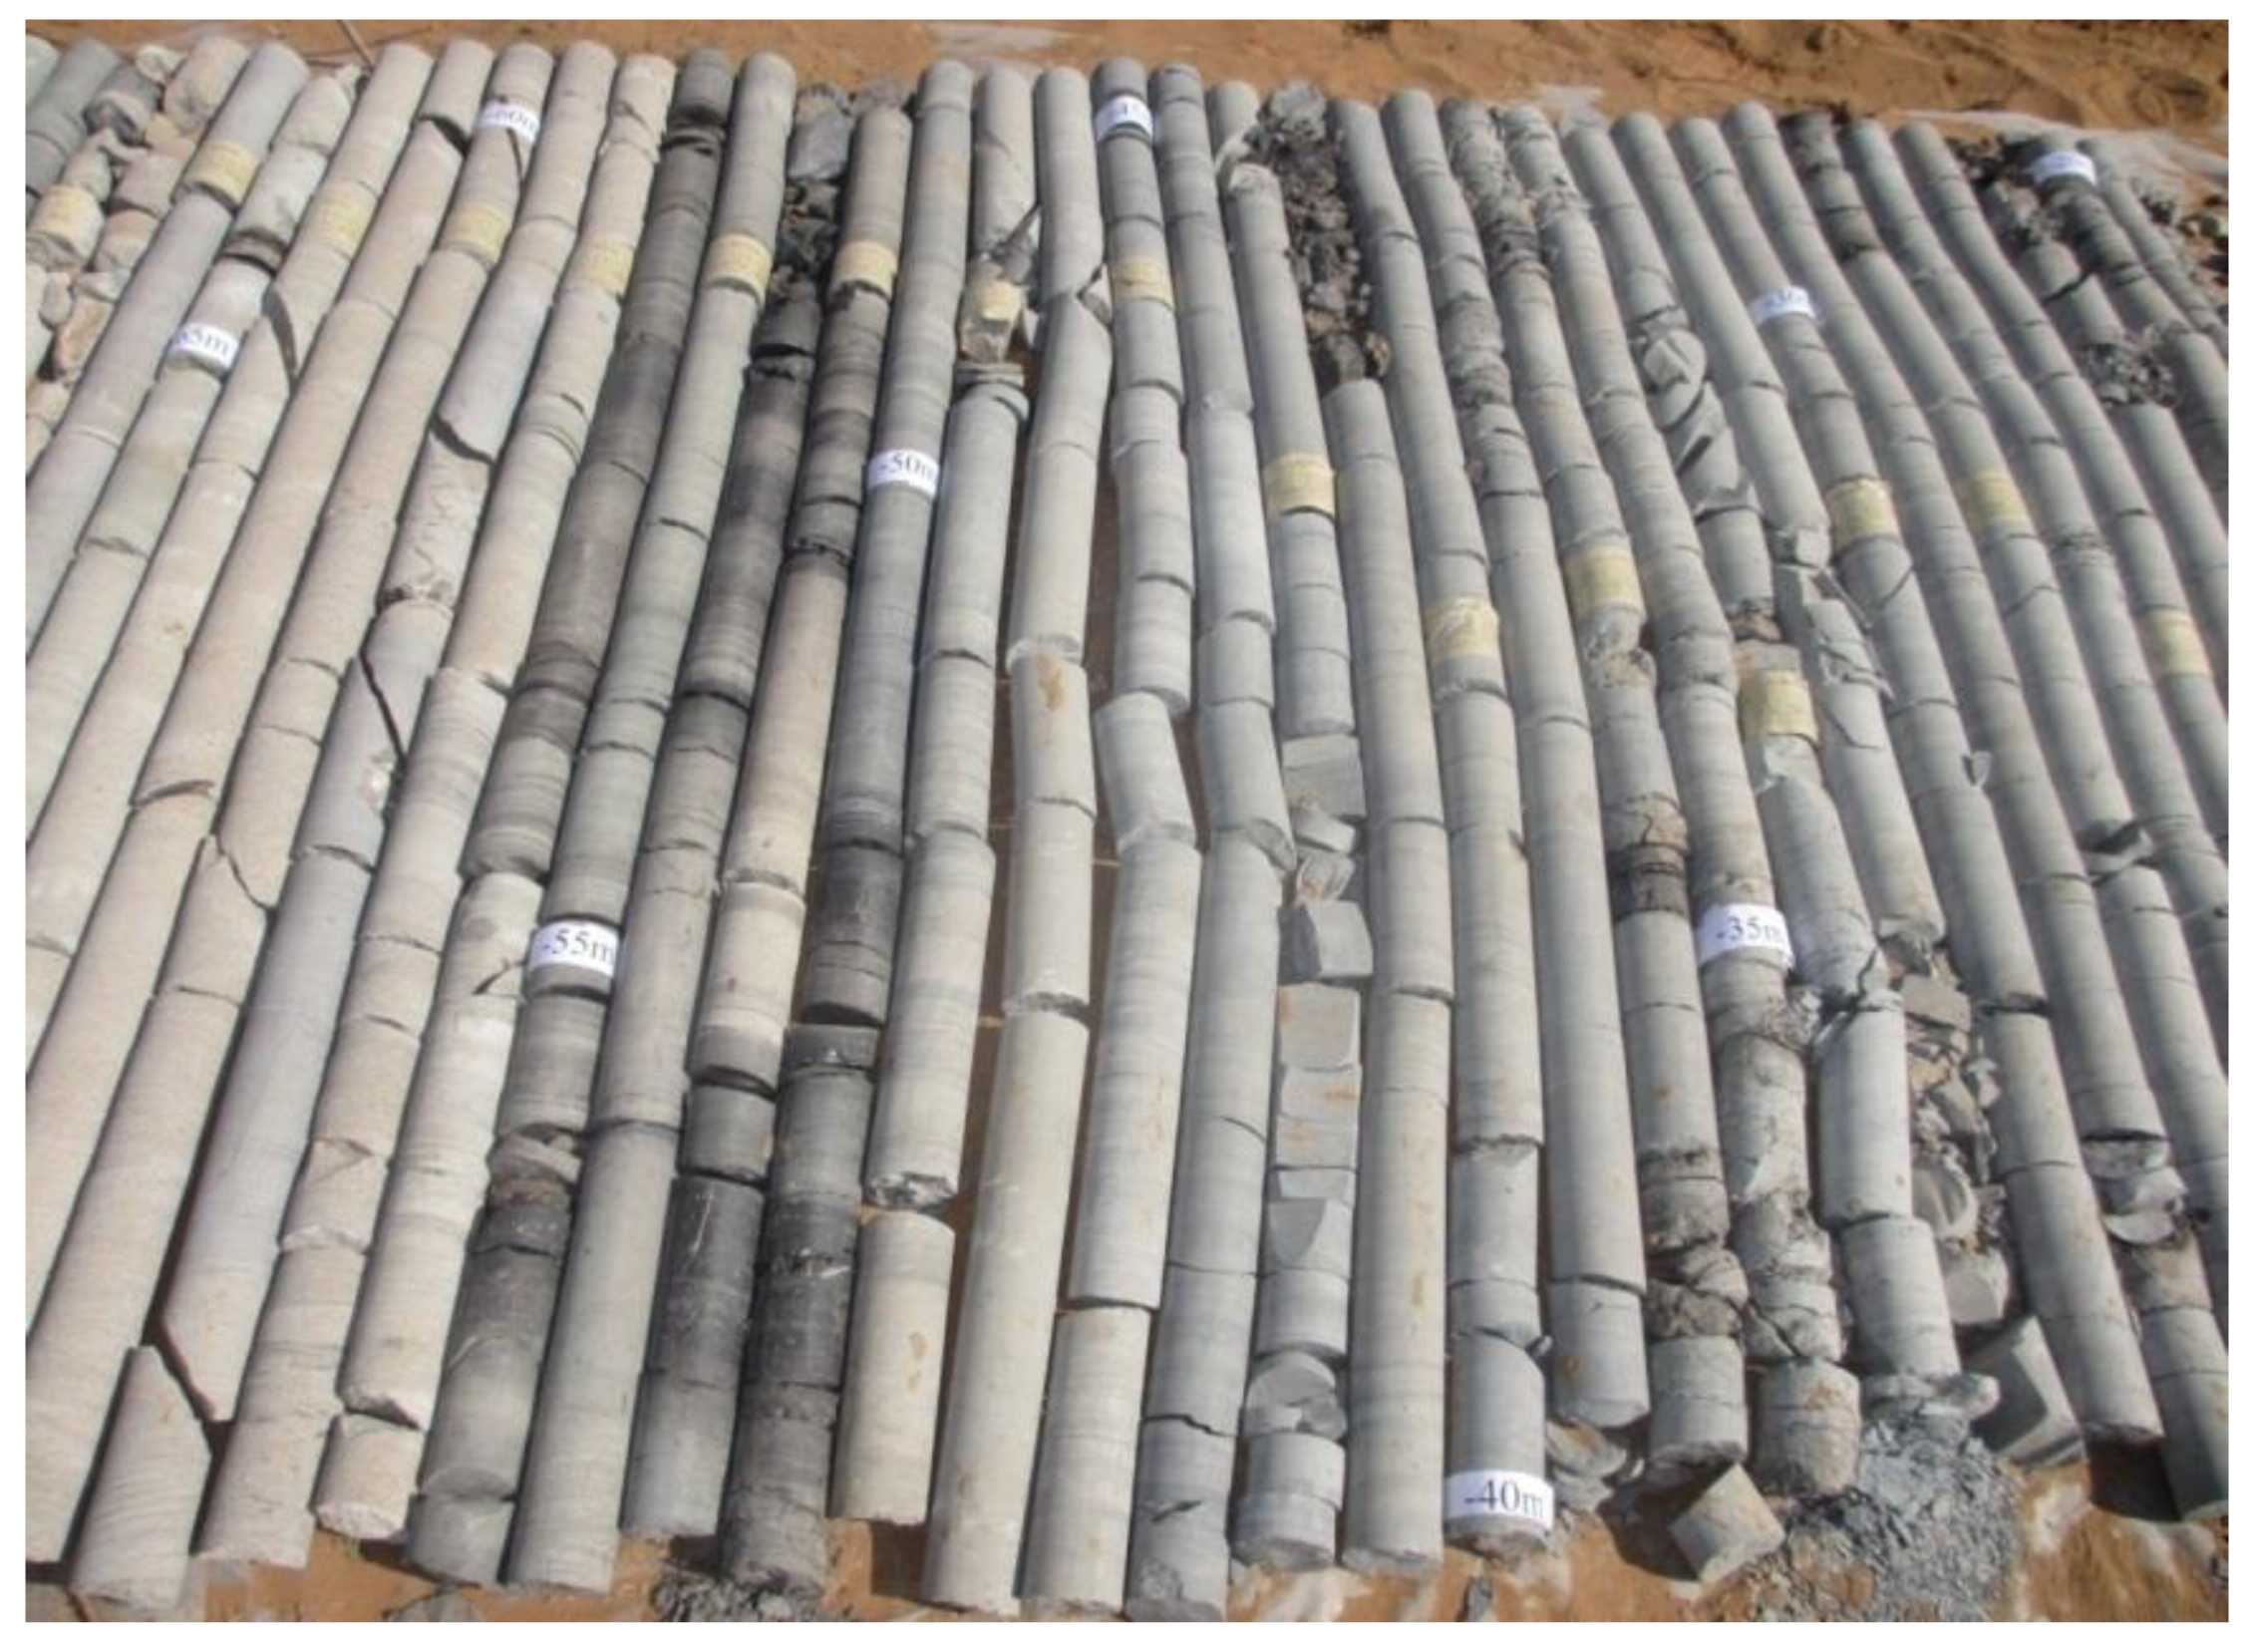
5.1. Engineering Background and Borehole Layout

The coal seam currently mined at the No. 52306 working face in the Daliuta mine field is No. 5−2 coal seam, with large thickness and shallow buried depth. According to prospecting materials, the No. 5−2 coal seam is only 160.06–182.35 m away from the surface, with an average of 173.20 m. The previous mining data indicate that the actual development height of the water-conducting fractured zone in this area is much higher than the value calculated by the empirical formula, which may conduct the above goaf water and aquifers, becoming the main water filling channel of the mine. Therefore, in order to ensure the safe mining of the mine, the overburden failure height of No. 5−2 coal seam was detected.
The DS2 detection hole was constructed on the surface of the No. 52306 working face. The DS2 drill hole is a post-mining hole. The elevation of the hole is 1200.33 m, the final hole depth is 198.25 m, and it is 403 m away from the setup entry of the No. 52306 working face and 26 m from the return airway, the length of the working face is 301 m. The elevation of No. 5−2 coal seam roof is 1016.76 m. Figure 13 shows the longwall panel layout of the mining area and the location of the DS2 drilling hole.

5.2. Analysis of Observation Results

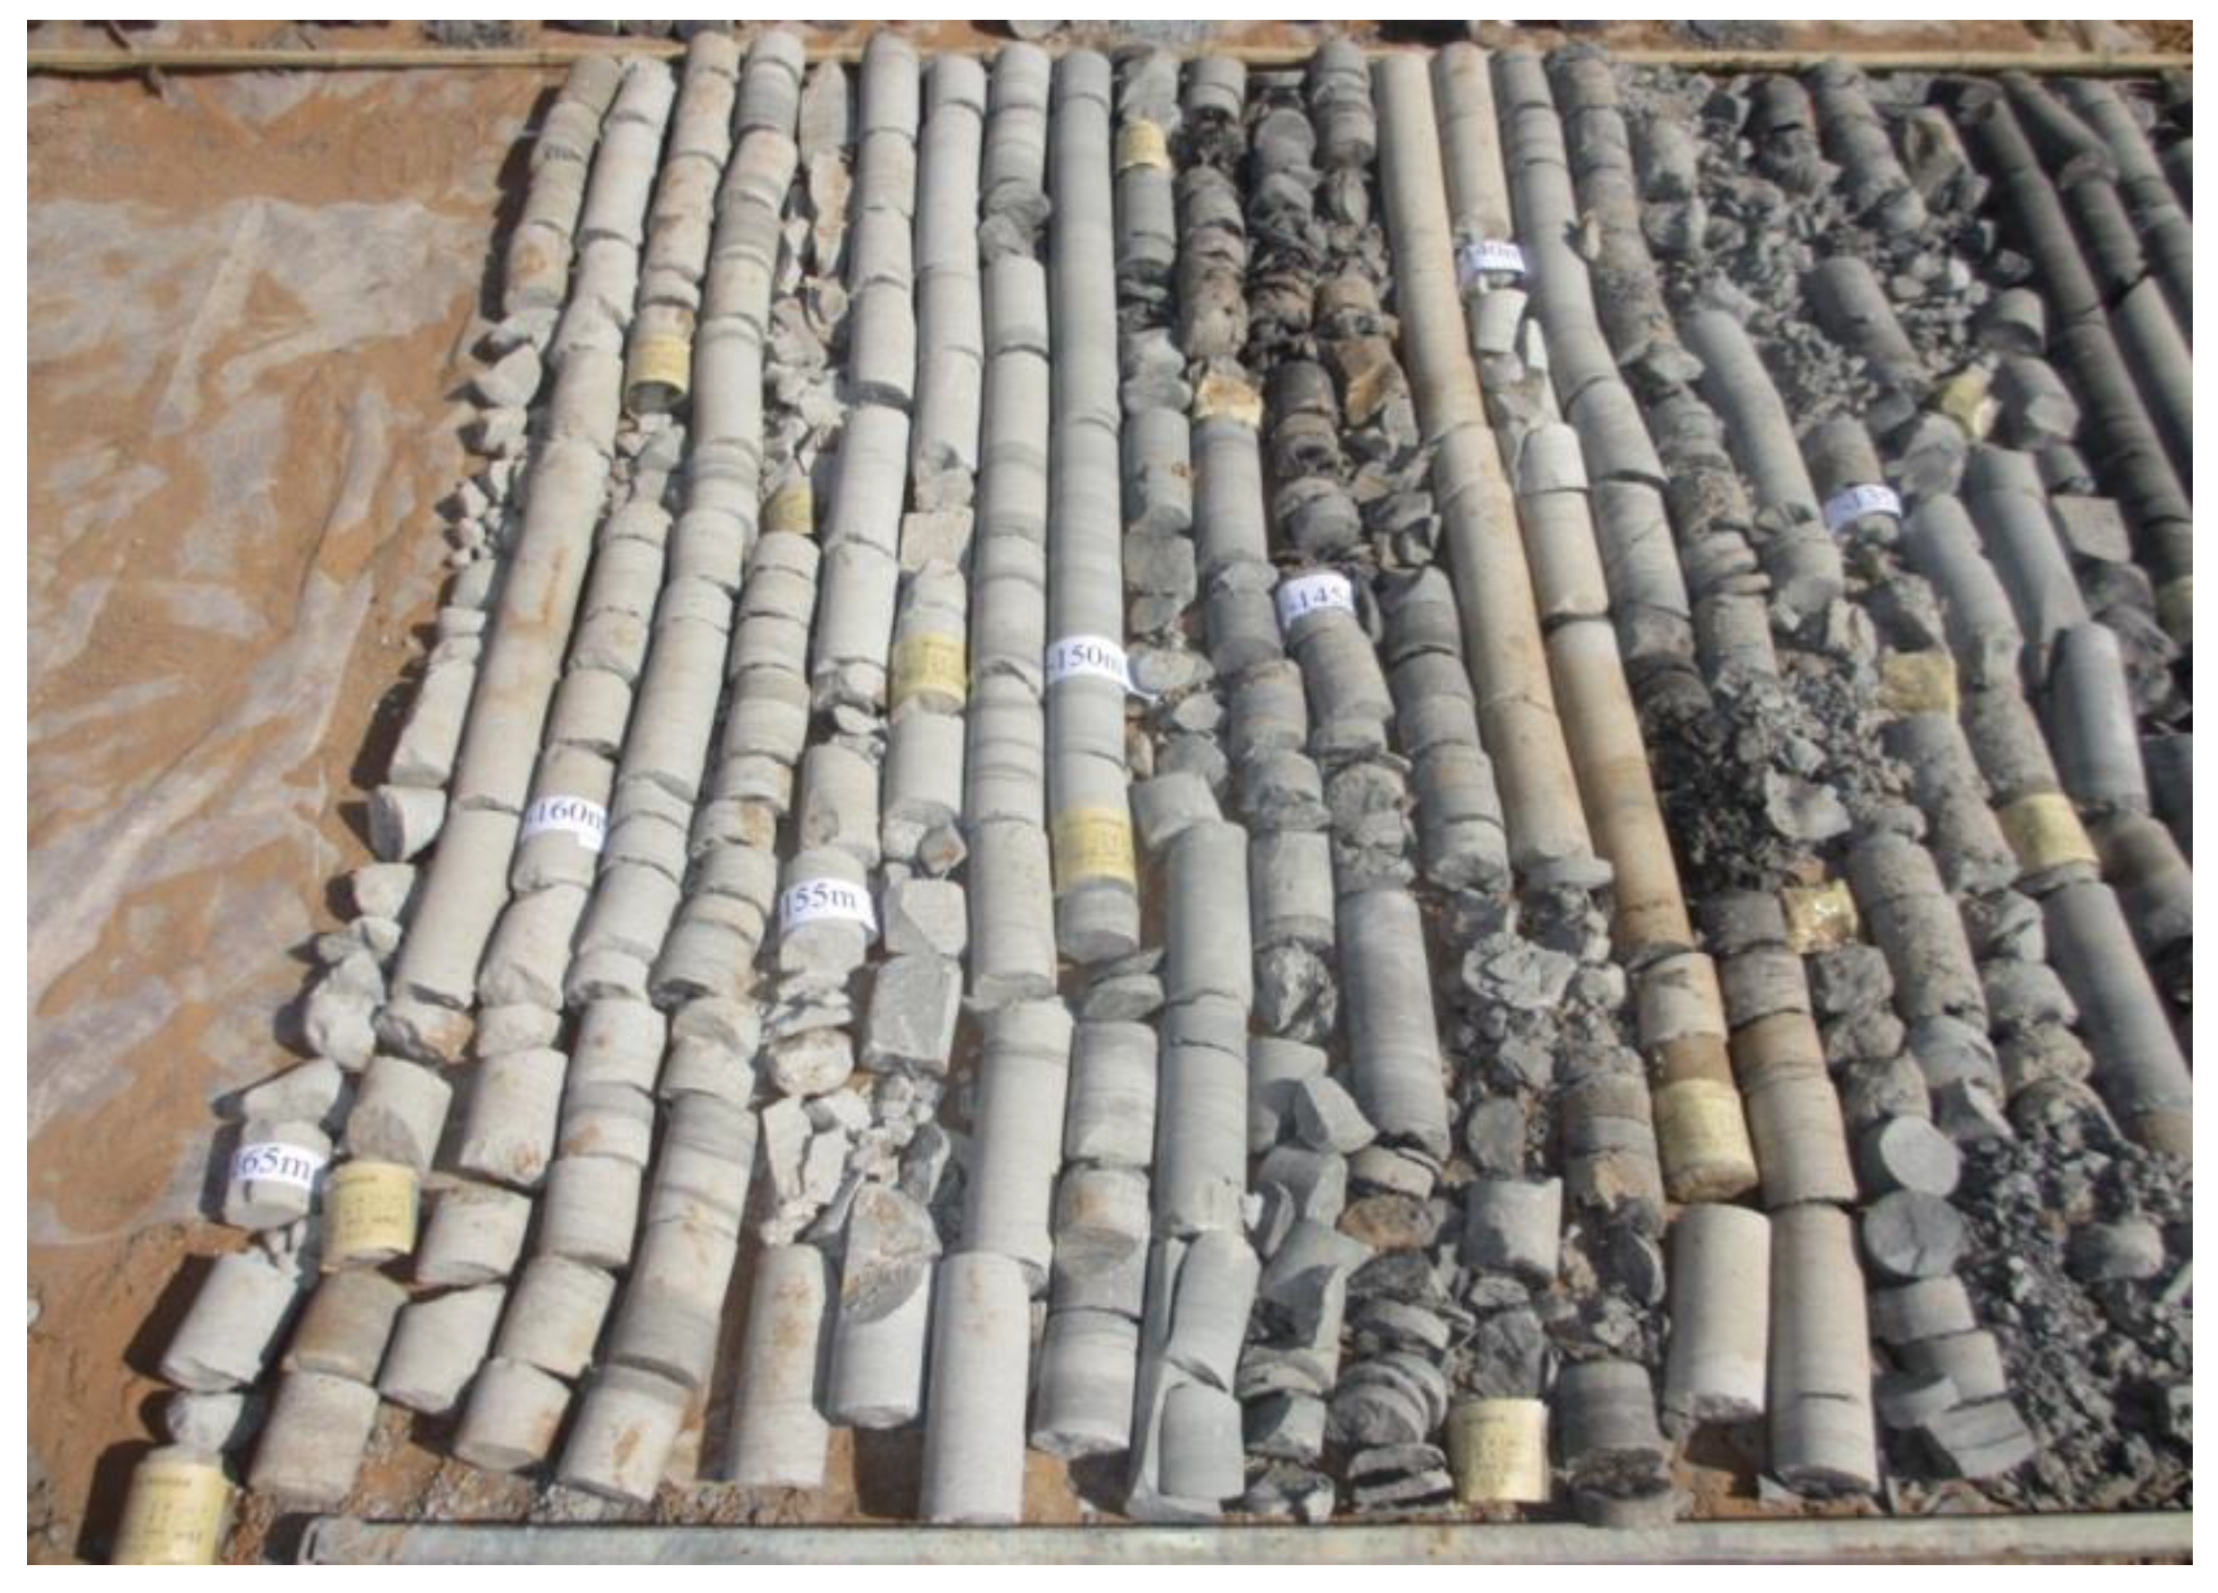
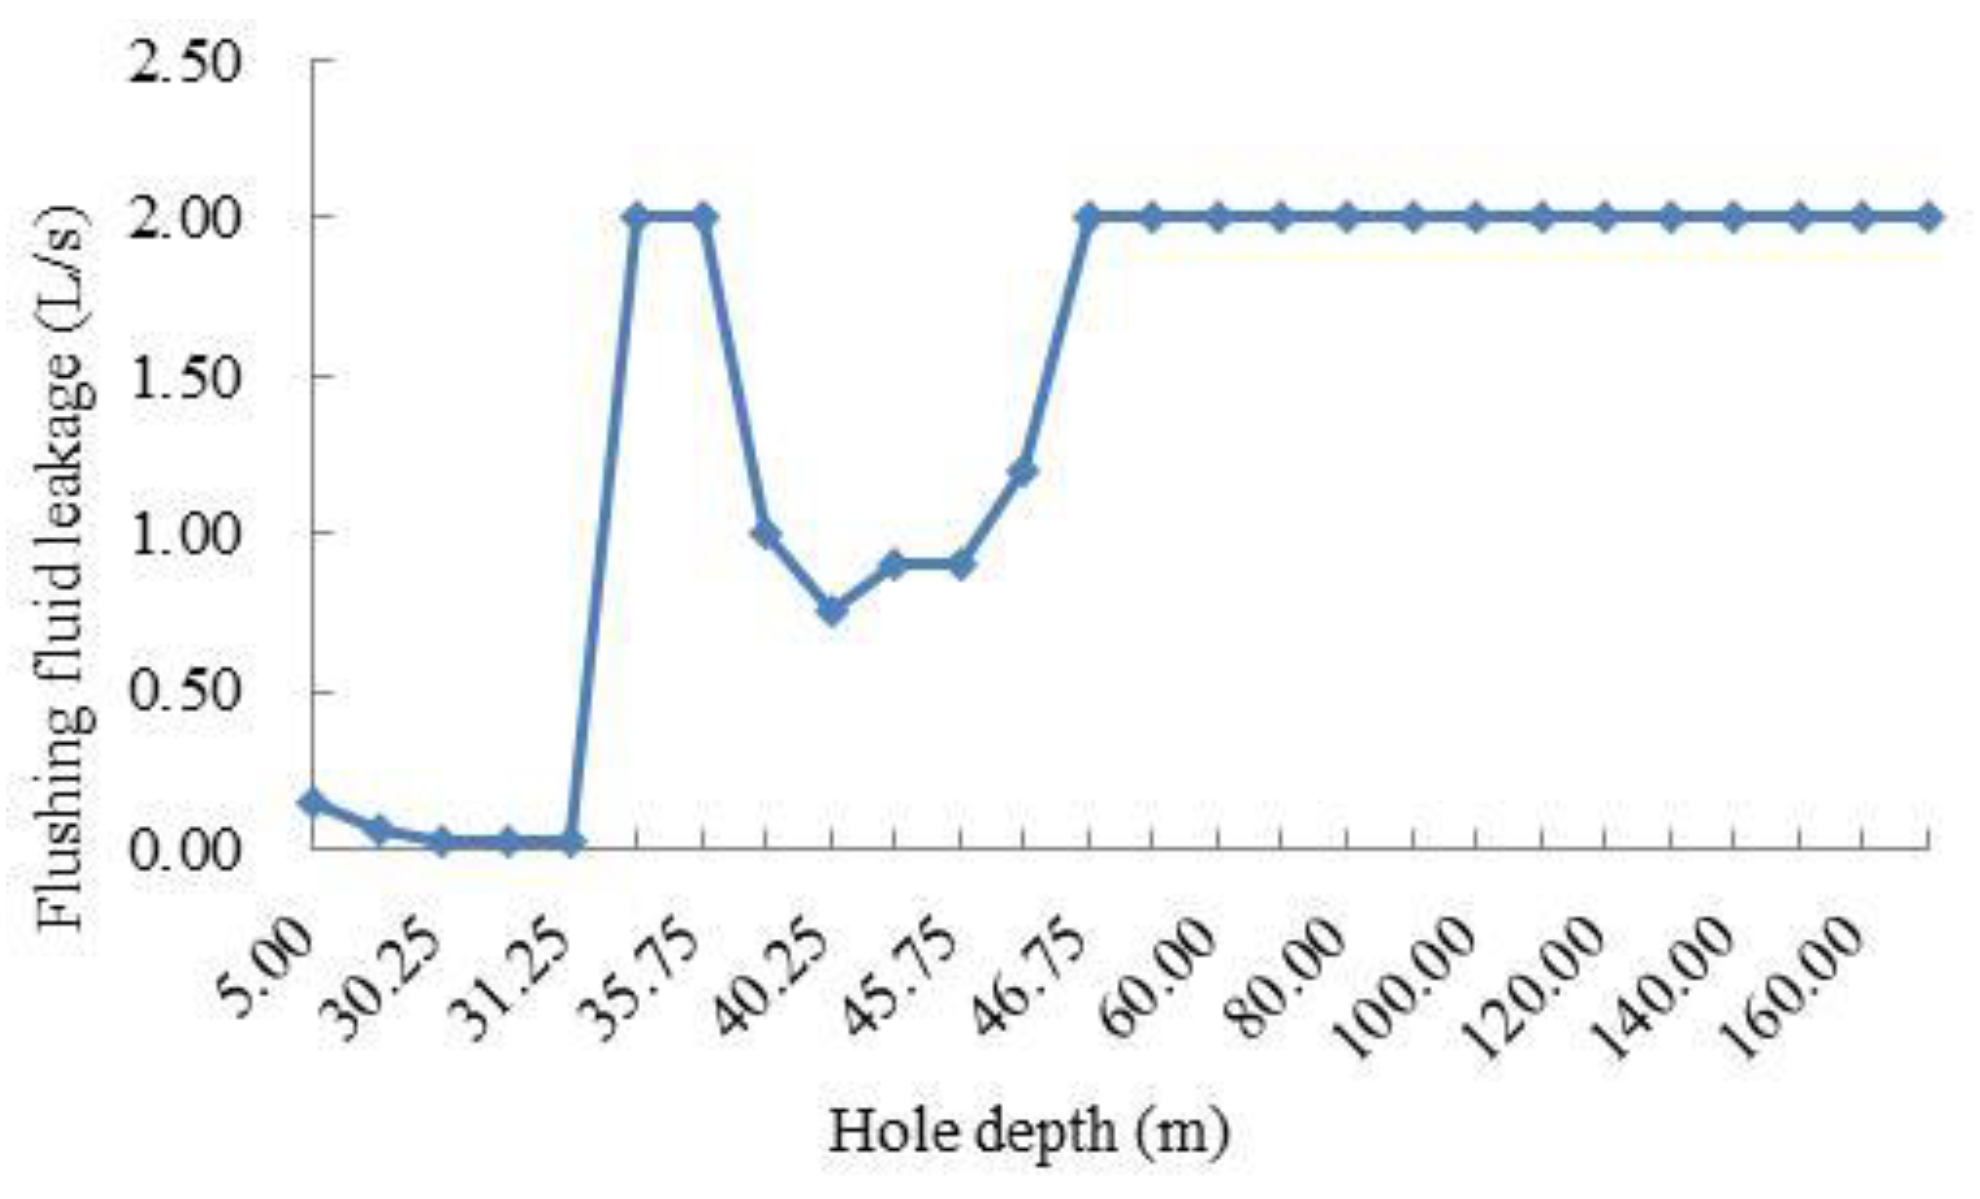
5.2.1. Height of Caving Zone

When the DS2 borehole was drilled to the depth of 146.25 m, there was air suction, and the drill falling height was 0.30 m. The first drill falling occurred when drilling to the hole depth of 148.95 m, but the drill falling was not obvious. In the hole depth of 148.95–163.75 m, several small drill falling of different sizes occurred intermittently, but they were not obvious. According to the observation results of this section by Borehole TV, the places where small drill falling occurred were seriously broken strata. Because the strata were relatively broken, the compressive strength and compactness were relatively reduced, which may be the main reason for the small drill falling. For example, Figure 14 shows the borehole imaging in the hole depth of 162.5–163.2 m, the rock masses at the depth of 162.5–163.2 m were severely broken, of which the section of 162.9–163.2 m was a hole with a diameter greater than 400 mm. When drilling to the hole depth of 163.75 m, the drill falling occurred again, and the drill falling height was 0.50 m. The instantaneous air suction in the hole intensified, the wind can be heard, and the drill was stuck at the same time. Then, drill down to the hole depth of 165.25 m. The drilled section was normal bedrock, and the lithology was the same as that of the roof strata in the caving zone. Cores were retrieved from the bottom of post-mining drilling, Figure 15 shows the fracture characteristics of cores in the hole depth of 135–166 m.
Based on the comprehensive analysis of the above phenomena, it was determined that the top boundary of the caving zone was at 163.75 m of the hole depth, and its elevation was 1036.58 m. It was calculated by subtracting it from the elevation of No. 5−2 coal seam roof, and the height of the caving zone was 19.82 m.

5.2.2. Height of Fractured Zone

In the hole depth of 18.00–31.25 m (elevation 1182.33–1169.08 m), the flushing fluid loss was 0.03–0.06 L/s, and the core in the section was complete without fractures. When the DS2 borehole was drilled to the depth of 31.25 m, the flushing fluid was completely leaked, and no slurry returned to the orifice. After plugging, it was ineffective and continued to drill. When drilling to 35.75 m, the slurry returned to the orifice again, but the leakage was high. The core in the section with hole depth of 31.25–35.75 m was relatively incomplete, local fractures were relatively developed, and local rock cores were broken. The flushing fluid leakage in the hole depth of 35.75–46.25 m was 0.64–1.20 L/s. The analysis of occasional fractures and local breakage of rock core in the section was due to the bending subsidence of overlying strata induced by coal mining, which caused physical damage to soft rock strata in the process of subsidence. When the borehole was drilled to the depth of 46.25–165.25 m (elevation 1154.08–1035.08 m), all the drilling fluid was lost. The rock cores in the hole depth of 46.25–163.75 m were incomplete, and the secondary fractures were developed with different sizes, which were evenly distributed in the section. The upper rock cores in the section were seriously broken locally, and most of the lower rock cores were extremely broken. Figure 16 shows the observation results of flushing fluid leakage in the DS2 borehole. Cores were retrieved from the upper part of post-mining drilling, Figure 17 shows the fracture characteristics in cores in the hole depth of 30–65 m.
Combining the water level change, fracture characteristics of cores, air suction, and drill falling in the hole, the top boundary of the water-conducting fractured zone of the DS2 borehole was at the depth of 46.25 m. The development height of the water-conducting fractured zone in the No. 52306 working face was calculated to be 137.32 m, which was 20.2 times the mining height. The field measurement results verify the accuracy of physical simulation and numerical simulation.
Since the distance between No. 5−2 coal seam and No. 2−2 coal seam is 156.83 m, and the failure depth of No. 2−2 coal seam is about 20 m, the water-conducting fractured zone of No. 5−2 coal seam overburden is connected with the disturbed fractures of No. No. 2−2 coal seam floor, forming the main water filling channel. Due to the large water inflow of No. 2−2 coal, it is recommended to strengthen the mine water prevention and control work. Due to the large amount of water accumulated in the No. 2−2 coal goaf and the structure of the overlying aquifer has been destroyed, the mine water prevention and control work should be strengthened in the mining of No. 5−2 coal seam.

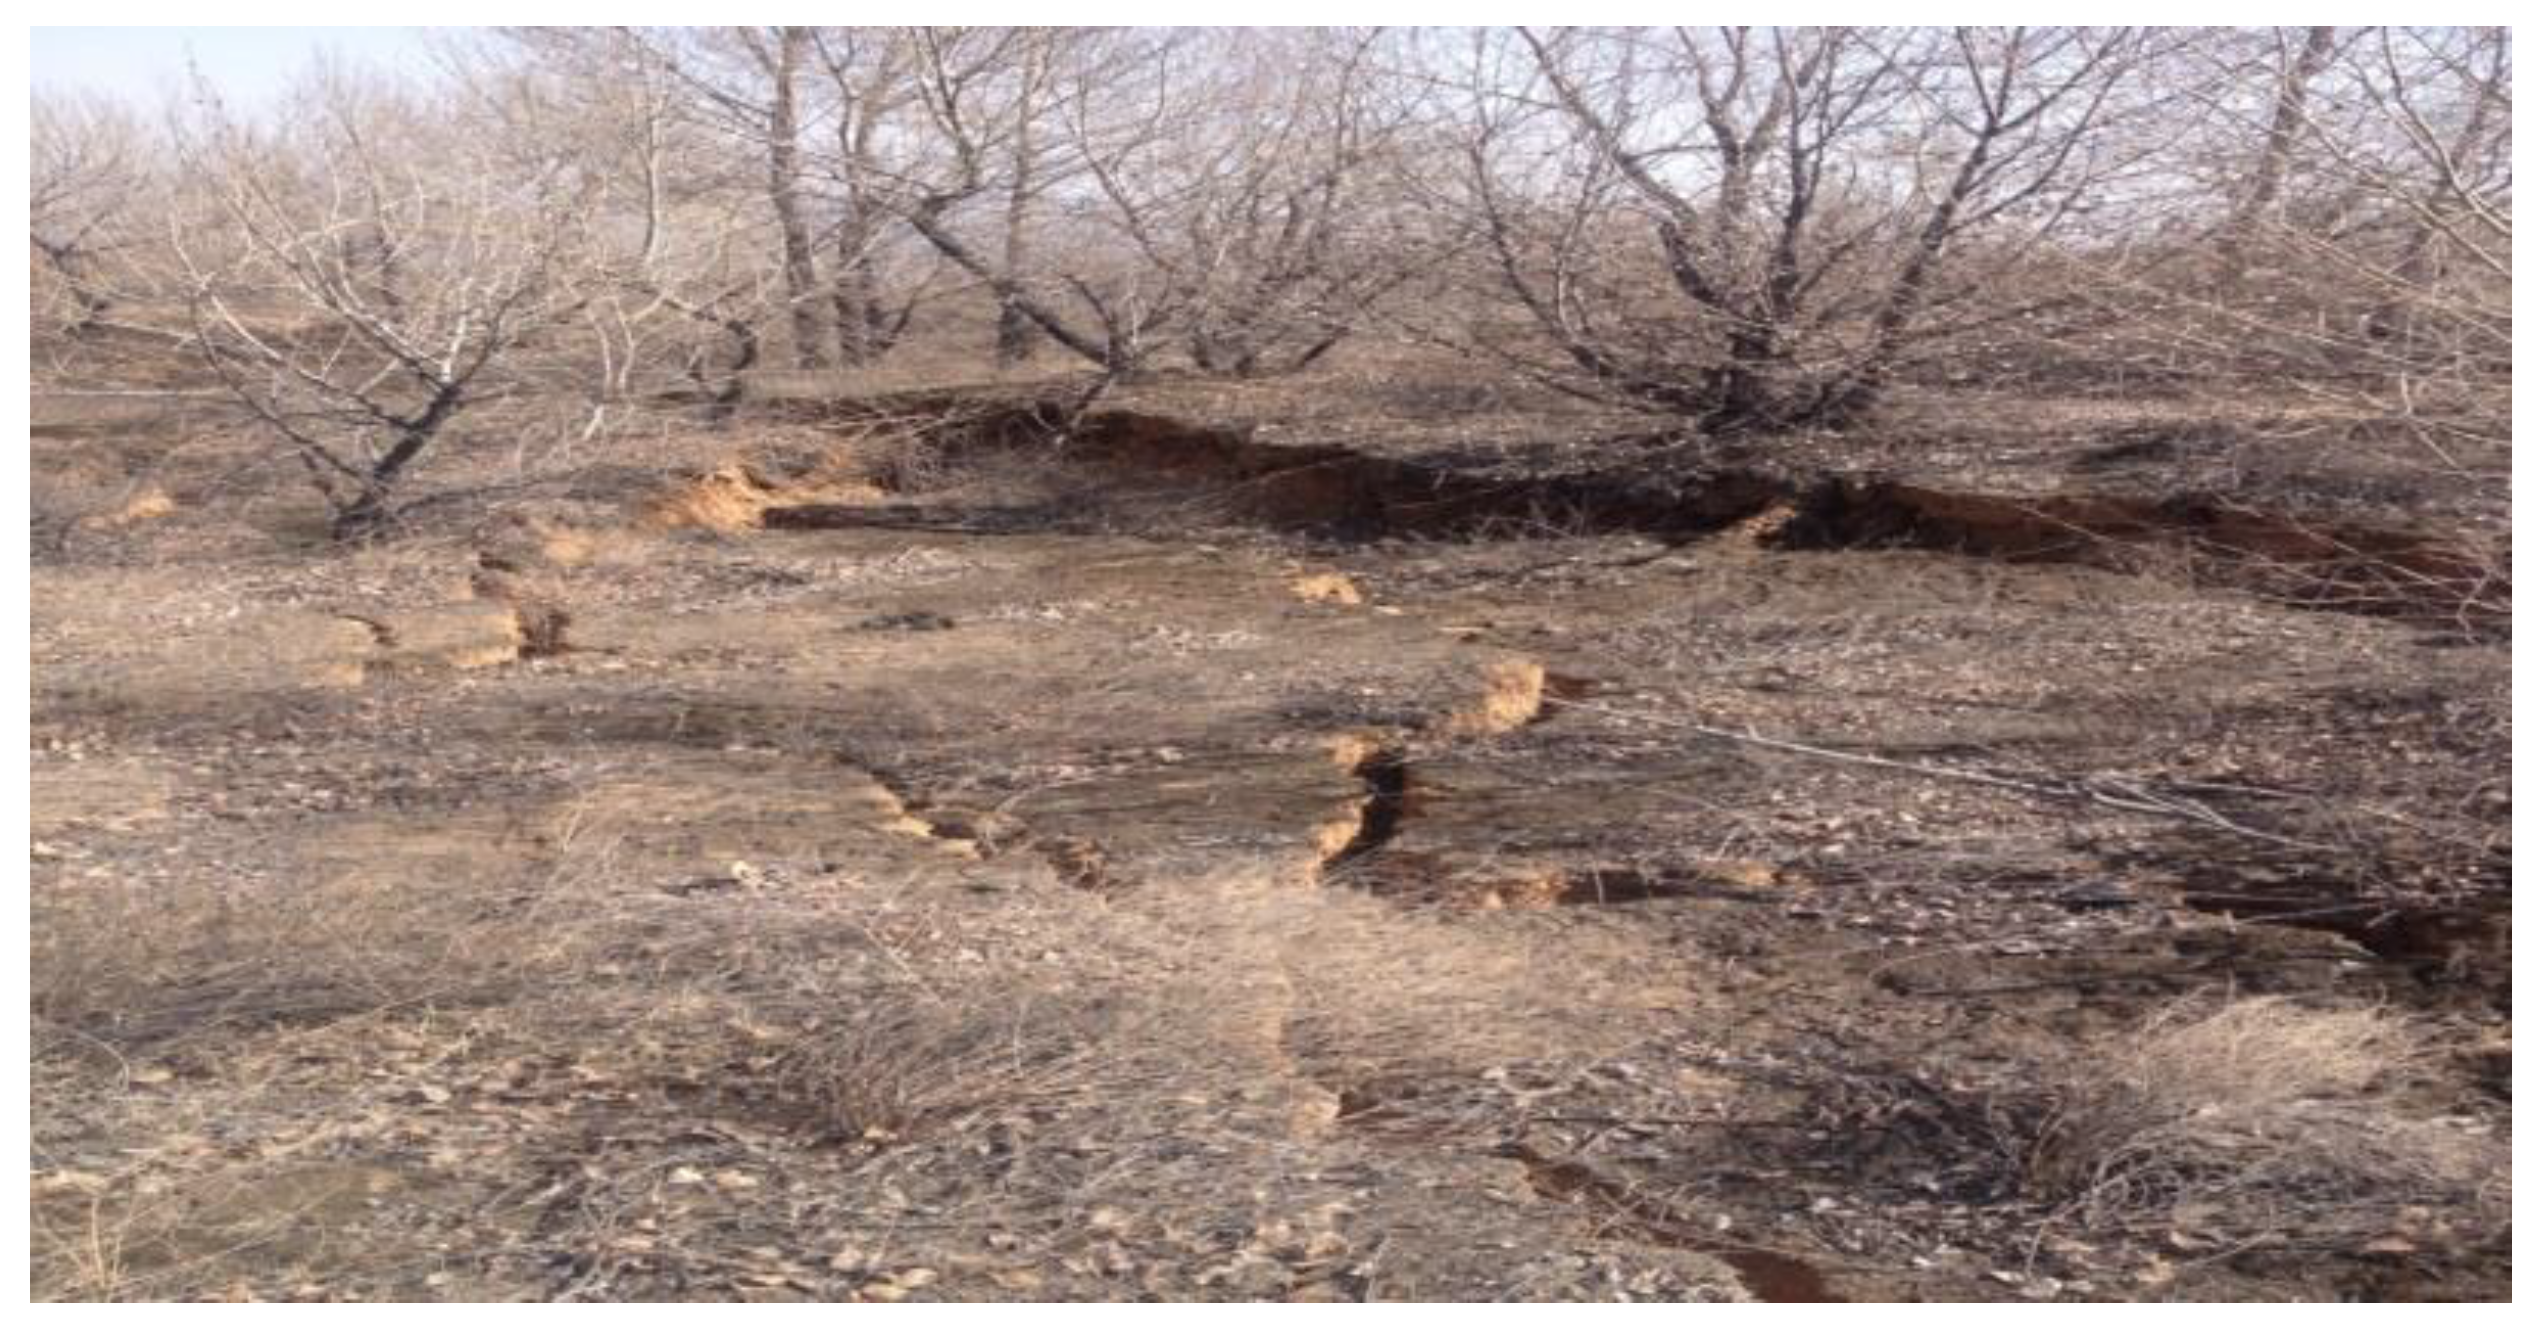
5.2.3. Ground Fractures

Through the survey of the ground around the borehole, the ground around the borehole collapsed locally, with large amounts of fractures of different sizes, and the ground fractures caused serious damage to the surface vegetation and ecology, as shown in Figure 18.

6. Comprehensive Analysis and Formula Revision of Overburden Failure Height

The failure characteristics of overburden were comprehensively analyzed by similar simulation experiment, numerical simulation, and field observation, and the height of caving zone and fractured zone were obtained. At the same time, the development height error obtained by each method was analyzed, as shown in Table 5.
The compressive strength of coal-measure rocks in the Daliuta coal mine is generally 20–40 Mpa, and the overlying strata of the coal seam are of medium-hard type. According to the current regulations, the traditional empirical formula for the height of water-conducting fractured zone in the Daliuta coal mine is [22]:
H f = 100 M 1.6 M + 3.6 ± 5.6
where, Hf is the height of water-conducting fractured zone, M is the cumulative mining thickness.
It is known that the mining height of No. 5−2 coal in the mine is 6.6 m. By substituting it into Equation (5), it can be calculated that the maximum height of water-conducting fractured zone is 52.2 m. The maximum height obtained by field observation and simulation is 153 m. Comparing it with the formula result, the ratio is 2.931. Revise the traditional empirical formula and get a new empirical formula, it can be expressed as follows:
H f = 293.1 M 1.6 M + 3.6 ± 5.6
Through the analysis of the revised empirical formula, it is found that the error between the predicted value of the new empirical formula and the height of water-conducting fractured zone obtained by similar simulation is 7.1%, and the error between the predicted value of the new empirical formula and the height of water-conducting fractured zone obtained by field observation is 3.6%. The comprehensive analysis shows that the revised empirical formula has high reliability.

7. Conclusions

In order to solve the impact of shallow buried thick coal seam mining on water resources and environment at the Daliuta coal mine in the Shendong mining area, the characteristics of overburden collapse, movement, and deformation in multi coal seam mining were studied by using the methods of physical modeling, FLAC 3D numerical simulation and field observation, and derived the following conclusions:
(1)
The comparison of the failure characteristics of overlying strata obtained by similar simulation experiment, FLAC 3D numerical simulation, and field observation shows that the caving characteristics of overlying strata obtained by them were roughly consistent. The shallow buried No. 2−2 coal at the Daliuta coal mine was mined at full height at one time, and the mining fractured zone developed to the surface. The mining overburden fractured zone of the near-shallow buried No. 5−2 coal conducted the No. 2−2 coal goaf. The broken of interlayer strata intensified the instability of surrounding rock structure of No. 2−2 coal goaf, and the overburden and surface subsidence of No. 2−2 coal increased significantly.
(2)
The overburden failure height (height of water-conducting fractured zone) of No. 5−2 coal in the Daliuta coal mine was 137.32–153 m, which was 20.8–23.2 times the mining height. A new empirical formula was obtained through revision of the existing prediction formula, it can better adapt to the prediction of water-conducting fractured zone in one-time full height mining of thick coal seam in the Daliuta coal mine. The error between the predicted value of the new empirical formula and the height of water-conducting fractured zone obtained by field observation is 3.6%. Although the error of the new empirical formula is relatively small, it still needs more measured data for further revision.
(3)
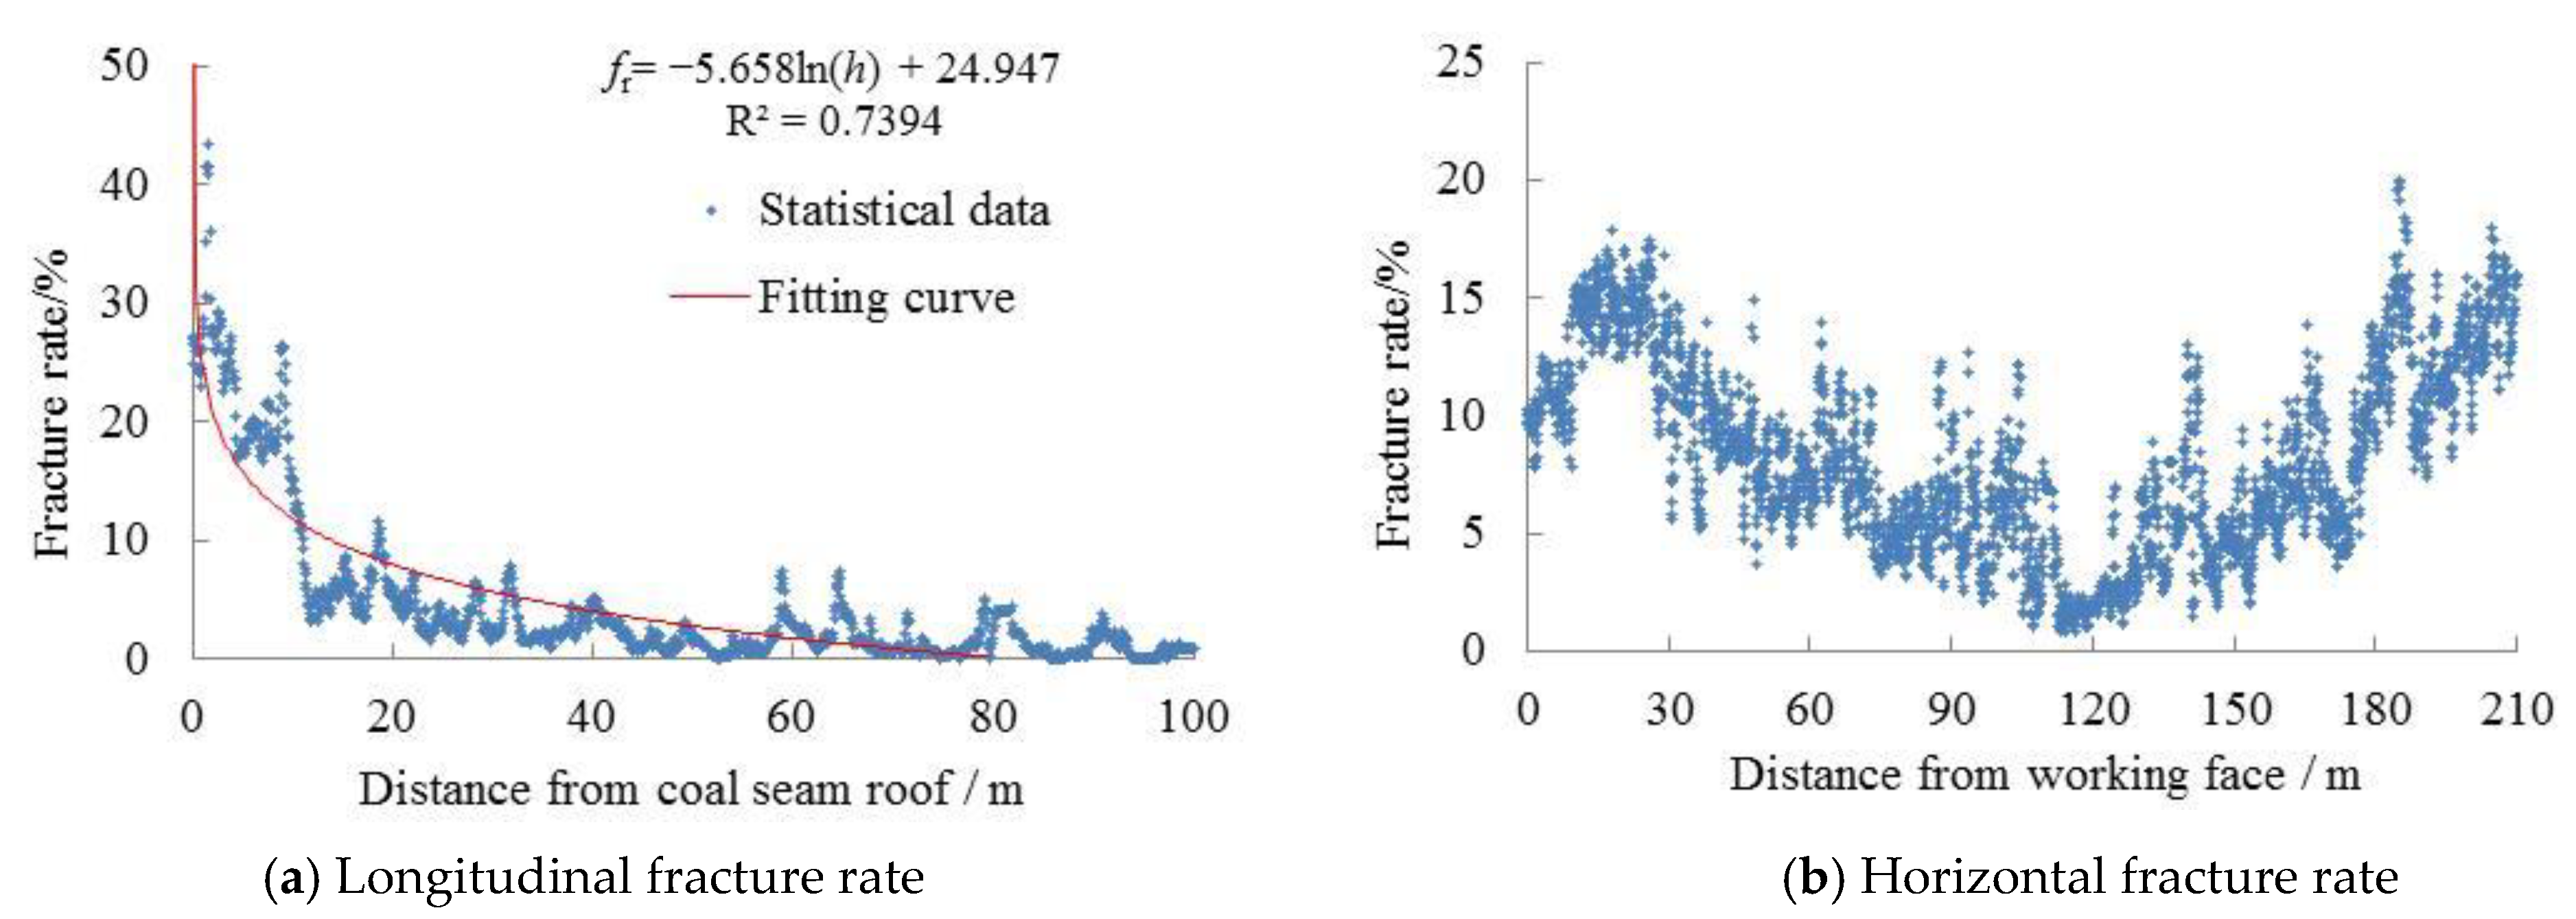
The quantitative distribution laws of the fracture rate in the mining overburden rock were obtained. In the horizontal direction of the goaf, the fracture rate of the rock mass presented a “saddle” distribution, and the fracture rate of the rock mass at the boundary of the goaf was much larger than that in the middle. In the longitudinal direction of the goaf, the rock mass fracture rate decreased in a logarithmic function with the increase of the height from the mining coal seam. The area with large fracture rate has good water conductivity and is the dominant seepage channel for groundwater inrush into the working face. The understanding of mining fracture distribution is of great significance to the prevention and control of water inrush and the protection of groundwater resources.

Author Contributions

X.S., conceptualization, data curation, formal analysis, writing—original draft preparation; J.Z., validation, writing—review and editing. All authors have read and agreed to the published version of the manuscript.

Funding

This research was supported by the National Natural Science Foundation of China (Grant No. 42072204) and the Henan Province Scientific and Technological Plan Project (Grant Nos. 202102310218, 212102310818).

Institutional Review Board Statement

Not applicable.

Informed Consent Statement

Not applicable.

Data Availability Statement

Not applicable.

Conflicts of Interest

The authors declare no conflict of interest.

References

  1. Meng, Z.; Shi, X.; Li, G. Deformation, failure and permeability of coal-bearing strata during longwall mining. Eng. Geol. 2016, 208, 69–80. [Google Scholar] [CrossRef]
  2. Liu, S.; Li, W.; Wang, Q. Zoning method for environmental engineering geological patterns in underground coal mining areas. Sci. Total Environ. 2018, 634, 1064–1076. [Google Scholar] [CrossRef]
  3. Liu, J.W.; Sui, W.H.; Zhang, D.Y.; Zhao, Q.J. Durability of water-affected paste backfill material and its clean use in coal mining. J. Clean. Prod. 2020, 250, 119576. [Google Scholar] [CrossRef]
  4. Guo, W.; Tan, Y.; Bai, E.; Zhao, G. Sustainable Development of Resources and the Environment: Mining-Induced Eco-Geological Environmental Damage and Mitigation Measures—A Case Study in the Henan Coal Mining Area, China. Sustainability 2019, 11, 4366. [Google Scholar] [CrossRef] [Green Version]
  5. Kim, J.M.; Parizek, R.R.; Elsworth, D. Evaluation of fully-coupled strata deformation and groundwater flow in response to longwall mining. Int. J. Rock. Mech. Min. Sci. 1997, 34, 1187–1199. [Google Scholar] [CrossRef]
  6. Peng, S.; Chiang, H. Longwall Mining; John Wiley & Sons, Inc.: New York, NY, USA, 1984; Available online: https://www.worldcat.org/title/longwall-mining/oclc/924780303?referer=di&ht=edition (accessed on 9 December 2021).
  7. Miao, X.X.; Cui, X.M.; Wang, J.A.; Xu, J.L. The height of fractured water-conducting zone in undermined rock strata. Eng. Geol. 2011, 120, 32–39. [Google Scholar] [CrossRef]
  8. Palchik, V. Formation of fractured zones in overburden due to longwall mining. Environ. Earth Sci. 2003, 44, 28–38. [Google Scholar] [CrossRef]
  9. Wang, G.; Wu, M.; Wang, R.; Xu, H.; Song, X. Height of the mining-induced fractured zone above a coal face. Eng. Geol. 2017, 216, 140–152. [Google Scholar] [CrossRef]
  10. Zhao, Y.; Yang, T.; Bohnhoff, M.; Zhang, P.; Yu, Q.; Zhou, J.; Liu, F. Study of the Rock Mass Failure Process and Mechanisms During the Transformation from Open-Pit to Underground Mining Based on Microseismic Monitoring. Rock Mech. Rock Eng. 2018, 51, 1473–1493. [Google Scholar] [CrossRef]
  11. Ding, K.; Wang, L.; Wang, W.; Wang, K.; Ren, B.; Jiang, C. Study on the Development Height of Overburden Water-Flowing Fracture Zone of the Working Face. Geofluids 2021, 2021, 1–10. [Google Scholar] [CrossRef]
  12. Guo, W.; Zhao, G.; Lou, G.; Wang, S. A New Method of Predicting the Height of the Fractured Water-Conducting Zone Due to High-Intensity Longwall Coal Mining in China. Rock Mech. Rock Eng. 2019, 52, 2789–2802. [Google Scholar] [CrossRef]
  13. Majdi, A.; Hassani, F.; Nasiri, M.Y. Prediction of the height of destressed zone above the mined panel roof in longwall coal mining. Int. J. Coal Geol. 2012, 98, 62–72. [Google Scholar] [CrossRef]
  14. Lu, Y.; Wang, L. Numerical simulation of mining-induced fracture evolution and water flow in coal seam floor above a confined aquifer. Comput. Geotech. 2015, 67, 157–171. [Google Scholar] [CrossRef]
  15. Ghabraie, B.; Ren, G.; Zhang, X.; Smith, J. Physical modelling of subsidence from sequential extraction of partially overlapping longwall panels and study of substrata movement characteristics. Int. J. Coal Geol. 2015, 140, 71–83. [Google Scholar] [CrossRef]
  16. Zhang, D.; Fan, G.; Ma, L.; Wang, X. Aquifer protection during longwall mining of shallow coal seams: A case study in the Shendong Coalfield of China. Int. J. Coal Geol. 2011, 86, 190–196. [Google Scholar] [CrossRef]
  17. Huang, Q.; He, Y.; Cao, J. Experimental Investigation on Crack Development Characteristics in Shallow Coal Seam Mining in China. Energies 2019, 12, 1302. [Google Scholar] [CrossRef] [Green Version]
  18. Liu, Z.; Fan, Z.; Zhang, Y. Fracture Characteristics of Overlying Bedrock and Clay Aquiclude Subjected to Shallow Coal Seam Mining. Mine Water Environ. 2019, 38, 136–147. [Google Scholar] [CrossRef]
  19. Ju, M.; Li, X.; Yao, Q.; Liu, S.; Liang, S.; Wang, X. Effect of sand grain size on simulated mining-induced overburden failure in physical model tests. Eng. Geol. 2017, 226, 93–106. [Google Scholar] [CrossRef]
  20. Zhang, R.; Ai, T.; Zhou, H.; Ju, Y.; Zhang, Z.T. Fractal and volume characteristics of 3D mining-induced fractures under typical mining layouts. Environ. Earth Sci. 2015, 73, 6069–6080. [Google Scholar] [CrossRef]
  21. Zhao, H.; Ma, F.; Xu, J.; Guo, J. In situ stress field inversion and its application in mining-induced rock mass movement. Int. J. Rock Mech. Min. Sci. 2012, 53, 120–128. [Google Scholar] [CrossRef]
  22. Zhang, J.; Peng, S. Water inrush and environmental impact of shallow seam mining. Environ. Earth Sci. 2005, 48, 1068–1076. [Google Scholar] [CrossRef]
Figure 1. Contour of No. 2−2 coal seam floor and typical geologic profiles in the Daliuta coal mine.
Sustainability 13 13775 g001
Figure 2. Layout of displacement monitoring points in similar model.
Sustainability 13 13775 g002
Figure 3. Pre-mining similar model.
Sustainability 13 13775 g003
Figure 4. Caving process during the No. 2−2 coal seam excavation.
Sustainability 13 13775 g004
Figure 5. Caving process during the No. 5−2 coal seam excavation.
Sustainability 13 13775 g005
Figure 6. Fractures distribution for the mining length of 210 m in the similar model.
Sustainability 13 13775 g006
Figure 7. Fracture rate distribution for the mining length of 210 m in similar model.
Sustainability 13 13775 g007
Figure 8. Contour map of overburden subsidence during the No.5−2 coal seam excavation.
Sustainability 13 13775 g008
Figure 9. Vertical displacement of No. 22 coal overburden during the No. 5−2 coal seam excavation.
Sustainability 13 13775 g009
Figure 10. Numerical model by FLAC 3D.
Sustainability 13 13775 g010
Figure 11. Overburden failure during the mining of No. 2−2 coal.
Sustainability 13 13775 g011
Figure 12. Overburden failure during the mining of No. 5−2 coal.
Sustainability 13 13775 g012
Figure 13. Plane layout of working face and DS2 detecting borehole.
Sustainability 13 13775 g013
Figure 14. Borehole imaging in the depth of 162.5–163.2 m.
Sustainability 13 13775 g014
Figure 15. Fracture characteristics of cores in the hole depth of 135–166 m.
Sustainability 13 13775 g015
Figure 16. Observation results of DS2 drilling flushing fluid leakage.
Sustainability 13 13775 g016
Figure 17. Fracture characteristics of cores in the hole depth of 30–65 m.
Sustainability 13 13775 g017
Figure 18. Ground fractures induced by mining.
Sustainability 13 13775 g018
Table 1. Basic geological parameters of primary minable coal seams in the Daliuta coal mine.
Coal SeamBurial Depth (m)Coal Seam Thickness (m)TypeMining Method
No. 2−2 coal30.6–133.30.66–7.07, 4.22 (the average)Shallow buriedLongwall mining
No. 5−2 coal112.9–2891.35–7.75, 5.6 (the average)Near shallow buriedLongwall mining
Table 2. Division of engineering geological rock group in the Daliuta coal mine.
Rock Stratum GroupCompositionUniaxial Compressive Strength (Mpa)Rock TypeRQD (%)Structure
Mudstone groupMudstone, sandy mudstone12.1–37.7Weak44–57Layered structure
Siltstone groupSiltstone13.3–67.2Medium hard55–75Layered structure
Sandstone groupFine sandstone, medium sandstone, and coarse sandstone14.6–67.8Medium hard64–81Blocky structure
Table 3. Parameters and material ratio of similar model.
LithologyPrototypeModelMaterial Ratio (Sand, Lime, Gypsum)
Thickness
(m)
Bulk Density/
(kN.m−3)
Compressive Strength (MPa)Thickness
(cm)
Bulk Density/
(kN.m−3)
Compressive Strength (KPa)
Weathered rock6125.048227:6:4
Claystone301815.32012688:7:3
Fine sandstone7.52836.5518.61627:5:5
Mudstone424.315.32.716.2688:7:3
Siltstone1124.126.57.416.11187:6:4
Fine sandstone72836.54.718.61627:5:5
Siltstone524.126.53.416.11187:6:4
No. 2−2 coal4.213152.88.7678:7:3
Siltstone724.126.54.616.11187:6:4
Fine sandstone32836.5218.61627:5:5
Siltstone2824.126.518.716.11187:6:4
Mudstone724.315.34.716.2688:7:3
Fine sandstone212836.51418.61627:5:5
Siltstone624.126.5416.11187:6:4
Medium sandstone1125.2377.416.81647:5:5
Siltstone1324.126.58.716.11187:6:4
Medium sandstone625.237416.81647:5:5
Siltstone1824.1251216.11117:6:4
Fine sandstone302836.52018.61627:5:5
Siltstone324.126.5216.11187:6:4
No. 5−2 coal6.613184.48.7808:6:4
Fine sandstone122836.5818.61627:5:5
Table 4. Physico-mechanical parameters of coal and rocks in numerical simulation.
LithologyBulk Density
(KN·m−3)
Bulk Modulus
(GPa)
Shear Modulus
(GPa)
Cohesion
(MPa)
Poisson’s RatioInternal Friction Angle (°)Tensile Strength
(MPa)
Weathered rock1221.61.02.9320.4
Claystone1831.81.50.28380.5
Siltstone24.111.07.34.00.23371.8
Fine sandstone2813.410.57.00.20383.0
Medium sandstone25.211.58.33.70.22352.2
Mudstone208.74.72.60.25301.5
No. 2−2 coal131.40.61.50.28321.0
No. 5−2 coal132.81.21.60.26331.0
Table 5. Comparative analysis of overburden failure height.
MethodCaving Zone (m)Fractured Zone (m)Water-Conducting Fractured Zone (m)Fracture-Mining Ratio
Similar simulation22.5130.515323.2
Numerical simulation21.6131.415323.2
Field observation19.8117.5137.320.8
Maximum relative error12%10.6%10.3%10.3%
Publisher’s Note: MDPI stays neutral with regard to jurisdictional claims in published maps and institutional affiliations.

