1. Introduction
People have lived in cities since 3700 BC till now and this has been explained by urban economists with the benefits of locations that concentrate people and lead to efficiency gains for production and trade. Yet, the current pandemic of COVID-19 transformed human clustering into a life-threatening cost. Therefore, quite rightfully, a heated debate has been spurred on the future of cities, since any cost–benefit analysis, which has loss of life on the cost side, is exclusively sensitive for decision-making. To genuinely understand the future of cities, however, one has to fully understand the role of the city in the utility function of the citizen on an individual and aggregate level. The current paper explores the role of location in the utility function behind the cost–benefit analysis of a person, resident of a place. The psychic and evolutionary aspects of the value of living in a city are put under scrutiny from the micro and regional economic perspectives.
Our Culture-Based Development take is that cities are not only economically efficient and attractive, but psychologically and socially attractive to cities as venues for high-quality social interaction. This includes the presence of attractive physical (economic endowment), but also natural (green areas) and intellectual (artistic) environments. Our study aims to identify the exact micro mechanism through which the natural (ecological) and intellectual (artistic) components of the utility function interlink and affect the utility that the citizen derives from living in a city.
As an extension of this exploration, we then propose to consider the relationship between the utility of the resident derived from living in the city and the citizen’s propensity to political proactiveness. Our key assumption here is along the Tiebout “voting with their feet” model, which originally states that people chose migration destinations based on their management of the public resource and the milieu created in the place. We raise a question here from a novel Tieboutian perspective—what is the role of the local provision of green areas and artistic milieu for the people who stay, those who are incumbent and vote in the political elections of the place?
Once the micro mechanism linking the provision of green and artistic milieu and voting is identified, we explore its regional economic implications in an empirical manner. To do so, we propose that a trade-off between natural resources and human-built endowments drives the cost–benefit analysis of a citizen from an evolutionary strategy perspective and determines their socio-economic behaviour on daily basis. We expect that when both resources are limited, the trade-off is staggered and a dissatisfaction with the milieu occurs, which triggers political proactiveness.
The above reasoning has deep roots in the urban economic literature. That cities’ advantages are part of the utility function of the individual is well known in general. From Max Weber’s [
1] seminal book “The City”, through migration models [
2,
3,
4,
5,
6,
7,
8] to core spatial friction models regarding the reallocation in space of human capital as the endogenous factor for growth [
9], regional and urban economics have established the understanding that the endowment of a city plays a role in peoples’ choice of location in space. These have all agreed on a cost–benefit setting of this utility function of the citizen. Yet, the presence of the city in the utility function of people was largely assumed from a physical (economic) endowment point of view and was not sufficiently explored with regard to finding all components that drive the hedonic model of life satisfaction in the city.
The qualitative details entering into the costs and benefits of location choice have therefore been rather over-generalised and less systematically analysed and synthesised regarding their quantitative implications. We shall group these omitted details here in three subsets: (i) public and private investment-related endowments [
9,
10,
11]; (ii) natural endowments [
12,
13], and (iii) cultural endowments [
6,
7,
14]. To our best knowledge, it has not been synthesised so far what are the trade-offs between these three types of local endowments in the utility function. Additionally, what is even more important, the only decision that has been modelled in the literature is the “voting with your feet” decision, which is related with self-selection for migration based on the cost–benefit analysis for location [
15,
16,
17]. What happens with the utility function of the majority of the population who stays in a place (either as incumbent or immigrant) has been left out of focus from the regional economic analysis.
The current paper adds to the regional literature by putting forward the hypothesis that those who stay in a locality respond to the endowments’ cost–benefit analysis and the corresponding changes in their utility function through their political voting behaviour. Put differently, we suggest that citizens are concerned with what we call the “geographies of flowers” (related to natural endowments and green areas) and the “geographies of flower power” (related to cultural endowments). The trade-off between the two allows people to keep their equilibrium with regard to staying in a city, since the city provides them with the environment for living and they deliver in exchange their human resource to its labour market. We suggest that this equilibrium is expressed in people remaining to live as incumbents in this city. However, when the cost–benefit analysis of the citizen cannot be satisfied by trading off green areas for artistic milieu, because both endowments are undersupplied, then the dissatisfaction of the citizens escalates to a tipping point and an out-migration choice is likely to occur. We propose to consider that, realistically before leaving, a person is likely to attempt changing the local environment for the better by political proactiveness expressed in voting or political activism. Our empirical explorations demonstrate that indeed people’s satisfaction with life in the locality relates to their political proactiveness and it is also clearly associated with the aggregate provision of art amenities and the state of the local ecological endowment.
To test our hypothesis, we use data from the World Value Survey, the European Commission’s Joint Research Centre (JRC) Cultural and Creative Cities Monitor [
18,
19] the JRC LUISA Reference Scenario 2016. The WVS contains individual-level data with information for the urban/rural type of location that a person lives in, their level of happiness, their level of political activity, and the level of their concern with natural and human-investment-dependent local endowments. We analyse the importance of the endowments for the socio-economic behaviour of the resident applying the Culture Based Development (CBD) Value Free Analysis of Values empirical approach (see [
20,
21,
22]). We find clear evidence for the role of local natural endowments (geographies of flowers) and their trade-off with human-built cultural endowments on the one hand and the political activism in the behaviour of the individual on the other hand. The European Commission’s JRC provides important data about the cultural and art amenities and the ecological endowment, as well as the life satisfaction of people in European cities. Thus, it allows us to match the impact of the identified subjective micro mechanism with the objective observed endowments and self-reported satisfaction of citizens across the European Union territories with the quality of governance by their local institutions.
The structure of this paper is as follows. The next section outlines the evolutionary roots of the role of location in the utility function of the resident. Next, we focus on the trade-offs between natural and human-built endowments. The following section of the paper states the Culture-Based Development (CBD) model, which operationalises a micro mechanism for the link between the geographies of flowers and the geographies of flower power and voting behaviour. Next, we dedicate a section to presenting our data, estimation strategy, and results. A section of discussion follows, which offers a reflection on the meaning of the individual mechanism from the light of the offered empirical evidence for its impact on an aggregate level. The final section concludes with a synthesis of the main value added from our research.
2. Why People Live in Cities: A Micro-Evolutionary Perspective
The current debate [
23] about the future of cities in the post-pandemic reality has been mostly based on theoretical predictions and essentially raises a question that only the future shall reveal the answer to. The old reasons for the existence of cities enjoy, clearly, a long history of analysis and theocratisation [
24]. None of this literature, however, has looked empirically at the personal hedonic motivation of people to stay in cities and what they valued about them. There has always been the general assumption that the motivation factor for moving to a city was wages. The costs side has been largely under-investigated, being assumed as to narrow down only to obvious practical costs for the move, and the migration choice has been mostly thought of from the prism of self-selection for a better life than a cost–benefit analysis of urban versus rural living. What is striking, however, is that in reality the rural–urban living cost–benefit choice is precisely the type of choice that every rural–urban migrant has to make and the level of attractiveness of rural and urban living has psychic aspects beyond wages that need to be factored in. This has been partially acknowledged by the literature on the cultural cost of migration [
4]. Yet, a more precise cost–benefit analysis over location attractiveness is clearly a likely part of the decision-making process of every immigrant but has not been studied in detail. We argue here that this gap can be filled in adopting an evolutionary economic perspective.
Evolutionary thinking has been used for explaining the growth and life of cities for a long time. However, most of this evolutionary analysis has looked at the evolution of systems [
25,
26,
27,
28,
29,
30,
31]. This aggregate evolutionary perspective is valid, but it omits to pay sufficient attention to the main mechanism that drives the behaviour of the individuals who build up the system and whose values create the rules for operation of the system.
It is migration literature that has looked more closely at the individual motivation in the choice over locations. However, this literature has remained focused on examining the utility function of the movers. Clearly, while migration is a very important process, most of the people do not move most of their life, which is the precise reason for which locations and cities exist. Very little has been done to pay attention and to analyse the utility function of the individuals with regard to the city environment and staying in it. This literature has been either related to house pricing [
32,
33] or to hedonic valuation and general life satisfaction research [
34], none of which has modelled strongly enough the reasons why people value what they value in the city.
We propose a micro mechanism rooted in cultural and social behaviour theory and related to the psychology of uncertainty, exhibited by all herd mammals. Namely, according to Hall [
35], mammals live in big herds in order to decrease the fear of uncertainty. When there is threat, the alert of the other animals is a guarantee to give a signal for the threat. Similarly, the potential to signal threat and to learn optimal survival behaviour is a value added from living in human groups (such as cities) (see [
36]). This take is very much in line with Glaeser’s [
11] learning city hypothesis which suggests that people like to live in places where they can learn from other people. However, what then attracts more talented people or the so called “creative class”? Florida suggests this is the tolerant milieu and the presence of human-investment-based endowment such as the cultural industry (Bohemians) concentrated in the city [
6,
7,
37,
38]. He pays considerably less attention to the green environment in the city in his conceptualisation of the creative class. Additionally, above all, none of these concepts has been tested with individual-level data that can confirm which are the genuine components of the utility function and the motivation even for the movers, let alone the utility of the incumbents who stay in the location. Yet, it is a valid evolutionary and cultural theory perspective to examine the utility that both migrants and incumbent individuals derive from the existence of the context. In addition, this is the micro-evolutionary take that we recommend economics to adopt in order to elucidate the way location features in the utility function of the resident.
3. Geographies of Flowers and Geographies of Flower Power
The current study coins the terms “geographies of flowers” and “geographies of flower power”. These terms however have a deep conceptual motivation that links to a considerable amount of literature. The latter are briefly outlined in order to motivate the use of these terms in our research.
Geographies of flowers refers to the urban literature that has been developing along the idea of the green city [
39,
40] and the garden city [
13]. In line with this, the work on the ecological Kuznets curve has also elicited the important relationship of local ecology with regional economic development (see [
41,
42]). It has been established to think that there are places that are more richly endowed with green areas and that this is a conceptually important endowment for local economic development. The focus on flowers is metaphorically preferred here to achieve correspondence with the more established phraseology of “flower power”.
“Flower power” is a term used by the San Francisco Chronicle, 8 June 1969 (see Newsweek (9 June 1969)). “Flower power” is a metaphor that was popular in relation to the hippie movement (see [
43,
44]). As the hippies, referred to as “flower-children”, were a strongly culturally and artistically active group (see [
45]), it is assumed here that the clustering of culturally and artistically active individuals is relevant to be labelled as a geography endowed with “flower power”.
Once we have established this terminology of “geographies of flowers” and “geographies of flower power”, inspired by the green garden city literature and the 1960s’ hippies’ movement, we can analyse their spread in space, and we can assume that these geographies may coincide. Does the urban and regional literature know anything about their spread? We find that there are sufficient, though disconnected literatures on both phenomena.
Geographies of flowers (green spaces) and their substitute endowments in the urban environment (represented by built environment and other human-investment-dependent endowments such as arts and culture amenities (Bohemians)) have been indeed extensively studied as geographies on an aggregate level. Sir Ebenezer Howard [
13] and others have developed not only theoretical but also practical urban planning guidance related to the green city—with a concept of a garden city where green spaces are central for the development of the urban space [
13,
39,
46]. Another aggregate level famous concept is the environmental Kuznets curve. Proposed by Grosseman and Krueger [
41,
47], this idea suggests that places first compromise the natural endowment of the city in trade-off with local economic growth, but from one satiation point onwards, there is a tip off point of this tendency and the more affluent the place, the less it allows for destruction of the natural environment [
48,
49,
50,
51,
52,
53,
54]. This can be partially explained by the fact that economic activity and natural endowment are rivals for the same limited amount of land in a locality, although urban sprawl might be relaxing this trade-off of land use. The natural endowment is on an evolutionary individual level the habitat for survival and mating that every individual chooses. Thus, it is natural to assume that giving part of one’s habitat for economic activity is an evolutionary sacrifice that is undertaken when the human-made endowment will be offering a pay-off that will exceed the loss of natural endowment. This take, to our knowledge, is a little explored avenue in economic analysis.
Geographies of flower power, or the creative class, have been extensively studied but with regard to innovation and growth [
6,
7,
55,
56,
57]. The geographies of discontent have also been studied, mostly on an aggregate level but not in relation to any of the natural or artistic endowments. On a macro level [
58,
59], it has been demonstrated that people seem to care for fiscal policy more than for a monetary one. This seems to suggest that the role of public space in the utility function of the individuals may stretch beyond the wage. This study of geographies of discontent has also been clearly related to voting for ultra-right parties or for extreme protest vote ideas such as Brexit [
60,
61]. Rigorous analysis has revealed that places left behind are coinciding with the geographies of discontent [
62]. All this analysis, however, models only the final outcome of the geographies of discontent even when using individual data [
63]. The reason for this is of course the data limitation when voting behaviour is concerned, as data on the latter are rarely obtained on an individual level. Game theory also devotes profound attention on voting but mostly theoretical rather than empirical, and the empirical bit, when present, focuses more on the aggregate level. Thus, the actual micro mechanism for voting in a particular way remains largely empirically underexplored with real (as opposed to lab) data with regard to the utility from the location and its endowment, especially with green natural endowment. The exception to this rule are wellbeing studies and house pricing hedonic valuation studies that do reflect on the role of green places in the human utility function. Yet, they are also partial because they do not extend their analysis to political behaviour and discontent, which is the only way to fully encompass the satisfaction and dissatisfaction, benefit and cost trade-off that happens in the decision-making process of the resident of a place.
4. The Micro Mechanism Linking the Geographies of Flowers and the Geographies of Flower Power with Political Behaviour
We shall start here from the usual formulation of the utility of the mover, used by Rossi-Hansberg and Wright [
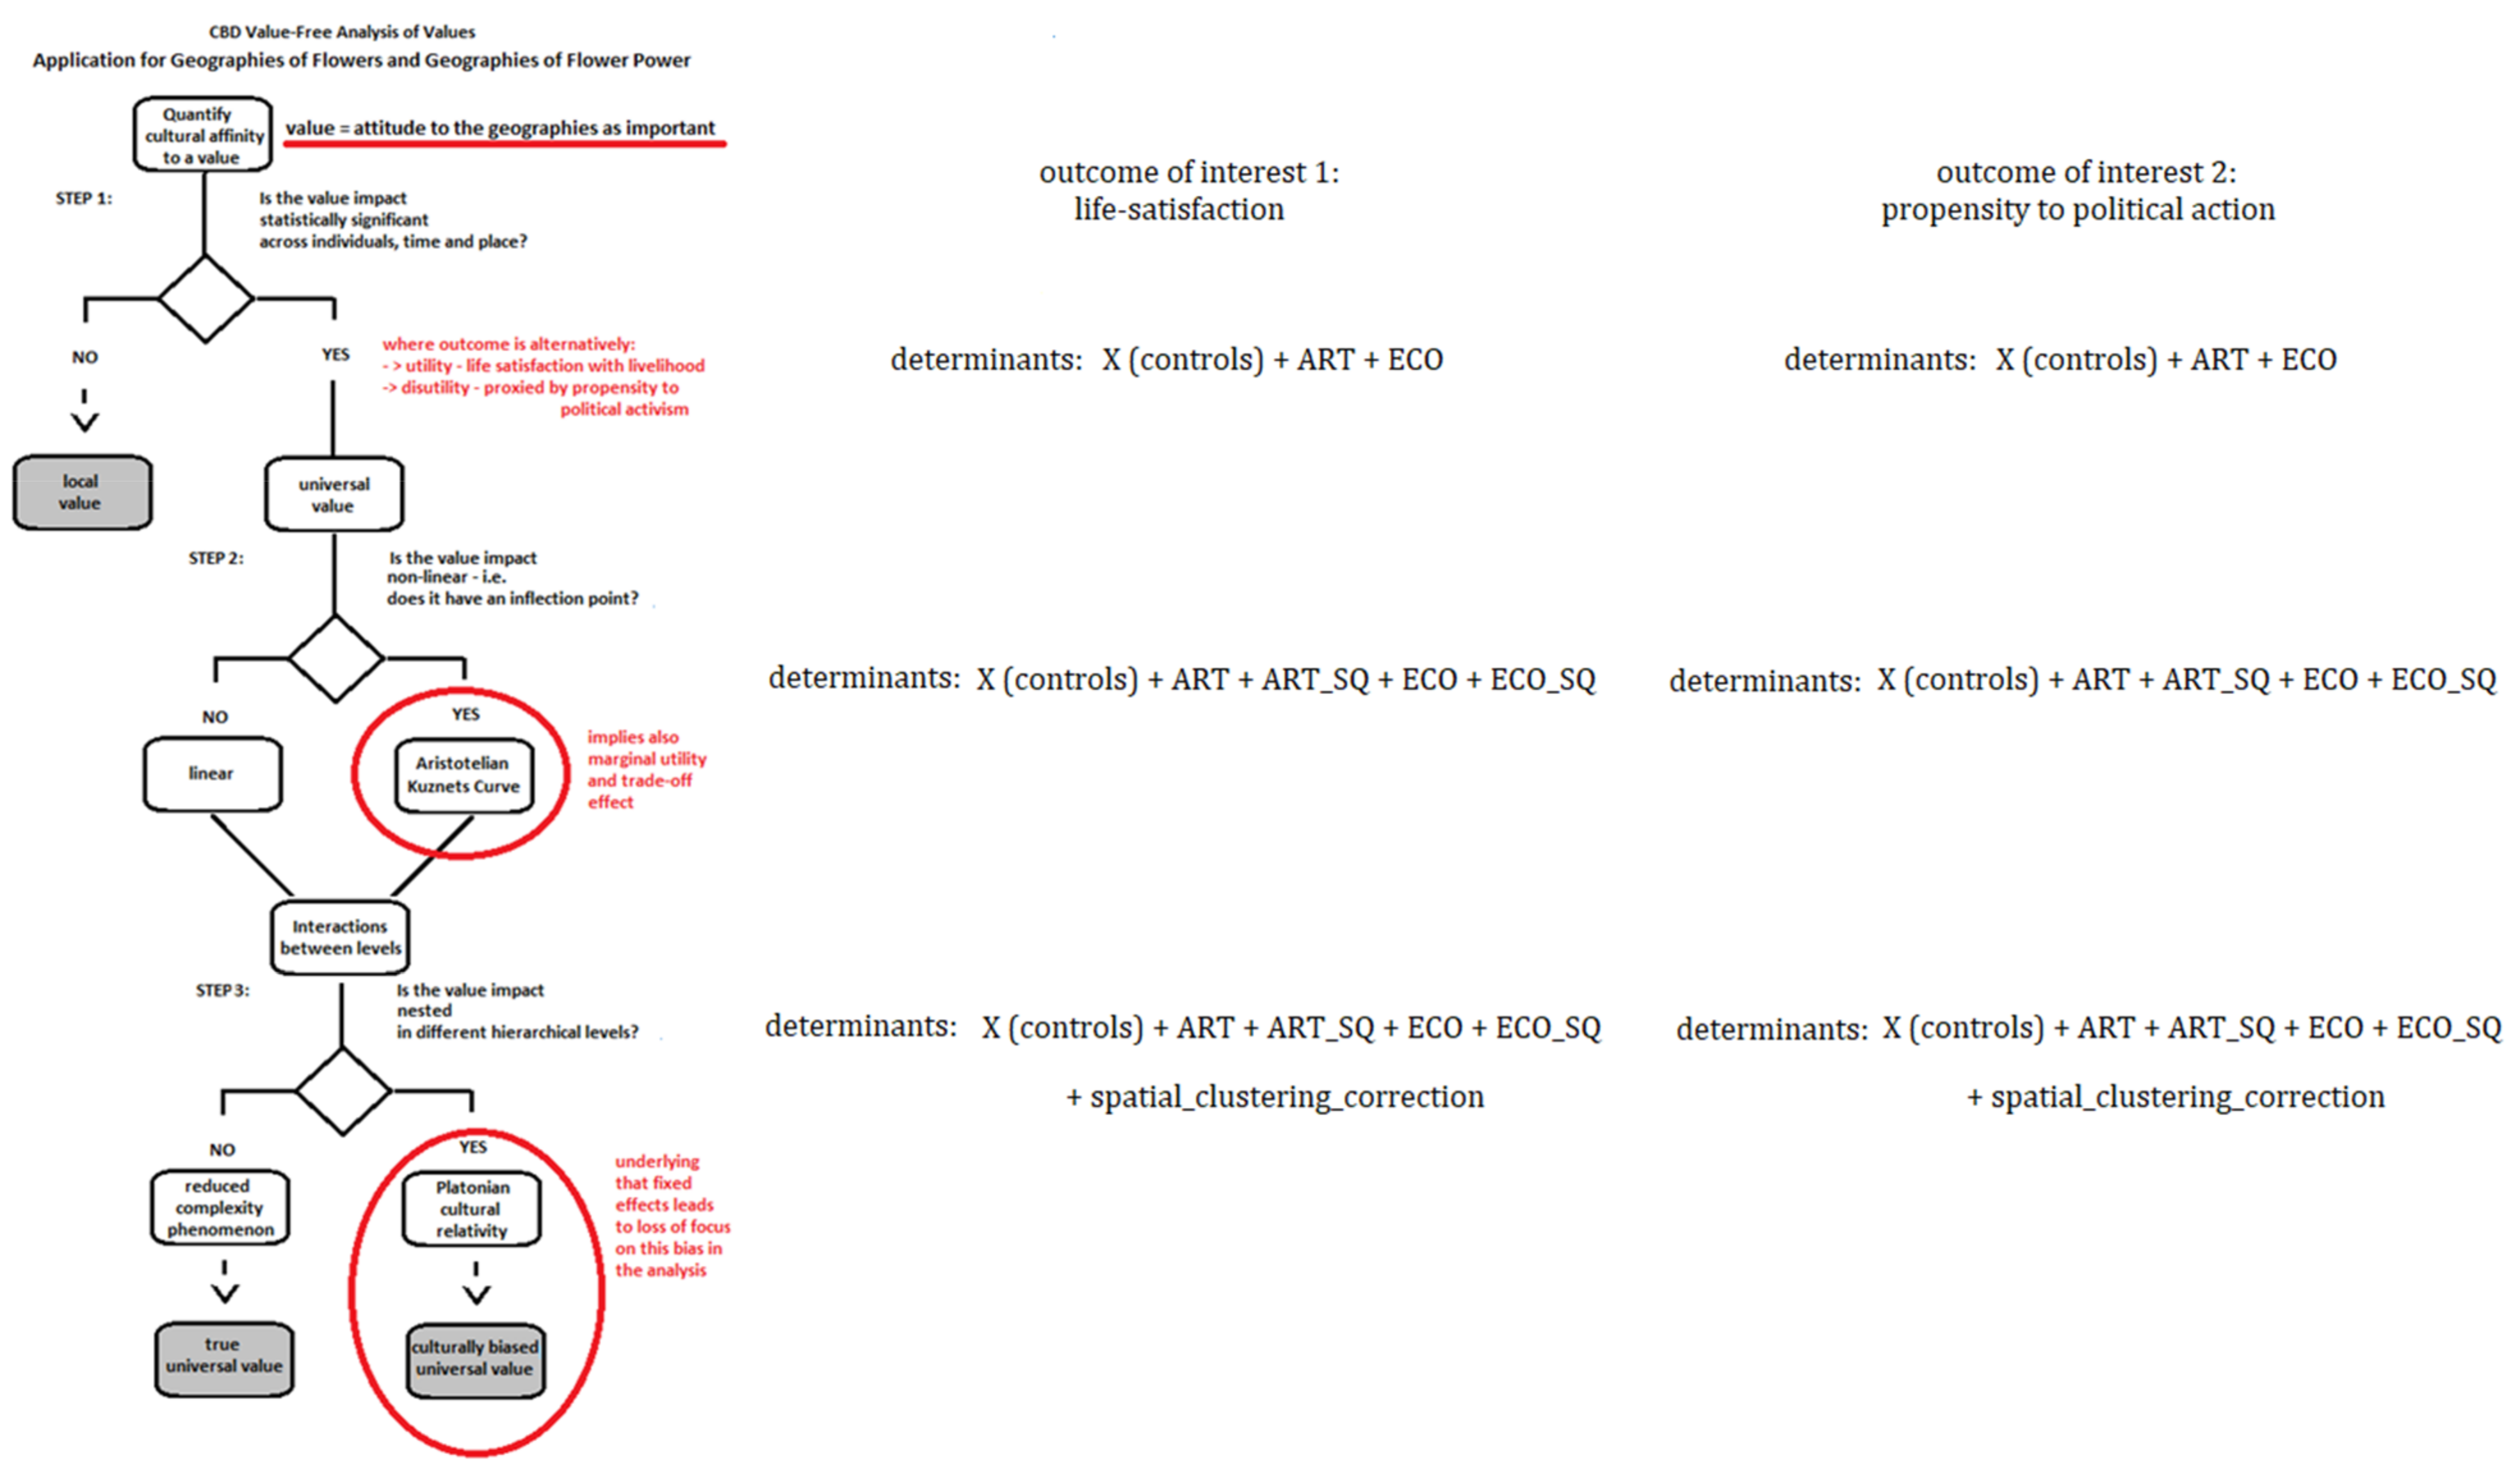
9], which suggests that the utility derived from a region by a mover is a function of the appeal of amenities, leading to the relocation between regions. This model can be simplified in order to express the utility redefined for only one location and to augment and expand some terms so that the mechanism for their operation becomes more evident and precisely captured by the model. Namely, we would like to open up here the location preference term and transform it into an outcome of interest which is explained as a function of the trade-off between the natural and human-made endowment of the location. When the individual is satisfied with the trade-offs between the natural and human-made endowments in a region, the person experiences satisfaction with life in the location, and therefore the location preference is positive. When the person experiences disutility from the trade-off between natural and human-made endowments in the region, an inflection point occurs, and the function of the location preference decreases. This impact from the endowment of a region on the utility and disutility of living in a place can be precisely and accurately studied by following the Value Free Analysis of Values Culture Based Development (CBD) approach.
The Value Free Analysis of Values is an analytical approach proposed by Tubadji [
22]. This is a CBD analytical approach, motivated by the paradigmatic understanding that any outcome can be an object for maximisation in human behaviour, and then the impact of attitudes towards the importance of this maximisation has to be studied in a value-free, i.e., objective manner. This can be achieved by following three analytical steps: (i) examining whether the cultural affinity impacts the level of the outcome (cultural affinity is the level of emotional attachment (i.e., affinity) towards a particular attitude (i.e., what level of importance this attitude has in the value system of people); this level is culturally calibrated in different localities (as one and the same attitude has a different level of importance in different cultures across space); it also contains a unique personally varying component as part of its formation for every individual. See Tubadji [
22] for more details); (ii) examining whether there are inflection points in the level of impact from increasing affinity to the cultural attitude regarding the outcome (an analysis called Aristotelian Kuznets curve, aimed at establishing whether there is ‘too much good’ of the perception of a certain attitude as being good for the outcome (the idea of too much of a good thing belongs to Aristotle’s golden mean theory and has a line of literature in economic research. See Tubadji [
22] for more details); for example—whether valuing the presence of green areas is always increasing one’s utility from an area or whether after some degree of affinity to green, a person’s utility from green starts to have a decreasing path; the marginal utility concept is indeed very much in agreement with the latter); (iii) exploring the spatial relativity of the cultural attitude effect (an approach called Platonian bias analysis). The above-described reasoning can be summarised in a decision tree diagram, as presented in
Figure 1 below.
The procedure described in
Figure 1 suggests that diminishing opportunities for substitution between the two endowments—natural (green) and human-made (artistic milieu)—can be studied in a value-free manner, avoiding determinism, with regard to how happy/satisfied or how unhappy/discontented and therefore prone to political action an individual feels in a locality. Clearly, this reasoning is in line with the geographies of discontent literature [
61,
62], which assumes that dissatisfaction is associated with more radical political behaviour driven by the more acute need for change when people are discontented with their reality. Put differently, instead of assuming that these geographies matter for the citizens, we will estimate a hedonic model, where we will have life satisfaction and propensity to political activity as alternative outcomes and we will explain these outcomes with the same set of determinants. This will crosscheck whether these two utility functions are determined by a common set of determinants—i.e., whether they have an overall as functions. Then, we will explore empirically whether geographies of flowers and geographies of flower power are among the determinants of these two functions. We will use the CBD Value Free Analysis of Values to check for nonlinearities (presence of Aristotelian Kuznets curve) and spatial clustering (Platonian bias) in the impact from the geographies of flowers and geographies of flower power on the two outcomes of interest—life satisfaction and propensity to political activity.
Figure 1 outlines the CBD Value Free Analysis of Values procedure briefly and a detailed explanation of it follows in our method section below.
5. Empirical Analysis
5.1. Data
This empirical analysis used two datasets—one on self-reported data on a micro level and one with observed data on political behaviour and endowment on an aggregate level. These are, respectively, the World Value Survey (WVS) and the Cultural and Creative Cities Monitor.
From the WVS, we used the latest Wave 7 of the international survey. We used these data because they offer information reflecting the closest period to the pandemic. There is information about 7 European countries in this wave (Andorra, Cyprus, Germany, Greece, Romania, Serbia, Ukraine). We used only these for reasons of avoiding unwanted heterogeneity across bigger geo-political groupings of countries, which would create unsurmountable biases in the data in the absence of additional geo-political indicators.
The WVS dataset is rich in information about attitudes, preferences, and dispositions. Specifically, our main alternative dependent variables were—self-reported level of happiness and a variable about level of activism in political participation (which we used as a proxy for level of disrupted state of happiness with the local environment and desire to actively engage with policy and change). The happiness variable was self-reported level of life satisfaction measured on a Likert scale from 1 to 10. The unhappiness proxy—activism in political organisation—was measured on a scale from 0 to 2, where 0 corresponds to no engagement, 1 is being an inactive member, and 2 is being an active member. We used both variables in levels in order to be able to compare the coefficients between specifications somewhat more consistently.
Our main explanatory variables relate to the attitudes on a micro level that characterise the geographies of flowers and the geographies of flower power. The geographies of flowers attitude was approximated with a variable labelled “active_eco” and the geographies of flower power was approximated through a variable labelled “active_art”. Both variables vary from 0 to 2 and correspond to a question whether the respondent of the WVS is a member of an organisation with activity in ecology (WVS Question 99) or in arts (WVS Question 98) (with answers: member, not an active member, not a member). We used these variables in levels as we wished to explore the nonlinearity of the effect by introducing the square of the level of the explanatory variable, as per the CBD Value Free Analysis of Value approach.
In addition, we have a list of variables, relevant for the Mincer equation (1958), that are usually used to explain wage inequalities, which we assume play an important part in explaining the hedonic model for a resident, from a wage perspective. It is assumed to be so, based on the migration utility function in the spatial friction models and all gravity migration models that explain people’s choice of a locality in relation to the economic pay-off in terms of wages. These control variables include age, gender, marital status, number of children, level of education, full time employment, rural versus urban type of residence, and migrant status as opposed to being born and incumbent in the area of living. For a summary of the descriptive statistics for all variables used in our analysis see
Appendix A Table A1 and
Table A2.
On an aggregate level (city and NUTS 2 level), we used data on cultural endowment from the Cultural and Creative Cities Monitor (CCCM) of the European Commission’s Joint Research Centre, as well as additional data on natural endowment and pollution coming from JRC LUISA Reference Scenario 2016. The CCCM dataset includes 29 culture indicators for 190 European cities (EU-27 plus UK, Norway, and Switzerland), which are then aggregated at different levels to measure different aspects of a city’s cultural and creative vitality. We used the individual indicators about types of cultural participation from this database to inform our analysis. The LUISA (Land Use-based Integrated Sustainability Assessment) modelling platform produces various types of datasets including, among others, thematic indicators on European cities’ green endowment and pollution levels. From it, we used the data related to green spaces and NO2 emissions.
Our main outcome of interest was the self-reported satisfaction with the quality of regional (NUTS 2) government in the place of living [
64].
The use of both micro- and aggregated-level data allows us to compare the objective and subjective importance of geographies of flowers and geographies of flower power on the utility from the place of living and the relationship with voting behaviour approximated through the variable ‘satisfaction with the local government’, assuming that the latter satisfaction is a major motivation for political voting. It also allows us to observe the relationship between our suggested micro mechanism and its impact on the regional system. We expect, in line with Thomas Schelling [
65,
66] (1969, 1978), that the effect on the aggregate level will be even stronger than on the individual level.
5.2. Method
The estimation strategy of our study regarding the hypothesised micro level mechanism implements the CBD Vale Free Analysis of Values approach (see [
22]). From an empirical standpoint, this approach has the following analytical protocol: (i) establishing the presence of a statistically significant effect of the attitude of interest on the outcome of interest; (ii) exploring the effect for nonlinearities (a procedure termed an Aristotelian Kuznets curve test); and (iii) exploring the clustering bias due to the hierarchical structure of the data related to cultural and geographical grouping (a procedure termed the Platonian bias test).
Following the above protocol depicted in
Figure 1, we applied these three steps for testing our above stated CBD model through the following empirical strategy on a micro (individual) level, using the WVS data.
Step 1 entails, specifically, the test of the CBD model of resident utility, using alternatively life satisfaction (i.e., positive utility) or propensity to political activism (i.e., being a member in a political organisation). We shall explain these outcomes with the level of activism in relation to ecological topics (i.e., geographies of flowers-related attitude) and activism in relation to art organisations (geographies of flower power-related attitude), accompanied with the Mincer equation variables as a set of controls.
Step 2 entails augmenting the specifications from Step 1 with the square of the variables related to attitudes to geographies of flowers and attitudes to the geographies of flower power.
Step 3 entails estimating the basic specification using a hierarchical model that can account properly for the geographical and cultural clustering in the data. Namely, a multi-level model, where country level clustering is accounted for will be estimated.
In all three steps, we estimated 10 specifications in total: 5 with the dependent variable of life satisfaction and 5 with the dependent variable of dissatisfaction (activism in political activism). Each set of 5 specifications contains estimations using: (i) the full dataset; (ii) only the urban residents; (iii) only the rural residents; (iv) only immigrants; and (v) only the incumbent (non-mover) population.
As robustness checks on the micro level, we implemented the following. We transformed the outcome variables into dummy variables and compared the marginal effects from probit models re-estimated with the same set of explanatory variables as specified above. We also re-estimated the models, transforming the main explanatory variables into dummy variables.
Ultimately, using the data from the Cultural and Creative Cities Monitor, we estimated the relationship between geographies of flowers and geographies of flower power (i.e., the spatial clustering of people with such preferences) and citizens’ political behaviour on an aggregate level. To do so, we used a multiple regression analysis where we explain local propensity to active political behaviour with the geographies of power and geographies of flower power. We used as the dependent variable the local level of satisfaction with the quality of the institutions in the place of living (which we assumed is an alternative proxy to the propensity to have an active political behaviour, such as voting inspired to change the institutions if they are not satisfactory). We explain this satisfaction firstly by the factors of local productivity (labour, human capital, human capital, and the accessibility through transport as an approximation for the physical capital available in the locality). Additionally, we used as explanatory variables: (i) the local presence of ecological endowments (alternatively approximated through green areas per square km per head and NO2 pollution per capita), and (ii) cultural/artistic amenities (alternatively approximated through cultural venues and cultural participant percentages). We used OLS with robust standard errors to estimate the relationship of each main explanatory variable as an addition to the growth model determinants for the performance of institutions. We addressed also the Kuznets curve by introducing a square term of the NO2 emissions to check the association of degree of pollution with satisfaction with the institutions. Next, we compared the cultural and ecological amenities into a horse-race specification, which allows us to examine which of the two geographies—of flowers or of flower power—dominates on an aggregate level. Finally, we attempted to capture the trade-off between the two components on an aggregate level through introducing an interaction term between the two types of geographies of interest.
Essentially, the strength of our analysis is that, methodologically, we first applied CBD Value Free Analysis of Values on a micro level using one set of proxies for propensity to political behaviour and geographies of flowers and flower power coming from the WVS, and then we triangulated as a robustness check our findings on an aggregate level. For the aggregate level, we used an alternative set of proxies both for propensity to political activity and for the geographies of flower and geographies of flower power based mostly on the Cultural and Creative Cities Monitor. If these diverse approximations report similar findings, this will mean that independent of the proxies and level of analysis employed, the economic meaning of our results remain consistent across the various estimations.
5.3. Results
5.3.1. Descriptive Statistics of Main Variables
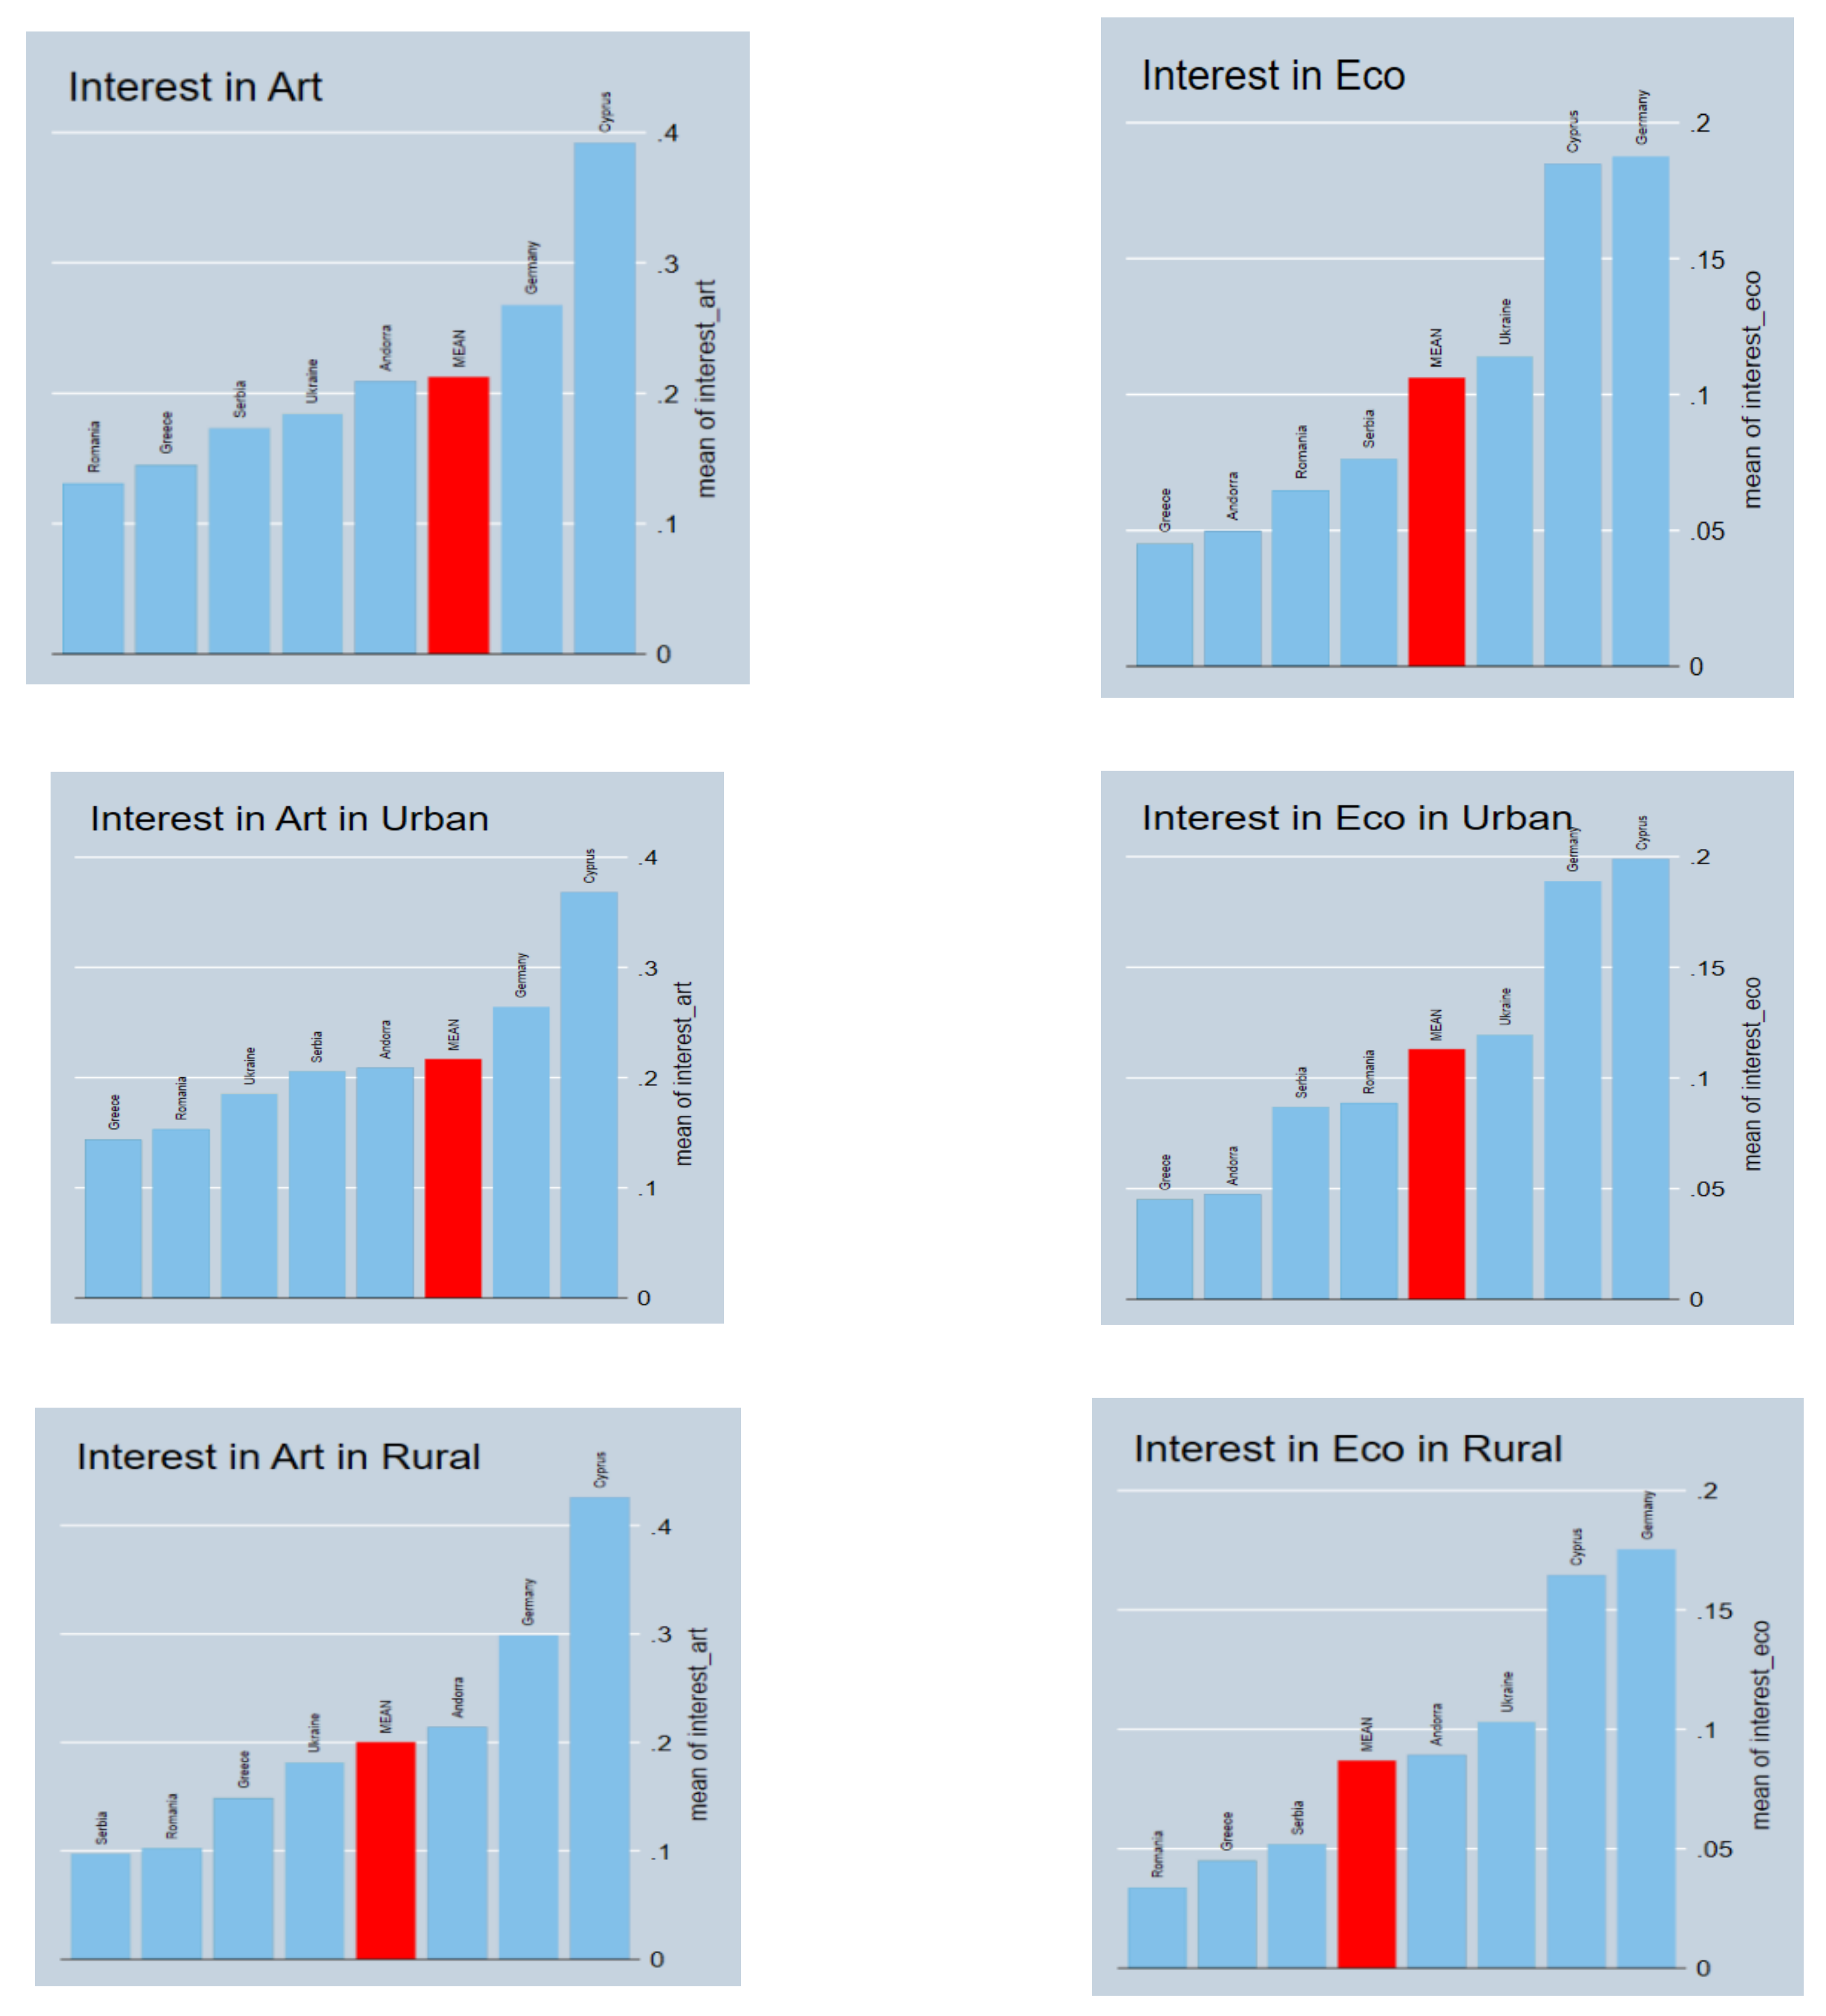
Figure 2 helps us to appreciate the level of cultural valuation and sentiment that the geographies of flowers and geographies of flower power enjoy across the seven countries that are available in our dataset. Both measures of activism in art and activism in ecological organisations are on the same scale, and thus the mean values of them can be compared. This is especially true as the population in every country is around 1000 respondents, so we can safely compare the means between the countries. The only exception in this case is Germany, which has about 1500 respondents in the WVS. This comes to say that the mean for Germany will be eventually understating the level of affect in the country in comparison to the other countries in the dataset. (Affect is a main term coming from the psychological realm, referring to the strength of sentiment independent of whether the sentiment associates with a positive or negative feeling. Put differently, the degree of affect corresponds to the strength of the feeling (see [
67,
68]).
As seen from
Figure 2, we are safe to make three important observations. First, while the number of people and level of the variables is one and the same, it appears that the mean of supporters of art activities is twice as high as the mean for supporters of ecological activity. This means clearly that the geographies of flower power are way more powerful in terms of democratic support than the geographies of flowers. Put differently, individuals seem to be twice as more concerned with the human-made endowments in terms of investment in art than with the natural environment in the places where they live. Second, when we compare the level of affect behind the geographies of flower power and the geographies of flowers between rural and urban areas, we notice an important difference between the two types of places. On average, both types of geographies are more prominently important in the urban areas than in the rural ones. Yet, the geographies of art again confirm the enjoyment of the higher overall mean both in urban and in rural areas in comparison to the ecological sentiment. Third, when we look separately at the preferences of migrants as opposed to the non-movers (incumbent) population, we see as expected again very pronounced differences: migrants seem to have less prominent activism (i.e., participation) in organisations of either art or ecological activities, while incumbents are much more engaged with these types of issues. This is clearly in support of our expectation that these endowments matter even more for those who stay than for those who move (since the latter have obviously chosen to be where they are, they are also less like to feel having reasons to protest or strive to change the place through activist engagement). As the CBD Value Free Analysis of Values advises us, we have to have caution in these findings representing the world as it is, not the world as it necessarily has to be. Put differently, the fact that we see a twice lower level of activism in ecological endowment is simply a reflection of how people think and is not saying that this necessarily indeed is or has to be less important as an endowment. The impact of this level of attitude on socio-economic development is a matter of a separate analysis that is not the aim of this study. Here, we will focus on explaining the utility that individuals subjectively derive from the geographies of flowers and geographies of flower power. This subjective utility is very important because this is the utility upon which action is based. In light of the above results, we will examine not only the full sample, but also specifications separately for urban and rural areas and for migrant and incumbent populations, as these descriptive results confirm our estimation strategy is supported by the behaviour of the data.
5.3.2. Step 1—Geographies of Flowers and Flower Power as Parts of the Utility Function of the Resident
At a first step, we have the utility (approximated with level of life satisfaction) or disutility (approximated with desire to actively participate in changing the urban context through membership in political organisations) that people derive from living in a particular locality. We explain these outcomes with the wage differences that people enjoy in their place of living (i.e., the Mincer equation standard determinants) as well as controls for urban/rural type of residence and migrant/incumbent status of the individual. The results from an OLS with robust standard errors are presented in
Table 1 below.
As seen from
Table 1, the most interesting outcomes are two: art seems to be more important for happiness, but ecological topics are more strongly predictive of disutility, and reactiveness transformed into propensity to political engagement. This partially demonstrates eventual trade-offs between the geographies of flowers and geographies of flower power in the sense that engagement with one type of activity substitutes the other type of activity. (Both elements in this trade-off are of course also dependent to the time constraint for undertaking the activity [
69]. Thus, the length of time necessary for the two types of activities might affect the trade-off beyond the value attached to the type of activity (i.e., art/cultural topic versus ecological topic).) Moreover, art seems significant for urban areas and incumbent populations only, while ecological sensitivity seems significant across the board in all categories in terms of being associated with the need for political engagement of the individual. With regard to the control variables, we find that gender seems to be a main distinguishing factor in the rural areas while not so prominent in urban areas as a determinant of happiness. Meanwhile, utility is determined by the demographic and Mincer type controls, while disutility/protest is not associated with them, and is largely driven by the sentiment about the available cultural amenities. Finally, the R squared seems stronger for the specifications modelling disutility. However, this might be a measurement effect, although the higher variation should be in favour of the life satisfaction-related specifications. Thus, ultimately it may be that indeed our specification is a better fit for explaining propensity to political unrest as expression of discontent with local green amenities than for explaining life satisfaction.
Finally, we conduct here two robustness checks. The first regards the estimation method and the second concerns the coding of the main explanatory variables. Namely, we explore what would be the behaviour of the same specifications for our dependent variable INTEREST POLITICS, if instead of using OLS, we treat this variable not as a continuous one, but as a categorical variable. We thus transform the dependent variable into a dichotomous variable equal to 0 when the person did not have any whatsoever stated interest in politics and 1 otherwise. We then create three dichotomous variables for interest in arts, respectively one for each degree of interest available in the data and similarly for interest in eco-logical topics. We use only the variables which correspond to existence of interest, and use the variables corresponding to utter lack of interest as a basis for comparison.
The results are presented in
Appendix B,
Table A3. As it can be clearly seen from the table, indifferent of the method used, we find identical behaviour of the entire model and of our independent variables of interest in specific. Similar re-estimations are available for all specifications in this section and in the reminder of the paper. The results are always consistent across methods and indifferent of coding of the dependent variables. Essentially, indifferent of method or variable coding, the results remain robustly stable and consistent.
5.3.3. Step 2—Aristotelian Kuznets Curve of the Geographies of Flowers and Flower Power
Following the CBD Value Free Analysis of Values approach, we next address the role of the square term of every value of activism in order to establish eventual nonlinearities in the impact of the level of affinity to this value on the outcome of interest.
As seen from
Table 2, these nonlinearities seem to exist, i.e., there is evidence for the “too much good of a good thing” effect. Our square terms confirm the presence of an Aristotelian Kuznets curve and important nonlinearity in the impacts of interest. This effect seems more prominent in the activism in relation to ecological issues. We interpret this as remote evidence that there is some marginal utility and trade-off of the interest in one type of endowment in exchange of another. People seem to be determined to account for ecological issues when deciding whether to engage in political action and to try to change the reality. However, this determination exists within certain limits, especially in the presence of other endowments that demonstrate a more linear relationship with the utility function of the resident (namely, the art endowments in our case).
5.3.4. Step 3—Platonian Bias in the Importance of Geographies of Flowers and Flower Power
As a third step, we control for the clustering of our observations within countries through the use of a hierarchical model. We have also estimated all our analyses using country fixed effects as an alternative way to account for the same type of nesting of the data.
As seen from
Table 3, the Platonian bias due to nesting within local cultures clearly exists. As we have only seven countries, we do not engage with exploring empirically the impact on the second (country) level, but we only account for the presence of the bias of clustering on these seven countries. Further, empirical exploration would be meaningful with this method if we had over 30 observations on the second level. Our present results, however, are strong enough to confirm that the geographies of power and geographies of flower power have a varying degree of impact across different cultural country contexts. Meanwhile, our main results with regard to the explanatory variables on individual level remain unchanged from the point of curing of the Platonian bias, which confirms that the geographies of flowers and geographies of flower power are a significant determinant of the utility function of the resident and are likely to push especially incumbent individuals into political action of expressing their discontent with the level of endowment with any of these two types of local characteristics.
We have conducted the aforementioned robustness checks entailing the use of dichotomous outcome variables and probit models for estimating the same specifications in
Table 1 and
Table 2. Our estimations of all specifications with country fixed effects were also part of this robustness check. Indifferent of the methods used, the results remain essentially the same as what was presented and analysed above. Meanwhile, we present the more analytically minded approach of the hierarchical model, rather than the cultural fixed effects approach, due to the considerable criticism that the use of fixed effects can face (see [
36]). Tables of the additional estimations are available upon request from the authors.
5.3.5. Aggregate Level Analysis
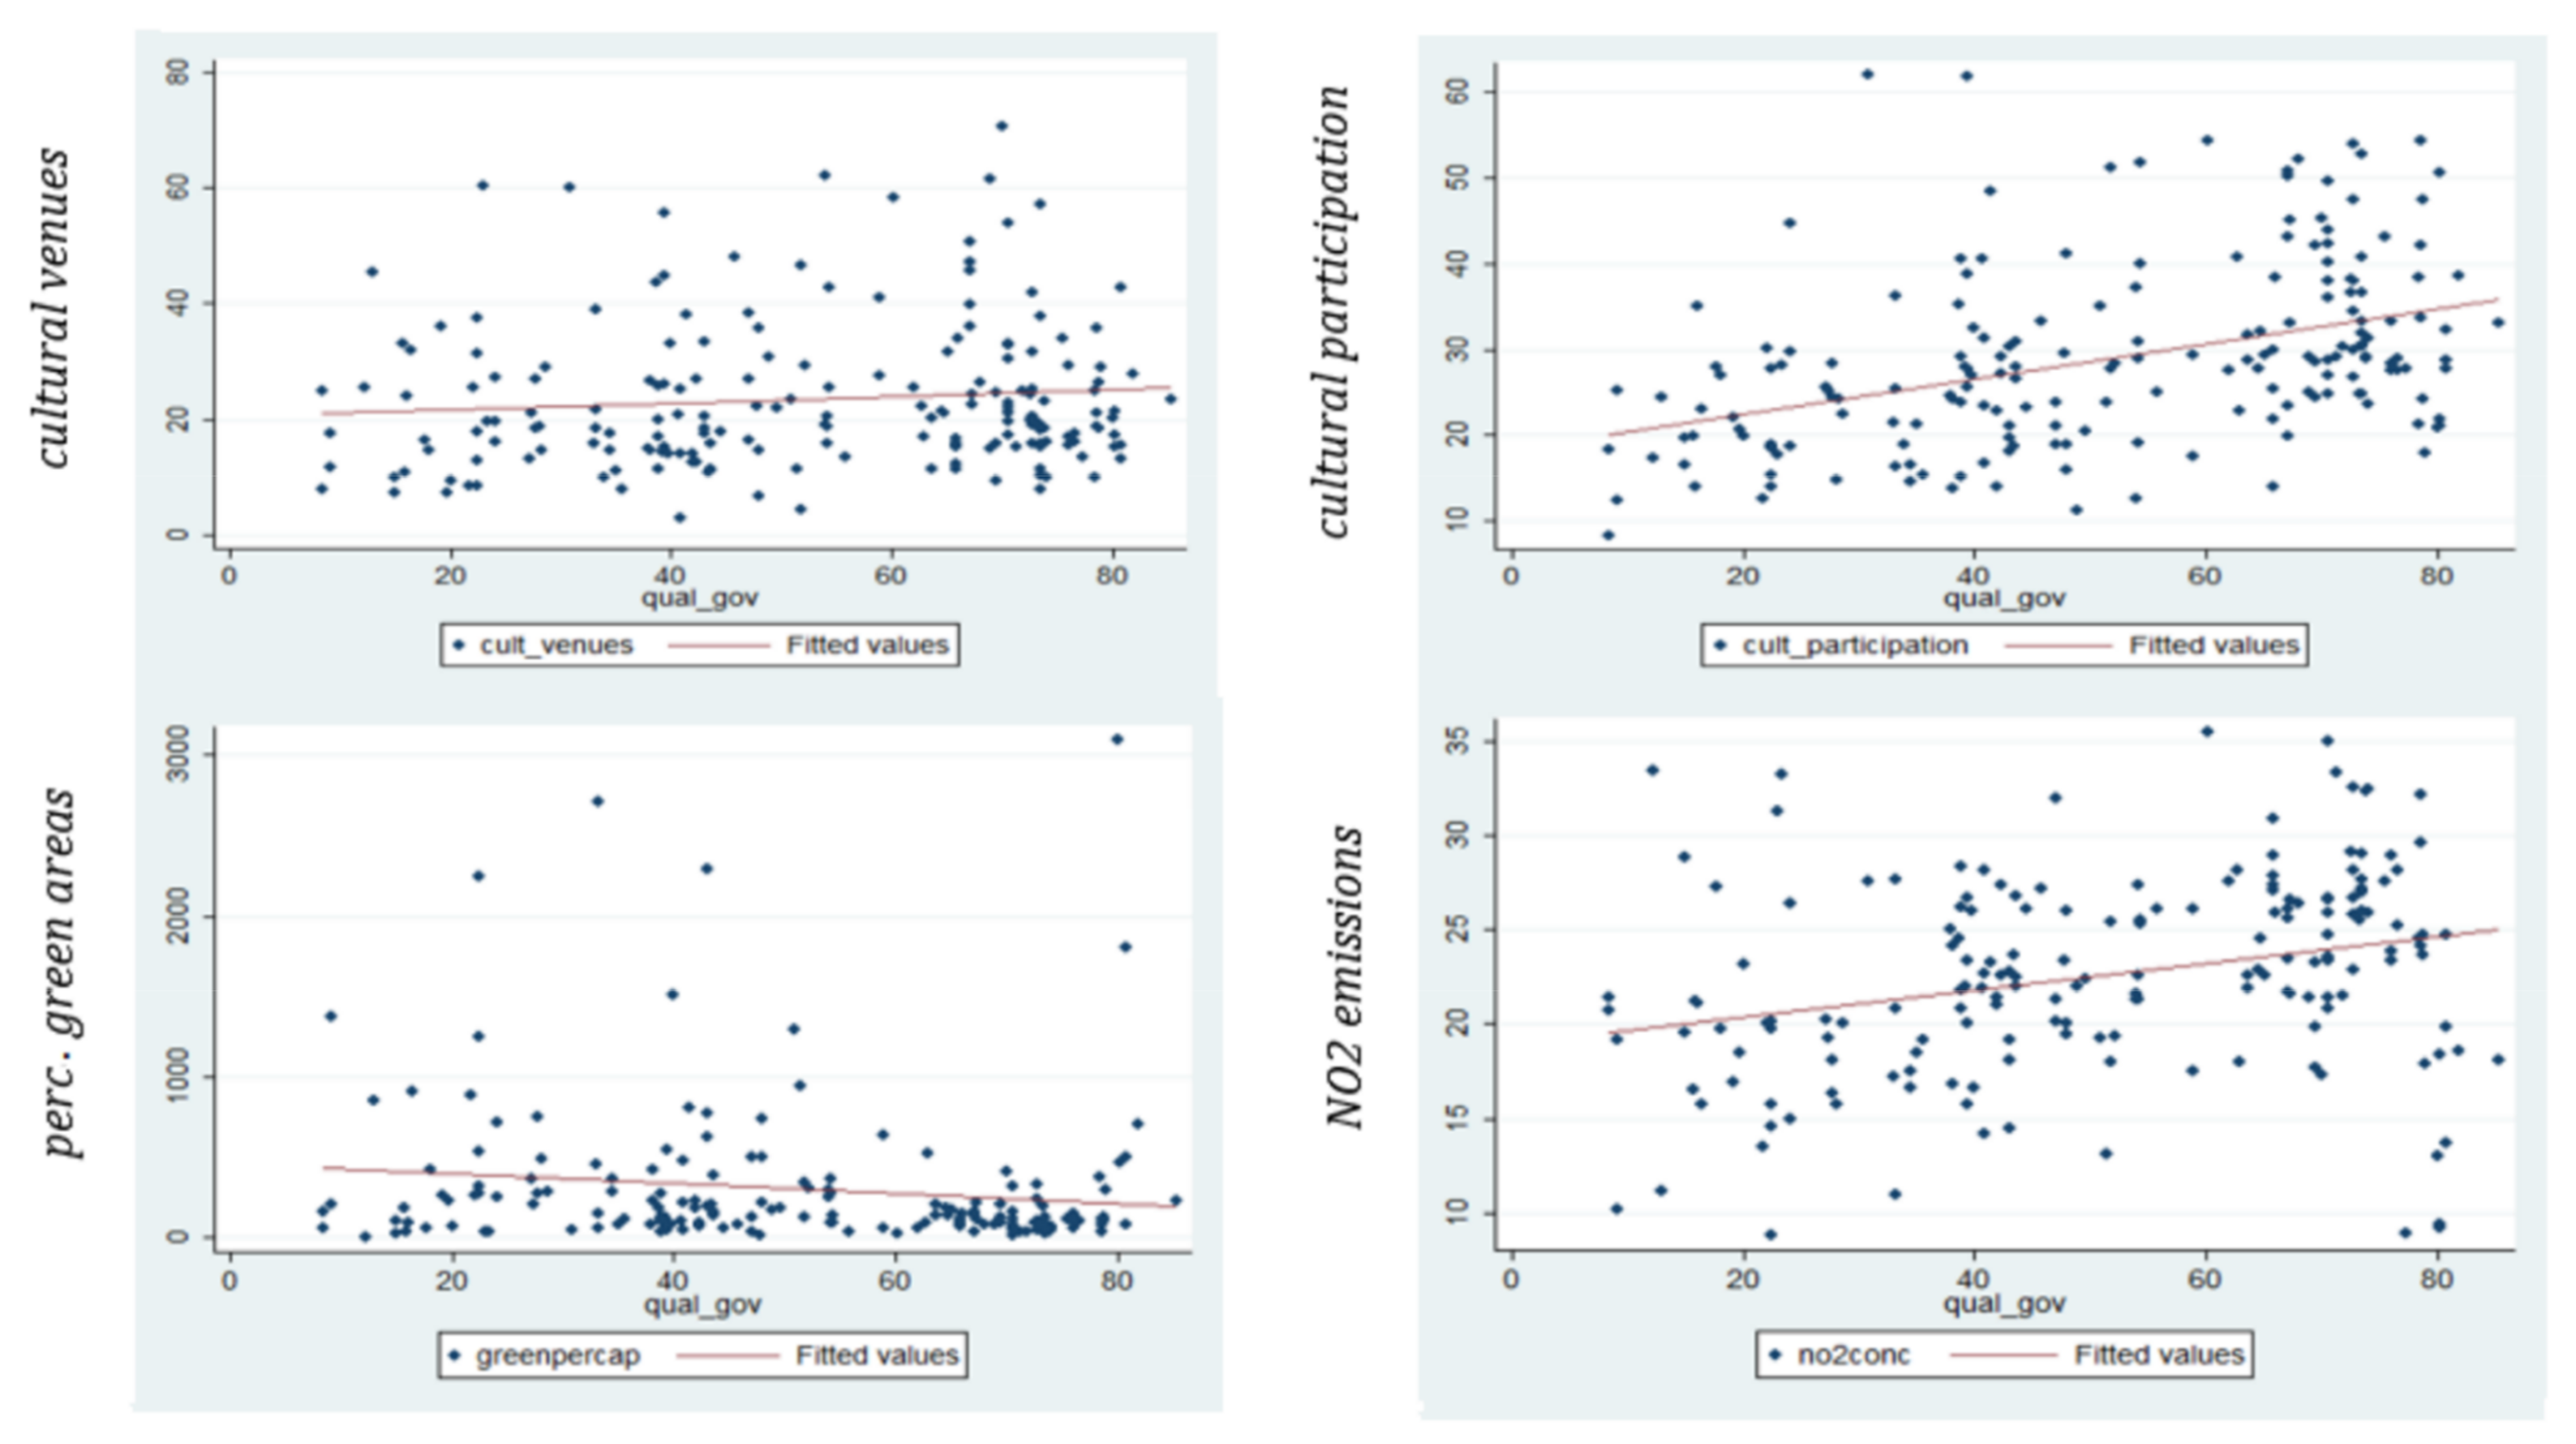
Using the data available from the Cultural and Creative Cities Monitor of the European Commission, we next explore the implications of the presence of the micro trade-off between geographies of flowers and geographies of flower power on an aggregate level. Initially, an exploratory glimpse at the available proxy and their descriptive statistics and basic associations is presented below.
As seen from
Figure 3, the geographies of flowers seem to have the highest association with political behaviour-related satisfaction with the institutions in the locality. This is especially true for cultural participation. The cultural venues seem to bear a lesser association with political behaviour, as do green areas. Ultimately, there seems to be an interesting reverse relationship between satisfaction with local institutions and pollution, which is likely to be associated with the ecological Kuznets curve hypothesis. Namely, under increasing economic growth, initially high pollution levels are entailed. Therefore, we consider it plausible that we find people’s appreciation of the local government more strongly associated with economic growth in spite of the growing pollution, as suggested in the related literature.
These results promise a meaningful and informative analysis of the implications of our micro-economic CBD mechanism from the previous section, here lifted on an aggregate level. We expect that satisfaction with the quality of the institutions is likely to be explained with the level of local economic growth as well as with social factors captured by the geographies of flowers and geographies of flower power. We estimate in total eight specifications. Firstly, we use each available proxy separately to examine its individual importance on top of the economic growth explanatory variables for the satisfaction with the local institutions. Specification 6 explores the Kuznets curve square term of our pollution variable. Specification 7 horse-races the geographies of flowers and geographies of flower power, combining their proxies in one specification together. Specification 8 adds an interaction term between the two geographies, in order to explore their eventual trade-off on an aggregate level.
6. Discussion—The CBD Micro Mechanism of Valuing Cities and Its Impact on Aggregate Level
Most analysis of individual preferences and political behaviour suffer from one of two limitations. They either have individual data that allow the identification of the micro-economic mechanism, but the data are self-reported, or they rely on actual observed political behaviour but are available only on an aggregate level. Combining WVS data and data from the Cultural and Creative Cities Monitor, we were able to analyse both the micro mechanism of interest and its observed implications on an aggregate level, empirically.
This unique ability to test for the presence of a self-reported data-informed mechanism on a micro level and crosscheck its observed implications on an aggregate level, allows us to make several important observations. Firstly, there seems to be a consistence between the micro and macro developments, where the macro effects reflect a magnified version of the micro preferences. This is an important insight that is in line with efforts for developing systems analysis using agent-based models and dynamic stochastic general equilibrium (DSGE) models.
It seems that the right questions have to be asked and cultural proxies have to be very clearly designated between the supply/provision and demand/consumption of culture—as the two types of measures seem to capture substantially different aspects of the cultural economy itself with regard to its importance for political behaviour. It seems that cultural participation (or the demand) has a substantially more dominant importance than the mere supply of cultural amenities. Policy needs to consider this.
Another interesting measurement implication is revealed for the distinction between the endowment with green areas and the level of pollution—both seem to be present in a disconnected manner with regard to political behaviour. The green areas endowment seems to be a valid trigger for the citizen’s satisfaction with the institutions independent of the level of pollution, which might be tolerated according to the Kuznets curve, and is not a key factor for the way people evaluate the institutions. Green areas matter on their own as a value added to what local governance provides to its citizens. A reason for this may be the salience of the presence of green areas, and the relatively lower visibility of NO2 pollution. Thus, due to the difference in salience, a bias occurs in the cultural valuation towards NO2 as less important than the presence of green areas.
Finally, our findings suggest that self-reported data are indeed reliable to reflect a realistic picture of people’s behaviour. Objective data on an aggregate level confirm what is expected based on the self-reported micro preferences and the mechanism depicted by them.
Most notably, the analysis on a micro and macro level reveals that geographies of flowers and geographies of flower power on a micro level are likely to drive citizen satisfaction with the local institutions on a regional level. This can be then extended to expectations that mass dissatisfaction and political protest (potentially expressed in voting) can result if green areas are not provided sufficiently through space and if cultural participation is not promoted among the local population. This is a particularly important insight from a regional economics point of view. For a very long time [
70,
71,
72,
73], a relatively small number of regional economists have been propagating the analysis of human behaviour on a regional level. However, the dangers of ecological fallacy when inferring human behaviour from observations on an aggregate level has been a likely barrier in this direction. Our findings show that the ecological fallacy is rather subject to a careful use of proxies rather than an unsurmountable problem of obtaining evidence on an aggregate level for a mechanism that generates effects on an individual level. Put differently, ecological fallacy seems limited rather to a good selection of proxy variables on an aggregate level that can capture the essence of the micro mechanism most precisely. Meanwhile, micro and macro behaviour are consistent, and the macro is an amplified version of the micro preferences.
As seen from
Table 4, while our model behaves generally as expected and is consistent across specifications, it is interesting to note that it is not the cultural venues themselves (Spec. 1) but the cultural participation level in a city (Spec. 2) that is strongly associated with the satisfaction with the quality of the institutions locally. We see that on an aggregate level, the effects amplify, so while the cultural participation importance increases, the green effects seem even lower on an aggregate level than they were found on an individual level. Yet again, there seems to exist an important difference between the green areas and pollution. The green areas are an important determinant for the satisfaction with the local government and this seems to be disconnected from the level of pollution. The latter, captured by NO
2 and its square terms, behaves as expected in the sense that it registers the presence of an inflection point and change of sign between the level of pollution and its square term, but it is insignificant as an explanatory variable. The horse-race in Specifications 7 and 8 shows that instead of just a trade-off, the geographies of flower power dominate the effect of the two types of geographies on an aggregate level. We consider this as a further support for the amplification of the effects on an aggregate level.
7. Conclusions
The current paper was inspired by the idea to examine the utility function of the stayers as opposed to the movers in a locality. We found that both geographies of flowers and geographies of flower power have an important role in the utility function of the residents—stayers—in localities. This was confirmed on the very lowest micro level of analysis, where mechanisms can clearly be identified.
We conducted our micro analysis on the role of attitudes towards the geographies of flowers (ecological endowment) and geographies of flower power (endogenous human-made endowments such as art amenities) for the people from seven European countries available from the WVS. We were able to compare the effects between urban and rural residents and the effects for migrant and incumbent populations. We found important differences across both delineations. However, on an average level, we found that both geographies of flowers and geographies of flower power were important drivers for the utility and disutility that an individual derives in their livelihood. Importantly, we suggest that the utility function describing the life satisfaction of the resident is the same function that drives the resident’s voting behaviour, as people vote to ensure the management and improvement of the life in the place where they are living. It was found that the utility related to art activities seems more strongly associated with level of life satisfaction, while the level of ecological endowment seems more strongly associated with the propensity of the individuals to express their disutility and discontent through active political engagement as a form of protest.
The regional economics dimension of our analysis confirms the importance of the geographies of flowers and geographies of flower power for the citizens’ perceptions of local institutions on an aggregate level. We interpret this finding as a strong indication for the importance of these two types of geographies for voting behaviour and political elections, since satisfaction with the quality of the institutions clearly predicts political voting behaviour.
The main contribution of this paper is providing the first empirical evidence that citizens’ life satisfaction and the utility function describing their propensity to political activity share common determinants. Namely, the geographies of flowers and the geographies of flower power seem to predict equally well citizens’ life satisfaction and citizens’ propensity to political action. By extension, this means that if people are dissatisfied with the provision of green areas or artistic milieu in the place where they live, this place will be facing an increase in dissatisfied voters too. We found evidence for this relationship both on individual and on aggregate levels. Thus, the findings of this paper are especially relevant for the sustainable management of local environments with regard to the artistic and ecological endowments of places. We can confirm that the geographies of flowers and geographies of flower power need to be provided in sufficient amounts. Otherwise, a likely outcome based on our identified dependencies is that under-supplied locations will face important political discontent and action, evoking responses from the residents even in the most recent context of a highly digitalised reality where work and entertainment from home are possible.
Our analysis helps to reveal several important details about the relationship of propensity to politically active behaviour (potentially by extension of voting behaviour) with the geographies of flowers and the geographies of flower power. Our findings make it apparent that people are still highly sensitive to the ecological environment and the socially provided public venue-related art activities and this determines their behaviour as citizens. Our analysis also shows that while art activities are clearly more relevant for the urban residents, the ecological endowment is relevant for the utility of residents of any kind of locality and among movers and non-movers the same. This underlines the evolutionary importance of the natural endowment, which might be even growing in appreciation in the utility function, given the current pandemic crisis and lockdown conditions, which make the human-built cultural venues less attractive for the resident from a health reservations point of view. Finally, on an aggregate level, using the Cultural and Creative Cities Monitor dataset, we demonstrated three important effects: (i) the micro mechanism analysed in this study does magnify its effect on an aggregate level in line with the Schelling segregation model expectations and is dominated by the cultural participation preference of the citizens, expressed in the form of local cultural participation; (ii) the Kuznets effect seems to be confirmed on a European city level when pollution variables are used to quantify the ecological endowment of a city, but it is not the main driver of the quality of institutions evaluation by citizens; and (iii) green areas per capita do play a role for the satisfaction of the citizens with their place of living independent of the level of pollution experienced. The strength of our analysis is that we used alternative proxies for propensity to political behaviour on both an individual and local level and we always found the relationship between propensity to political behaviour and the geographies of flower and geographies of flower power is present, and the patterns of dependency hold consistent across different specifications. This means that within method triangulation (i.e., the use of alternative proxies for the same notion in econometric analysis) strongly confirms the economic meaning of our findings.
The limitations of our study are rather points of departure for further research. Firstly, we can compare the results from previous WVS waves to examine eventual changes in the level of affinity of people to geographies of flowers and geographies of flower power over time in relation to local factors (such as level of digitisation of the country where the resident is located). Using the other six waves of the WVS may also provide us with more statistical power to explore the determinants on the higher second level of analysis in the hierarchical model—i.e., the explorations of the Platonian bias test of the CBD Value Free Analysis of Values. Second, purely on an aggregate level, it would be interesting to augment the urban data, such as the one from the Cultural and Creative Cities Monitor with specific voting data. This will help to analyse the here presented effects from geographies of flowers and geographies of flower power for political behaviour in urban places in more depth and with nuance. Third, on an aggregate level, further data collection efforts may allow extensions of our analysis on an aggregate level. Namely, alternatively as an outcome variable we could use electoral voting activity—turnout. These data could be obtained as information on regional election turnout from the NSD European Election Database (
http://eed.nsd.uib.no/). This data collection would require extensive effort, but is highly relevant and interesting, especially if implemented on a by-political-party level. Meanwhile, time-consuming as it might be, this extension of our study is fully feasible. Therefore, we flag this opportunity for further research here.
In summary, the current analysis leaves us with two main takes. First and foremost, the geographies of flowers and geographies of flower power are important determinants in the utility function of the residents of places with implications for their political behaviour. Second, art seems to be of paramount importance in the subjective valuation by urban residents, even more than the ecological environment, in spite of the obvious evolutionary paramount importance of the latter. These clearly identified dependencies are confirmed on individual and aggregate levels and therefore merit further analysis and serious attention in both science and practice.


