1. Introduction
With the proliferation of mobile phone use in recent years, it has become possible to track the movements of people through mobile phone signals so that human behavior and a range of social issues can be better understood. This data presents a major new source for urban studies in the era of big data [
1,
2]. While the individual-level mobility trace has facilitated a number of groundbreaking studies [
3,
4,
5], growing concerns about privacy are discouraging the distribution of individual-level mobile phone trace data. Instead, most data holders are now distributing mobile phone trace data aggregated to grids or administrative units so that user privacy can be better protected. Such a trend presents researchers with the challenge of effectively analyzing people’s travel behavior and related social issues with aggregated mobility data.
Human mobility patterns are an important aspect of the socioeconomic system, and studying them could yield important insights into many socioeconomic issues. In the past, studies of mobility patterns were mainly based on travel surveys [
6,
7] or global positioning system data produced by a small sample of carriers [
8,
9]. The wide use of mobile phones provides a powerful source of data for collecting large amounts of individual tracking information for studying the whereabouts of people over space and time. The data are wide coverage, being retrieved from all mobile phone users in a given area, and can be harvested over a long period for more reliable results. This new data source has been used by many studies about understanding human mobility patterns [
10,
11].
However, recent studies have shown that even anonymous mobile phone trace data poses a serious threat to personal privacy. De Montjoye et al. [
12] conclude that four spatio-temporal points are enough to uniquely identify 95% of individuals. Xu et al. [
13] show that an attack system is able to recover users’ trajectories with an accuracy of 73–91% at a scale of tens of thousands to hundreds of thousands users. As an emerging trend, researchers are proposing using aggregate information about people’s mobility [
14].
Our work therefore aims to explore the effective transformation of individual-based mobility metrics to suit aggregate data so that meaningful mobility and social indicators can be extracted. Many indicators and metrics for measuring mobility have been developed at the individual level [
10,
15,
16], but how relevant information could be represented when only aggregate mobility data are available remains undiscussed. This work would be informative for future research using aggregate mobile phone data in urban studies and other social sciences.
In this study, we develop our aggregate-level mobility metrics based on the grid-aggregate data provided by China Unicom, one of the largest mobile phone service providers in China. In this data set, all mobility information is provided at the grid level (the size could range between hundreds to a thousand meters), including hourly flow between grids, the home grids of travelers travelling between any two grids, etc. We use Chengdu, China, as the case study. Specifically, we use the mobility data of the residents living outside the central city of Chengdu and apply our grid-based metrics to evaluate the mobility patterns and well-being of residents in suburbs and rural areas. Therefore, the contribution of this work is two-fold. First, we develop a series of metrics for the analysis of grid-level mobility data, so that similarly meaningful mobility analysis can be conducted with grid-level data as it can be with individual-level data. Second, using the methods developed, we examine the mobility patterns of residents in city suburbs and rural areas surrounding a large Chinese city, which to date has been seldom studied.
The rest of the paper is divided into five parts.
Section 2 reviews related work.
Section 3 introduces the data and methodology, including the basic information about the study area, the data set and the candidate aggregate-level mobility metrics.
Section 4 presents a comparison of candidate metrics and an analysis of mobility patterns in the study area.
Section 5 discusses the findings and
Section 6 concludes.
2. Related Work
2.1. Characterizing Human Mobility
The term human mobility encompasses many aspects of travel behavior, which helps operationalize the concept. The measurement and analysis of key aspects of human mobility is a fundamental component of travel research. Key aspects considered by previous research include travel frequency [
15,
17,
18], travel distance [
17,
19,
20], destination choice [
17,
21,
22] and travel mode [
17,
23]. These aspects of mobility have been at the center of travel behavior modelling (e.g., activity-based modelling) and the analysis of related social issues such as social inequality, energy use, and health [
24,
25,
26].
Another strand of relevant research follows the paradigm of complexity science and explores universal laws of human mobility. Similar aspects of human mobility are at the center of analysis in these studies. For example, the classic gravity model sets up a law that explains the frequency of travel with the distance between the origin and destination [
27]. A more recent model explaining human mobility (the exploration and preferential return model) focuses on an individual’s choice of travel destinations and the resulting distribution of destinations [
28]. The most recent
Nature publication in this field explores the distribution of mobility flows to a location in relation with visitors’ home distance from the location and the frequency of visits [
4]. A slightly earlier work in
Nature explores the relationship between the probability of visiting a location and the distance between locations [
29]. The above-mentioned studies suggest that travel frequency, distance and destination distribution, among others, are commonly analyzed key aspects of human mobility.
It should be noted that these characteristics can be analyzed in terms of both entire travel profiles (one day or multi-day) and individuals’ trajectories. For example, in terms of travel distance, some studies analyze the space covered by the destinations visited by a person in a certain period [
20], while some deal with the distance of individual trips in a trajectory [
30]. Based on the continuous trajectory of individuals, some studies also explore a trajectory-based characterization of daily mobility, namely mobility motif. For example, Jiang et al. [
11] studied the daily motifs derived from mobile phone trajectories in Singapore. While both approaches could help reveal informative patterns of mobility, the latter is not supported by depersonalized grid-aggregate mobility data, since the information about an individual’s consecutive travel trajectory is lost in the aggregation process.
2.2. Related Metrics in Existing Studies
To more concretely characterize the key aspects of mobility, a number of metrics have been employed by existing studies. In a comprehensive review of studies of mobile phone data, Wang et al. [
10] identified four commonly used indicators of mobility, which are displacement of trips, radius of gyration of travel destinations, Shannon’s entropy of destinations and eccentricity of the shape of destination distribution. In a work examining the robustness of mobility measurement, Zhao et al. [
19] employed a similar set of mobility metrics, including daily travel frequency, radius of gyration, entropy index and eccentricity index. When studying the relationship between mobility and socioeconomic status, Xu et al. [
20] used five metrics of mobility, namely radius of gyration, k-radius of gyration, number of destinations, origin-destination diversity and unicity (uniqueness of destination). Similar metrics are also applied in Yuan and Raubal [
16] (radius, approximated ellipse shape and Shannon’s entropy index of individuals’ travel destinations), Xu et al. [
15] (frequency of movements, daily activity range and number of activity anchor points) and other research.
In recent studies, metrics of human mobility are also applied to understand the response to COVID-19 and other disasters. Pan et al. [
18] developed a composite index measuring the level of mobility behavior during COVID-19, composed of five specific metrics: percentage of residents staying home, daily work trips per person, daily non-work trips per person, distances travelled per person and out-of-county trips. Chan et al. [
31] used the number of visits to different places to represent mobility in COVID-19. El Shoghri et al. [
32] focused on radius of gyration to analyze how mobility patterns drive disease spread. In addition, in a study on hurricane impact, Ahmouda et al. [
33] analyzed changes in trip distance, trip counts in different distance bands and radius of gyration.
The key aspects of human mobility and commonly used metrics are summarized in
Table 1. All the studies reviewed conduct relevant research on individual-level mobility data, so it remains unclear how these metrics could be transformed to suit grid-aggregate mobility data in a time of growing privacy concerns. We will fill in this gap by proposing candidate metric transformations, testing these metrics on our dataset and discussing the theoretical and technical appropriateness of the transformed metrics.
3. Methodology
3.1. Study Area and Data
We chose Chengdu city as the case study, which is the largest city in southwest China. It should be noted that the city refers to the administrative area composed of a central city and surrounding areas, the latter of which are further composed of a system of towns, villages and farmland. The city extends across an area of 14,335 square kilometers, 95.4% of which is rural. The total population was 16 million in 2017 when the data was collected, with 5.8 million of this population living in rural areas [
34]. Chengdu is an interesting case for analysis as it is a mixture of urban, suburban and rural contexts, so diverse mobility patterns might be revealed through the analysis.
We used mobile phone trace data collected between 12 and 18 April 2017 from China Unicom. One may doubt whether the usage of mobile phones is wide enough outside the central city to collect meaningful data, but due to the availability of low-price devices and the government’s infrastructure investments, the proportion of mobile phone users had reached 83% and the mobile phone signal coverage was 95% even in rural Chengdu when the data was collected [
35]. Since the estimation of position based on mobile phone signals is not always accurate [
36], especially in areas where signal towers are sparse, the positions were estimated into grids of one square kilometers (1 km × 1 km, 14,856 in total). We focused on the 14,209 grids outside the central city.
For each mobile phone user in the records, a grid cell was identified as the home place if this was where the user stayed for the longest time between 21:00 and 7:00 throughout the study period and the user goes there on more than three days. Phone users with homes in the non-central city grids were thus included in our analysis. A total number of 0.97 million non-central city residents were identified.
As mentioned in the introduction, we only acquired the aggregate sum of the hourly flow between grids and the home grids of the movers, instead of individual users’ moving trajectories. Moreover, counts less than five were removed to further protect privacy; if there were less than five people who lived in grid A and moved from grid B to C in a certain hour, these movement records were omitted from our dataset. A total of 1.98 million movements were identified throughout the study period (a week). 60% of the identified movements were within the same grid on weekdays and 76% are within the same grid on weekends.
3.2. Candidate Aggregate-Level Mobility Metrics
The candidate aggregate-level metrics were transformed from the commonly used metrics identified in
Table 1. Among those metrics, trip number by purpose was difficult to analyze with grid-aggregate mobile phone data since trip purpose was not directly available and could not be inferred without individuals’ spatio-temporal trajectory. Therefore, we were left with five mobility metrics to be transformed. For each metric, we started from the simplest transformation and then added more elements to increase theoretical appropriateness and reduce potential bias. The original formula and candidate transformations are explained below.
3.2.1. Frequency
The frequency of travel was measured as the number of movements made by a person in a given time when using individual-level data, which was a relatively straightforward process [
15]. The simplest transformation is to calculate the total number of movements made by all the residents of a grid. However, the total number of movements is likely to be correlated with the population in a grid, especially when there are significant differences in grid population size. To account for this, there could be a second metric that divides the total number of movements with a formula of the grid population. The formula could be a linear, logarithm or exponential transformation of population, corresponding to linear, decreasing or increasing movements of population, which needs to be examined with empirical data.
where
NM denotes the movements made by the residents of a grid and
P denotes the population of a grid.
3.2.2. Destination Distribution
In the two commonly used metrics for destination distribution in
Table 1, the number of destinations measured the diversity of destinations visited by an individual, and the entropy of destinations measured whether one’s activities were evenly distributed among all destinations or concentrated on a few destinations, in other words the regularity of visits [
10]. The transformation for the destination number metrics is similar to that of the frequency metrics. Two candidate transformations are proposed. The first is simply taking the number of different locations visited by the residents of a grid; the second is normalizing this with a formula of grid population. The normalization factor, if necessary, may be different from that of the frequency metrics, which also needs to be examined with empirical data.
where
ND denotes the number of distinct destinations visited by the residents of a grid and
P denotes the population of a grid.
When using individual-level data, the Shannon’s entropy of destinations is computed as follows:
, where
pi is the probability that destination
i is visited by an individual, and
ND stands for the total number of distinct destinations
i [
10]. When most visits are concentrated at one location, the entropy index is close to 0; and when visits are evenly distributed among all locations, the entropy index is equal to
, the highest possible value of this index. The direct transformation of this metric is to replace
pi as the percentage of visits to destination
i made by the residents of a grid and
ND as the total number of destinations visited by grid residents. Further, the entropy index is also likely to correlate with grid population and the number of destinations (considering that the maximum value varies with
ND). Therefore, we will examine the correlation and identify the appropriate factor to normalize the entropy value.
3.2.3. Spatial Range
The two metrics for spatial range in
Table 1 measure the size and shape of the space covered by daily travel. The size of the travel space is usually measured by the radius of gyration, which refers to the root mean squared distance between each staying location in an individual’s trajectory and the center of mass of the trajectory, expressed as:
where
denotes the
positions recorded for an individual and
is the center of mass of the trajectory [
3,
19]. Some studies also propose using the axes of standard deviational ellipse for this purpose, which refers to the mean of the semi-major and semi-minor axes of the approximated ellipse of an individual’s daily movement [
16]. For the two individual-level metrics, we propose three transformations. The first is a direct transformation by replacing the staying locations in an individual’s trajectory with all the locations visited by the residents of a grid. However, the locations may receive different numbers of visits, which may not show in an individual’s one-day travel record but could be prominent in aggregate data. Therefore, the second transformation considers the number of visits received by each location and computes the weighted radius of gyration and the axes of weighted deviational ellipse. Furthermore, the space covered by residents’ movements may also increase with grid population. Hence, the third transformation involves a normalization with grid population as used for previous metrics.
Space size metrics 1: same as Formula (8)
where
denotes the locations visited by the residents of a grid;
and
denote the center of mass of the locations and the center of mass weighted by the number of visits;
vi denotes the number of visits to location
i;
la and
lb are the lengths of the major and minor axes of the standard deviational ellipse covering all locations visited by grid residents;
law and
lbw are the lengths of the axes of the weighted standard deviational ellipse.
la,
lb,
law and
lbw are computed with the R package “aspace”.
The eccentricity of shape measures how much the travel space deviates from a circle, showing whether trips are evenly distributed in each direction or tend to be longer in certain direction. It is defined as
where
la and
lb are the lengths of the major and minor axes of the standard deviational ellipse covering all locations visited by grid residents [
16]. However, at least three destination grids are needed to derive non-zero
la and
lb, while in our data, 53% of the grids do not meet the criteria, which is also likely to be a problem for other grid-aggregate data. In light of this, we propose two alternative metrics which serve similar purpose but are not constrained by the number of destination grids:
Space shape metrics 1: direction from a grid to the centroid of all destination grids
Space shape metrics 2: direction from a grid to the weighted centroid of all destination grids
The directions are measured in relation to north and range between 0 and 359 degrees, showing the dominant direction of the trips generated from a grid.
4. Results
4.1. Frequency
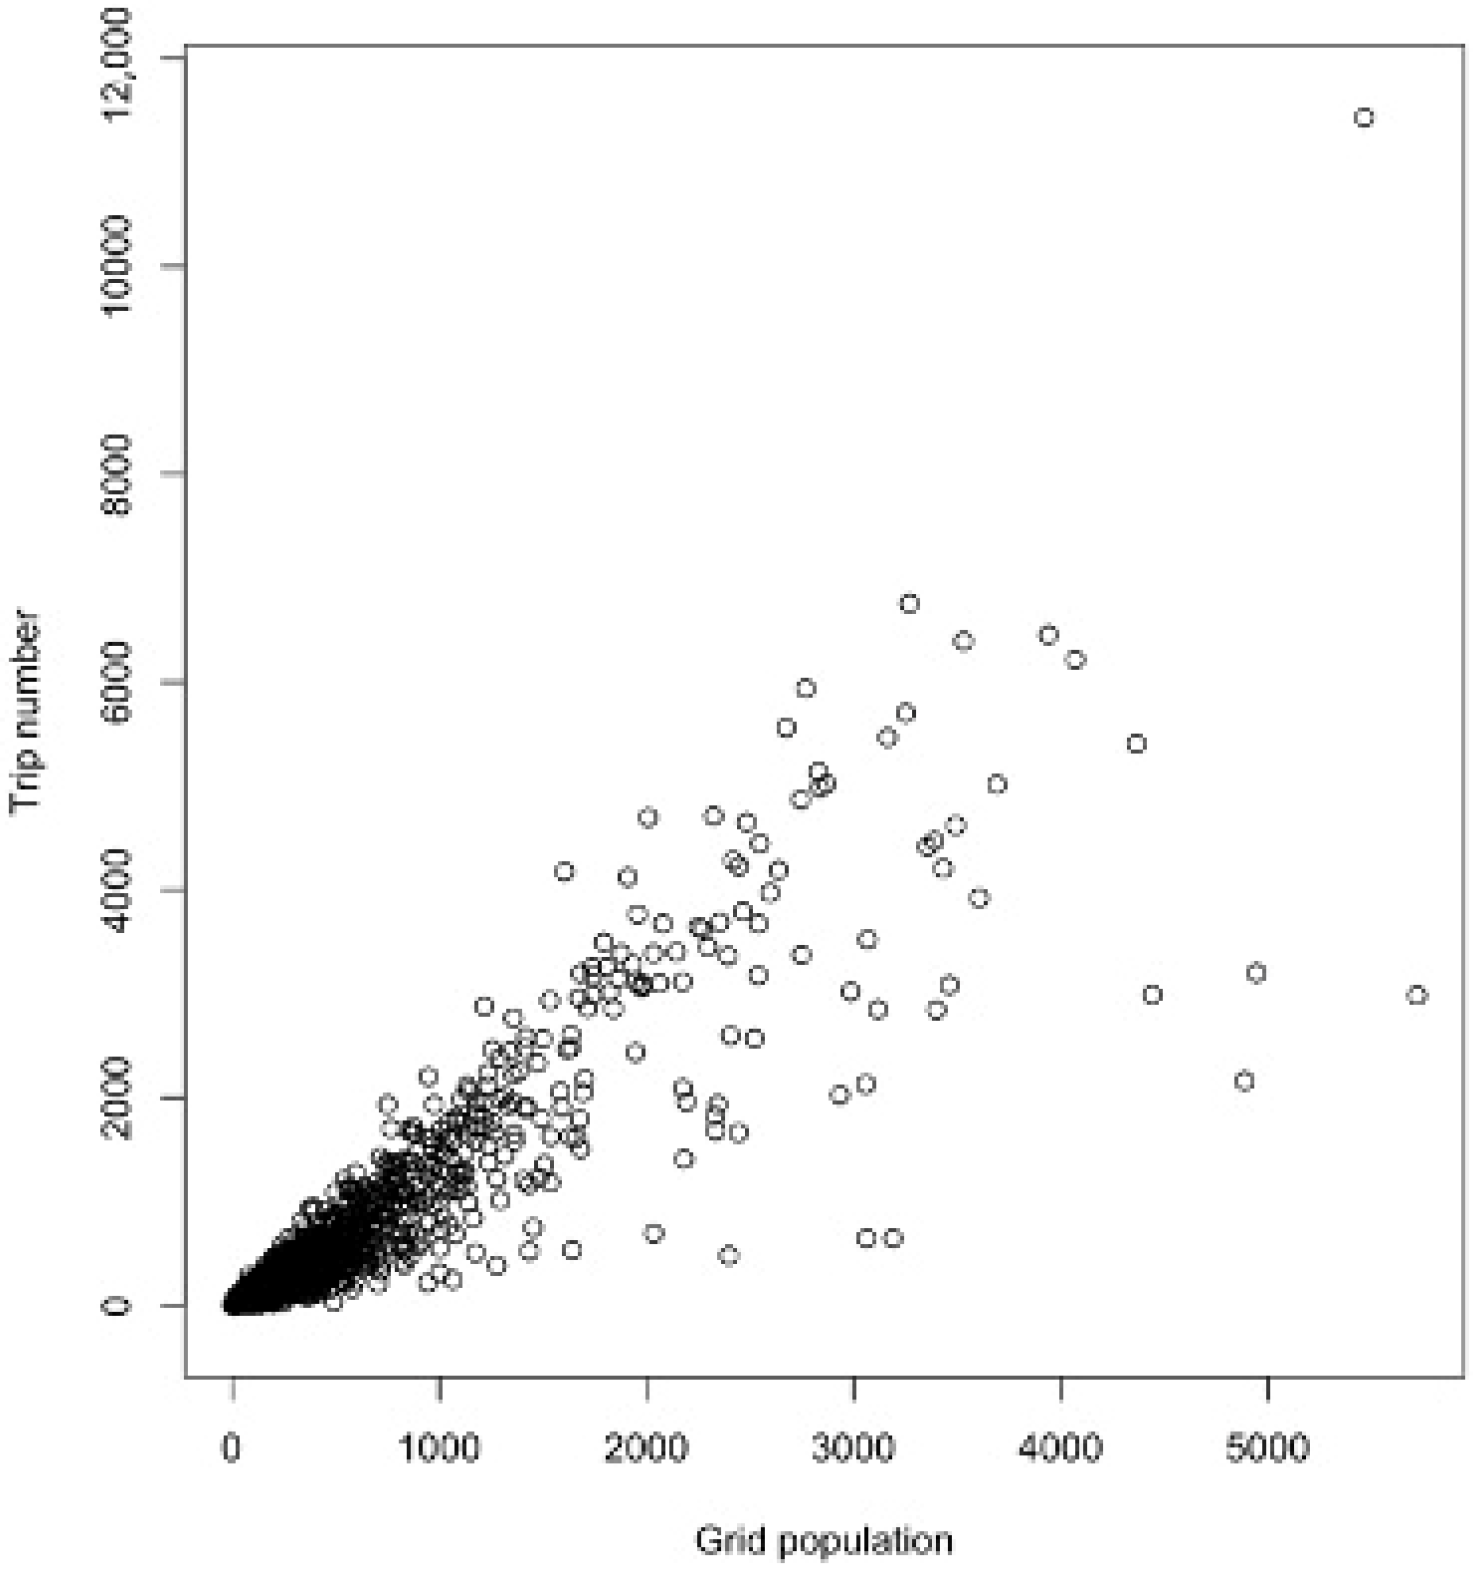
The total number of movements observed for the residents of each grid were strongly correlated with the population of the grid and the relationship appears to be linear (
Figure 1). After normalizing the number of movements with grid population, their correlation was evidenced to be small (
Table 2). Therefore, the second algorithm (
NM/
f(P)) is more appropriate for analyzing travel frequency using grid-aggregate data.
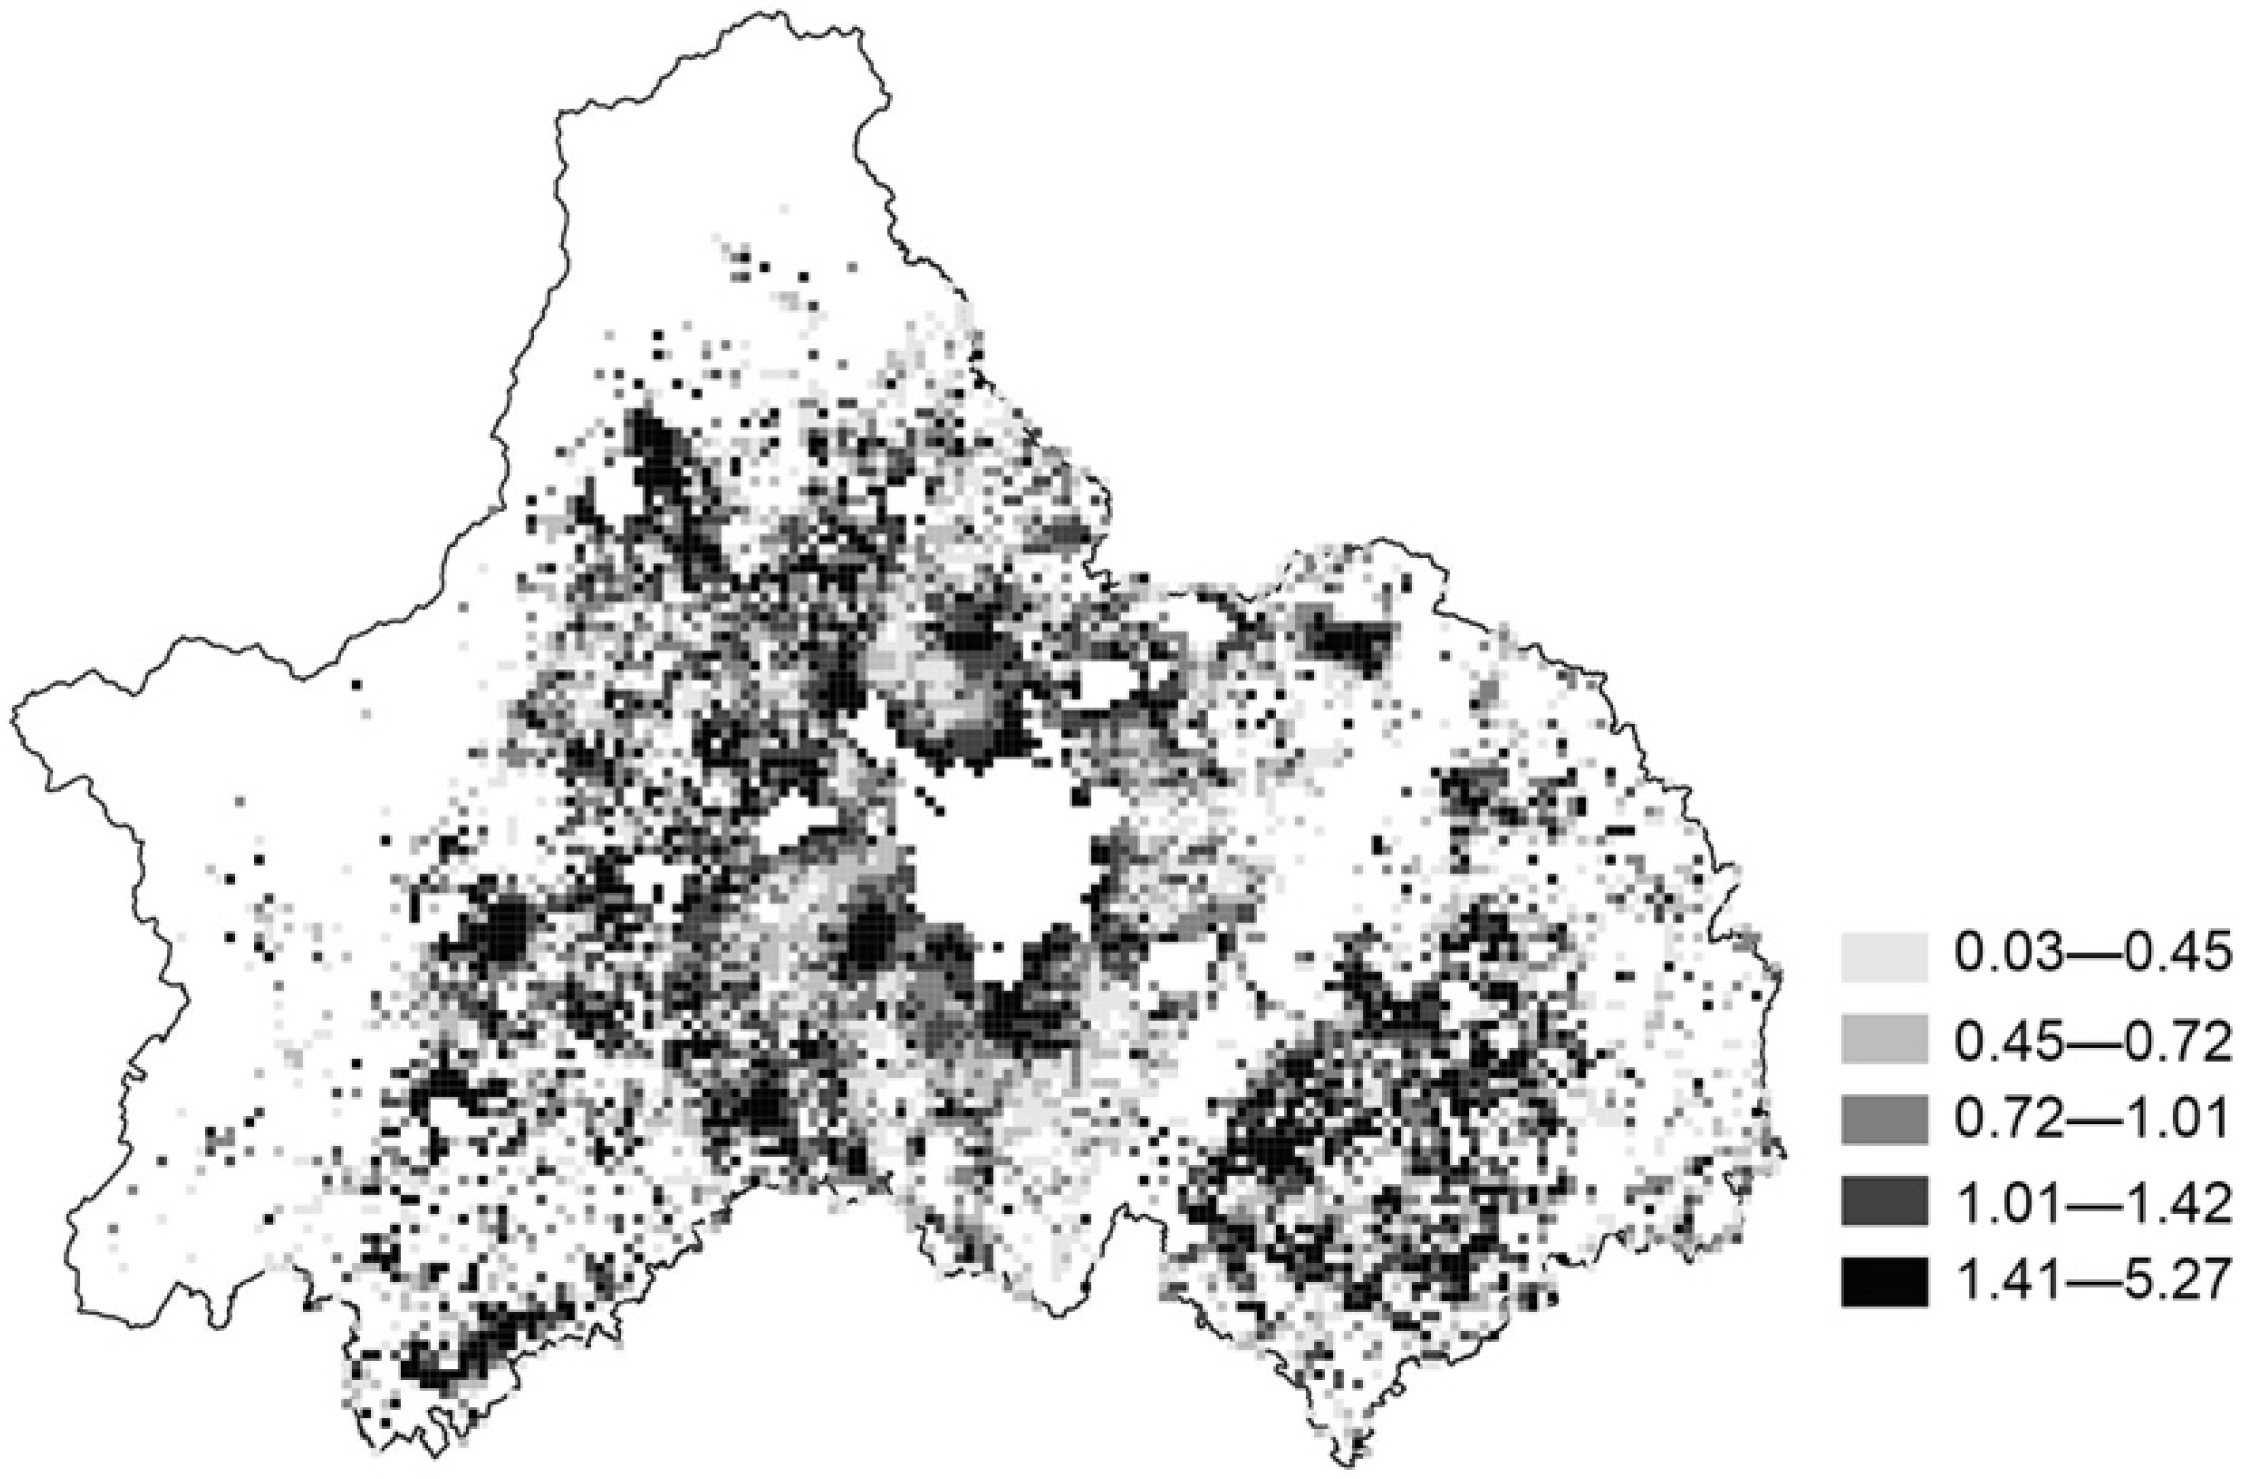
The analysis result for the travel frequency of suburban and rural residents in Chengdu is as follows. For the grids that are identified with any movements of residents, the average number of daily trips was 1.27 per person on weekdays. The spatial distribution of the travel frequency shows a highly mixed pattern, with multiple dark “hot spots” all around the region (
Figure 2). Some of these active areas are located around the central city and some are at town centers, while there are also some “hot spots” far away from the central city.
4.2. Destination Distribution
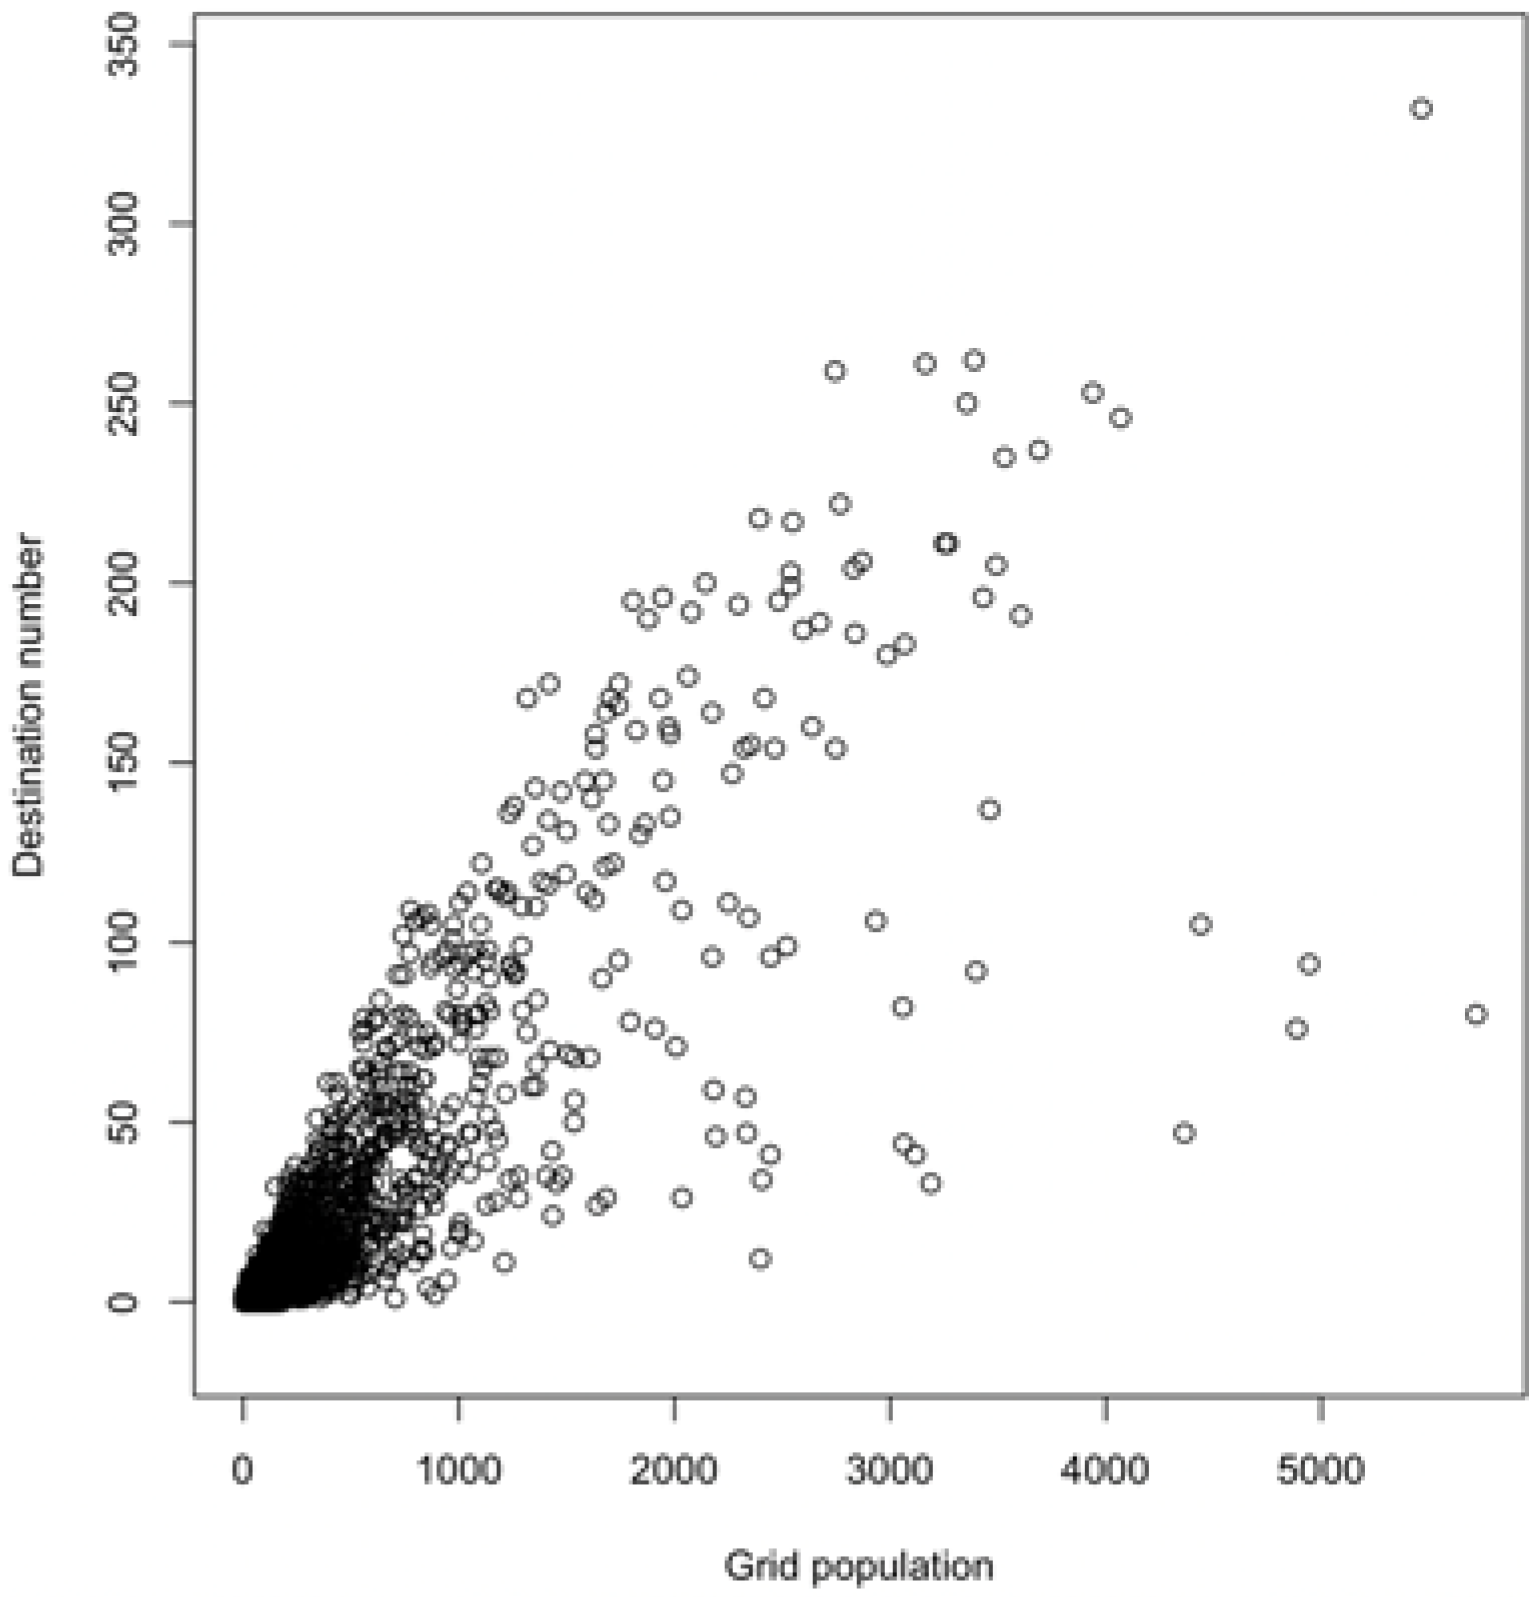
Of the two indicators for destination distribution, diversity was also strongly correlated with the population of a grid and the correlation appears to be linear (
Figure 3 and
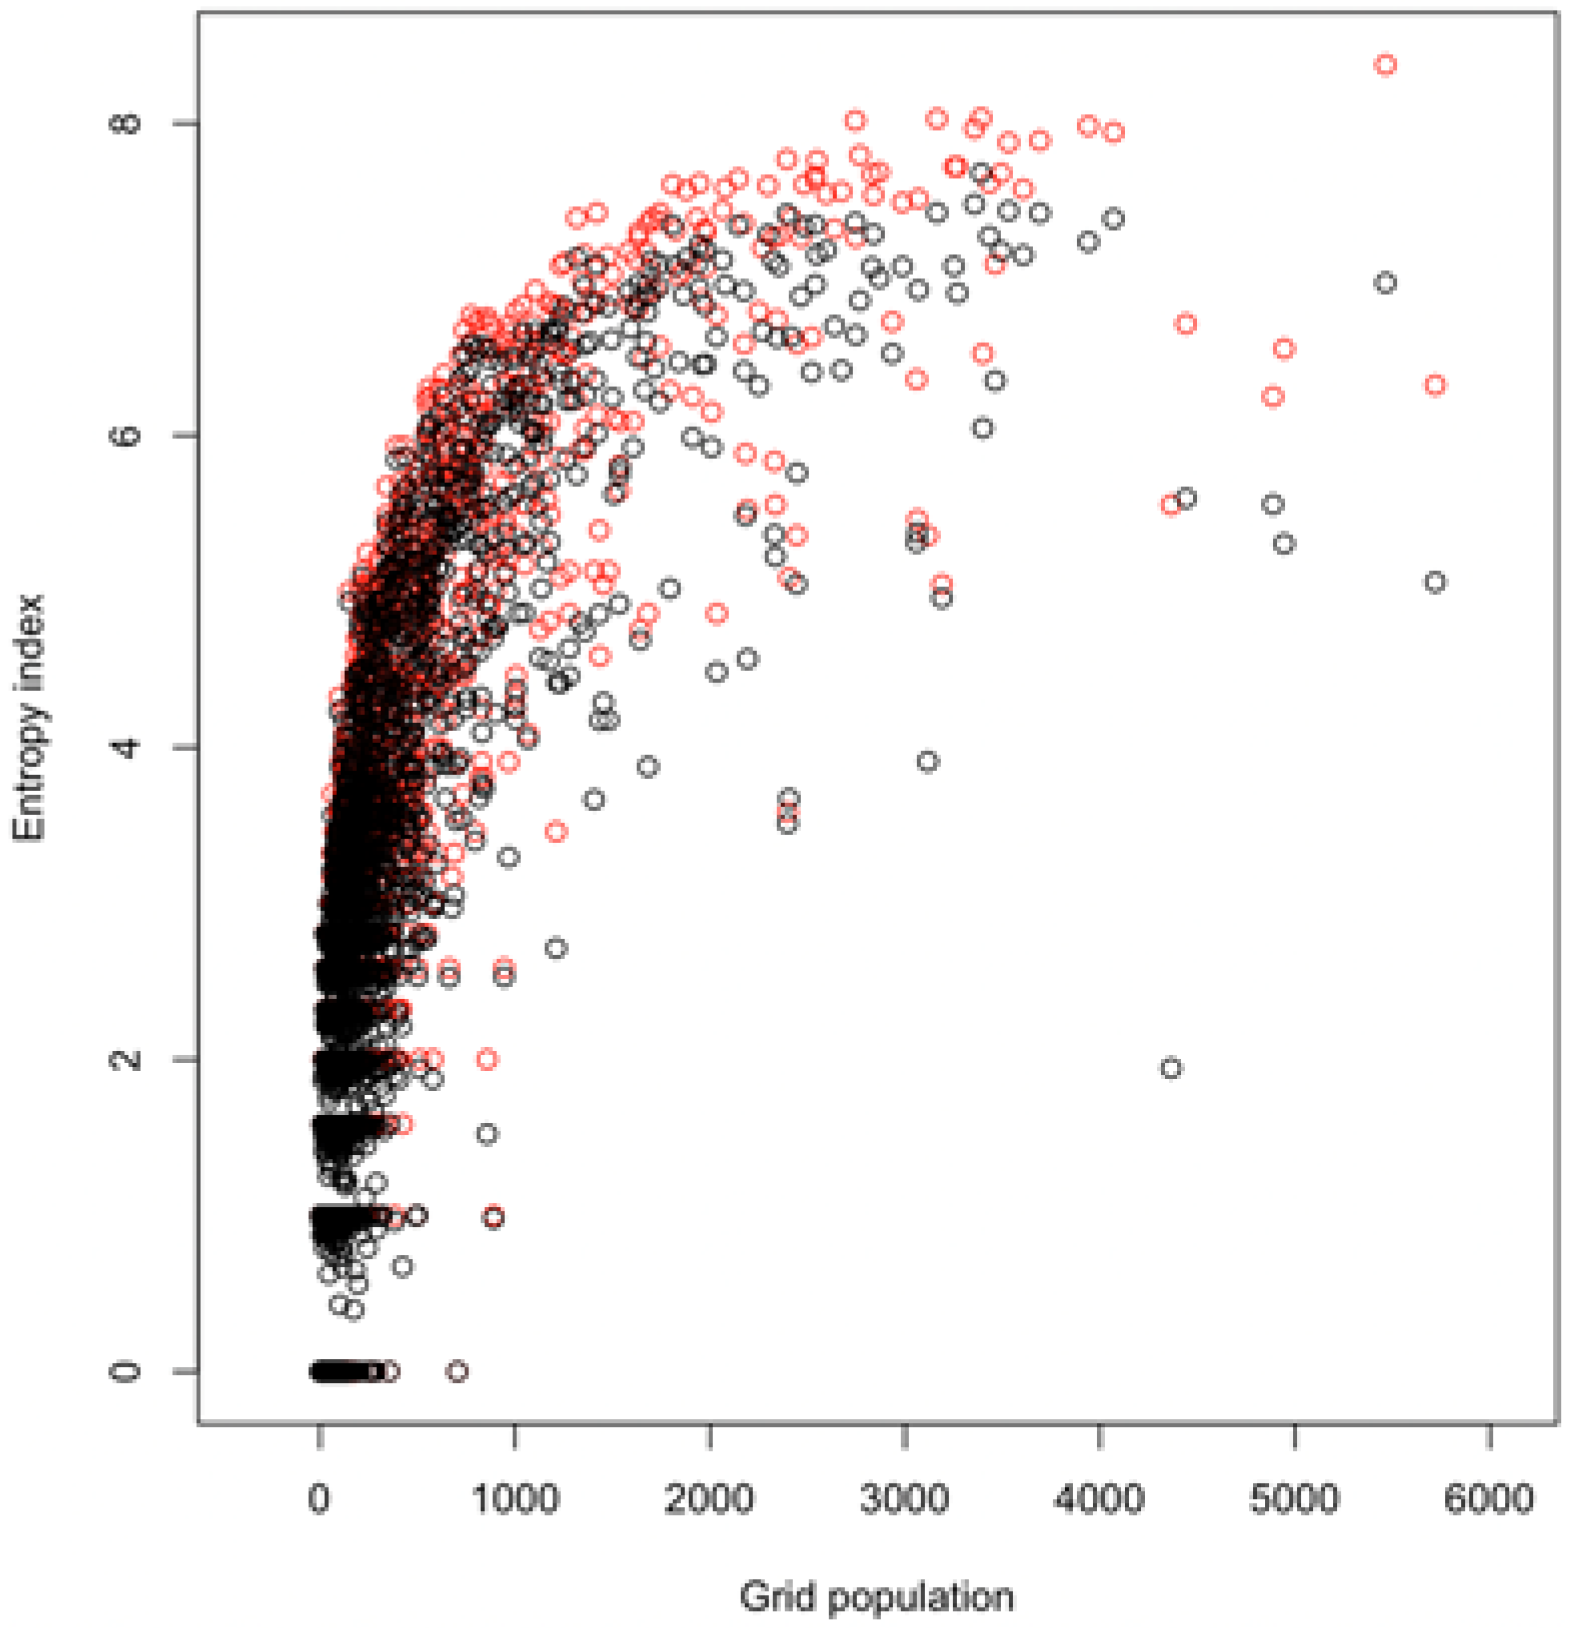
Table 3). Therefore, researchers should also normalize this metric with grid population when using grid-aggregate data (choosing destination diversity metric 2). The entropy index shows a log-normal relationship with grid population and correlates strongly with
since mathematically it is the maximum value of the entropy index (
Figure 4 and
Table 3). The entropy index needs to be normalized with
to provide more reasonable comparison among grids (choosing destination regularity metric 3). After excluding the size effects, the frequency, diversity and regularity are only very weakly correlated (Pearson’s
< 0.2), suggesting that the three indicators bear different information about residents’ mobility.
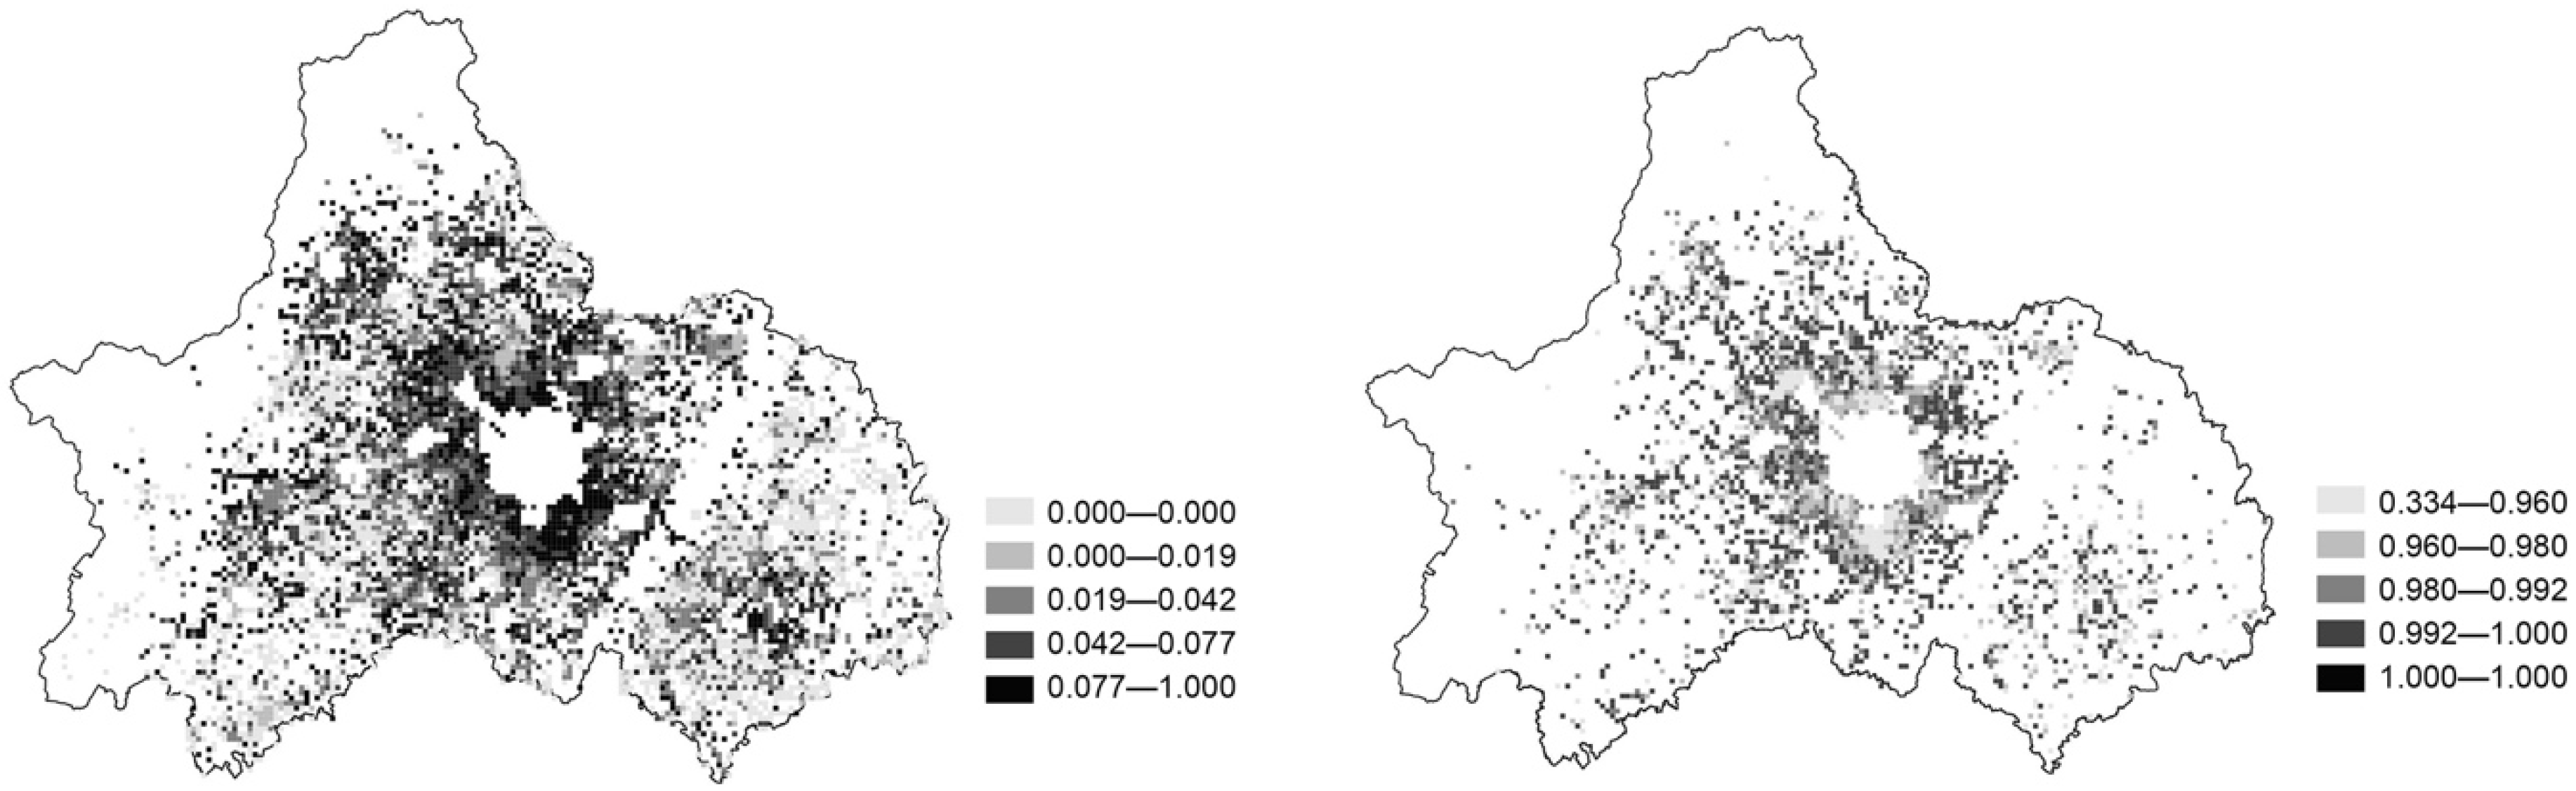
The analysis results of our study area are presented in
Figure 5. Different from the pattern of travel frequency, diversity of travel destination was generally higher around the central city. This could be because there are many more locations in the central city providing jobs, products and services within an accessible distance so that the residents in the same grid are likely to visit more places. Residents in more suburban or rural areas do not have as many choices. The randomness indicator generally takes a high value (mean = 0.97), suggesting that there is no significant difference in the number of visits to different activity locations associated with each home grid.
4.3. Spatial Range
We first examined the outputs of space size metrics 1, 2, 4 and 5, which were not normalized by grid population. The outputs of metric 1 (unweighted radius of gyration), metric 2 (weighted radius of gyration), and metric 4 (mean axis length of the unweighted standard deviational ellipse) were highly correlated with each other (Pearson’s
= 0.80–1,
Table 4). The mean axis length of the weighted ellipse of travel destination was the least similar to the other metrics (lowest Pearson’s
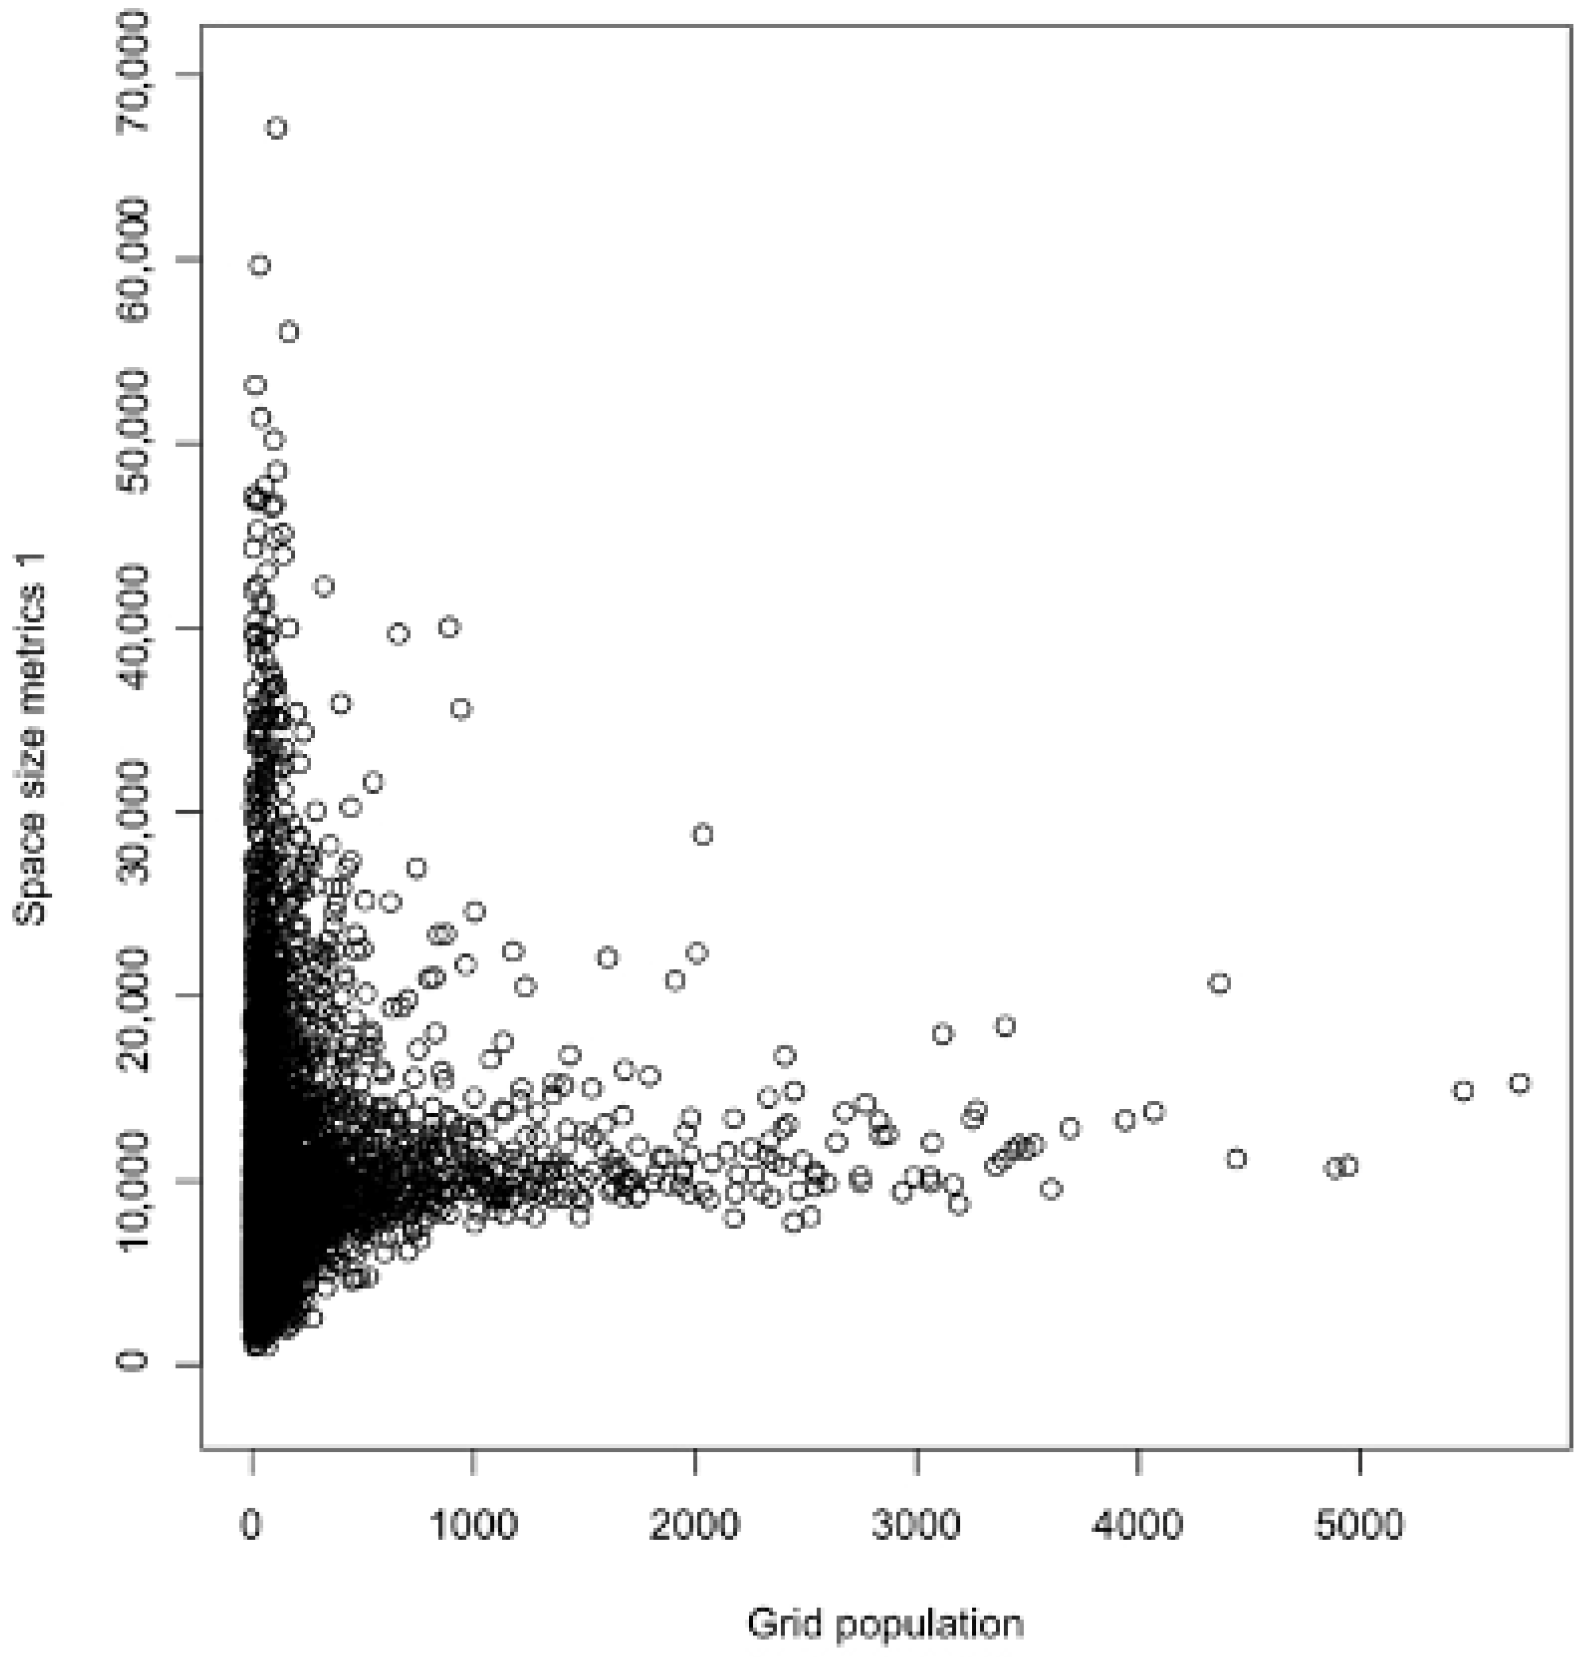
= 0.16) since it measured only the dispersion of activity locations. Nonetheless, it was still highly correlated with the output of metrics 1. Further, all the metrics were lowly correlated with grid population, suggesting that the spatial extent of residents’ activities does not increase with resident numbers and population normalization is not necessary (
Figure 6). Among the four metrics, the output of metric 1 is both technically the simplest and highly correlated with all other four algorithms, and thus encompasses most information produced by other metrics. Therefore, we recommend metric 1, the standard radius of gyration of all destinations visited by the residents of a grid, as the most appropriate metric for measuring the size of travel space with grid-aggregate data.
Regarding the two metrics for the shape of travel space, the outputs are again highly correlated (Pearson’s r = 0.90), suggesting that the weighted and unweighted center of the destinations do not deviate much from each other. Since the first metric (direction from a grid to the unweighted center of all destination grids) is technically simpler, we consider it preferable.
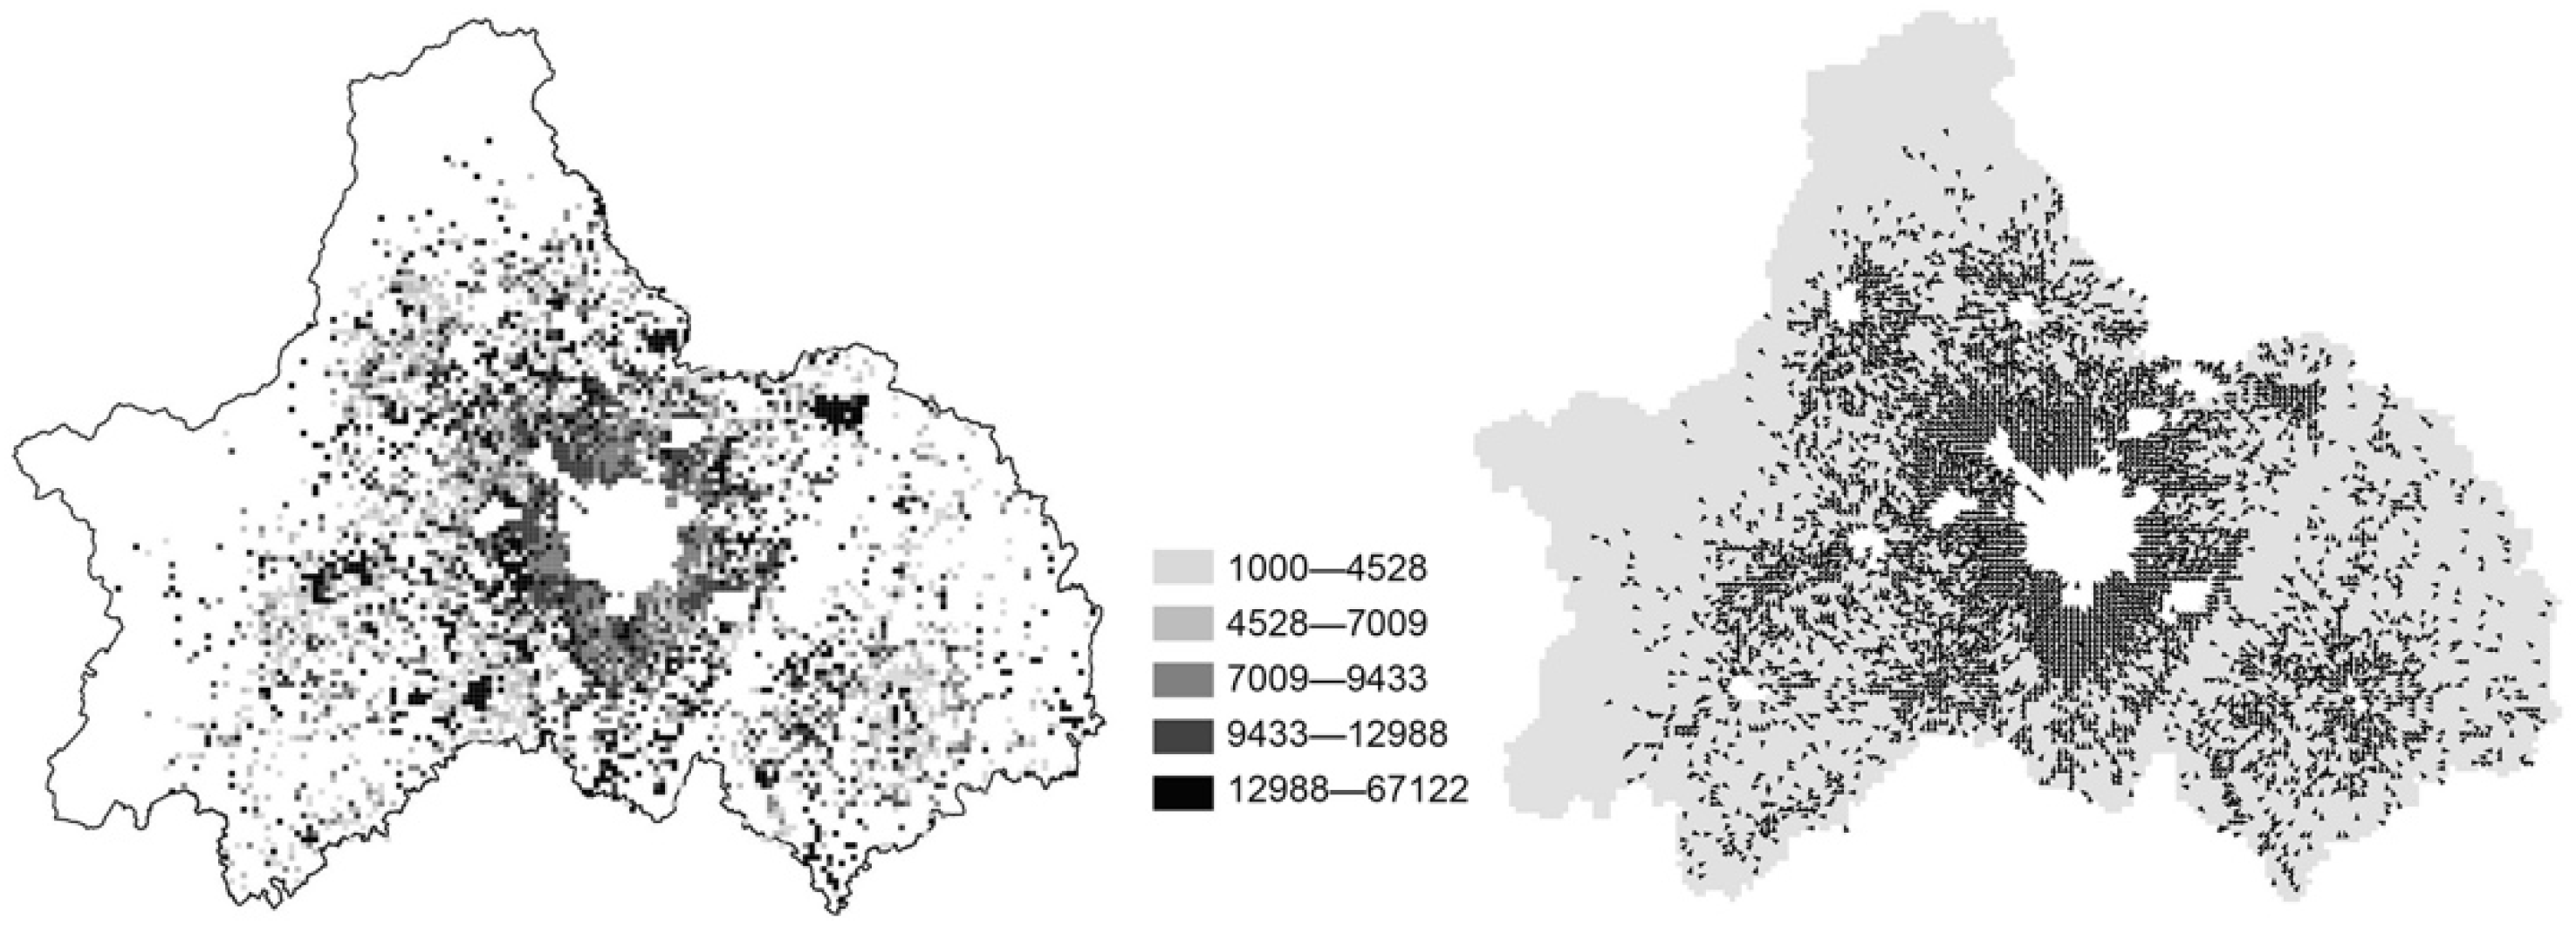
In our study area, the average value of the spatial range of mobility in all grids was 6.40 km on weekdays. For the grids that were identified with at least one travel destination outside the grid (67%), the average value of mobility range was 9.63 km. In terms of the spatial pattern, the areas surrounding the central city showed a uniform pattern of medium mobility ranges, while the areas farther away from the central city are highly mixed with large and small values of mobility ranges (
Figure 3). The analysis of the shape of travel space shows that the movements in a large proportion of the grids around the central city and the county centers are directed towards these urban areas and the central city (
Figure 7). The directions of the grids farther away from the city are more varied and irregular.
5. Discussion
This work explored the transformation of human mobility metrics on individual-level data to be used with grid-aggregate data. After identifying key aspects and common metrics for measuring individual mobility in existing studies, we proposed fifteen metrics for grid-aggregate data and compare their outputs with our data set. The proper transformation of mobility metrics involves the following methodological issues: (1) how travel frequency, destination diversity, regularity and space size change with the number of people being aggregated; (2) whether there are new factors that need to be considered with group mobility data and how much they impact the measurement; and (3) whether the reduction of spatial resolution by grids hinders the measurement of certain mobility aspects.
The experiment with our data set provides evidence to address the above issues. In terms of the relationship between group size and the mobility indicators, we found that travel numbers and destination numbers increased linearly with group size, the entropy index (regularity) increased linearly with the logarithm of destination number (and group size), yet the size of the space travelled barely changed with group size. While the trend of change in travel frequency and entropy index was consistent with theoretical deduction, the change in destination number and space size was interesting. It is reasonable to suppose that people living in the same grid would visit similar destinations (shops, restaurants, etc.), so the number of destinations visited would not increase significantly with grid population. Nonetheless, our results suggest a linearly increasing relationship, which may be explained by the high diversity of job locations. It is also reasonable to suppose that the size of a travel space would increase with grid population, since there would be a higher chance of observing people making long trips. Our results again suggest the opposite, which is consistent with some previous findings on individual mobility that one’s travel space becomes stable after being recorded for certain amounts of time [
3]. Therefore, these findings may reflect underlying laws of human mobility.
The weight of destinations in computing the travel space size is an additional factor that needs to be considered. When analyzing individuals’ one-day travel records, it is common that each destination is visited only once, so there is no need to consider the weight of each destination. For group-level travel records, the destinations might be visited a different number of times, so it is reasonable to take the visit numbers into consideration. However, our results suggest that the unweighted radius of gyration is able to encompass most information in other more complex metrics. In other words, the weights of destinations do not need to be a major consideration when measuring group-level mobility patterns.
Regarding the third issue, we find that there is not much difference in the regularity indicator (entropy index of the number of destination visits) across the grids in our study area. This might be because the irregularity in an individual’s mobility is averaged out in group-level data. Therefore, measuring irregularity of travel is not particularly meaningful when using group-level mobility data.
The application of these metrics on the data from Chengdu demonstrates that group-level mobility data, when analyzed with the proposed metrics, are able to reveal meaningful spatial patterns in people’s mobility. For example, the analysis results reveal clear differences in travel frequency, destination diversity and size of travel space across the study area. The patterns pose further questions about the factors that influence these aspects of residents’ mobility, which, though beyond the scope of the mobility algorithms proposed in this paper, need to be analyzed upon the results acquired from the mobility algorithms.
These mobility metrics are limited in probing the social well-being related to daily travel. Among the five mobility indicators, we can only deduce that high diversity of travel destinations suggests a rich choice of places within reach that are suitable for activities, which could be considered a condition of well-being. However, the relationship between other mobility indicators and social well-being is not completely clear. For example, a large travel space might indicate that roads and vehicles are easily accessible, while it may also indicate low opportunity accessibility, which means that people need to travel a far distance to fulfill their needs. Therefore, surveys would be needed to understand how certain mobility indicators relate to the social well-being of residents, which may also vary across regions and countries [
20].
6. Conclusions
This paper explores the transformation of individual-level mobility metrics to work with grid-aggregate mobility data in response to growing concerns about privacy leakage through mobility data. We identify three key aspects of human mobility analyzed by existing studies, which are travel frequency, destination distribution and spatial range of travel, and five common metrics for measuring these aspects. Developing from the commonly used individual-level metrics, we propose fifteen candidate metrics to fit with grid-aggregate data. Based on theoretical soundness and technical costs, we identify the most appropriate transformation for each of the five metrics, which are: (1) number of movements made by all residents of a grid divided by resident number for measuring travel frequency, (2) number of distinct locations visited by all residents of a grid divided by resident number for measuring destination diversity, (3) Shannon’s entropy of all the locations visited by the residents of a grid divided by the logarithm of the location number for measuring travel regularity, (4) unweighted radius of gyration of all the trips made by the residents of a grid for measuring the size of travel space and (5) direction from a grid to the center of all the locations visited by residents for measuring the shape of travel space. These metrics are able to encompass most of the information captured by other candidate metrics, and are relatively easy to implement. Further, through our empirical data, we provide evidence of three major methodological issues in developing group-level mobility metrics, which reflects some general rules of human mobility. Future research using grid-aggregate mobility data could refer to these recommended metrics to profile people’s mobility patterns without relying on highly privacy-sensitive individual-level data.
Author Contributions
Conceptualization, X.G.; methodology, X.G., L.L.; writing—original draft preparation, X.G., H.W.; writing—review and editing, X.G., H.W., L.L.; funding acquisition, H.W. All authors have read and agreed to the published version of the manuscript.
Funding
This study is funded by the National Natural Science Foundation of China (52008005) and Tsinghua-Toyota Joint Research Institute Cross-discipline Program.
Conflicts of Interest
The authors declare no conflict of interest.
References
- Jiang, S.; Fiore, G.A.; Yang, Y.; Ferreira, J., Jr.; Frazzoli, E.; González, M.C. A review of urban computing for mobile phone traces: Current methods, challenges and opportunities. In Proceedings of the 2nd ACM SIGKDD international workshop on Urban Computing, Chicago, IL, USA, 11 August 2013. [Google Scholar]
- Calabrese, F.; Ferrari, L.; Blondel, V.D. Urban Sensing Using Mobile Phone Network Data: A Survey of Research. ACM Comput. Surv. 2015, 47, 1–20. [Google Scholar] [CrossRef]
- González, M.C.; Hidalgo, C.A.; Barabási, A.-L. Understanding individual human mobility patterns. Nat. Cell Biol. 2008, 453, 779–782. [Google Scholar] [CrossRef]
- Schläpfer, M.; Dong, L.; O’Keeffe, K.; Santi, P.; Szell, M.; Salat, H.; Anklesaria, S.; Vazifeh, M.; Ratti, C.; West, G.B. The universal visitation law of human mobility. Nat. Cell Biol. 2021, 593, 522–527. [Google Scholar] [CrossRef] [PubMed]
- Calabrese, F.; Diao, M.; Di Lorenzo, G.; Ferreira, J.; Ratti, C. Understanding individual mobility patterns from urban sensing data: A mobile phone trace example. Transp. Res. Part C Emerg. Technol. 2013, 26, 301–313. [Google Scholar] [CrossRef]
- Dijst, M. Two-earner families and their action spaces: A case study of two dutch communities. GeoJournal 1999, 48, 195–206. [Google Scholar] [CrossRef]
- Chen, J.; Shaw, S.-L.; Yu, H.; Lu, F.; Chai, Y.; Jia, Q. Exploratory data analysis of activity diary data: A space–time GIS approach. J. Transp. Geogr. 2011, 19, 394–404. [Google Scholar] [CrossRef]
- Shoval, N.; Isaacson, M. Sequence Alignment as a Method for Human Activity Analysis in Space and Time. Ann. Assoc. Am. Geogr. 2007, 97, 282–297. [Google Scholar] [CrossRef]
- Shen, Y.; Kwan, M.-P.; Chai, Y. Investigating commuting flexibility with GPS data and 3D geovisualization: A case study of Beijing, China. J. Transp. Geogr. 2013, 32, 1–11. [Google Scholar] [CrossRef]
- Wang, Z.; He, S.; Leung, Y. Applying mobile phone data to travel behaviour research: A literature review. Travel Behav. Soc. 2018, 11, 141–155. [Google Scholar] [CrossRef]
- Jiang, S.; Ferreira, J.; Gonzalez, M.C. Activity-Based Human Mobility Patterns Inferred from Mobile Phone Data: A Case Study of Singapore. IEEE Trans. Big Data 2017, 3, 208–219. [Google Scholar] [CrossRef] [Green Version]
- De Montjoye, Y.-A.; Hidalgo, C.; Verleysen, M.; Blondel, V.D. Unique in the Crowd: The privacy bounds of human mobility. Sci. Rep. 2013, 3, 1376. [Google Scholar] [CrossRef] [PubMed] [Green Version]
- Xu, F.; Tu, Z.; Li, Y.; Zhang, P.; Fu, X.; Jin, D. Trajectory recovery from ash: User privacy is not preserved in aggregated mobility data. In Proceedings of the 26th International Conference, Perth, Australia, 3–7 April 2017. [Google Scholar]
- De Montjoye, Y.-A.; Gambs, S.; Blondel, V.; Canright, G.; De Cordes, N.; Deletaille, S.; Engø-Monsen, K.; Garcia-Herranz, M.; Kendall, J.; Kerry, C.; et al. On the privacy-conscientious use of mobile phone data. Sci. Data 2018, 5, 180286. [Google Scholar] [CrossRef] [PubMed]
- Xu, Y.; Shaw, S.-L.; Zhao, Z.; Yin, L.; Lu, F.; Chen, J.; Fang, Z.; Li, Q. Another Tale of Two Cities: Understanding Human Activity Space Using Actively Tracked Cellphone Location Data. Geogr. Mobilities Pract. Spaces Subj. 2018, 106, 246–258. [Google Scholar] [CrossRef]
- Yuan, Y.; Raubal, M. Analyzing the distribution of human activity space from mobile phone usage: An individual and urban-oriented study. Int. J. Geogr. Inf. Sci. 2016, 30, 1594–1621. [Google Scholar] [CrossRef]
- Boyce, D.E.; Williams, H.C. Forecasting Urban Travel: Past, Present and Future; Edward Elgar Publishing: Cheltenham, UK; Northampton, MA, USA, 2015. [Google Scholar]
- Pan, Y.; Darzi, A.; Kabiri, A.; Zhao, G.; Luo, W.; Xiong, C.; Zhang, L. Quantifying human mobility behaviour changes during the COVID-19 outbreak in the United States. Sci. Rep. 2020, 10, 1–9. [Google Scholar] [CrossRef]
- Zhao, Z.; Shaw, S.-L.; Yin, L.; Fang, Z.; Yang, X.; Zhang, F.; Wu, S. The effect of temporal sampling intervals on typical human mobility indicators obtained from mobile phone location data. Int. J. Geogr. Inf. Sci. 2019, 33, 1471–1495. [Google Scholar] [CrossRef]
- Xu, Y.; Belyi, A.; Bojic, I.; Ratti, C. Human mobility and socioeconomic status: Analysis of Singapore and Boston. Comput. Environ. Urban Syst. 2018, 72, 51–67. [Google Scholar] [CrossRef]
- Zhang, S.; Liu, X.; Tang, J.; Cheng, S.; Wang, Y. Urban spatial structure and travel patterns: Analysis of workday and holiday travel using inhomogeneous Poisson point process models. Comput. Environ. Urban Syst. 2019, 73, 68–84. [Google Scholar] [CrossRef]
- Castiglione, J.; Bradley, M.; Gliebe, J. Activity-Based Travel Demand Models: A Primer; The National Academies Press: Washington, DC, USA, 2014. [Google Scholar]
- Zhang, M.; Zhao, P. Literature review on urban transport equity in transitional China: From empirical studies to universal knowledge. J. Transp. Geogr. 2021, 96, 103177. [Google Scholar] [CrossRef]
- Houston, D.; Lo, A. Do Compact, Accessible, and Walkable Communities Promote Gender Equality? J. Transp. Geogr. 2018, 68, 42–54. [Google Scholar]
- Zhu, J.; Fan, Y. Daily travel behavior and emotional well-being: Effects of trip mode, duration, purpose, and companionship. Transp. Res. Part A Policy Pract. 2018, 118, 360–373. [Google Scholar] [CrossRef]
- Li, P.; Zhao, P.; Brand, C. Future energy use and CO2 emissions of urban passenger transport in China: A travel behavior and urban form based approach. Appl. Energy 2018, 211, 820–842. [Google Scholar] [CrossRef]
- Erlander, S.; Stewart, N.F. The Gravity Model in Transportation Analysis: Theory and Extensions; VSP: Utrecht, The Netherland; Tokyo, Japan, 1990. [Google Scholar]
- Song, C.; Koren, T.; Wang, P.; Barabási, A.-L. Modelling the scaling properties of human mobility. Nat. Phys. 2010, 6, 818–823. [Google Scholar] [CrossRef] [Green Version]
- Alessandretti, L.; Aslak, U.; Lehmann, S. The scales of human mobility. Nat. Cell Biol. 2020, 587, 402–407. [Google Scholar] [CrossRef] [PubMed]
- Xia, F.; Wang, J.; Kong, X.; Wang, Z.; Li, J.; Liu, C. Exploring Human Mobility Patterns in Urban Scenarios: A Trajectory Data Perspective. IEEE Commun. Mag. 2018, 56, 142–149. [Google Scholar] [CrossRef]
- Chan, H.F.; Skali, A.; Savage, D.A.; Stadelmann, D.; Torgler, B. Risk attitudes and human mobility during the COVID-19 pandemic. Sci. Rep. 2020, 10, 1–13. [Google Scholar] [CrossRef] [PubMed]
- El Shoghri, A.; Liebig, J.; Gardner, L.; Jurdak, R.; Kanhere, S. How Mobility Patterns Drive Disease Spread: A Case Study Using Public Transit Passenger Card Travel Data. In Proceedings of the 2019 IEEE 20th International Symposium on “A World of Wireless, Mobile and Multimedia Networks” (WoWMoM), Washington, DC, USA, 10–12 June 2019. [Google Scholar]
- Ahmouda, A.; Hochmair, H.H.; Cvetojevic, S. Using Twitter to Analyze the Effect of Hurricanes on Human Mobility Patterns. Urban Sci. 2019, 3, 87. [Google Scholar] [CrossRef] [Green Version]
- Chengdu Bureau of Statistics. Statistical Communiqué of Chengdu on the 2017 Economic and Social Development; Chengdu Bureau of Statistics: Chengdu, China, 2018. (In Chinese) [Google Scholar]
- Chengdu Directing Office for Cyber Security and Informationisation. Chengdu Internet Development Report; Chengdu Directing Office for Cyber Security and Informationisation: Chengdu, China, 2016. (In Chinese) [Google Scholar]
- Calabrese, F.; Pereira, F.C.; Di Lorenzo, G.; Liu, L.; Ratti, C. The Geography of Taste: Analyzing Cell-Phone Mobility and Social Events. In Database Systems for Advanced Applications; Springer: New York, NY, USA, 2010; pp. 22–37. [Google Scholar]
| Publisher’s Note: MDPI stays neutral with regard to jurisdictional claims in published maps and institutional affiliations. |
© 2021 by the authors. Licensee MDPI, Basel, Switzerland. This article is an open access article distributed under the terms and conditions of the Creative Commons Attribution (CC BY) license (https://creativecommons.org/licenses/by/4.0/).


