Article

Implications of Urban Land Management on the Cooling Properties of Urban Trees: Citizen Science and Laboratory Analysis

1
Université Clermont Auvergne, INRAE, PIAF, 63000 Clermont-Ferrand, France
2
Earthwatch Europe, Mayfield House, 256 Banbury Road, Oxford OX2 7DE, UK
3
ICube Laboratory, Université Strasbourg, CNRS, ENGEES, INSA Strasbourg, ICube, 67400 Illkirch, France
*
Author to whom correspondence should be addressed.
Present address: Institut Agro, Eco&Sols, Université Montpellier, CIRAD, INRAE, IRD, 34060 Montpellier, France.
Present address: CNES/CNRS/INRAE/IRD/UPS, Université de Toulouse, CESBIO, 31401 Toulouse, France.
Sustainability 2021, 13(24), 13656; https://doi.org/10.3390/su132413656
Submission received: 12 November 2021 / Revised: 1 December 2021 / Accepted: 4 December 2021 / Published: 10 December 2021

Abstract

:
Trees participate in mitigating the urban heat island phenomenon thanks to their transpiration and shading. This cooling potential is highly dependent on leaf area. Nevertheless, leaf traits potentially vary across different land management practices in urban settings, thereby challenging the models used to estimate thermal budgets. The present study aims to investigate the variability of leaf area traits of linden (Tilia spp.) urban trees, and their effect on simulated tree transpiration. Reconstruction of the leaf area was undertaken at the tree scale at three different urban land management sites from three cities: London and Birmingham (UK) and Chantilly (France). The reconstruction combined allometric measurements at shoot and leaf scales, and a tree-scale 3D digitization with laboratory analysis using field data collected by citizen scientists. The management practices had a significant impact on leaf area, and on tree allometric relationships, which were propagated through the reconstruction process. Relative differences between the management practices ranged between 12% and 48% according to the city where the variable was considered (e.g., leaf area index, total leaf area, or tree transpiration). Trees in managed sites (i.e., individualized leaf crowns, frequent leaf litter removal, and standard thinning/pruning operations) develop a higher leaf area, thus promoting cooling potential. This study shows that the variability of leaf traits, and their responses to different land management, can be studied by comprehensive data collection through citizen science and lab-based modelling. It also highlights the importance of appropriate, well-designed urban planning, where landscaping using urban trees can play an even better role in climate proofing cities.

1. Introduction

Urban living produces multiple benefits and opportunities for people and economic growth, yet it also brings major challenges, such as pressure on our resources, health, and lives [1,2]. Rapid global urbanization has meant that appropriate and sustainable planning and development of our cities has been limited, making them a vulnerable hotspot to climate change [3]. The phenomenon known as the urban heat island (UHI) effect is dramatically affecting cities and quality of life, and is directly related to poor vegetation and landscaping practices that include the usage of materials with low reflectivity to solar radiation in pavements [4,5,6].
Urban green spaces, such as parks, are proven to be cooler than the built environment and rich in grey infrastructure, especially when nature-based solutions, such as trees, are planted [7,8]. In fact, an increasing number of studies have reported the benefits of trees in urban areas. Some benefits of trees include environmental (e.g., habitat, cooling and carbon sink, and storage), health (e.g., lower obesity, faster recovery, and reducing stress), social (e.g., higher social cohesion, leisure spaces, and enhanced life quality), and economic-related (e.g., higher land and property values, reduced expenditure on air pollution removal, and lowered heating and cooling costs) fields [9,10]. Thus, greening cities has been popularized during the last decade as one strategy in urban planning and development [7], and has the potential to mitigate UHI [6]. However, the diversity of tree species, their growth, and their functioning, and that of land management practices, is overwhelming, thus complicating the role of urban planners to choose the most suitable tree species for a particular desired ecosystem service.
Quantification of the ecosystem services of trees, such as shading and air cooling [11], can be successfully described using simulation models that consider the associated functional and structural traits. Functional–structural plant models (FSPMs) combine both 3D-features of trees with their biophysical functions, such as radiative balance and transpiration [12]. These models allow one to evaluate the combination of factors between urban environments and tree species, where the 3D features are fundamental to mimic the structural characteristics of urban trees. Therefore, in comparison to the wide range of tested forest models available worldwide that represent the forest canopy as a homogeneous and continuous entity [13,14], FSPMs are most appropriate for the study of urban trees.
Studying the cooling potential of trees requires considering the canopy parameters that drive this ecosystem service, specifically leaf area [15], which directly drives shading and transpiration [8]. Nevertheless, to ensure a good estimate of air cooling by models, particular attention should be paid to the reconstruction of leaf area due to its high plasticity, which varies across different land management and growing conditions in urban settings [8,16]. The challenge imposed on parametrization by the variability of leaf traits can be overcome with abundant empirical data collection. The need for empirical data is particularly relevant when parameterization of the leaf area is achieved by allometric relationships. Detecting significant effects of a given factor requires comprehensive quantification of its range of variability, which may be insured by extensive data collection and contrasted situations. Citizen science (CS) can help one to overcome this challenge, where, given the appropriate methodological development and training, the needed database of leaf traits can be obtained for creating allometric relationships.
The present study aims to investigate the variability of leaf area traits and estimate the transpiration of linden urban trees grown in different land management settings. Meeting this aim was made possible by utilizing leaf trait empirical data from linden trees collected through citizen science in a FSPM. The research involved simple but fundamental field measurements undertaken by CS, which fueled a reconstruction of the leaf area at the tree scale by an allometric approach. The present study illustrates: (i) the significant contribution of CS to a research framework that was aimed at understanding the contribution of urban trees to the cooling effect, (ii) the impact of the growing conditions set by land and tree management practices in urban environments, and (iii) the consequence of such impacts on cooling potential through tree transpiration. Finally, this research suggests the implications that the different tree growing conditions may have for the radiative balance, which is key to consider in future tree planting and management as a potential mitigation method to UHI.

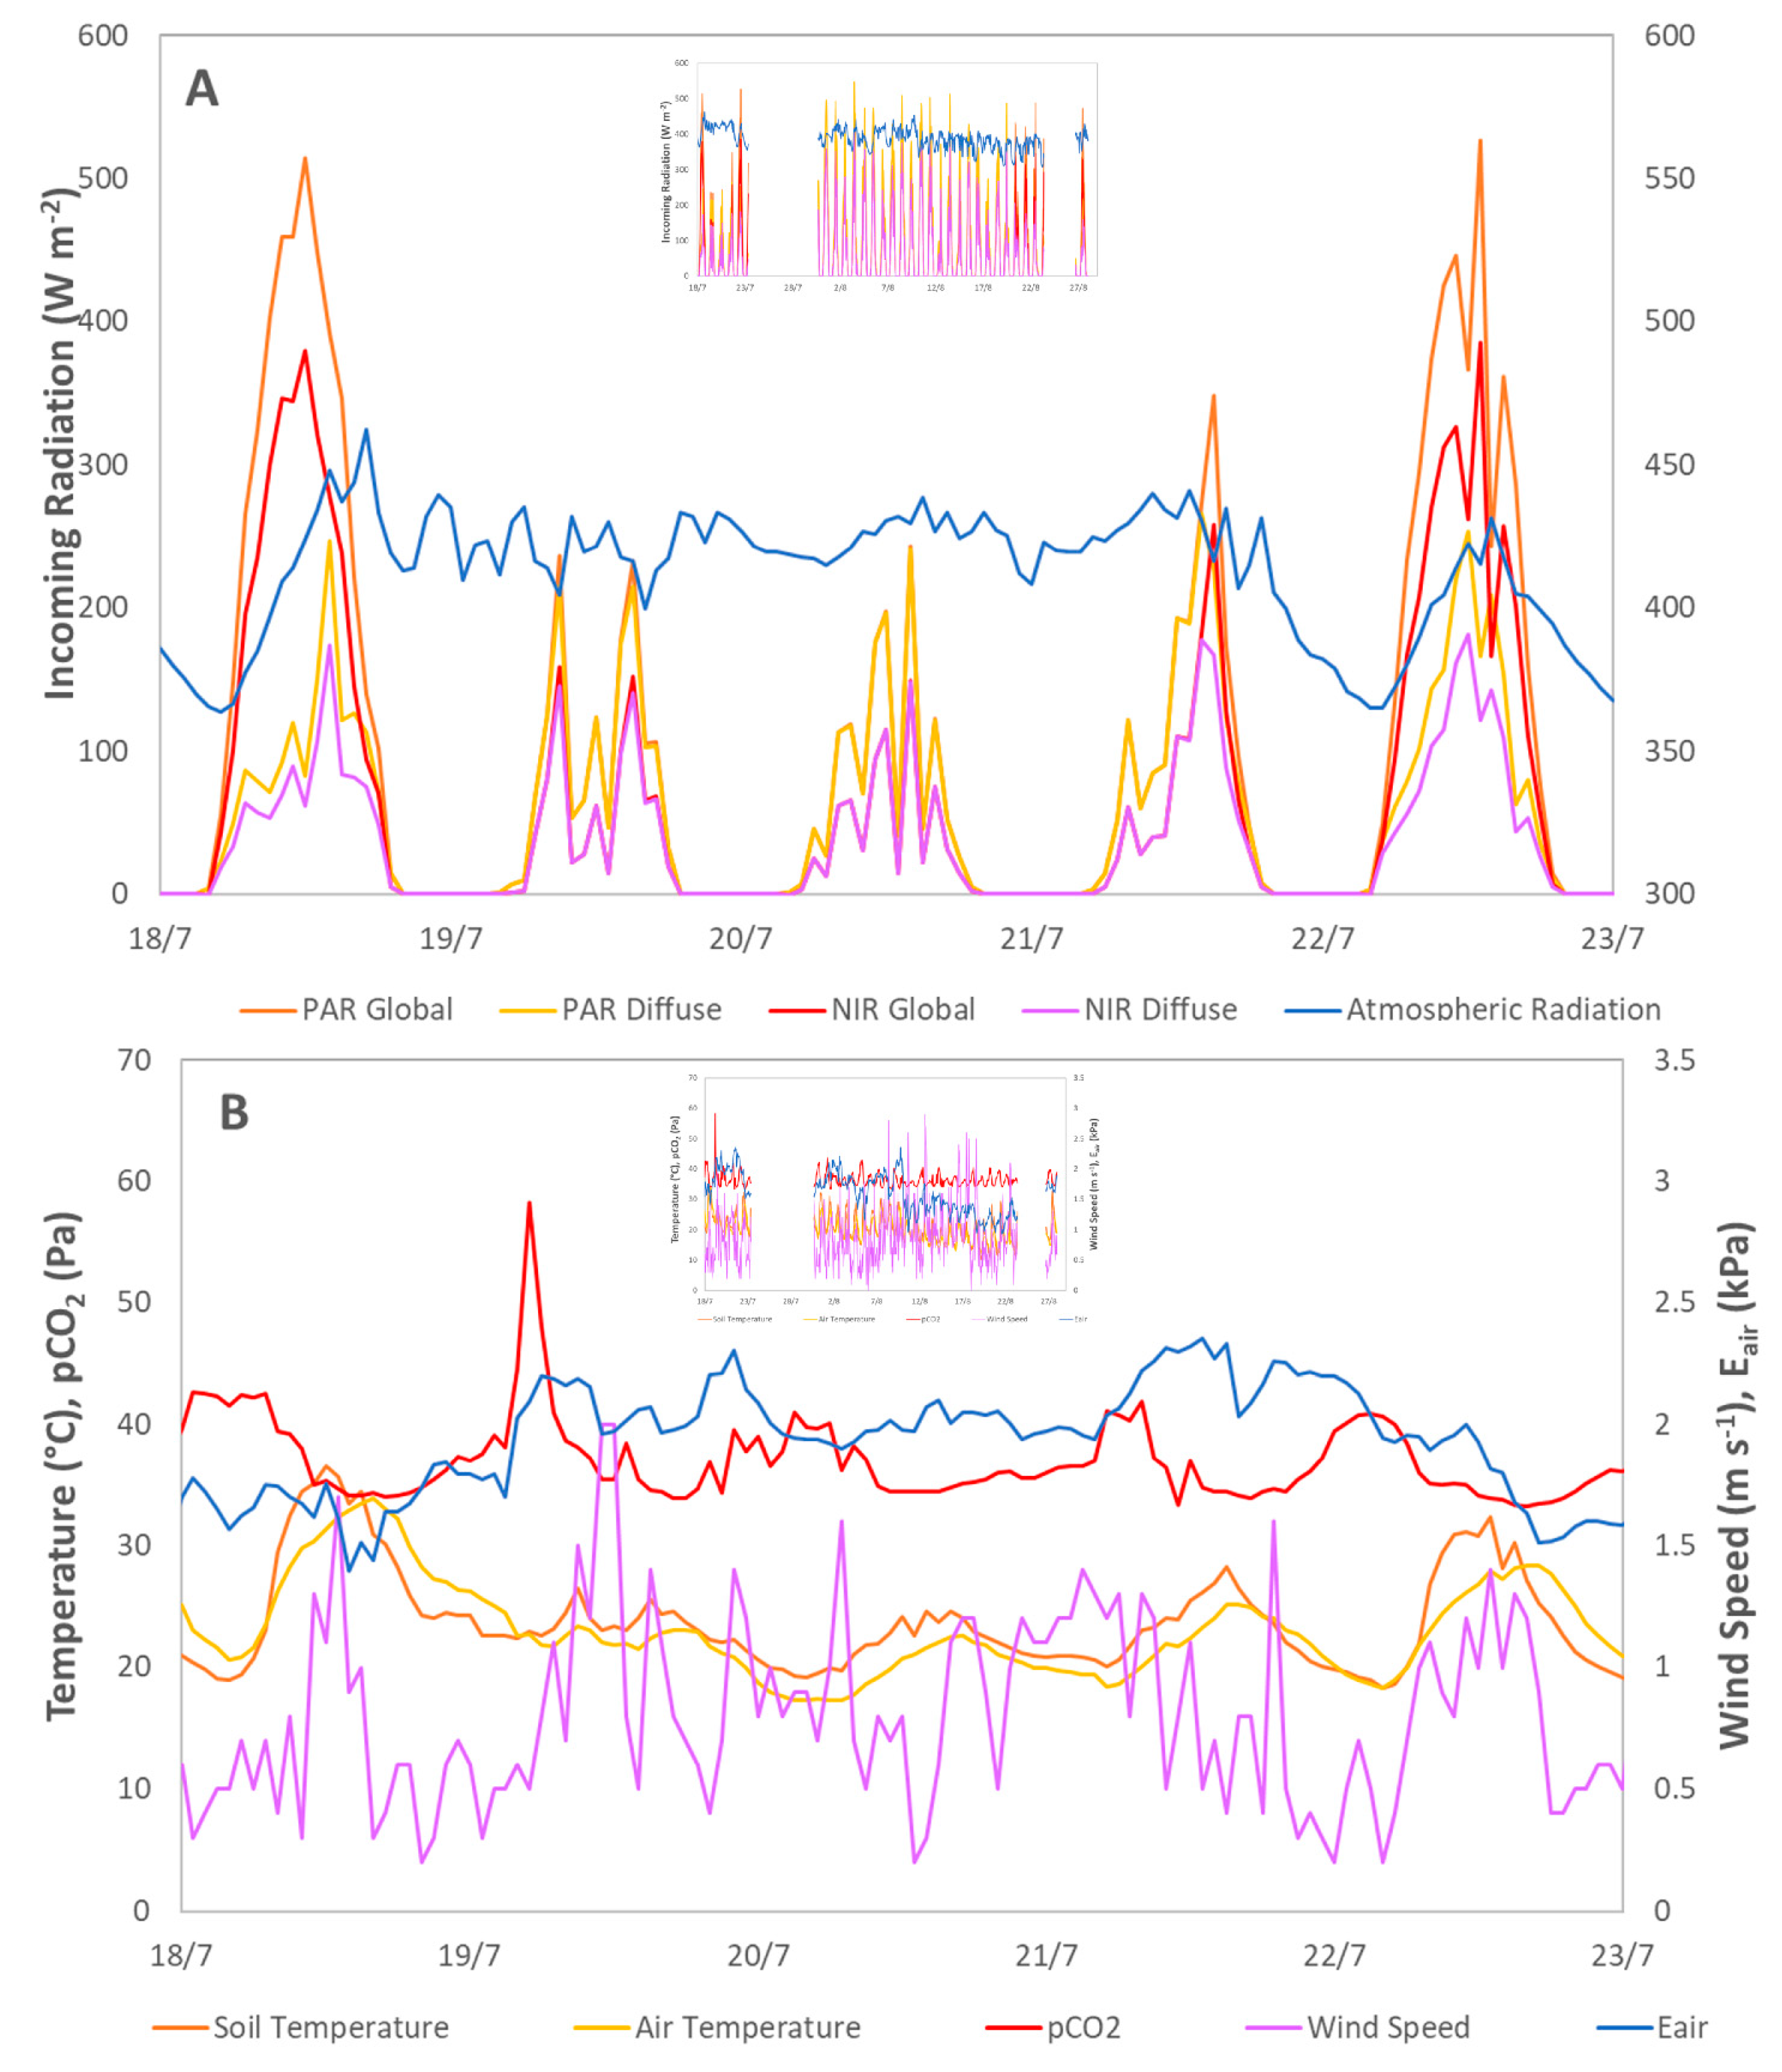
2. Materials and Methods

2.1. Study Sites

The study was carried out in three urban parks each located in one western European city: Cannon Hill Park (CH) in Birmingham and Kew Garden (KG) in London, United Kingdom, and Les Fontaines (LF) in the Serge Kampf campus in Gouvieux, France (Table 1).
The mean annual air temperature and precipitation for these site locations were 9.7 °C and 769 mm (CH), 10.8 °C and 690 mm (KG), and 10.3 °C and 731 mm (LF), respectively (annual means of 2018 and 2019). Each park had two land and tree management practices (hereafter referred to ‘management practices’), and each land management practice had three study trees (Table 1). Management practices were as follows: ‘Unmanaged’ (hereafter denoted UM) trees were characterized by growth conditions similar to high tree density plots (contiguous leaf crowns), no leaf litter removal, no removal of weeds, no mowing, and no thinning/pruning operations; ‘Managed’ trees (hereafter denoted MA) were characterized by open space growth conditions (individualized leaf crowns), frequent leaf litter removal, and standard thinning/pruning operations; ‘Highly Managed’ trees (hereafter denoted HM) were treated like the ‘Managed’ trees, but they were in a small square area of soil pits surrounded by asphalt acting as a very highly sealed surface.
The tree studied was the linden (Tilia spp.), which is among the main planted tree species across European cities [17] as well as native to the continent. It was selected for this research since it is a common and native species to all the locations (cities) of research. Linden trees have a relatively good shade-tolerance, and are a warmth-demanding species, especially for the production fertile seeds. They are also tolerant to drought and short-term flooding, as well as to a wide range of soil fertility and soil texture types (see [18] and references within for a broader review of Tilia autoecological characteristics). The trees were 30 to 35 years old in the CH and KG sites, and 20 to 24 years old in the LF site.

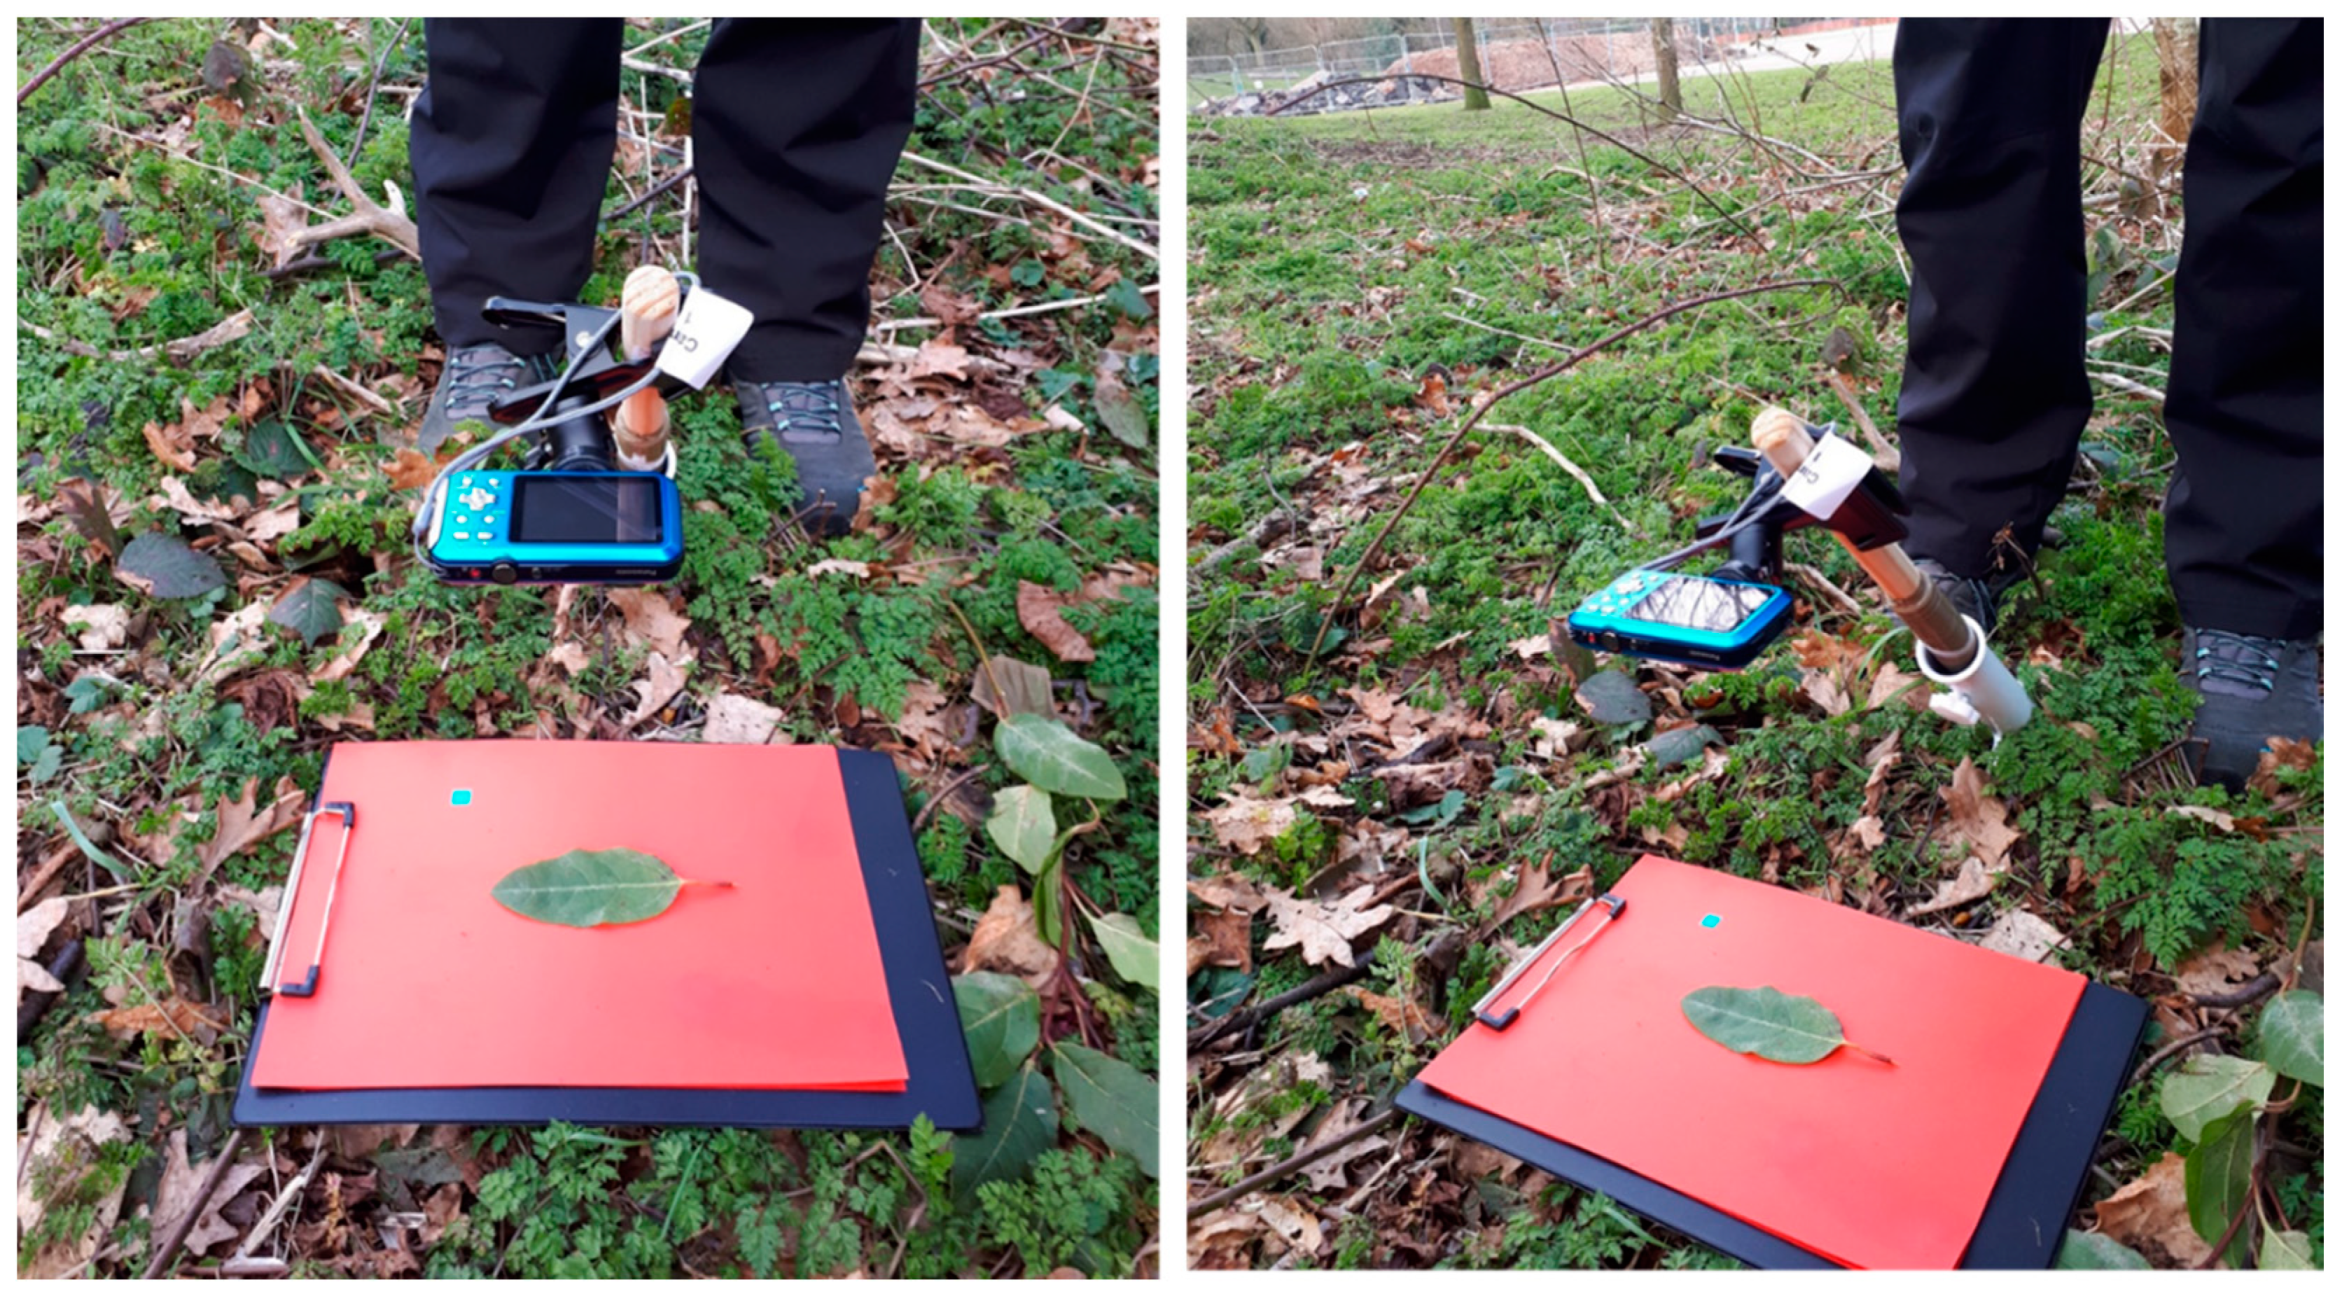
2.2. Field Measurements by Citizen Scientists

The field measurements were carried out at 2 day events during the growth season in 2018 and 2019 for each one of the studied urban parks (Table 2).
During each session, groups of citizen scientists were trained to carry out the field measurements and sample collection. Each group (ca. 12 citizen scientists) was supervised by at least two senior researchers from either the INRAE or CNRS, and the Earthwatch Institute. For each study tree, six (2018) and two (2019) leafy shoots were taken from within the leaf crown following the north–south orientation of the tree as well as the depth within the crown (outer, middle, and inner). All leaves were sampled at mid-crown height (i.e., 3 m to 4.5 m high). The measurements undertaken by the citizen scientists included the length of each leafy shoot (SL) as well as the number of leaves (NL). Each leaf was photographed by placing it on a red sheet with a blue reference surface, without the petiole. For a given citizen scientist group, the camera was fixed on a rod itself inserted into the ground, thus the images were taken under the same frame and inclination angle (Panasonic DMC FT-30, Figure 1). Sampled leaves were taken back to the laboratory (Department of Geography and Environmental Sciences, University of Reading) for drying and weighing. A subsample of leaves was measured with a planimeter (Licor-3000C equipped with a conveyor, Licor, Lincoln, MI, USA) to benchmark the leaf area determined from the images.

2.3. Laboratory Analysis

2.3.1. Leaf Dimensions Computation

The leaf images obtained by the citizen scientists were processed to determine their length (LL), width (LW), and area (LA) by using PlaniPIAF software [19]. The PlaniPIAF software analyzes the RGB channels of each image pixel, and it identifies the green-dominated ones from the others. This thresholding allows one to count the number of green pixels. The same operation was performed for the blue channel to select the blue reference surface only (of known area, 1 cm2), which thus enabled the computation of the area of a pixel. This procedure was also applied for three green rectangles of known area (2.4 cm2, 28.7 cm2, and 100 cm2). This latter step enabled us to take into account the possible parallax bias occurring on the blue reference square due to the camera orientation. A rectangle was drawn digitally following the axis of the leaf midrib for the computation of the leaf area. The edges of the rectangle were set by those of the leaf to include the entire leaf. The dimensions of the rectangle therefore gave the length (LL) and width (LW) of the leaf.

2.3.2. Allometric Relationships at Leaf and Shoot Scales

To reconstruct the 3D leaf cloud of a given tree, two fundamental sets of data are required: the leaf area (total amount, value at leaf scale, and basal shape of the leaf), and its spatial distribution within the crown (described in the next section). The leaf area was reconstructed following [20] an allometric approach based on the shoot length (SL). Therefore, the following linear relationships were applied using the CS data:
NL = aNL . SL
TLA = aTLA . SL
where NL is number of leaves, SL is shoot length, a is slope of the linear relationship, and TLA is total leaf area of a given shoot computed as the sum of all single measured LA values. Then, calculating single LA by dividing TLA by NL (from Equations (1) and (2)), the following relationship can be defined:
LL2 = aLL2 . LA
where the LL (leaf length) is computed from LA (leaf area). Finally, the LW (leaf width) was computed as:
LW = aLW . LL
Each equation was fitted to each site and management practice sub-dataset. If, at a given site, a relationship did not differ significantly between the two management practices, a common relationship was determined and applied for the subsequent reconstruction

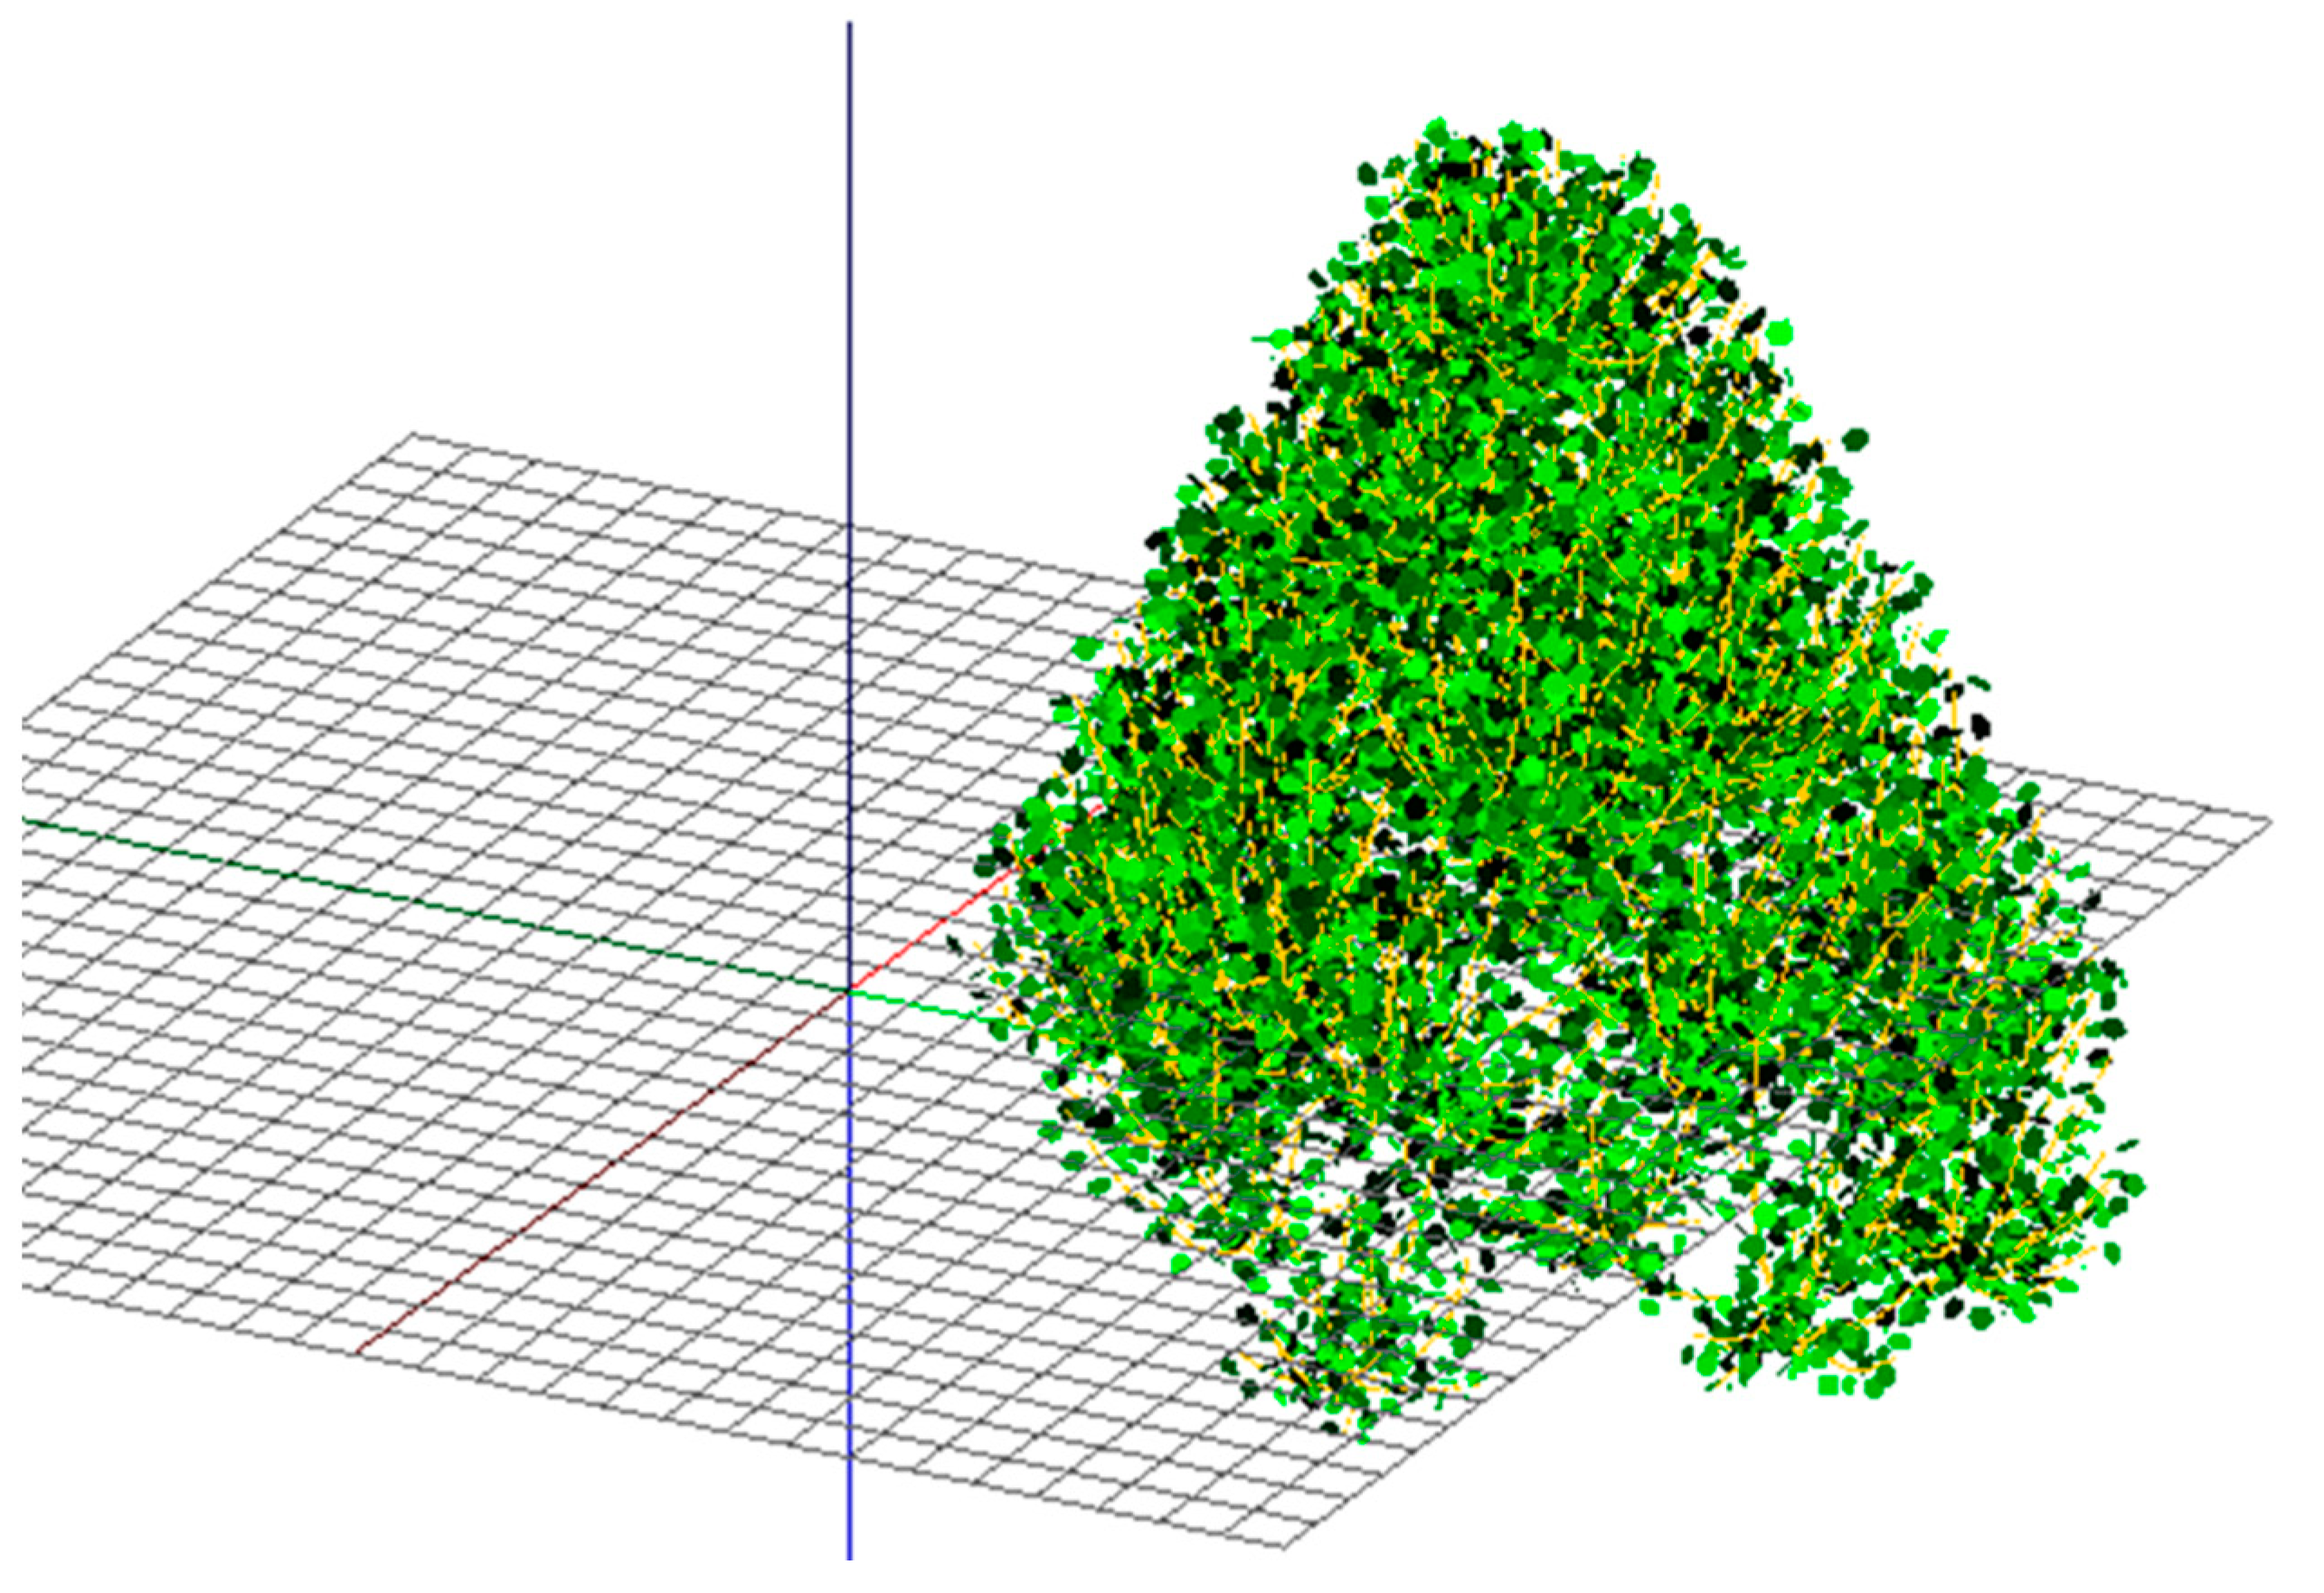
2.3.3. Reconstruction of Trees, Estimate of Tree Metrics, and Simulations

To analyze the effect of leaf traits on tree transpiration rate and shading, a 3D linden tree was reconstructed using the allometric relationships obtained for each growing condition. For relocating these reconstructed leaves in a 3D space, a model tree based on a linden tree scanned by terrestrial LiDAR in the city of Strasbourg, France, was used [16]. Based on the 3D mock-up of shoots, the leaves were reconstructed by applying Equations (1)–(4) (see above). A third set of data related to tree leaf orientation were not assessed in this study; thus, we used a plagiophile distribution, in good agreement with [21].
The VegeStar software [22] was used in order to estimate the tree crown characteristics of each 3D mock-up including: (i) the TLA scaled up to crown level; (ii) the projected leaf area (PLA), defined as the area of the vertical projection of the leaf crown on the ground; and (iii) the ability to intercept diffuse light estimated from the diffuse STAR (surface to total area ratio [23]) value. For a given angular direction (ω), the STARω is the ratio between the PLA for this direction (PLAω) and the TLA. The diffuse STAR (STARdif) is calculated as:
STARdif = ∑ω βω . STARω
where βω is a scalar representing the weight of the angular direction (ω). A skyvault discretized into 46 angular sectors, with each sector weighted according to the standard overcast sky (SOC) function, [24]) was used. The leaf area index (LAI) was calculated as the PLA/TLA ratio. Finally, the leaf area density (LAD) and the crown volume (Vc) were computed by inserting each tree crown in a regular grid in three-dimensional space based on 0.2 × 0.2 × 0.2 m voxels.
A functional–structural plant model (RATP, [25]) was used to assess the impact of management practices on tree transpiration via the reconstructed leaf area. Briefly, the model used a 3D voxel grid filled with each tree foliage, and a radiative balance on the visible and infrared wavebands was first performed. Then, the energy budget was closed according to incoming and outcoming fluxes in each voxel, of which one of the members was the latent heat flux that was proportional to tree transpiration (TR). The TR flux was modulated by stomatal conductance, itself responding to main meteorological variables (incoming photosynthetically active radiation (PAR), air temperature and relative humidity, and wind speed). A detailed description of the model and of the parameters can be found in [16,25], respectively. TR was simulated at an hourly time step for all the reconstructed 3D mock-ups, but with common meteorological data (over one month with various weather conditions, Figure 2) and leaf parameters (stomatal responses and inclination angle distribution). The meteorological data were measured at Strasbourg city center (France, see [16]). Thus, the variations of TR among the six mock-ups should only reflect variations in leaf area and allometric relationships among the land use and tree management practices.

2.3.4. Statistical Analyses

The relationship of Equation (1) to Equation (4) (Section 2.3.2) was assessed by linear regression. One-way analyses of variance (ANOVA) were performed to test the effect of management practice as the main factor. The data of each park were analyzed separately, to avoid possible interactions between the main factor and the park, which do not have common management practices among them (rendering their comparison meaningless). The unbalanced sampling number amongst the different land and tree managements was addressed by using type III of the sum of squares for the different ANOVAs. An analysis of covariance (ANCOVA) was performed for which the X-variables (namely the shoot length, and single and squared leaf length) were the dependent variables, the Y-variables (namely the total leaf area of the shoot, number of leaves per shoot, single leaf area, and leaf width) were the co-variables, and the land and tree management practice was the factor. To test the possible effect of the factor on the linear relationships, the interaction terms between the Y variables and the factor were checked. For both ANOVA and ANCOVA analyses, generalized linear models were used in order to fulfill the linearity, normality, and homoscedasticity assumptions of the model residues. The gamma family with the identity link function was used to fulfill those assumptions. All analyses were performed with the car package [26] under R software [27] with a significance level of p < 0.05.

3. Results

3.1. Field Measurements and Leaf Dimensions

  • The time dedicated by the citizen scientists to data collection was of a total of 70 h (14 sessions, each one lasting two and a half hours), during which the citizen scientists gathered data and fresh samples of nearly 2500 leaves and 360 shoots (Table 2) from the three sites. If travelling time to the study sites is considered (two days per session, in average), then the total time that two researchers would have taken to collect the leaf data and samples would have been an entire month (around 240 h).
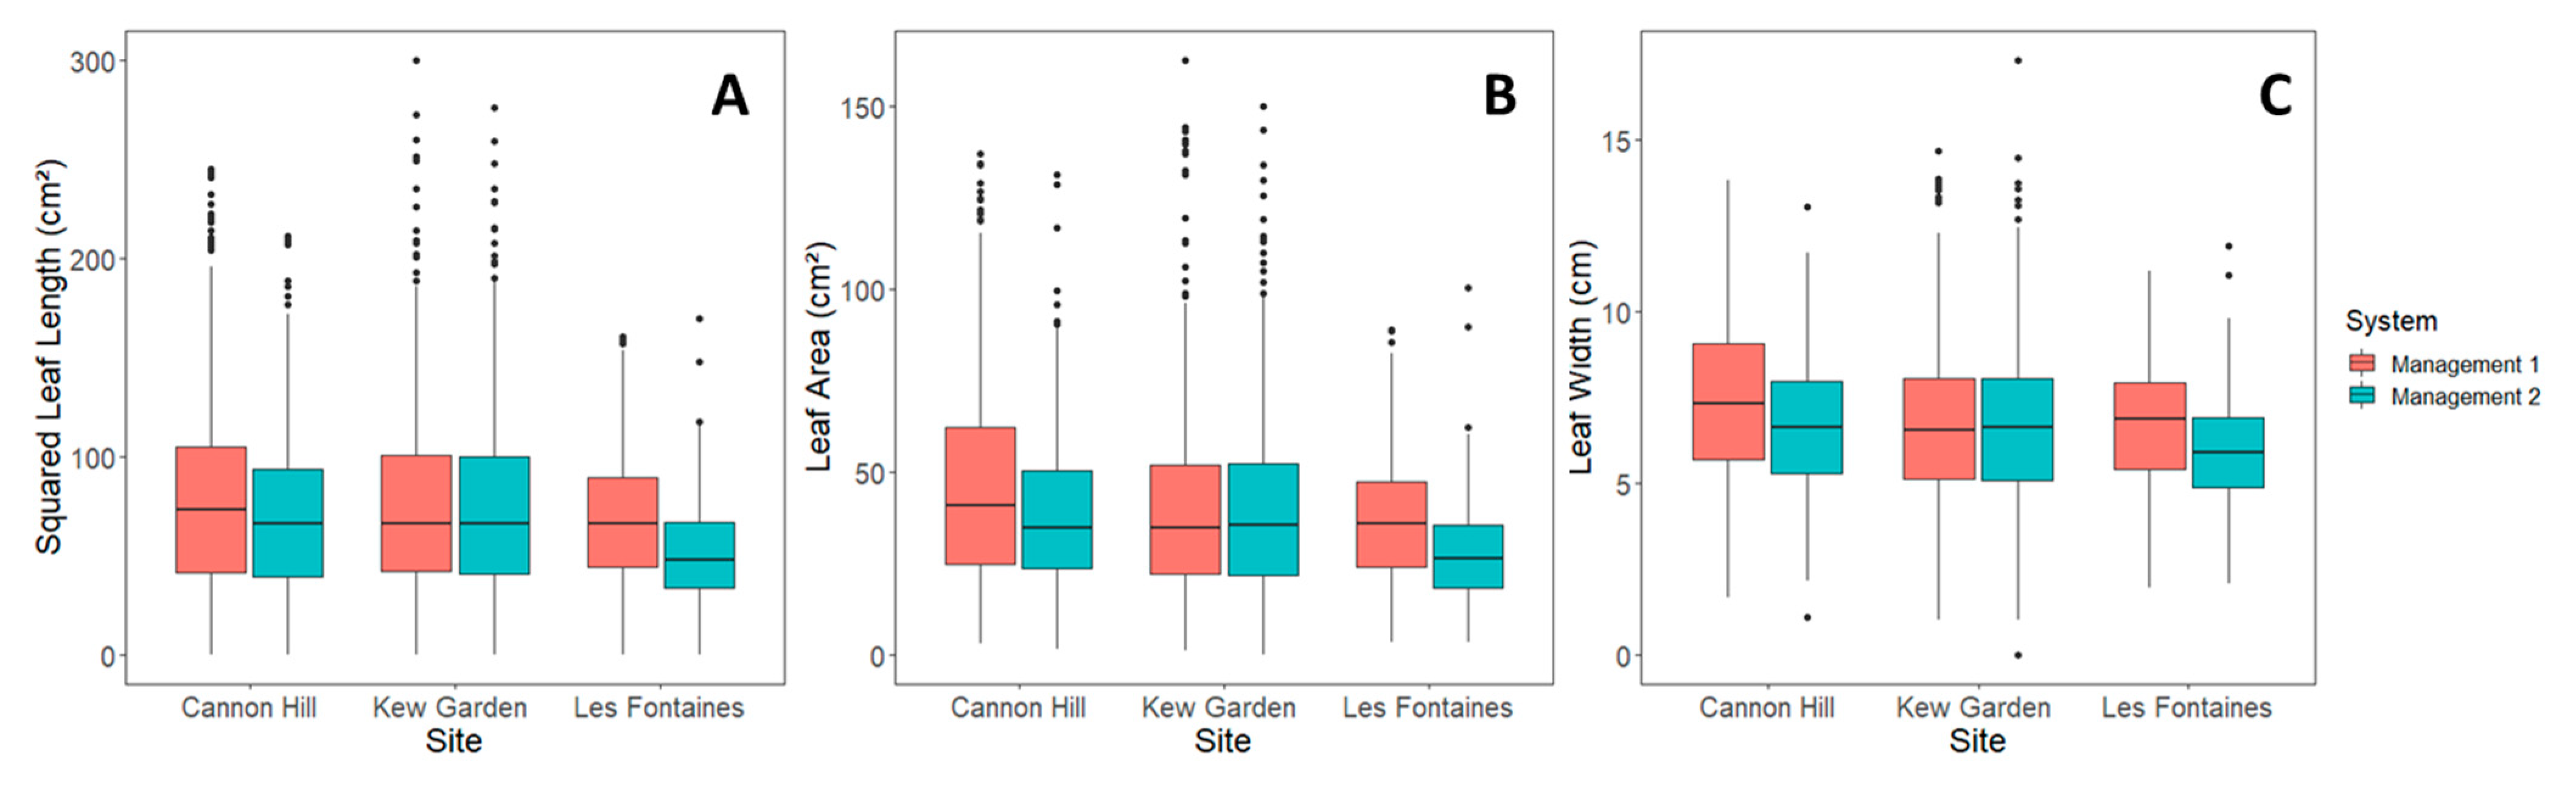
  • At the leaf scale, the mean LA, LL2, and LW differed significantly among the management practices at the CH and LF sites (Figure 3). The leaves of the UM trees and the MA trees were smaller than the other management practices in these two sites.
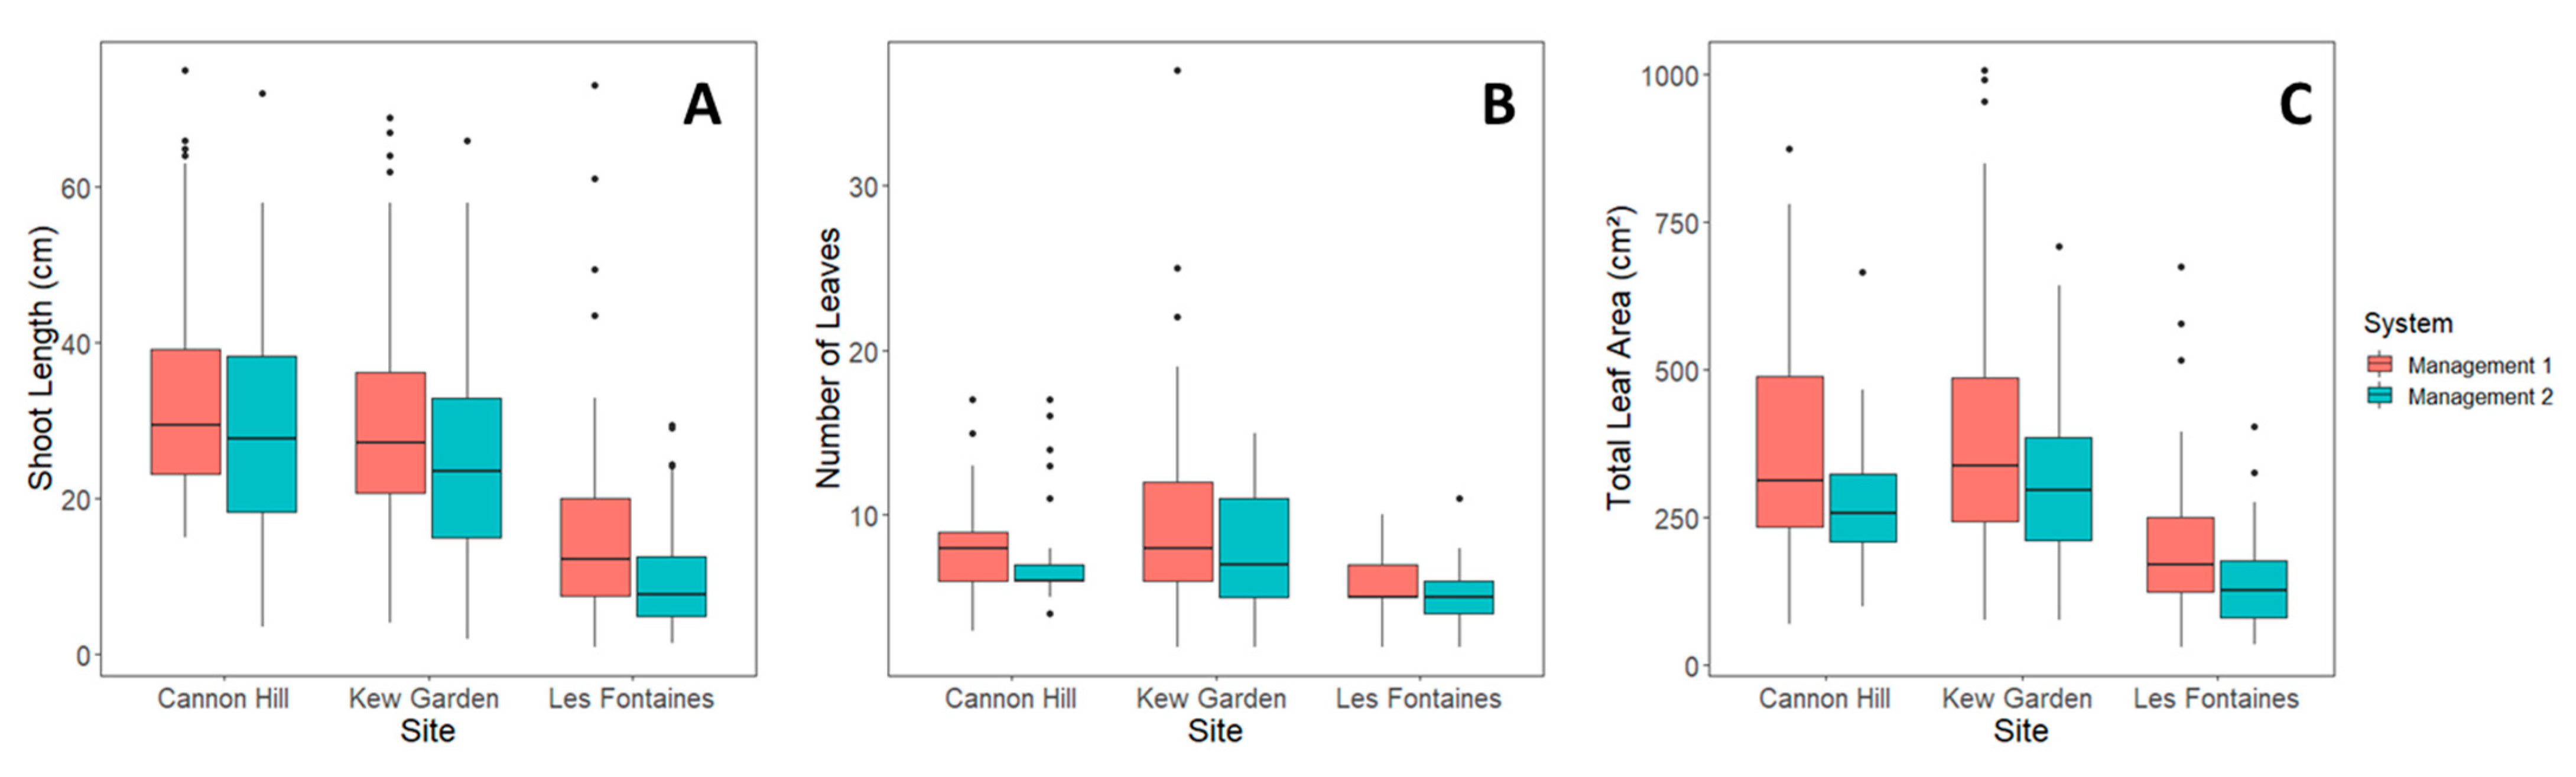
  • At the shoot scale in all sites, the management practice significantly affected the total leaf area held by a single shoot. The mean TLA was significantly higher in the MA (CH and KG) and HM (LF) trees (Figure 4). The same applies for NL at the CH and LF sites only. The SL was significantly higher in the HM trees at the LF site only.

3.2. Allometric Relationships

  • At the shoot scale, NL was significantly related to SL (Equation (1), but no significant interaction was found with management practice (Figure 5). TLA was significantly related to SL (Equation (2)), with a significant interaction with the management practices in the CH and KG sites (Figure 6).
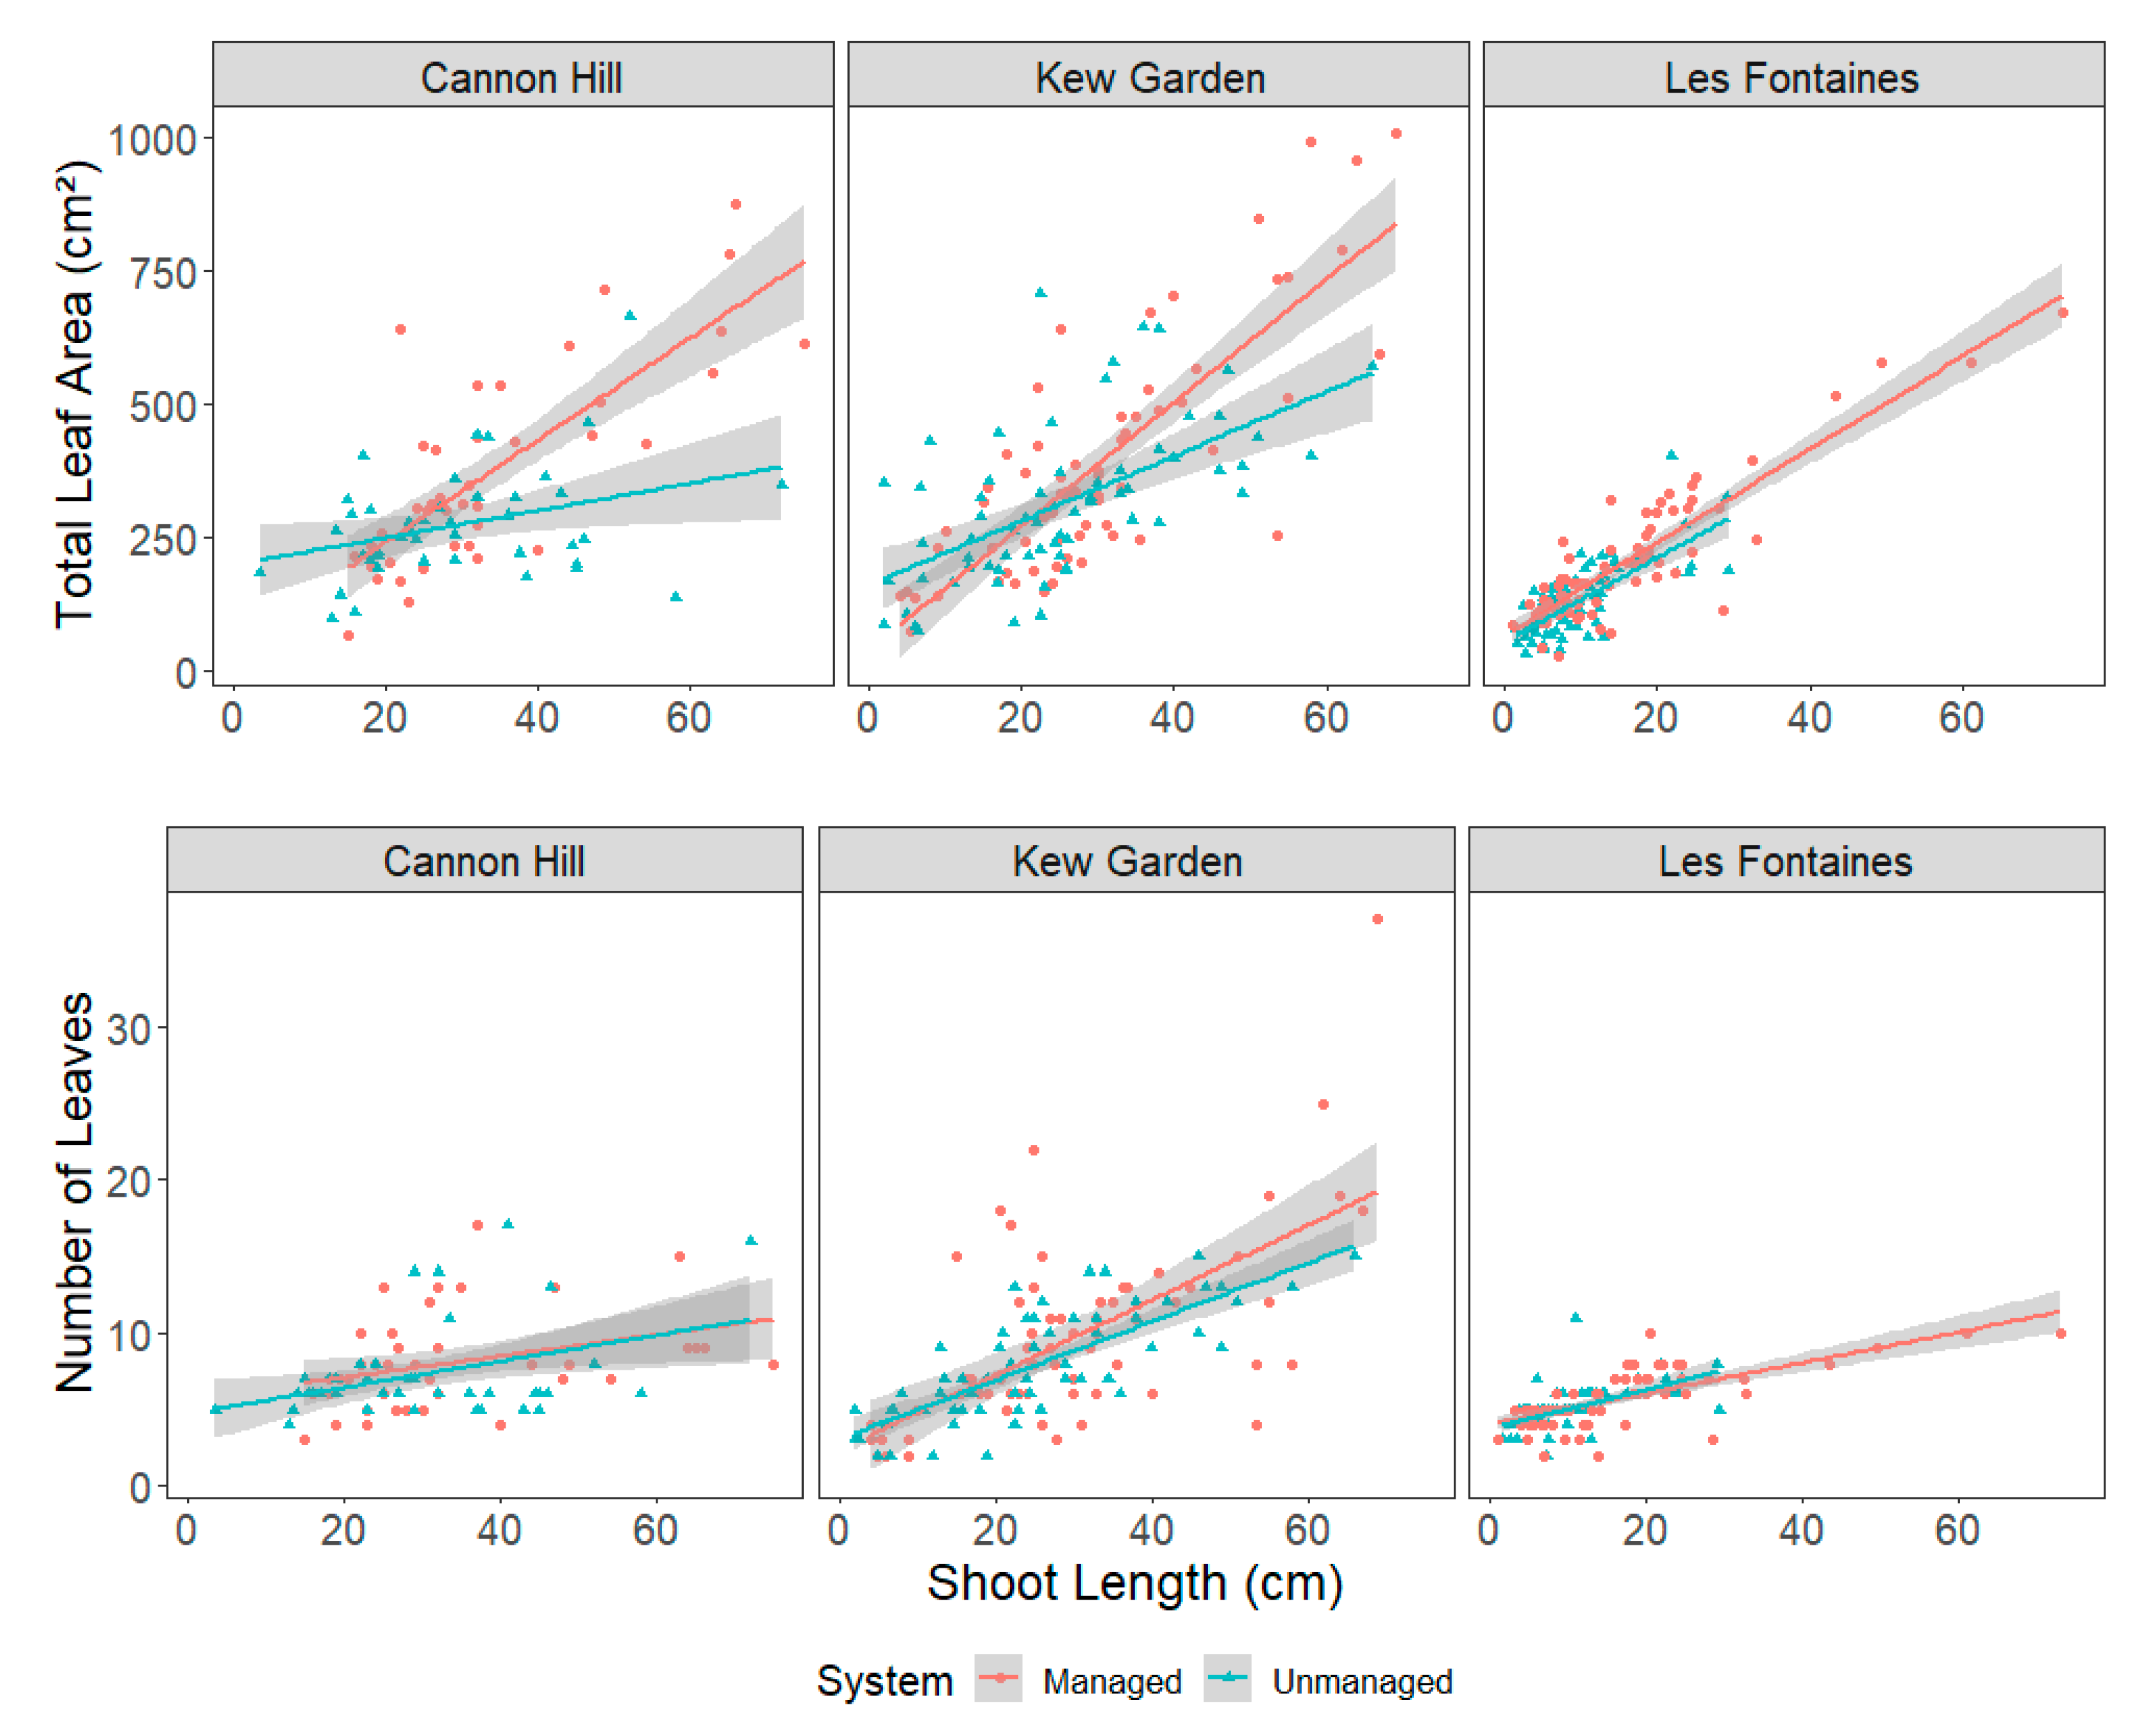
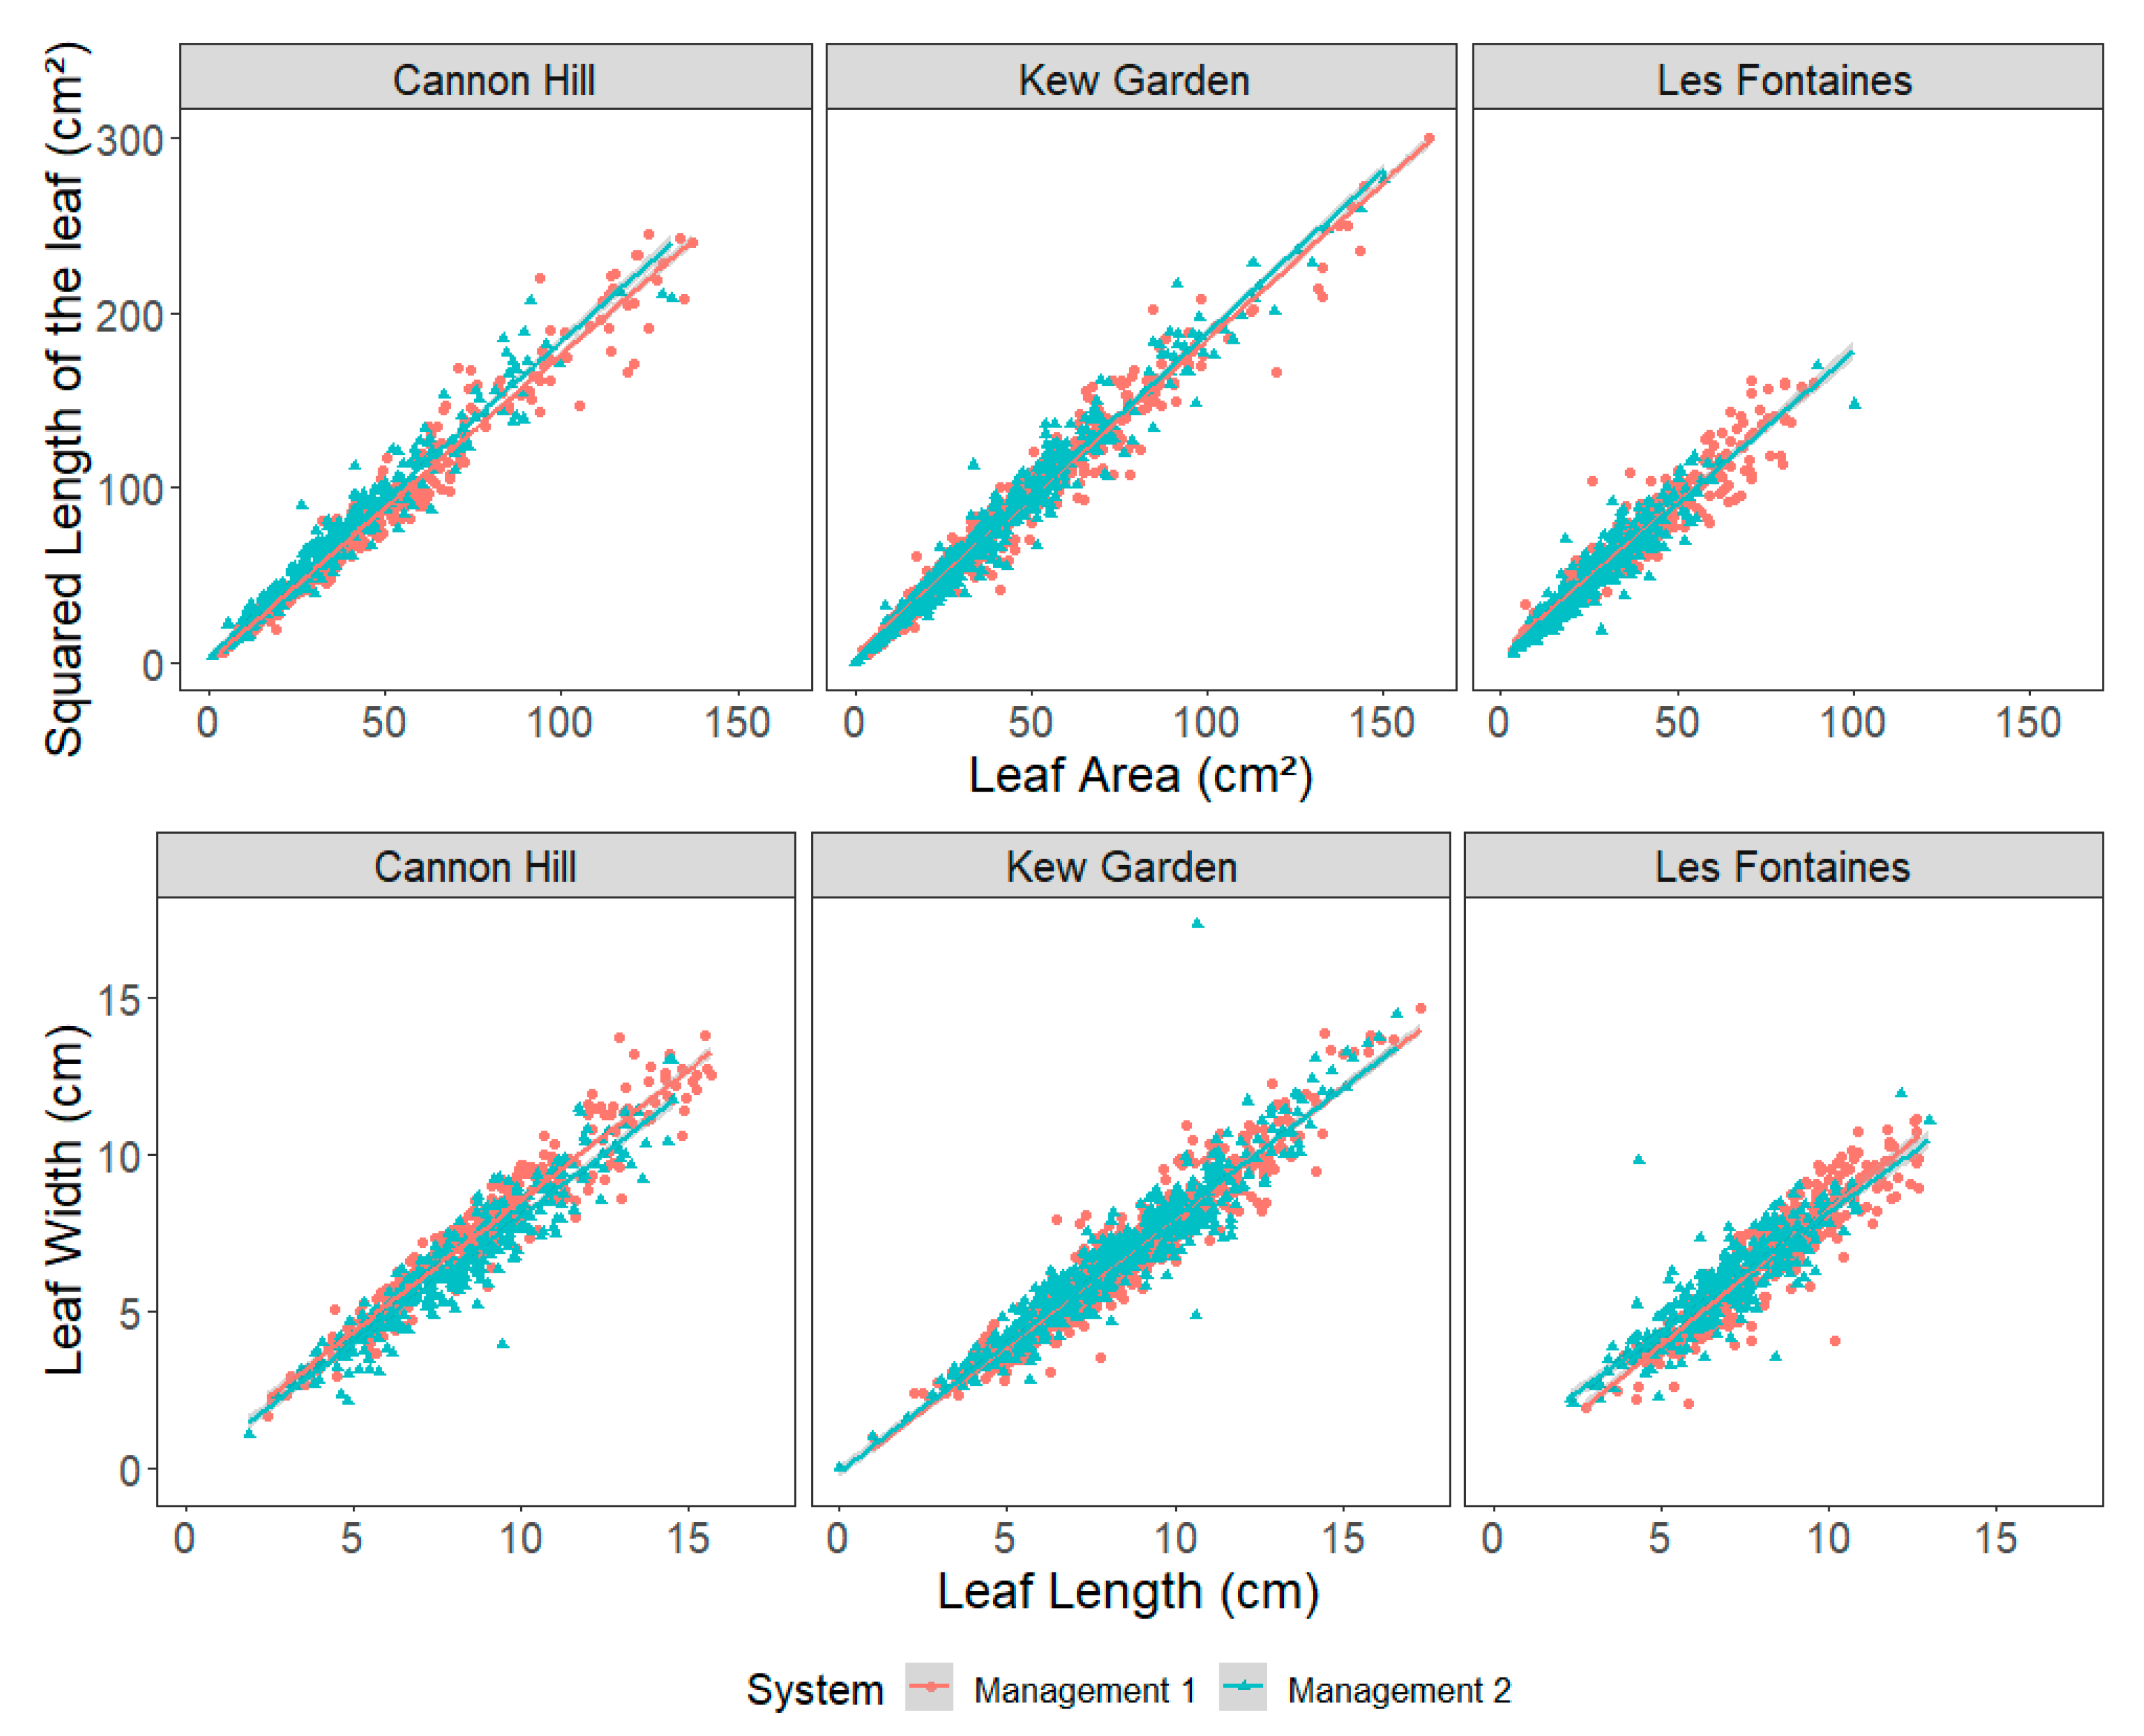
  • At the leaf scale, LA was significantly related to LL2 (Equation (3)), with a significant interaction with the management practice (Figure 6) at LF sites. The same applies at the CH site, but at the p < 0.1 level. The LW was linearly and significantly related to LL, but a significant interaction with the management practice was detected at the LF site only. The management practice affected leaf shape mainly at the LF sites, and at the CH site to a lower extent.

3.3. Reconstruction of Leaf Area and Model Simulations

  • Using a unique shoot population of fixed lengths and spatial positions determined by [16], six different 3D mock-ups of tree foliage were created (Figure 7) applying the allometric relationships, leading to a wide range of leaf metrics (Table 3).
  • Total leaf area (TLA) ranged from 41.7 m2 (UM trees at Cannon Hill Park) to 95.7 m2 (MA trees at KG) while the projected leaf area (PLA) ranged from 11.3 m2 to 15.1 m2. The leaf area indices (LAI) ranged from 11.3 to 15.1. This hierarchy was kept for the number of voxels (thus as well for the crown volume) needed to encompass each 3D mock-up, from 3608 voxels at CH (UM trees) to 3951 voxels at KG (MA trees). Similarly, the leaf area density (LAD) ranged from 1.4 m2 m−3 to 3.0 m2 m−3.
  • Regarding the variables related to light interception, the STARdiff ranged from 0.44 to 0.26 for CH (UM trees) and KG (MA trees), respectively. The sunlit leaf area (i.e., the leaves which receive direct solar radiation) ranged from 11.3 m2 to 15.1 m2 at CH (UM trees) and KG (MA trees), respectively. However, when expressed in percent of TLA, the hierarchy was inverted as the sunlit area ranged from 16% of TLA to 27% for Kew Garden (MA trees) and Cannon Hill (UN trees), respectively.
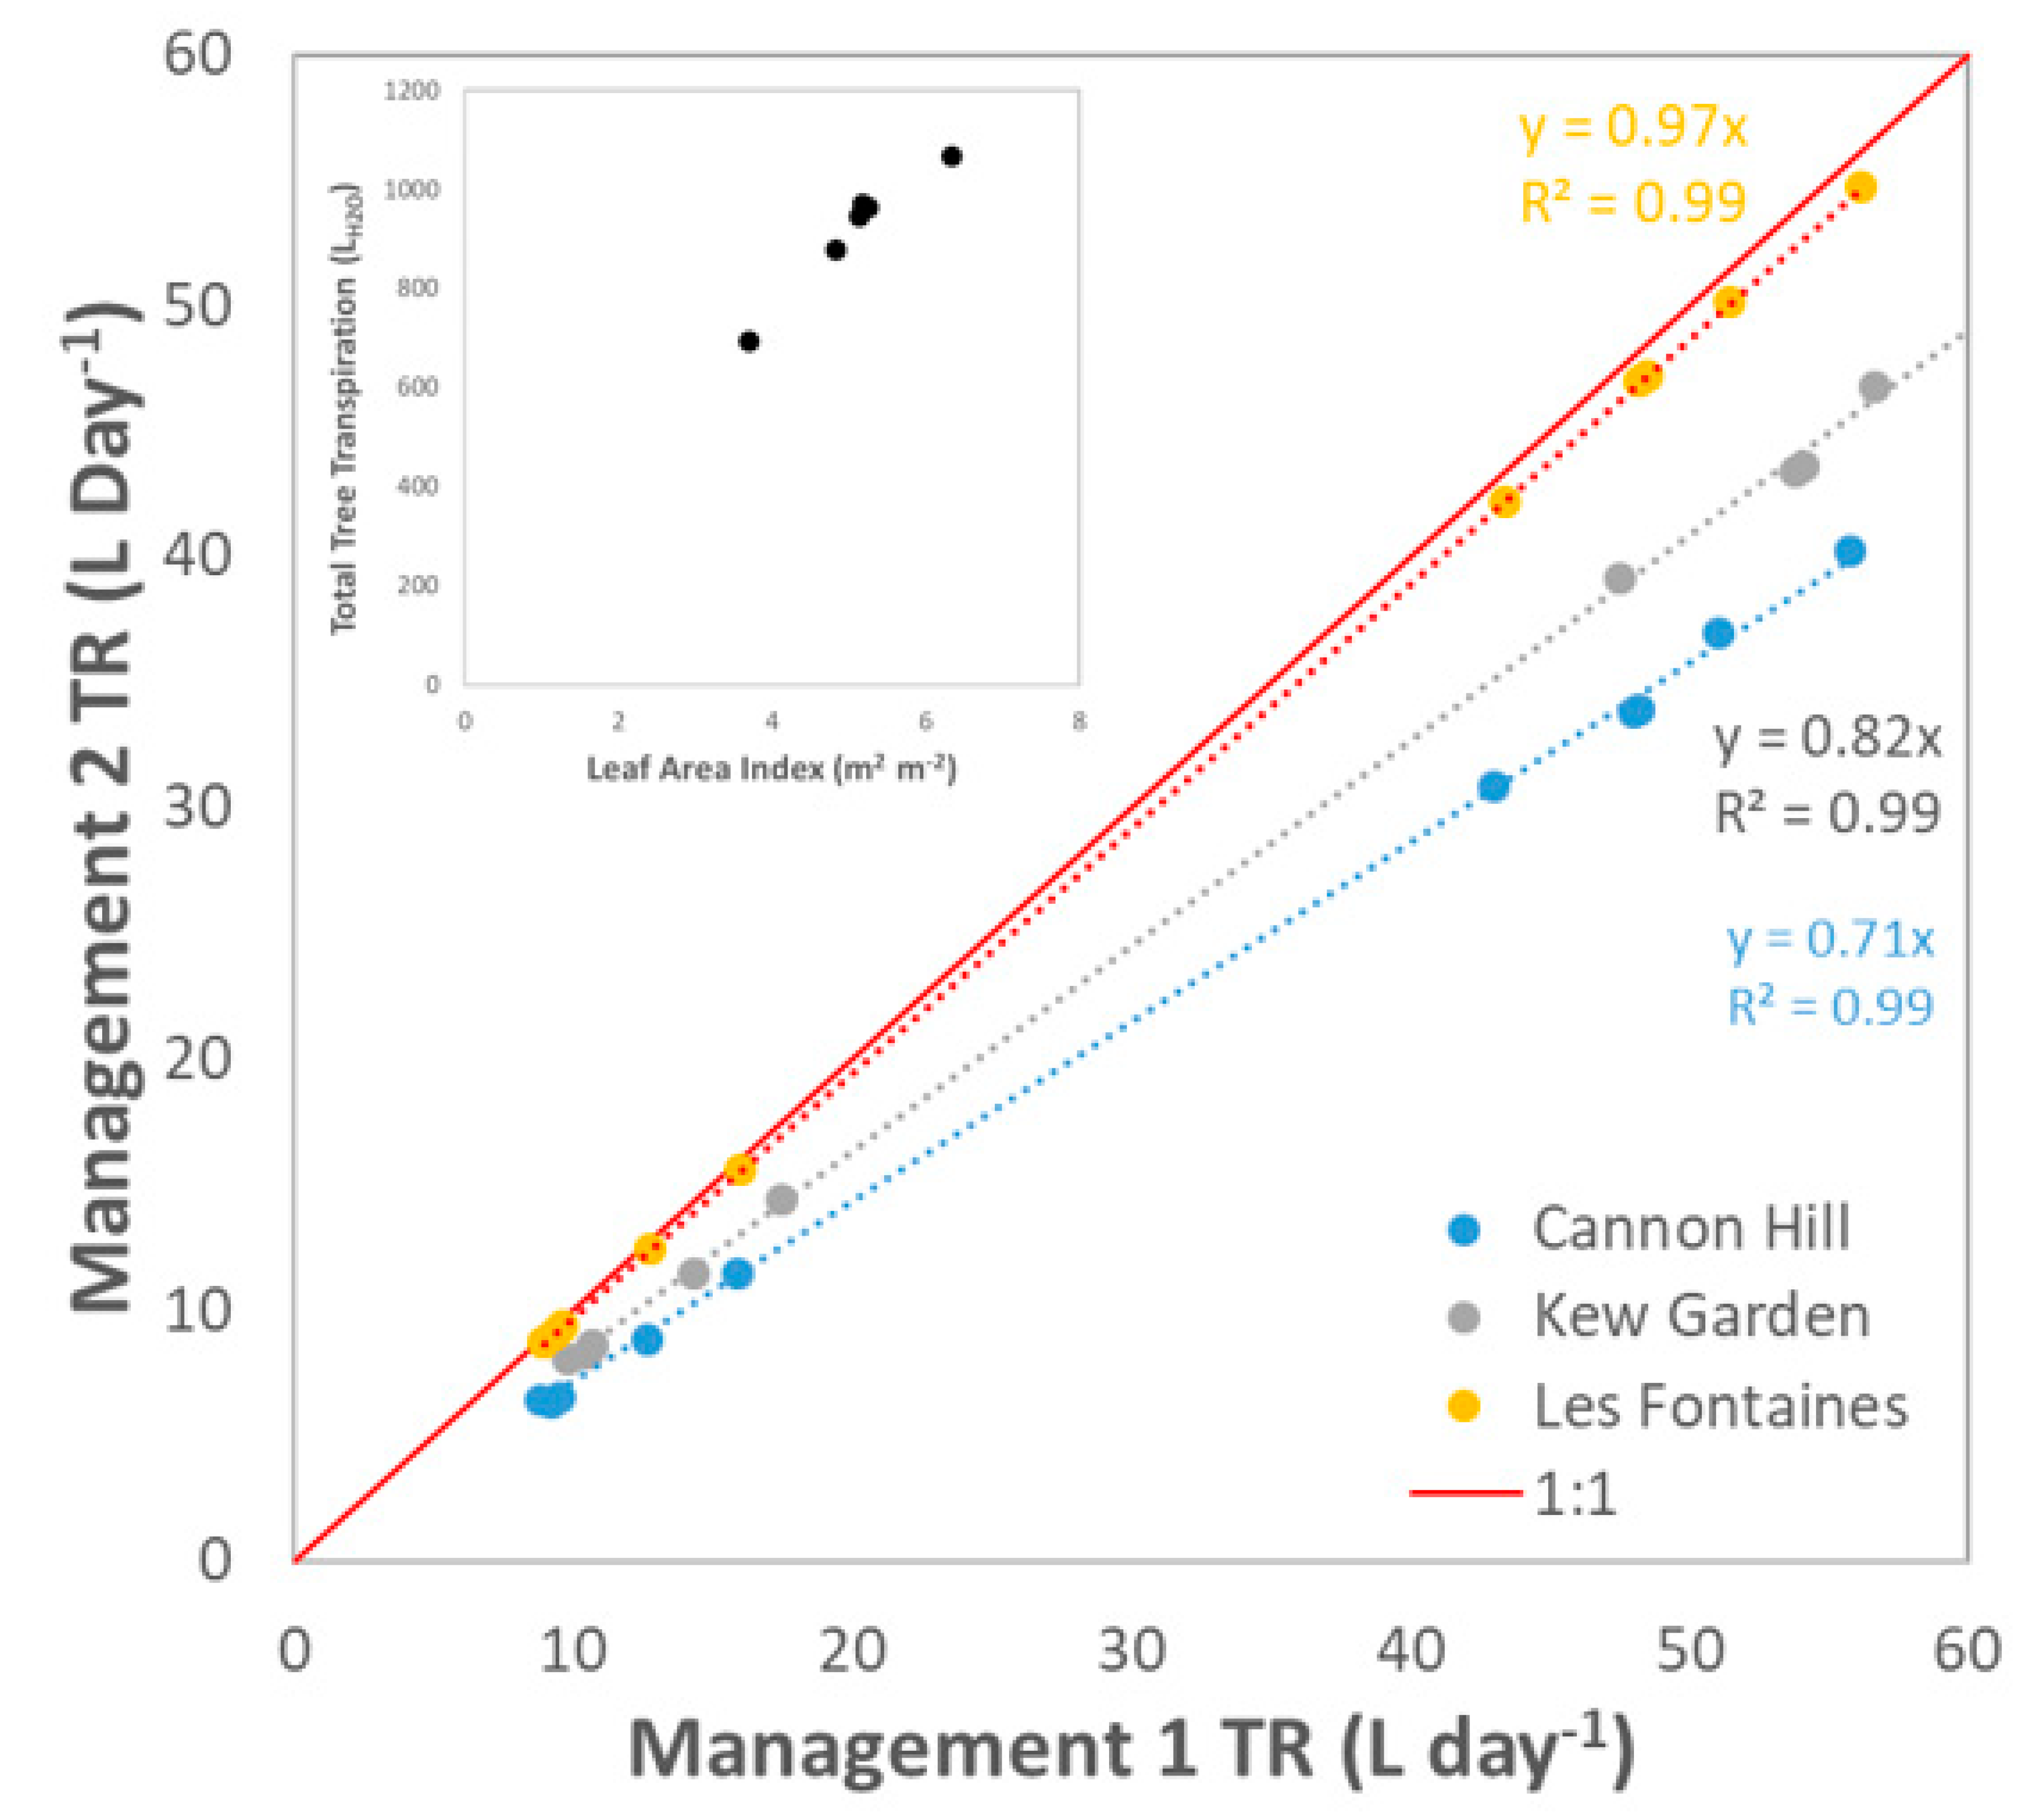
  • Simulated tree transpiration (TR) ranged from 0.45 L day−1 to 61.7 L day−1 during the tested period (Figure 8). Expressed in latent heat flux (λE), these simulations ranged from 1.1 MJ day−1 to 153 MJ day−1. In terms of maximal λE flux density, the model simulated fluxes ranging from 317 W m−2 to 365 W m−2. TR was lower for UN trees than for MA trees in the CH and KG sites by 29% and 18%, respectively (Figure 8). This ratio between the HM and MA trees reached 2% at the LF site. The total TR simulated over the tested period varied linearly with the LAI (Figure 8).

4. Discussion

4.1. Citizen Scientist Contribution

Environmental monitoring has been successfully conducted by citizen scientists in previous urban studies, and applied to various study objects such as birds, invasive species, urban forests, and young planted trees [28,29,30,31]. For example, CS data collection has been successfully carried out to understand urban challenges, such as air pollution [32] and floods [33,34]. Nevertheless, few attempts have been made to understand the best practices of tree planting for UHI mitigation through functional–structural plant modelling [35], as it requires a large volume of robust tree leaf data. In this research, we have demonstrated that by providing a unified and standardized measurement protocol, it is possible to collect the required database for tree canopy modelling using CS. Given the appropriate training and material is provided for the participants, field data can be acquired in a third of the time that would have been required for two scientists. The outcome of these CS measurements is discussed further below.

4.2. Effect of Management Practices on the Reconstructed Leaf Area

The data obtained by CS evidenced a strong effect of management practices on the allometric relationships, depending on the land management practice considered. The expansion of differences in allometries led to a much lower reconstructed leaf area in unmanaged trees, where available light may be a key limiting factor. Trees growing in these unmanaged urban environments were characterized above all by the vicinity of other trees, creating contiguous crown cover and ultimately strong competition for light, in contrast with the rather isolated crowns of the managed trees growing in the same urban park. Considering the unique modelled shoot geometry [16], total leaf biomass can be considered lower in trees under competition for light than more isolated trees, which is consistent with studies on leaf acclimation to shade in forest ecosystems worldwide [36,37]. This statement assumes that the leaf mass area (LMA, i.e., ratio between the leaf dry mass and leaf area) does not differ among the management practices, which was verified in the present study with the data collected by the CS (data not shown).
The study seems to show that there are species-related traits that will not necessarily respond to the land management conditions. This is the case for the number of leaves per unit of shoot length, which failed to show variation with regards to the management practices irrespective of the site, even if a large variance was observed within the data collected by the CS. Note that this study did not consider the total number of annual shoots of the studied trees. This parameter might be affected by the crown management operations, such as thinning and pruning; therefore, it may allow a better representation of tree canopy area. Nevertheless, the total number of annual shoots is an elusive parameter to quantify manually due to (i) the high number of shoot axes on an adult tree and (ii) the reactions (such as reiteration) consecutive to pruning operations [38]. Remote sensors, such as terrestrial LiDAR, might allow one to overcome this knowledge gap and thus provide better insights on tree responses to management practices [39,40].
The main influence of the management practices at the LF site were on the allometric relationships at the leaf scale, while at the UK sites this influence operated at the shoot scale. Despite being significant, the differences in allometric relationships between the management practices yielded relatively similar TR values at the LF site. This may mean that the different management practices had close consequences in leaf area allometry and thus on the simulated tree transpiration. One possible explanation would be that both management practices at LF were not as different in terms of crown closure or proximity as in the UK sites. Another hypothesis would be that the most relevant scale for significantly influencing LAD, TLA, and LAI might be the shoot scale. Single leaf size and shape were intensively studied and were shown to vary considerably among and within species [41,42]. Within-crown variations of single leaf traits can also occur in response to abiotic (e.g., light, temperature, and humidity) and biotic (e.g., herbivory) factors [43,44]. However, very little is known about these within-crown variations of the shoot unit. Additional empirical studies are still needed to better understand within-crown variations of shoot-scale leaf area in broadleaved species.

4.3. Effect of Tree Management Practices on Cooling Potential

Mitigating the UHI effect in cities can be achieved by incorporating nature-based solutions, such as trees [6]. Various other studies have attempted to quantify the respective contribution of each of the processes involved in the cooling effect, which combines a radiative component and an evaporative component, i.e., shading and transpiration [7,45]. Various studies used either field measurements (e.g., [46,47,48,49]) or model simulations (e.g., [50,51,52]). Nevertheless, more effort is needed to improve our understanding of the effects that landscaping and land management has on leaf area and transpiratory cooling of trees. This research is a step forward in the quantification of the cooling effect of urban trees, which uses a combination of the empirical data provided by citizen science and modelling.
This study shows a clear effect of land management practices on leaf area variables and on transpiration. The decrease of total leaf area in UN trees translated to a significant decrease in tree transpiration of up to 29% with respect to MA trees in the UK sites, which is in agreement with the contrasts in reconstructed leaf area. Moreover, the differences in LAI between the tree and land management practices of a given site led to differences in TR of the same proportion (Figure 8), in good agreement with the water balance models of forest ecosystems [53]. These findings suggest that trees in managed conditions, with respect to unmanaged ones, favor developing higher LAI in urban areas and thus a higher evaporating cooling effect [8]. While the potential differences and impacts that soil water, nutrients, and organic content may have on trees across the different land management practices considered in this research were not addressed [54], the field observations point to tree canopy space and light, as well as care, as key controlling factors of the cooling potential of urban trees. It could be then interpreted that more established trees with less competition for light may develop a larger leaf area. As a consequence, trees in the managed sites could promote air cooling thanks to a larger intercept of solar radiation and dissipation of latent heat by transpiration, thus improving thermal comfort [55,56]. Optimization of ecosystem services should nevertheless account for the requirement of the trees in water. Trade-offs between shading and evapotranspiration of the whole tree–soil continuum should thus be made, for example through the choice of tree species [47] or management practices. More generally, trade-offs among the various ecosystem services and disservices provided by trees should be made (e.g., thermal comfort versus air pollution retention [57,58]) in future urban planning aiming at more sustainable cities.

5. Conclusions

This study provides a novel methodology that engages the public and researchers to collaborate towards understanding and improving the best implementation of nature-based solutions to ameliorate the UHI effect in urban areas. This methodology facilitates collecting a robust database of empirical data to be used for models for understanding of the properties of trees. At the same time, the use of this methodology raises awareness on urban sustainability and the value of nature-based solutions amongst the public. As proven successful, this methodology is now available to be used by researchers, council, and the public.
This collaborative field and modelling research study demonstrates a significant impact of the land management practices of urban linden trees on their cooling potential. Practices for lowering both canopy closure and competition, such as thinning, should favor developing total leaf area and increasing leaf area density, such that tree transpiration and shading may be optimized for cooling the surroundings. Our results imply that we can better facilitate the ecosystem services of trees in urban areas and therefore facilitate improved cost-benefits for the use of trees as nature-based solutions for thermal comfort. These results are key information to be considered by city planners and developers if we want to achieve a sustainable future.
This novel research could further deepen and be improved by incorporating other methodologies, such as laser scanning processing. This methodology would allow access to more in-depth tree architecture as well as an estimation of the total number of annual shoots and direct assessment of the LAI of single trees. Additionally, modeling interactions between surrounding areas and tree function at the urban canyon scale could be promoted to estimate the cooling effect of linden trees in various planting and management conditions with more accuracy in specific scenarios.
This research demonstrates that we can further improve the delivery of ecosystem services for trees for sustainable urban living, and that the costs of this are collaboration between multiple stakeholders and the innovative use of traditional (i.e., field work) and advanced (i.e., modelling) methods.

Author Contributions

Conceptualization, J.N., M.L.C., T.A. and M.S.; Data curation, J.N.; Formal analysis, M.S.; Funding acquisition, M.L.C.; Investigation, J.N., T.A., J.C. and M.S.; Methodology, J.N., M.L.C. and M.S.; Project administration, M.L.C.; Supervision, J.N. and M.L.C.; Validation, M.S.; Writing—original draft, J.N. and M.S.; Writing—review and editing, M.L.C., T.A., J.C. and M.S. All authors have read and agreed to the published version of the manuscript.

Funding

This research was funded by EARTHWATCH INSTITUTE (The HSBC Water Program), grant number 8434000209.

Data Availability Statement

The data that support the findings of this study are openly available in a DATA INRAE repository (https://doi.org/10.15454/TG0OEP (accessed on 1 December 2021)).

Acknowledgments

The authors thank the HSBC volunteers for their key participation in data collection and discussions. They also acknowledge all the Earthwatch staff for their support in the logistic organization of the STP sessions (Valentin, Claire, etc.), as well as M. Guillaume Schreiner (University of Strasbourg, France) and Jacquie Eales for their participation and support in the STP tree data collection in France and the UK sites. Karel Van Den Meersche (UMR Eco&Sols) is thanked for his advices on the use of generalized linear models.

Conflicts of Interest

The authors declare no conflict of interest. The funders had no role in the design of the study; in the collection, analyses, or interpretation of data; in the writing of the manuscript; or in the decision to publish the results.

References

  1. Zhang, X.Q. The trends, promises and challenges of urbanisation in the world. Habitat. Int. 2016, 54, 241–252. [Google Scholar] [CrossRef]
  2. United Nations-Department of Economic and Social Affairs-Population Division. World Urbanization Prospects: The 2018 Revision (ST/ESA/SER.A/420); United Nations: New York, NY, USA, 2019. [Google Scholar]
  3. Garschagen, M.; Romero-Lankao, P. Exploring the relationships between urbanization trends and climate change vulnerability. Clim. Chang. 2015, 133, 37–52. [Google Scholar] [CrossRef]
  4. Yang, J.; Sun, J.; Ge, Q.; Li, X. Assessing the impacts of urbanization-associated green space on urban land surface temperature: A case study of Dalian, China. Urban. For. Urban. Green. 2017, 22, 1–10. [Google Scholar] [CrossRef]
  5. Yang, K.; Pan, M.; Luo, Y.; Chen, K.; Zhao, Y.; Zhou, X. A time-series analysis of urbanization-induced impervious surface area extent in the Dianchi Lake watershed from 1988–2017. Int. J. Remote. Sens. 2019, 40, 573–592. [Google Scholar] [CrossRef]
  6. Ali, M.A.; Alawadi, K.; Khanal, A. The Role of Green Infrastructure in Enhancing Microclimate Conditions: A Case Study of a Low-Rise Neighborhood in Abu Dhabi. Sustainability 2021, 13, 4260. [Google Scholar] [CrossRef]
  7. Bowler, D.E.; Buyung-Ali, L.; Knight, T.M.; Pullin, A.S. Urban greening to cool towns and cities: A systematic review of the empirical evidence. Landsc.Urban. Plan. 2010, 97, 147–155. [Google Scholar] [CrossRef]
  8. Winbourne, J.B.; Jones, T.S.; Garvey, S.M.; Harrison, J.L.; Wang, L.; Li, D.; Templer, P.H.; Hutyra, L.R. Tree Transpiration and Urban Temperatures: Current Understanding, Implications, and Future Research Directions. BioScience 2020, 70, 576–588. [Google Scholar] [CrossRef]
  9. Roy, S.; Byrne, J.; Pickering, C. A systematic quantitative review of urban tree benefits, costs, and assessment methods across cities in different climatic zones. Urban. For. Urban. Green. 2012, 11, 351–363. [Google Scholar] [CrossRef] [Green Version]
  10. Ulmer, J.M.; Wolf, K.L.; Backman, D.R.; Tretheway, R.L.; Blain, C.J.A.; O’Neil-Dunne, J.P.M.; Frank, L.D. Multiple health benefits of urban tree canopy: The mounting evidence for a green prescription. Health Place 2016, 42, 54–62. [Google Scholar] [CrossRef]
  11. Kastendeuch, P.P.; Najjar, G.; Colin, J. Thermo-radiative simulation of an urban district with LASER/F. Urban. Clim. 2017, 21, 43–65. [Google Scholar] [CrossRef]
  12. Vos, J.; Evers, J.B.; Buck-Sorlin, G.H.; Andrieu, B.; Chelle, M.; de Visser, P.H.B. Functional–structural plant modelling: A new versatile tool in crop science. J. Exp. Bot. 2009, 61, 2101–2115. [Google Scholar] [CrossRef] [PubMed]
  13. Dufrêne, E.; Davi, H.; François, C.; Maire, G.l.; Dantec, V.L.; Granier, A. Modelling carbon and water cycles in a beech forestPart I: Model description and uncertainty analysis on modelled NEE. Ecol. Model. 2005, 185, 407–436. [Google Scholar] [CrossRef] [Green Version]
  14. Morales, P.; Sykes, M.T.; Prentice, I.C.; Smith, P.; Smith, B.; Bugmann, H.; Zierl, B.; Friedlingstein, P.; Viovy, N.; Sabaté, S.; et al. Comparing and evaluating process-based ecosystem model predictions of carbon and water fluxes in major European forest biomes. Glob. Chang. Biol. 2005, 11, 2211–2233. [Google Scholar] [CrossRef]
  15. Kong, F.; Yan, W.; Zheng, G.; Yin, H.; Cavan, G.; Zhan, W.; Zhang, N.; Cheng, L. Retrieval of three-dimensional tree canopy and shade using terrestrial laser scanning (TLS) data to analyze the cooling effect of vegetation. Agric. For. Meteorol. 2016, 217, 22–34. [Google Scholar] [CrossRef]
  16. Bournez, E.; Landes, T.; Najjar, G.; Kastendeuch, P.; Ngao, J.; Saudreau, M. Sensitivity of simulated light interception and tree transpiration to the level of detail of 3D tree reconstructions. Urban. For. Urban. Green. 2019, 38, 1–10. [Google Scholar] [CrossRef] [Green Version]
  17. Pauleit, S.; Jones, N.; Garcia-Martin, G.; Garcia-Valdecantos, J.L.; Rivière, L.M.; Vidal-Beaudet, L.; Bodson, M.; Randrup, T.B. Tree establishment practice in towns and cities–Results from a European survey. Urban. For. Urban. Green. 2002, 1, 83–96. [Google Scholar] [CrossRef]
  18. De Jaegere, T.; Hein, S.; Claessens, H. A Review of the Characteristics of Small-Leaved Lime (Tilia cordata Mill.) and Their Implications for Silviculture in a Changing Climate. Forests 2016, 7, 56. [Google Scholar] [CrossRef] [Green Version]
  19. Adam, B.; Saudreau, M.; Ngao, J. PlaniPIAF; UMR PIAF: Clermont-Ferrand, France, 2013. [Google Scholar]
  20. Sonohat, G.; Sinoquet, H.; Kulandaivelu, V.; Combes, D.; Lescourret, F. Three-dimensional reconstruction of partially 3D-digitized peach tree canopies. Tree Physiol. 2006, 26, 337–351. [Google Scholar] [CrossRef] [Green Version]
  21. Hagemeier, M.; Leuschner, C. Functional Crown Architecture of Five Temperate Broadleaf Tree Species: Vertical Gradients in Leaf Morphology, Leaf Angle, and Leaf Area Density. Forests 2019, 10, 265. [Google Scholar] [CrossRef] [Green Version]
  22. Donès, N.; Adam, B.; Sinoquet, H. VegSTAR-Software to Compute Light Interception Foorm Images of 3D Digitised Plants, 4th ed.; UMR PIAF: Clermont-Ferrand, France, 2011. [Google Scholar]
  23. Carter, G.A.; Smith, W.K. Influence of Shoot Structure on Light Interception and Photosynthesis in Conifers. Plant. Physiol. 1985, 79, 1038–1043. [Google Scholar] [CrossRef] [Green Version]
  24. Varlet-Grancher, C.; Bonhomme, R.; Sinoquet, H. Crop. Structure and Light Microclimate: Characterization and Applications; INRA: Paris, France, 1993. [Google Scholar]
  25. Sinoquet, H.; Le Roux, X.; Adam, B.; Ameglio, T.; Daudet, F.A. RATP: A model for simulating the spatial distribution of radiation absorption, transpiration and photosynthesis within canopies: Application to an isolated tree crown. Plant. Cell Environ. 2001, 24, 395–406. [Google Scholar] [CrossRef]
  26. Fox, J.; Weisberg, S. An. R Companion to Applied Regression, 3rd ed.; Sage: Thousand Oaks, CA, USA, 2019. [Google Scholar]
  27. R Development Core Team. R: A Language and Environment for Statistical Computing; R Foundation for Statistical Computing: Vienna, Austria, 2019. [Google Scholar]
  28. Kobori, H.; Dickinson, J.L.; Washitani, I.; Sakurai, R.; Amano, T.; Komatsu, N.; Kitamura, W.; Takagawa, S.; Koyama, K.; Ogawara, T.; et al. Citizen science: A new approach to advance ecology, education, and conservation. Ecol. Res. 2016, 31, 1–19. [Google Scholar] [CrossRef] [Green Version]
  29. Wei, J.W.; Lee, B.P.Y.H.; Wen, L.B. Citizen Science and the Urban Ecology of Birds and Butterflies—A Systematic Review. PLoS ONE 2016, 11, e0156425. [Google Scholar]
  30. Roman, L.A.; Scharenbroch, B.C.; Östberg, J.P.A.; Mueller, L.S.; Henning, J.G.; Koeser, A.K.; Sanders, J.R.; Betz, D.R.; Jordan, R.C. Data quality in citizen science urban tree inventories. Urban. For. Urban. Green. 2017, 22, 124–135. [Google Scholar] [CrossRef]
  31. De Sá, N.C.; Marchante, H.; Marchante, E.; Cabral, J.A.; Honrado, J.P.; Vicente, J.R. Can citizen science data guide the surveillance of invasive plants? A model-based test with Acacia trees in Portugal. Biol. Invasions 2019, 21, 2127–2141. [Google Scholar] [CrossRef]
  32. West, S.E.; Büker, P.; Ashmore, M.; Njoroge, G.; Welden, N.; Muhoza, C.; Osano, P.; Makau, J.; Njoroge, P.; Apondo, W. Particulate matter pollution in an informal settlement in Nairobi: Using citizen science to make the invisible visible. Appl. Geogr. 2020, 114, 102133. [Google Scholar] [CrossRef]
  33. Fava, M.C.; Abe, N.; Restrepo-Estrada, C.; Kimura, B.Y.L.; Mendiondo, E.M. Flood modelling using synthesised citizen science urban streamflow observations. J. Flood Risk Manag. 2019, 12, e12498. [Google Scholar] [CrossRef] [Green Version]
  34. Pandeya, B.; Uprety, M.; Paul, J.D.; Sharma, R.R.; Dugar, S.; Buytaert, W. Mitigating flood risk using low-cost sensors and citizen science: A proof-of-concept study from western Nepal. J. Flood Risk Manag. 2021, 14, e12675. [Google Scholar] [CrossRef]
  35. Simon, H.; Lindén, J.; Hoffmann, D.; Braun, P.; Bruse, M.; Esper, J. Modeling transpiration and leaf temperature of urban trees–A case study evaluating the microclimate model ENVI-met against measurement data. Landsc. Urban. Plan. 2018, 174, 33–40. [Google Scholar] [CrossRef]
  36. Munoz, F.; Rubilar, R.; Espinosa, A.; Cancino, J.; Toro, J.; Herrera, A. The effect of pruning and thinning on above ground aerial biomass of Eucalyptus nitens (Deane & Maiden) Maiden. For. Ecol. Manage. 2008, 255, 365–373. [Google Scholar]
  37. Poorter, H.; Niklas, K.J.; Reich, P.B.; Oleksyn, J.; Poot, P.; Mommer, L. Biomass allocation to leaves, stems and roots: Meta-analyses of interspecific variation and environmental control. New Phytol. 2012, 193, 30–50. [Google Scholar] [CrossRef]
  38. Lecigne, B.; Delagrange, S.; Messier, C. Determinants of delayed traumatic tree reiteration growth: Levels of branch growth control and insights for urban tree management, modeling and future research. Urban. For. Urban. Green. 2020, 47, 126541. [Google Scholar] [CrossRef]
  39. Landes, T.; Saudreau, M.; Najjar, G.; Kastendeuch, P.; Guillemin, S.; Colin, J.; Luhahe, R. 3D Tree Architecture Modeling from Laser Scanning for Urban Microclimate Study. In Proceedings of the 9th International Conference on Urban Climate (ICUC9), Toulouse, France, 20–24 July 2015. [Google Scholar]
  40. Du, S.L.; Lindenbergh, R.; Ledoux, H.; Stoter, J.; Nan, L.L. AdTree: Accurate, Detailed, and Automatic Modelling of Laser-Scanned Trees. Remote. Sens. 2019, 11, 2074. [Google Scholar] [CrossRef] [Green Version]
  41. Nicotra, A.B.; Leigh, A.; Boyce, C.K.; Jones, C.S.; Niklas, K.J.; Royer, D.L.; Tsukaya, H. The evolution and functional significance of leaf shape in the angiosperms. Funct. Plant. Biol. 2011, 38, 535–552. [Google Scholar] [CrossRef] [Green Version]
  42. Li, Y.; Zou, D.; Shrestha, N.; Xu, X.; Wang, Q.; Jia, W.; Wang, Z. Spatiotemporal variation in leaf size and shape in response to climate. J. Plant. Ecol. 2019, 13, 87–96. [Google Scholar] [CrossRef]
  43. Ishii, H.R.; Horikawa, S.-I.; Noguchi, Y.; Azuma, W. Variation of intra-crown leaf plasticity of Fagus crenata across its geographical range in Japan. For. Ecol. Manage. 2018, 429, 437–448. [Google Scholar] [CrossRef]
  44. Eisenring, M.; Unsicker, S.B.; Lindroth, R.L. Spatial, genetic and biotic factors shape within-crown leaf trait variation and herbivore performance in a foundation tree species. Funct. Ecol. 2021, 35, 54–66. [Google Scholar] [CrossRef]
  45. Rahman, M.A.; Moser, A.; Rötzer, T.; Pauleit, S. Comparing the transpirational and shading effects of two contrasting urban tree species. Urban. Ecosyst. 2019, 22, 683–697. [Google Scholar] [CrossRef]
  46. Rahman, M.A.; Armson, D.; Ennos, A.R. A comparison of the growth and cooling effectiveness of five commonly planted urban tree species. Urban. Ecosyst. 2015, 18, 371–389. [Google Scholar] [CrossRef]
  47. Rahman, M.A.; Moser, A.; Rötzer, T.; Pauleit, S. Within canopy temperature differences and cooling ability of Tilia cordata trees grown in urban conditions. Build. Environ. 2017, 114, 118–128. [Google Scholar] [CrossRef]
  48. Nasrollahi, N.; Ghosouri, A.; Khodakarami, J.; Taleghani, M. Heat-Mitigation Strategies to Improve Pedestrian Thermal Comfort in Urban Environments: A Review. Sustainability 2020, 12, 10000. [Google Scholar] [CrossRef]
  49. Meili, N.; Manoli, G.; Burlando, P.; Carmeliet, J.; Chow, W.T.L.; Coutts, A.M.; Roth, M.; Velasco, E.; Vivoni, E.R.; Fatichi, S. Tree effects on urban microclimate: Diurnal, seasonal, and climatic temperature differences explained by separating radiation, evapotranspiration, and roughness effects. Urban. For. Urban. Green. 2021, 58, 126970. [Google Scholar] [CrossRef]
  50. Jiao, M.; Zhou, W.; Zheng, Z.; Wang, J.; Qian, Y. Patch size of trees affects its cooling effectiveness: A perspective from shading and transpiration processes. Agric. For. Meteorol. 2017, 247, 293–299. [Google Scholar] [CrossRef]
  51. Hsieh, C.-M.; Li, J.-J.; Zhang, L.; Schwegler, B. Effects of tree shading and transpiration on building cooling energy use. Energy Build. 2018, 159, 382–397. [Google Scholar] [CrossRef]
  52. Pace, R.; De Fino, F.; Rahman, M.A.; Pauleit, S.; Nowak, D.J.; Grote, R. A single tree model to consistently simulate cooling, shading, and pollution uptake of urban trees. Int. J. Biometeorol. 2021, 65, 277–289. [Google Scholar] [CrossRef]
  53. Granier, A.; Breda, N.; Biron, P.; Villette, S. A lumped water balance model to evaluate duration and intensity of drought constraints in forest stands. Ecol. Model. 1999, 116, 269–283. [Google Scholar] [CrossRef]
  54. Jorge, N.F.; Clark, J.; Cárdenas, M.L.; Geoghegan, H.; Shannon, V. Measuring Soil Colour to Estimate Soil Organic Carbon Using a Large-Scale Citizen Science-Based Approach. Sustainability 2021, 13, 11029. [Google Scholar] [CrossRef]
  55. Rahman, M.A.; Smith, J.G.; Stringer, P.; Ennos, A.R. Effect of rooting conditions on the growth and cooling ability of Pyrus calleryana. Urban. For. Urban. Green. 2011, 10, 185–192. [Google Scholar] [CrossRef]
  56. Kong, L.; Lau, K.K.-L.; Yuan, C.; Chen, Y.; Xu, Y.; Ren, C.; Ng, E. Regulation of outdoor thermal comfort by trees in Hong Kong. Sustain. Cities Soc. 2017, 31, 12–25. [Google Scholar] [CrossRef]
  57. Bodnaruk, E.W.; Kroll, C.N.; Yang, Y.; Hirabayashi, S.; Nowak, D.J.; Endreny, T.A. Where to plant urban trees? A spatially explicit methodology to explore ecosystem service tradeoffs. Landsc. Urban. Plan. 2017, 157, 457–467. [Google Scholar] [CrossRef]
  58. Speak, A.; Escobedo, F.J.; Russo, A.; Zerbe, S. An ecosystem service-disservice ratio: Using composite indicators to assess the net benefits of urban trees. Ecol. Indic. 2018, 95, 544–553. [Google Scholar] [CrossRef]
Figure 1. Field setup for digital imagery data collection of leaves, composed of a camera fixed on a rod inserted within the soil. The red sheet allowed the linden leaves to stand out and thus facilitated the image processing for estimating leaf area.
Sustainability 13 13656 g001
Figure 2. Meteorological data used for the RATP simulation over the tested period (18–23 July). The main figures focus on the first five days, while the insert displays the entire period. (A) Incoming solar radiation in the photosynthetically active radiation (PAR) waveband (global and diffuse parts) and in the near infrared (NIR) waveband (global and diffuse parts), and incoming radiation from the atmosphere (thermal infrared, right-hand side axis). (B) Temperature (air and soil), air partial pressures of carbon dioxide (pCO2) and water vapor (Eair), and wind speed.
Sustainability 13 13656 g002
Figure 3. Boxplots of the estimated dimensions of single leaves at the three sites for the two land and tree management practices. The three variables were computed from the digital images of the leaf samples by the citizen scientists. (A) Squared leaf length (cm2), (B) leaf area (cm2), and (C) leaf width (cm). Land management practices were as follows: Cannon Hill and Kew Garden sites, Management 1: ‘Managed’ system and Management 2: ‘Unmanaged’. Les Fontaines site, Management 1: ‘Highly Managed’ system and Management 2: ‘Managed’.
Sustainability 13 13656 g003
Figure 4. Boxplots of the measured variable of the shoots for the three sites and the two management practices by the citizen scientists. (A) Shoot length (cm), (B) number of leaves per shoot, and (C) total leaf area (cm2). Land management practices were as follows: Cannon Hill and Kew Garden sites, Management 1: ‘Managed’ system and Management 2: ‘Unmanaged’. Les Fontaines site, Management 1: ‘Highly Managed’ system and Management 2: ‘Managed’.
Sustainability 13 13656 g004
Figure 5. Allometric relationships between the total leaf area (cm2) borne by shoots and shoot length (cm, upper panel), and the total number of leaves borne by shoots and shoot length (cm, lower panel) for two management practices at each one of the three sites. Land management practices were as follows: Cannon Hill and Kew Garden sites, Management 1: ‘Managed’ system and Management 2: ‘Unmanaged’. Les Fontaines site, Management 1: ‘Highly Managed’ system and Management 2: ‘Managed’. The total leaf area values were computed from the digital images of the leaves collected by the citizen scientists, and the shoot length and number of leaves were measured on field by the citizen scientists.
Sustainability 13 13656 g005
Figure 6. Relationships between (upper row) the square of the length of the leaves (cm2) and leaf areas (cm2), and (lower row) the leaf widths (cm) and the leaf length (cm) for the three sites and the two management practices. Land management practices were as follows: Cannon Hill and Kew Garden sites, Management 1: ‘Managed’ system and Management 2: ‘Unmanaged’. Les Fontaines site, Management 1: ‘Highly Managed’ system and Management 2: ‘Managed’. All variables were computed from the digital images of the leaf samples by the citizen scientists.
Sustainability 13 13656 g006
Figure 7. Example of a 3D linden tree canopy reconstructed from the allometric relationships. The leaves are represented by the green polygons and the shoots are represented by yellow cylinders (but not taken into account in the radiative model). The grid mesh size is 30 × 30 cm. Data used in this example belong to the ‘Managed’ trees of Cannon Hill Park.
Sustainability 13 13656 g007
Figure 8. Comparison of daily tree transpiration (TR) between the Management 1 trees (Unmanaged (Cannon Hill, Kew Garden) and Managed (Les Fontaines) trees), and the Management 2 trees (Managed (Cannon Hill, Kew Garden) and Highly Managed (Les Fontaines) trees). Each point is a daily value. The linear relationship for each site is also given, as well as the coefficient of variation (R2). The red line represents the bisector. The insert represents the linear relationship between the leaf area index (LAI) and the total tree transpiration simulated over the entire tested period.
Sustainability 13 13656 g008
Table 1. Urban parks and land management where the study trees are located. For each management practice at each site, three trees were considered.
Park, CityLat, LongLand and Tree Management 1Land and Tree Management 2Tree Species
Kew Gardens, London, UK51.48 N, 0.29 WManaged (MA)Unmanaged (UN)Tilia platyphyllos Scop.
Cannon Hill, Birmingham, UK52.45 N, 1.90 WManaged (MA)Unmanaged (UN)Tilia platyphyllos Scop.
Les Fontaines, Gouvieux, FR49.19 N, 2.45 EManaged (MA)Highly managed (HM)Tilia cordata Mill.
Table 2. Summarized schedule of the field events involving the citizen scientists for the three sites. Detailed number of sampled shoots and leaves are also given. Each session lasted two days.
SiteDatesEventsShootsLeaves
Cannon Hill (CH)June 2018272552
June 201911283
Kew Garden (KG)May 2018272808
September 2018136155
May 2019112118
July 201911267
Les Fontaines (LF)June 2018136160
July 2018136198
September 2018136169
May 2019224122
June 201911261
Table 3. Summary of the different variables computed for the reconstructed 3D mock-ups and latent heat flux emitted by each mock-up simulated by the RATP model for each site and management practice (Managed: MA, Unmanaged: UM, Highly Managed: HM).
Cannon Hill (CH)Kew Garden (KG)Les Fontaines (LF)
MAUNMAUNHMMA
TLA (m2)76.941.996.065.175.974.0
PLA (m2)14.711.415.213.514.714.5
LAI (m2 m−2)5.23.76.34.85.25.1
Voxel number382035923992385338163814
Volume (m3)30.628.731.930.830.530.5
LADm (m2 m−3)2.521.463.022.112.492.43
LADstd (m2 m−3)2.101.442.762.062.102.04
STARdif0.300.440.260.340.340.32
Sunlit Area (m2)14.711.415.213.514.714.5
Shaded Area (m2)62.230.580.851.661.259.5
Sunlit Area (%)19%27%16%21%19%20%
Shaded Area (%)81%73%84%79%81%80%
Min λE (MJ day−1)212222
Max λE (MJ day−1)138100153126139135
The total leaf area (TLA) is the sum of all reconstructed leaves of the given tree mock-up. The projected leaf area (PLA) is the area of the vertical projection of the leaf crown on the ground. The leaf area index (LAI) is the ratio between TLA and PLA. The voxel number indicates the number of cubic pixels (voxels) of 0.2 × 0.2 × 0.2 cm3 necessary to encompass all the leaves of a mock-up, which allowed for computation of the crown volume. The leaf area density is the ratio between the leaf area and the voxel volume, and the mean value and the corresponding standard deviation over the entire crown were computed (LADm and LADstd, respectively). The diffuse surface to area ratio (STARdif) is the ratio between the PLA and the TLA, summed in 46 directions over the skyvault. Assuming a vertical projection, the sunlit area is equal to PLA, and the shaded area is the complement of TLA. The minimal and maximal daily latent heat flux (λE) values for each reconstructed mock-up were simulated by the RATP model over the entire studied period.
Publisher’s Note: MDPI stays neutral with regard to jurisdictional claims in published maps and institutional affiliations.

