Article

Data-Driven Models for Estimating Dust Loading Levels of ERV HEPA Filters

1
Department of Smart-City Engineering, INHA University, Incheon 22212, Korea
2
Department of Architectural Engineering, INHA University, Incheon 22212, Korea
*
Author to whom correspondence should be addressed.
Sustainability 2021, 13(24), 13643; https://doi.org/10.3390/su132413643
Submission received: 17 November 2021 / Revised: 7 December 2021 / Accepted: 8 December 2021 / Published: 10 December 2021
(This article belongs to the Topic Climate Change and Environmental Sustainability)

Abstract

:
With increasing global concerns regarding indoor air quality (IAQ) and air pollution, concerns about regularly replacing ventilation devices, particularly high-efficiency particulate air (HEPA) filters, have increased. However, users cannot easily determine when to replace filters. This paper proposes models to estimate the dust loading levels of HEPA filters for an energy-recovery ventilation system that performs air purification. The models utilize filter pressure drops, the revolutions per minute (RPM) of supply fans, and rated airflow modes as variables for regression equations. The obtained results demonstrated that the filter dust loading level could be estimated once the filter pressure drops and RPM, and voltage for the rated airflow were input in the models, with a root mean square error of 5.1–12.9%. Despite current methods using fewer experimental datasets than the proposed models, our findings indicate that these models could be efficiently used in the development of filter replacement alarms to help users decide when to replace their filters.

1. Introduction

With the rapid growth of the global economy, indoor air quality (IAQ) has emerged as a major global concern [1,2,3,4]. The source of most indoor pollutants is the inflow of atmospheric pollutants, such as automotive exhaust gas and particulate matter (PM); pollutants are also generated from the use of home appliances, furniture, consumer goods and the lifestyles of occupants [5,6]. Daily, most people spend 80 to 90% of their time in indoor spaces [7]. Considering these data, the adverse effects of indoor air pollution on occupants have also been reported through numerous studies [8,9,10,11,12,13,14]. The World Health Organization has also prepared, and updated, guidelines related to these effects since 1987 [15,16]. Therefore, proper ventilation and indoor air purification are required to maintain the IAQ at an optimal level and protect occupants from pollutants.
As the air purification capabilities of conventional ventilation systems are weak against air pollutants, occupants can use indoor air purifiers [17]. To complement the air purification capabilities of ventilation equipment, energy-recovery ventilation (ERV) systems equipped with high-efficiency particulate air (HEPA) filters (called ERV air purifiers) that combine the benefits of ventilation systems and air purifiers, are widely used [18,19]. ERV air purifiers prevent the inflow of air pollutants from the atmosphere by using high-efficiency fabric air filters in ventilation operations. They operate as conventional air purifiers when indoor air purification is required and as ventilators when ventilation is required. To use ERV air purifiers effectively, users should regularly replace air filters. According to the recommendations of the American Society of Heating, Refrigerating and Air-Conditioning Engineers (ASHRAE), air filters should be replaced when their final resistance becomes twice as high as the initial resistance due to dust loading [20]. However, most ERV manufacturers provide a guideline that only recommends intervals for cleaning filters and replacing them every 6 to 12 months. Thus, it is difficult for users to recognize when replacement is required, leading to the use of dust-loaded filters over an extended period [21].
In recent years, adequate management measures and standards for air filter replacement have been proposed to help users better recognize when to replace their filters [22]. According to Korean Industrial Standards, ERV systems and ERV air purifiers should activate a filter-replacement alarm when the mounted air filters reach final resistance (pressure drop at which filter is to be replaced). To estimate the filter dust loading level, a sensor system that can measure changes in the resistances of the mounted filters is required.
According to Kumar et al. [23], the indoor air pollution level can be monitored using gas sensors, aerosol particle counters, and sensor packages. Although HEPA filter dust-loading levels can be estimated using these sensor systems, the simplest and most economical way to do so is to install manometers on air filters and use them to measure the pressure drop [20]. However, installing manometers on products has been recognized as a cause for an increase in manufacturing cost because it is customary to replace HEPA filters according to the replacement interval. Therefore, few commercial models are equipped with manometers to measure changes in the pressure drop of a filter. Numerous manufacturers are now seeking ways to estimate HEPA filter dust-loading levels by observing the changes in the supply air (SA) fan alone, to reduce manufacturing costs and improve their services.
As summarized in Table 1, most studies on HEPA filters focus on air purifiers and evaluated the effect of installing HEPA filters in IAQ devices on IAQ improvement. One study measured the pressure drop of an entire HEPA filter and demonstrated the possibility of finding the optimal replacement frequency intervals of HEPA filters. However, this was only applicable for radioactive aerosol filtration systems in nuclear power plants. To the best of our knowledge, only one study has surveyed the IAQ improvement of ERV air purifiers using HEPA filters, and, as of yet, no studies have surveyed HEPA filter dust-loading estimation for IAQ devices. IAQ can be significantly improved using HEPA filters. Nevertheless, no studies have been conducted as of yet estimating HEPA filter dust loading that provides essential information on maintaining the IAQ at a certain level.
Hence, in this study, a HEPA filter dust loading prediction model was developed, based on analyzing the pressure drop of an HEPA filter and the RPM of an SA fan for standing ERV air purifiers with a general flow path. The development of the model and the experiment that was conducted to evaluate its performance are discussed.

2. Materials and Methods

2.1. Target ERV Air Purifier

This study focuses on an ERV air purifier with a rated air flow rate of 400 CMH. A stand-up type of ERV air purifier was developed in the indoor space to facilitate user management and direct SA to indoor spaces from outdoor air (OA). The ERV air purifier used a fabric filter with a minimum efficiency reporting value of 16 (as recommended by ASHRAE) and an efficient particulate air grade of H13. The HEPA filter was installed between the ERV unit and SA fan.
The target system operated across two different flow paths for ventilation and air purification, as shown in Figure 1. In the ventilation mode, OA was supplied to indoor spaces through the SA fan after it passed through the ERV unit and H13 filter along the blue line represented in Figure 1a, whereas the return air (RA) was discharged outside through the exhaust-air fan along the red line. The air purification mode had the flow path of general air purifiers, whereby RA was supplied to indoor spaces through the SA fan after it passed through the bypass damper and filter.
The SA fan had low, mid, and high rated air flow rates of 150, 250, and 400 CMH, respectively. These air-flow rates were determined by the motor-speed adjusting voltage (VSP) value of the SA fan. Depending on the operation mode and air flow rate, the SA fan had fixed VSP values of 55, 64, and 81 in the ventilation mode and 52, 61, and 79 in the air purification mode at low, mid, and high rated air flow rates, respectively. The system displayed information on the air flow rate (low, mid, and high) and operation mode (ventilation or air purification) on the display panel and the current RPM information of each fan by converting this to the mode set by the administrator.
Figure 2 shows the characteristic curves of the SA fan and system curves of the ERV air purifier. The x-axis represents the air flow rate of the SA fan. The y-axis on the left represents the static pressure, and represents the RPM on the right. For clean filters, the system curve of the ERV air purifier is represented by curve (A), and the operating point of the SA fan is represented by Q1, ΔP1, and RPM1. If the system curve is represented by curve (B) due to dust loading in the filter under PM inflow, the air flow rate decreases to Q2, while ΔP and RPM increase to ΔP2 and RPM2, respectively, thereby forming a different operating point. Here, the fan is capable of variable frequency drive control, which increases the output power of the motor by changing the VSP to compensate for the decrease in the air-flow rate. This allows for the easy prediction of the HEPA filter dust-loading levels, using only the change in the SA fan output for air-flow-rate compensation. In contrast, the target ERV air purifier uses a general SA fan without control logic. Therefore, the dust loading status of the filter can only be estimated from the change in the RPM of the SA fan caused by a change in the filter condition.
As shown in Figure 2, the RPM and ΔPfilter of the target ERV air purifier increased with the dust loading level of the H13 air filter. Data obtained from the air purifier include the operation mode, VSP, and RPM. Since the operation mode and VSP had constant values irrespective of the dust loading level of the air filter, two different filter dust-loading estimation models were constructed, depending on the operation mode. Because the ΔPfilter increased due to the increase in the pressure drop caused by dust loading in the H13 air filter, the changes in the ΔPfilter were measured by installing manometers in front of and behind the H13 air filter. Both ΔPfilter and RPM, which had continuous values, were used as continuous variables. Based on the characteristics of the target system under air filter dust loading, the data that can be used to predict the dust loading level in the ERV air purifier are summarized in Table 2.

2.2. Prediction Method for Filter Dust Loading Level

Since the filter dust loading caused by the inflow of PM increases the filter-pressure drop, an artificial pressure drop was induced by attaching a tape to the surface of the filter through which the airflow stream passed. The ratio of the blocked area to the entire filter passage area was defined as the filter-covering factor (CF), which is expressed through Equation (1).
CF = A cover A filter   ,
where Afilter (m2) is the initial area of the filter and Acover (m2) is the area artificially blocked by the tape. The Acover is always smaller than or equal to Afilter, and the CF cannot exceed 1 in actual specimens.
The CF expresses the physical dust-loading level of the filter. It does not represent the actual dust load (g) of the filter. If the CF of the filter used in a system is 0.5, the concept of equivalence can be applied, whereby this filter will be considered the same as a clean filter, with 50% of its area artificially blocked. Therefore, filter samples with different CF values were applied to the target system during the experiment, and the VSP, RPM, and ΔPfilter of the SA fan were measured to obtain the required datasets.
Figure 3 shows the process of constructing and testing models from the experimental stage; 50% of the datasets obtained from the experiment were used for modeling, and the remaining 50% were used for testing the constructed data-driven models. The ΔPfilter was measured using Testo 400, and the RPM of the SA fan motor was measured at 60 Hz and 220 V.
To estimate the air filter dust-loading level, the models in this study were derived using regression analysis. Regression analysis is typically employed for estimating the relationship between one dependent variable and one or more independent variables through statistical analysis [32]. This analysis is conducted based on several assumptions and is generally known to provide increasingly accurate estimations as the number of datasets increases [33]. As only two to three variables were available in the target system, including the VSP and RPM of the SA fan, as well as the ΔPfilter, depending on the case, and the required number of contaminated filter samples could not be secured, only 30 datasets were collected from the lab-scale test to derive the models. Therefore, models were derived via regression analysis by curve fitting alone of the actual and estimated values.
The proposed models were derived in three forms, as summarized in Table 3, and the results were compared. The model type in case A was available when both the ΔPfilter and RPM could be measured, and, for case B, was only available when the RPM could be measured. Case B was used for most products without manometers in their models, so as to reduce the cost of these mass-produced products. The form of case C was similar to that of case B in that only the RPM could be measured in both, but different from case B in that the ΔPfilter was estimated using the RPM, and the estimated ΔPfilter was used again as a variable to estimate the CF. Case C was proposed as a model type to improve the prediction accuracy of case B.

3. Results

3.1. Experimental Results
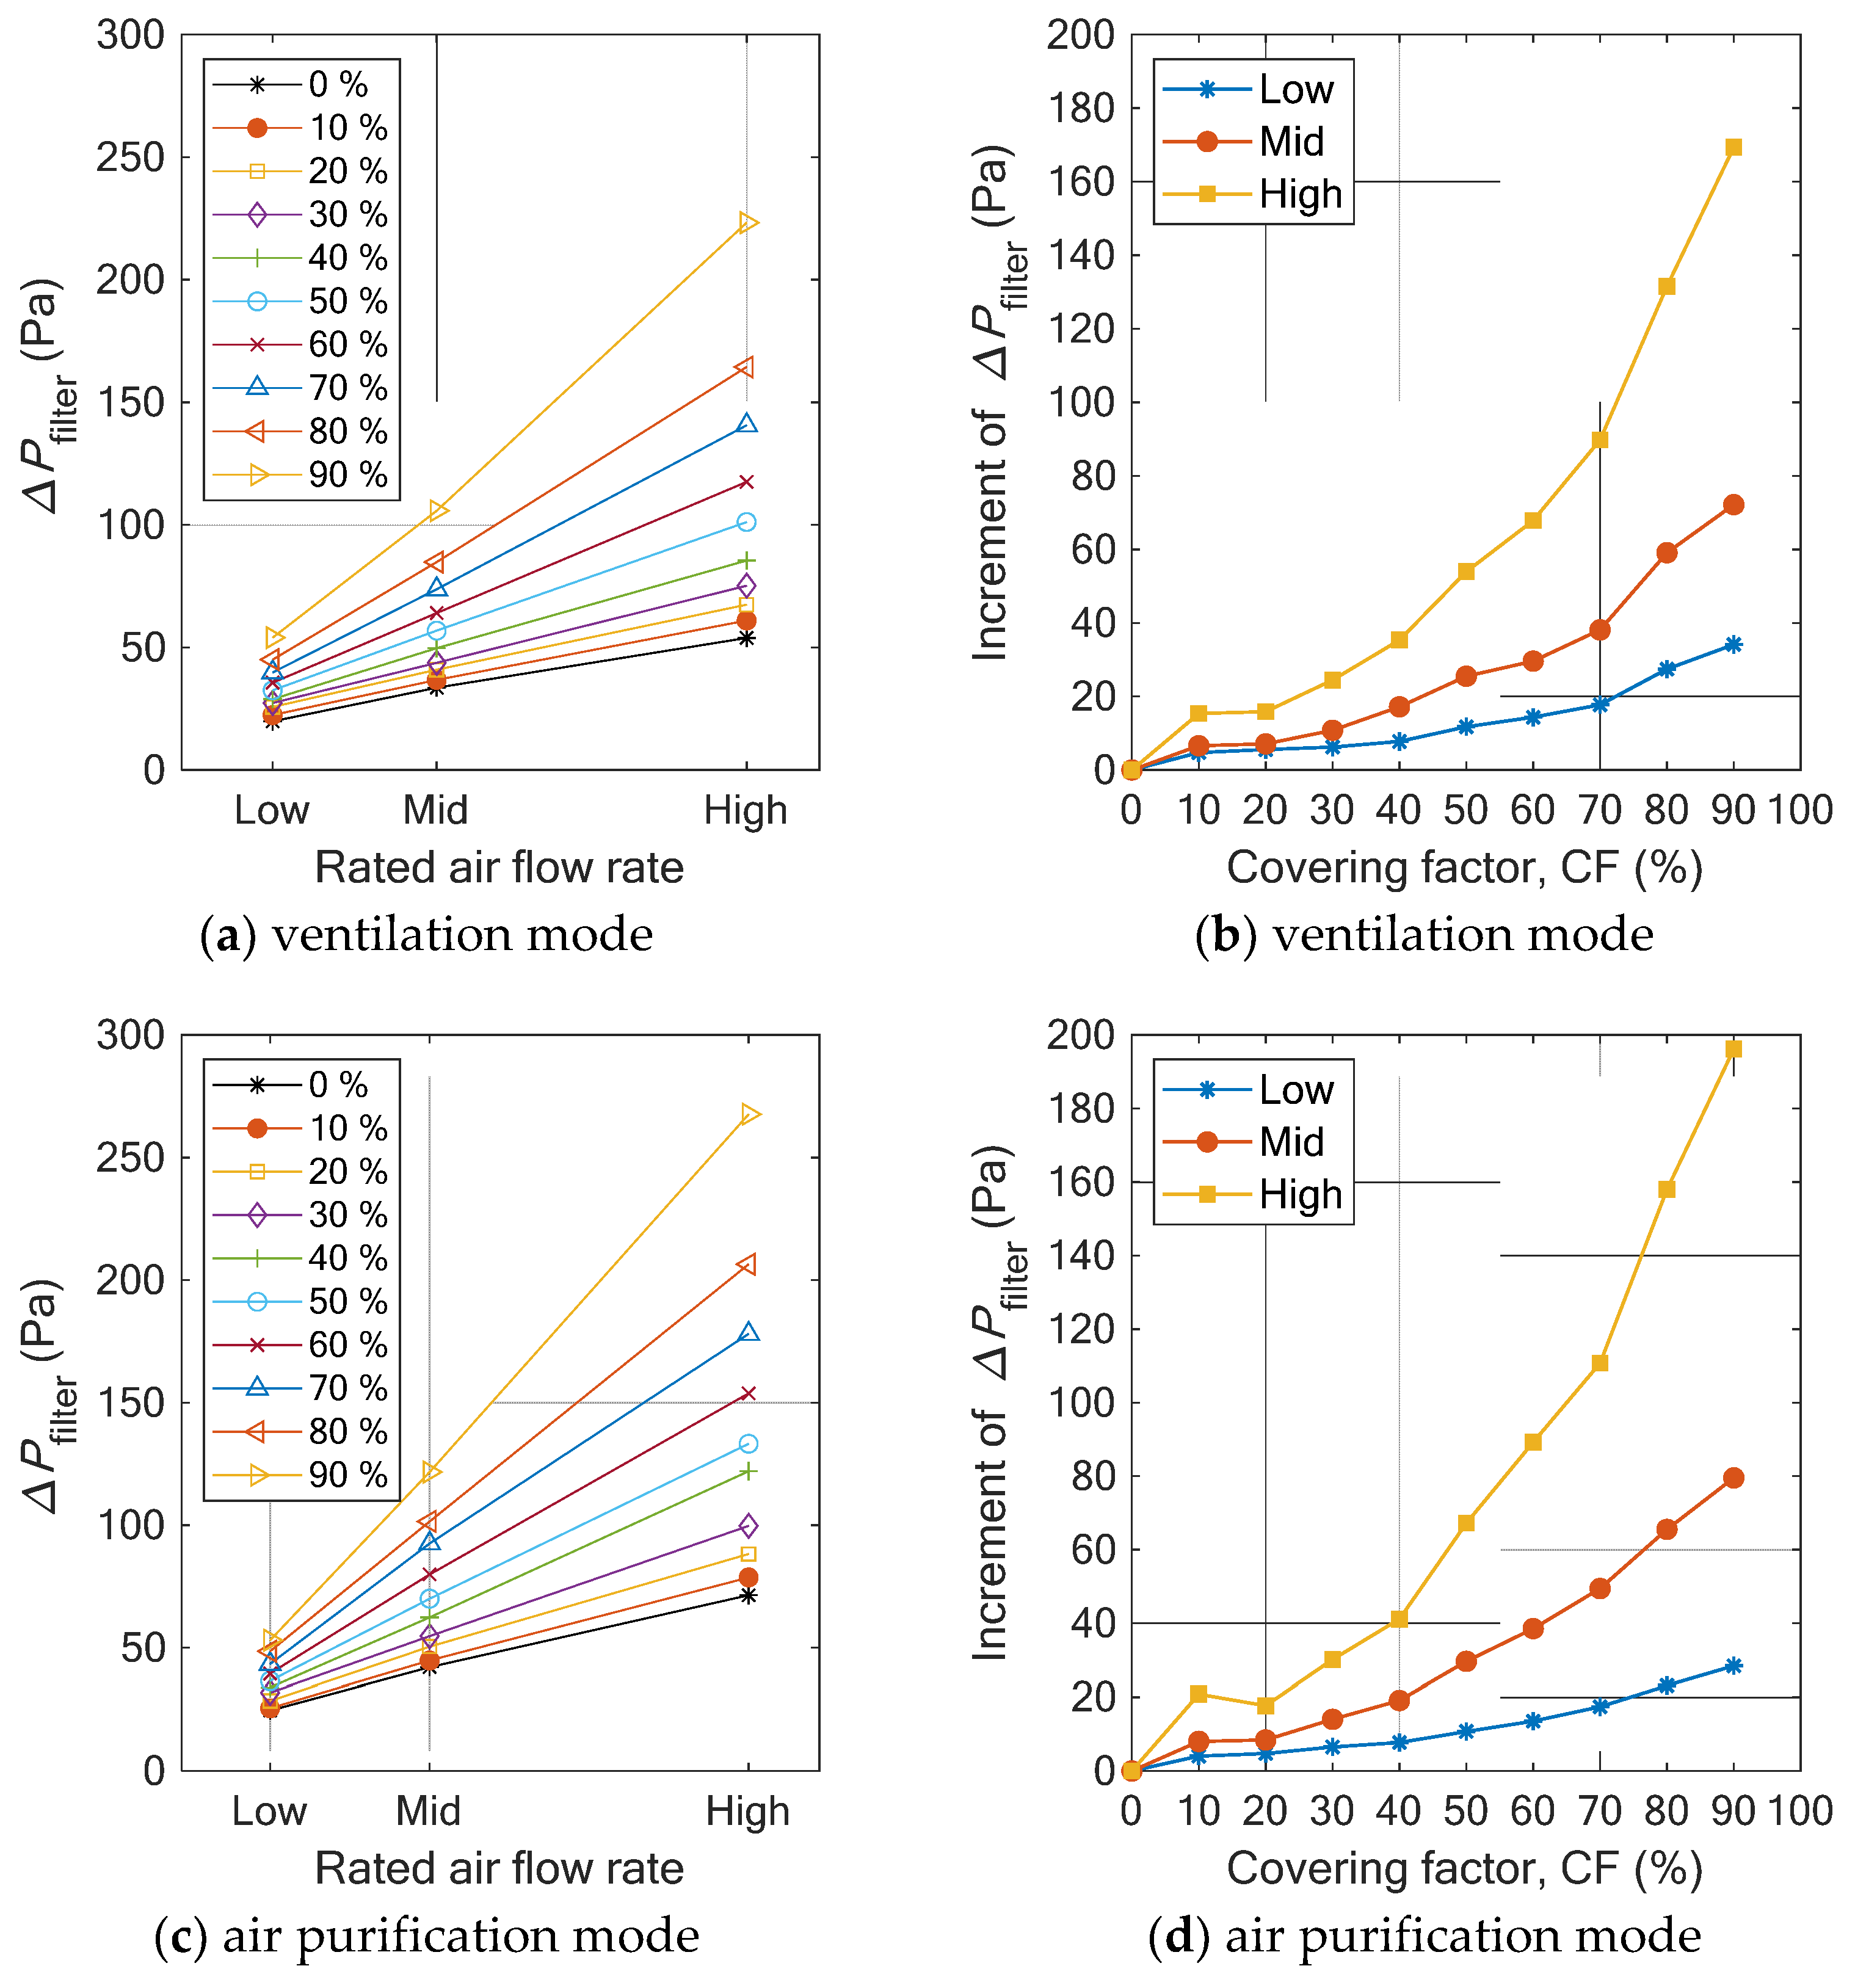
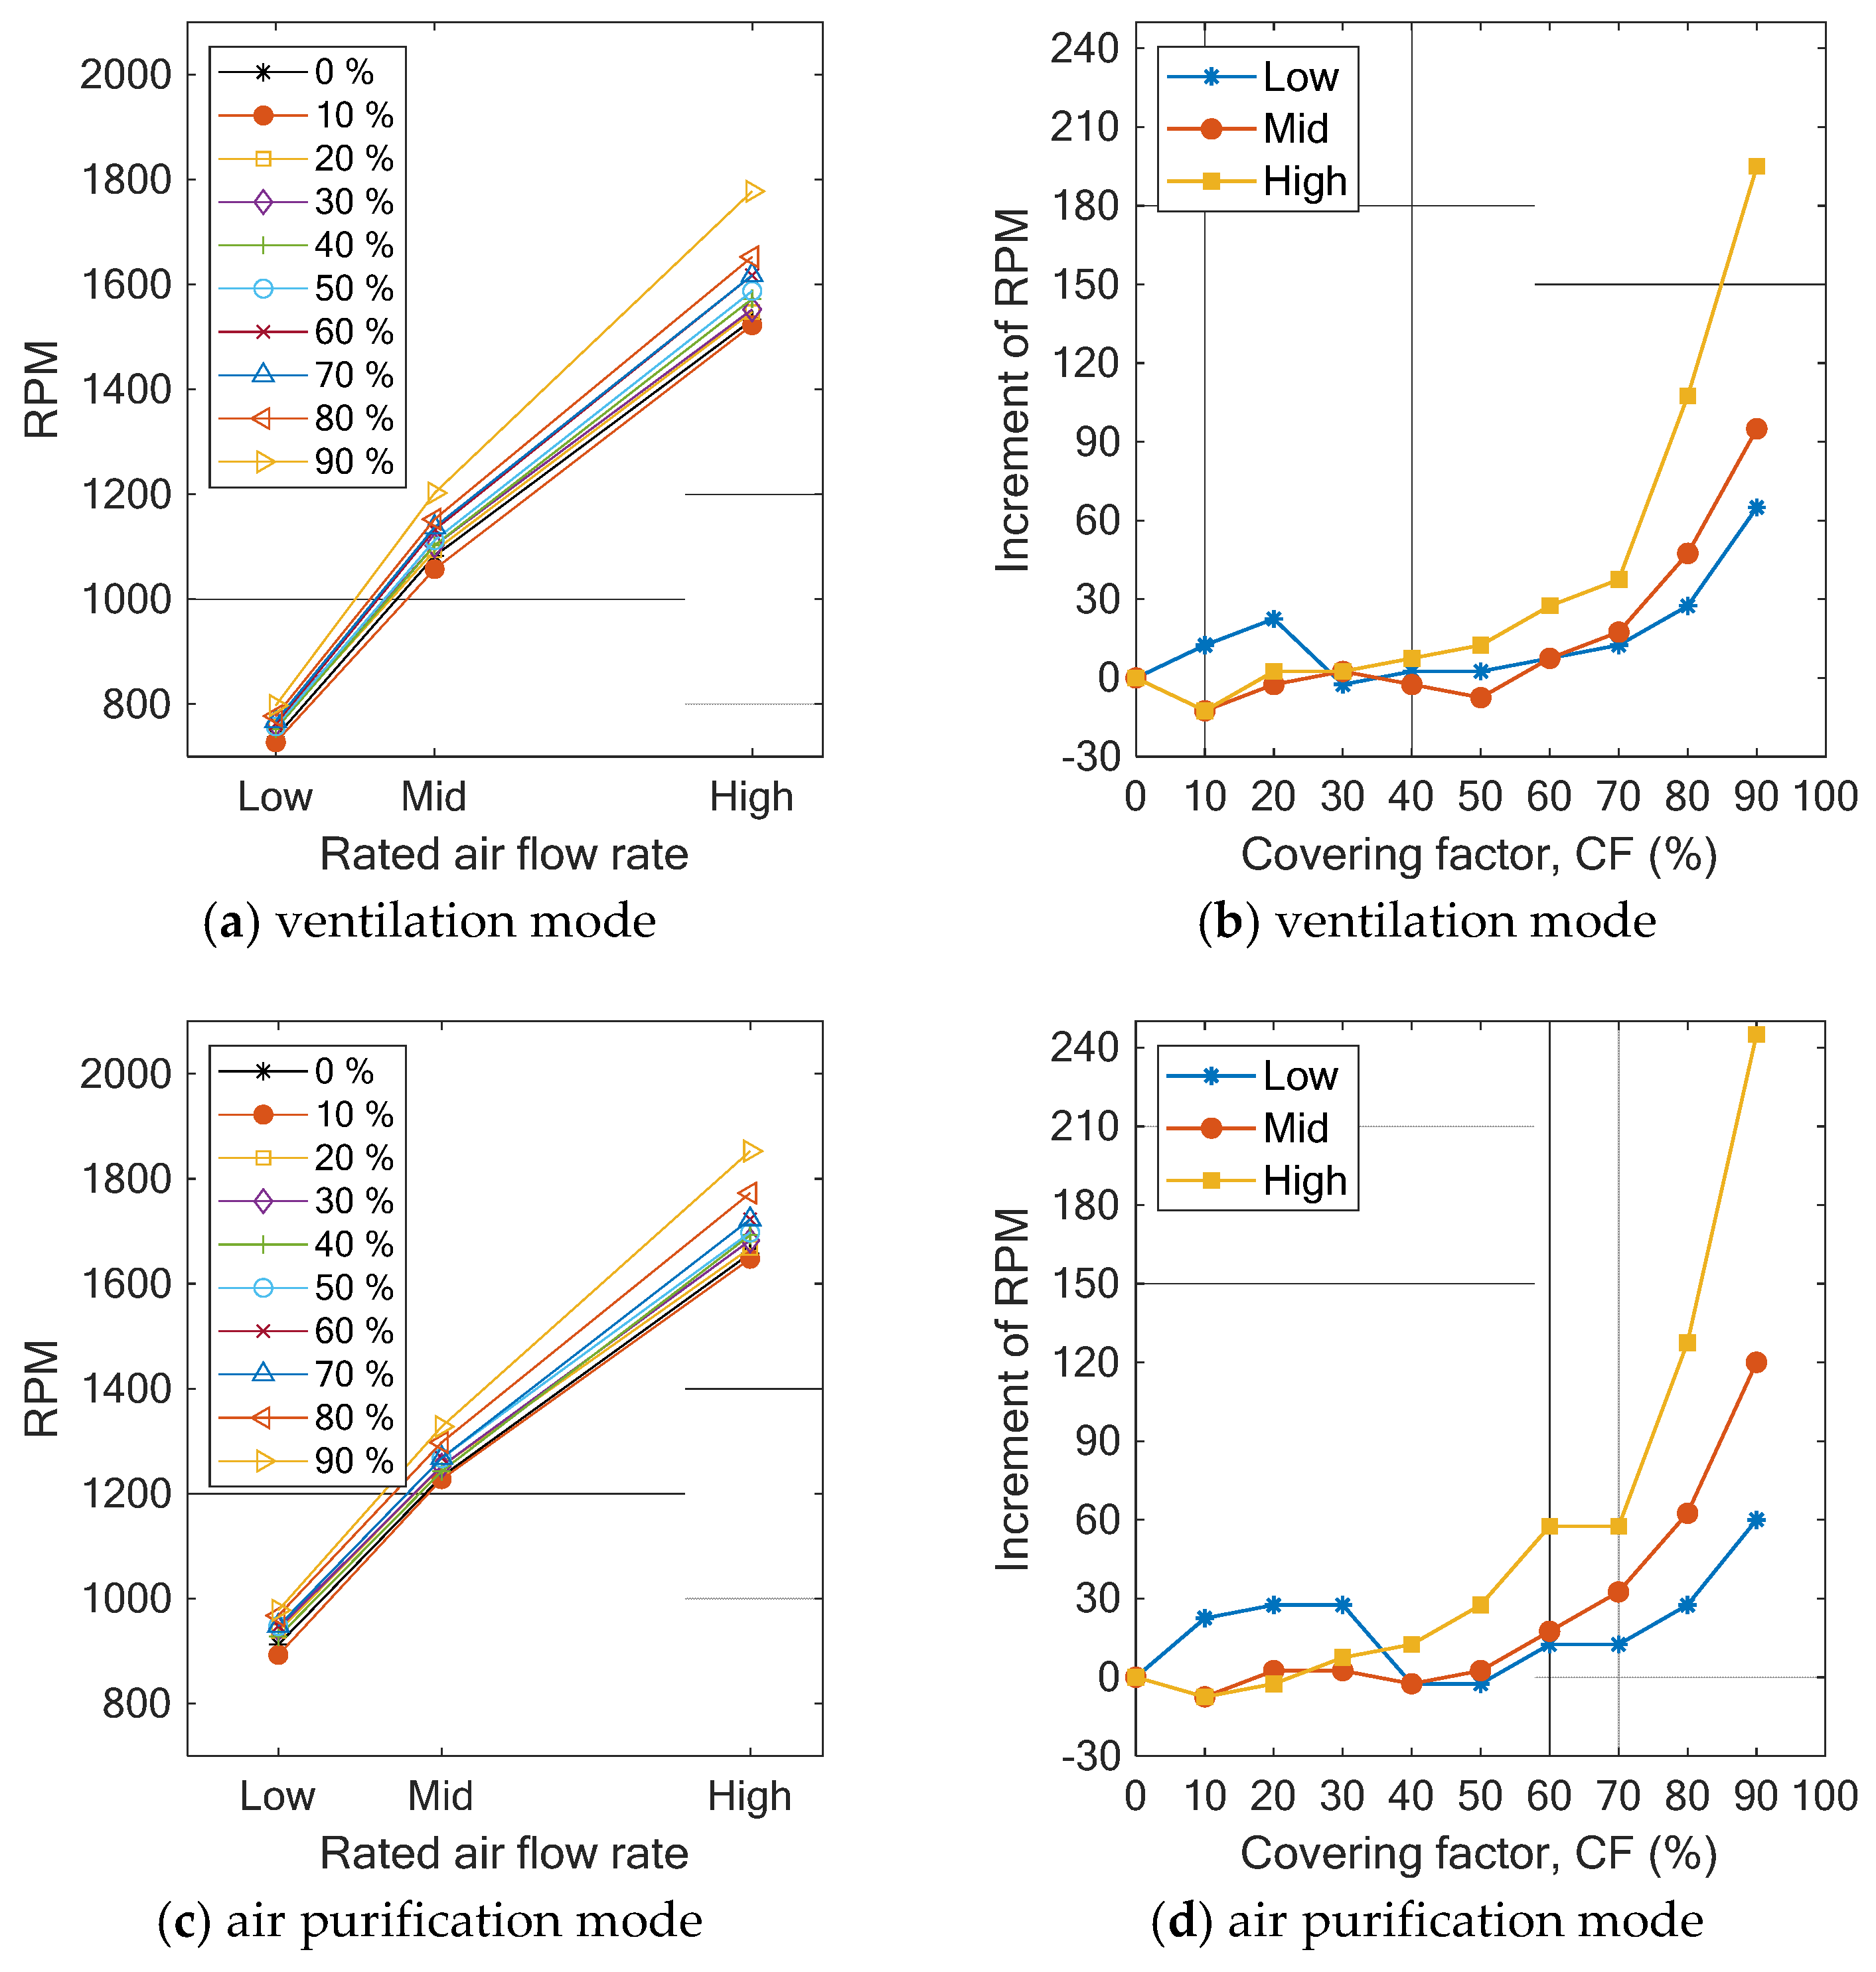
Figure 4 and Figure 5 show the changes in the ΔPfilter and RPM with increasing CF. Figure 4a–d and 
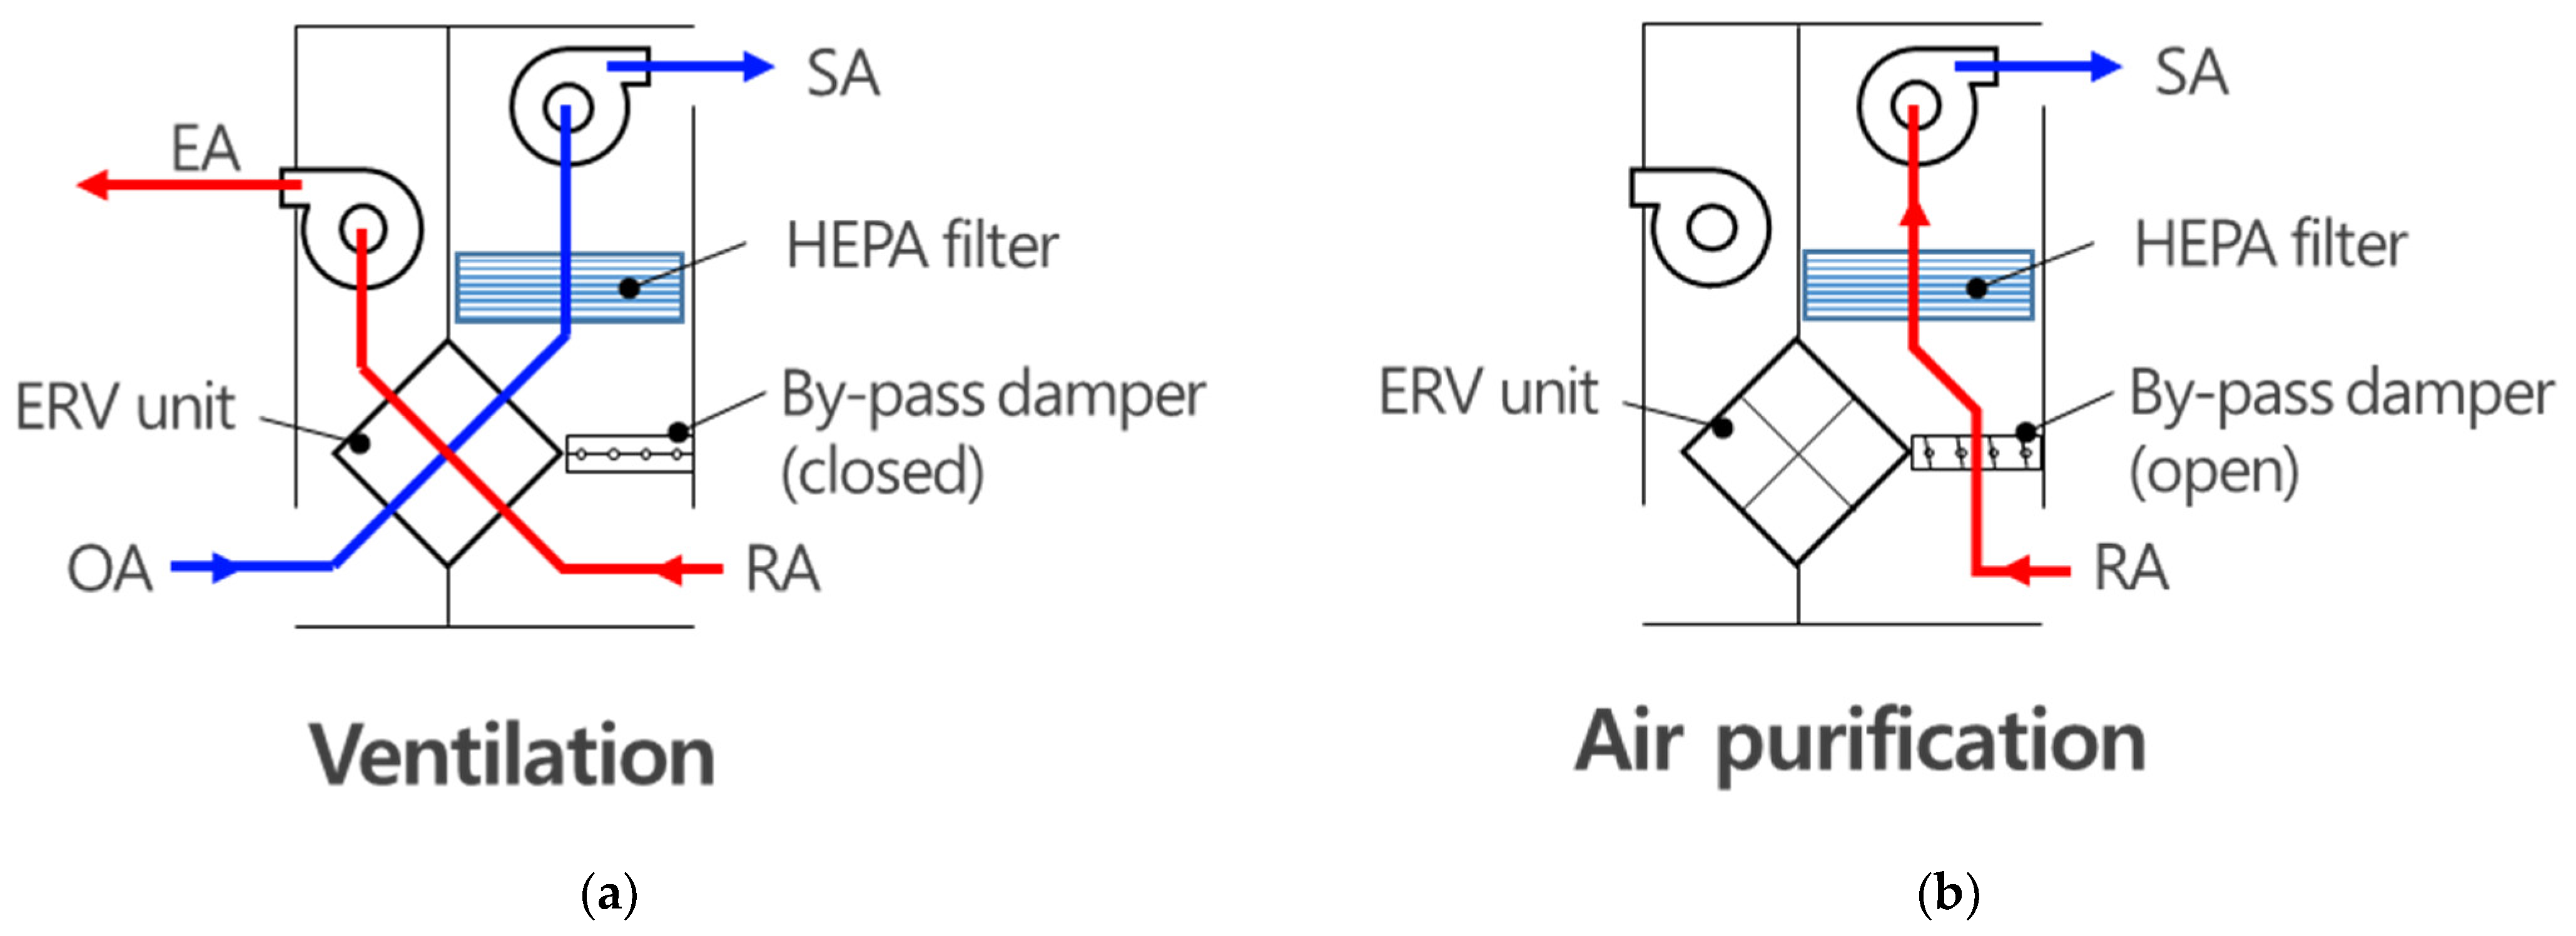
Figure 5a–d show the data measured in the ventilation and air purification models, as shown in Figure 1, respectively. Figure 4a,c and Figure 5a,c show the relationship between the ΔPfilter and CF in the ventilation and air purification modes, respectively, and Figure 4b,d and Figure 5b,d show the relationship between the RPM and CF. The 
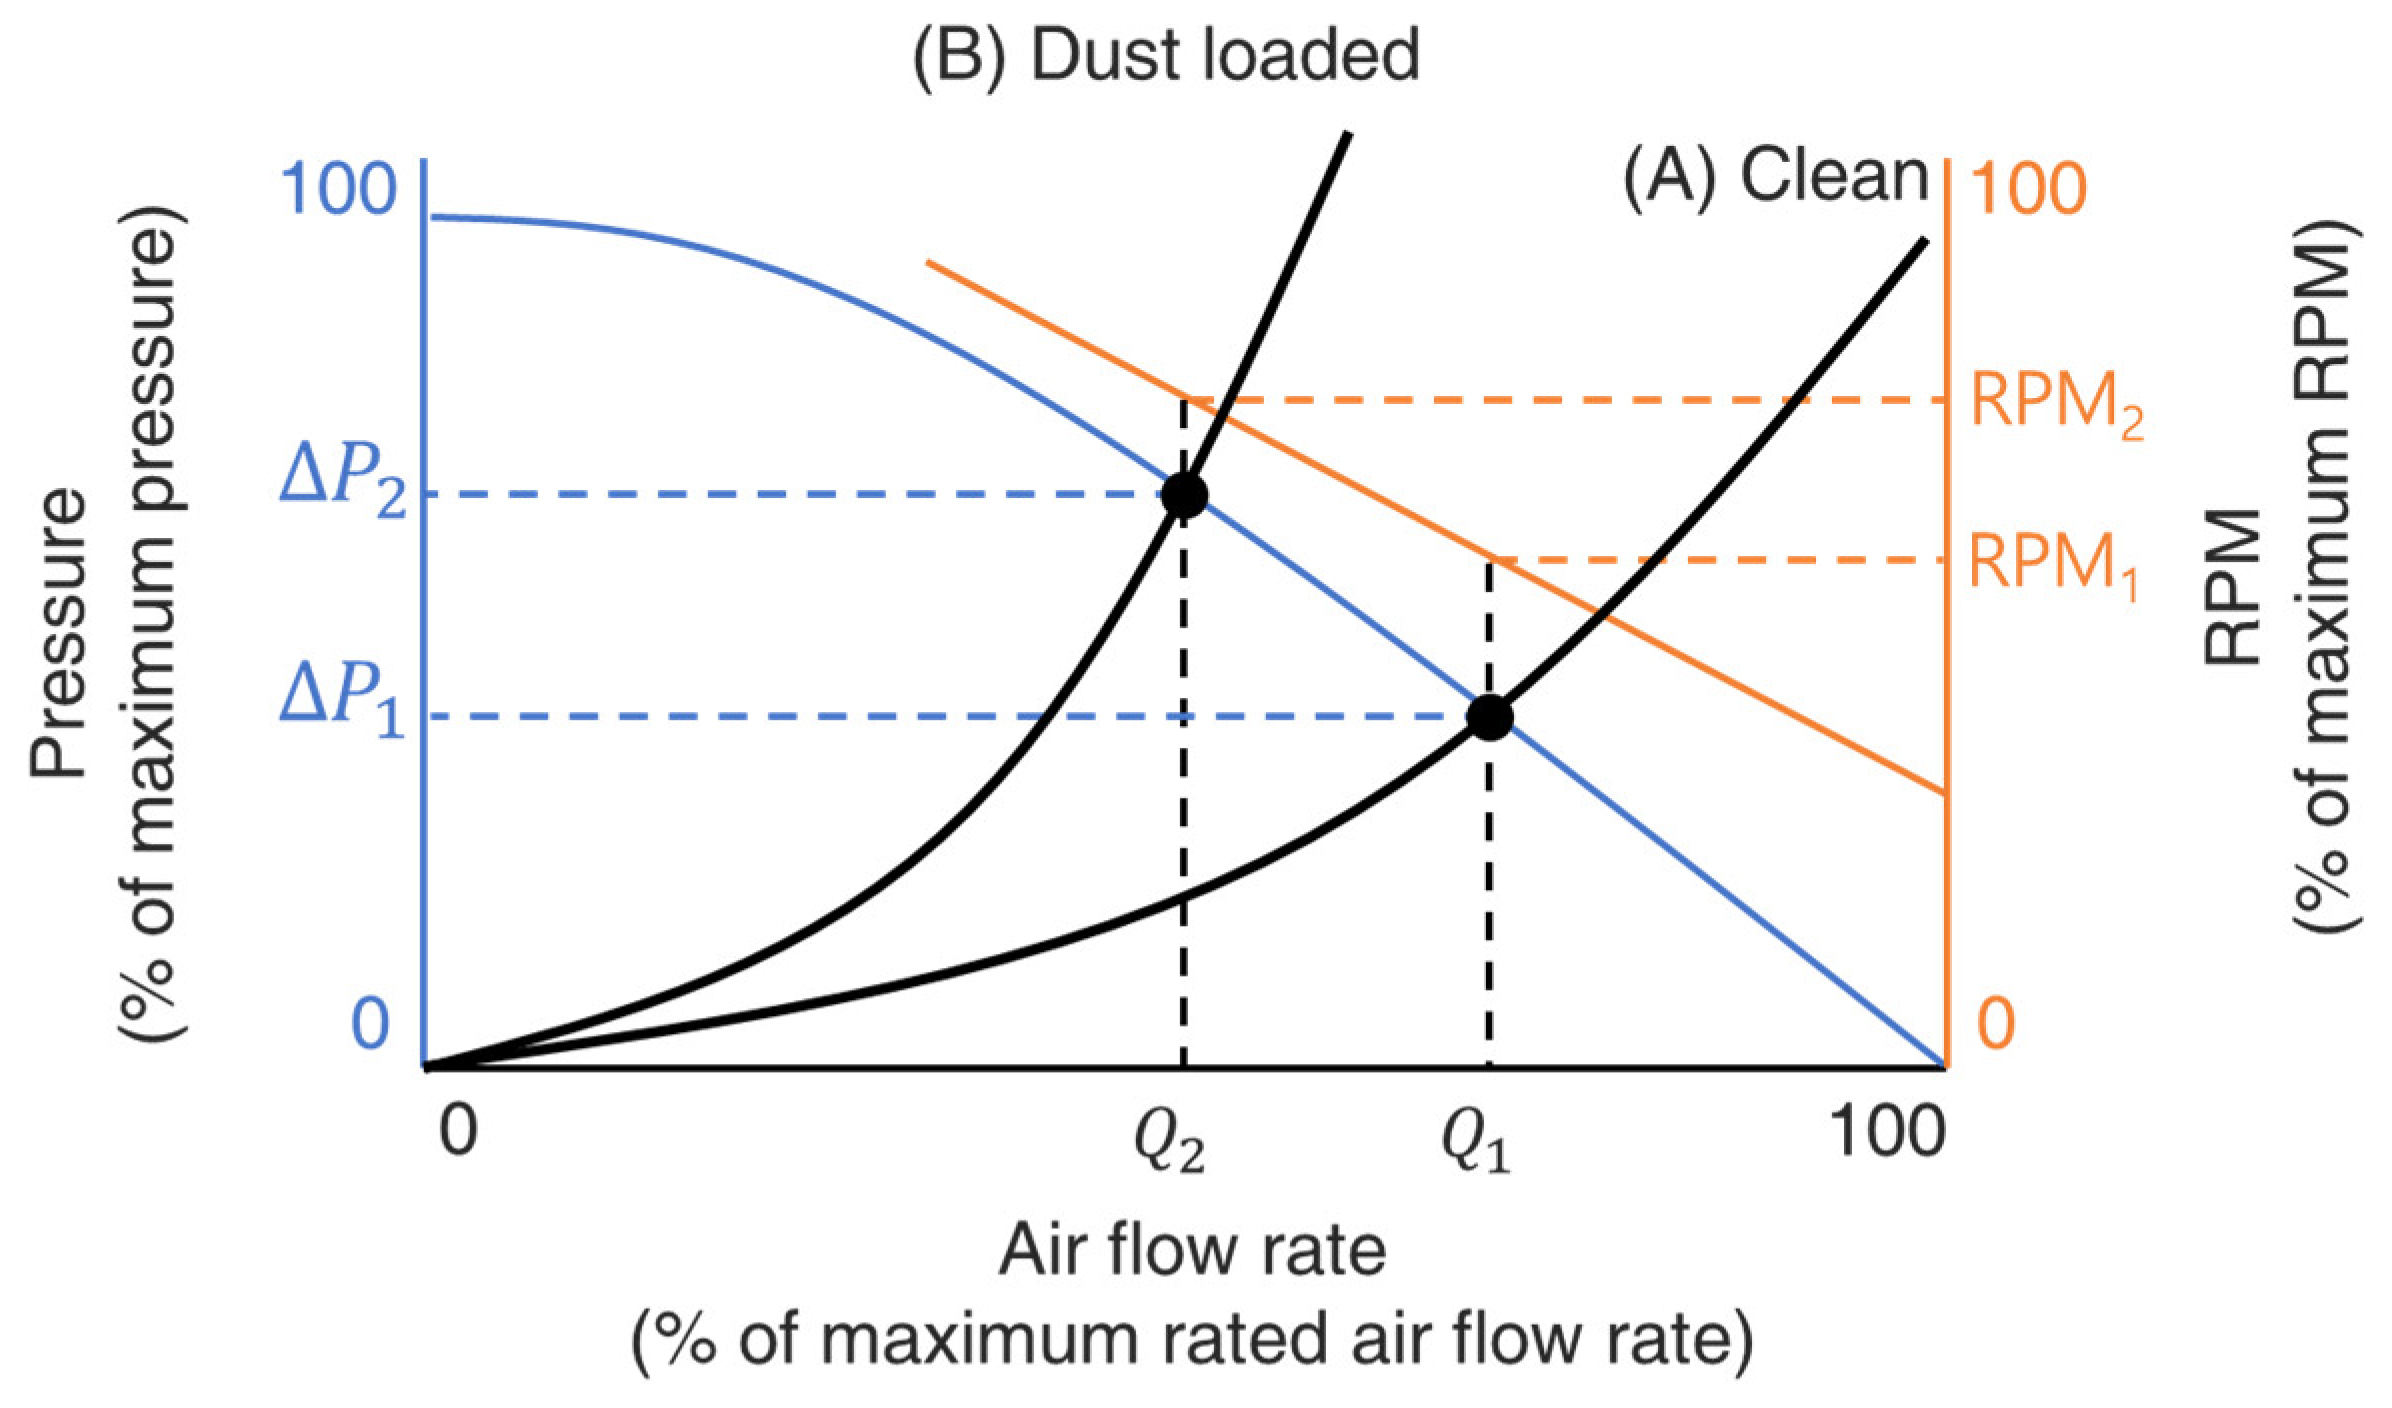
x-axis of each graph represents the VSP value of the SA fan, determined for each of the ventilation and air purification modes. In general, the VSP value was used to set the desired air flow rate by adjusting the RPM of the fan motor. Unless a fan motor control algorithm was used, the VSP would have produces a unique value for each rated air-flow rate.
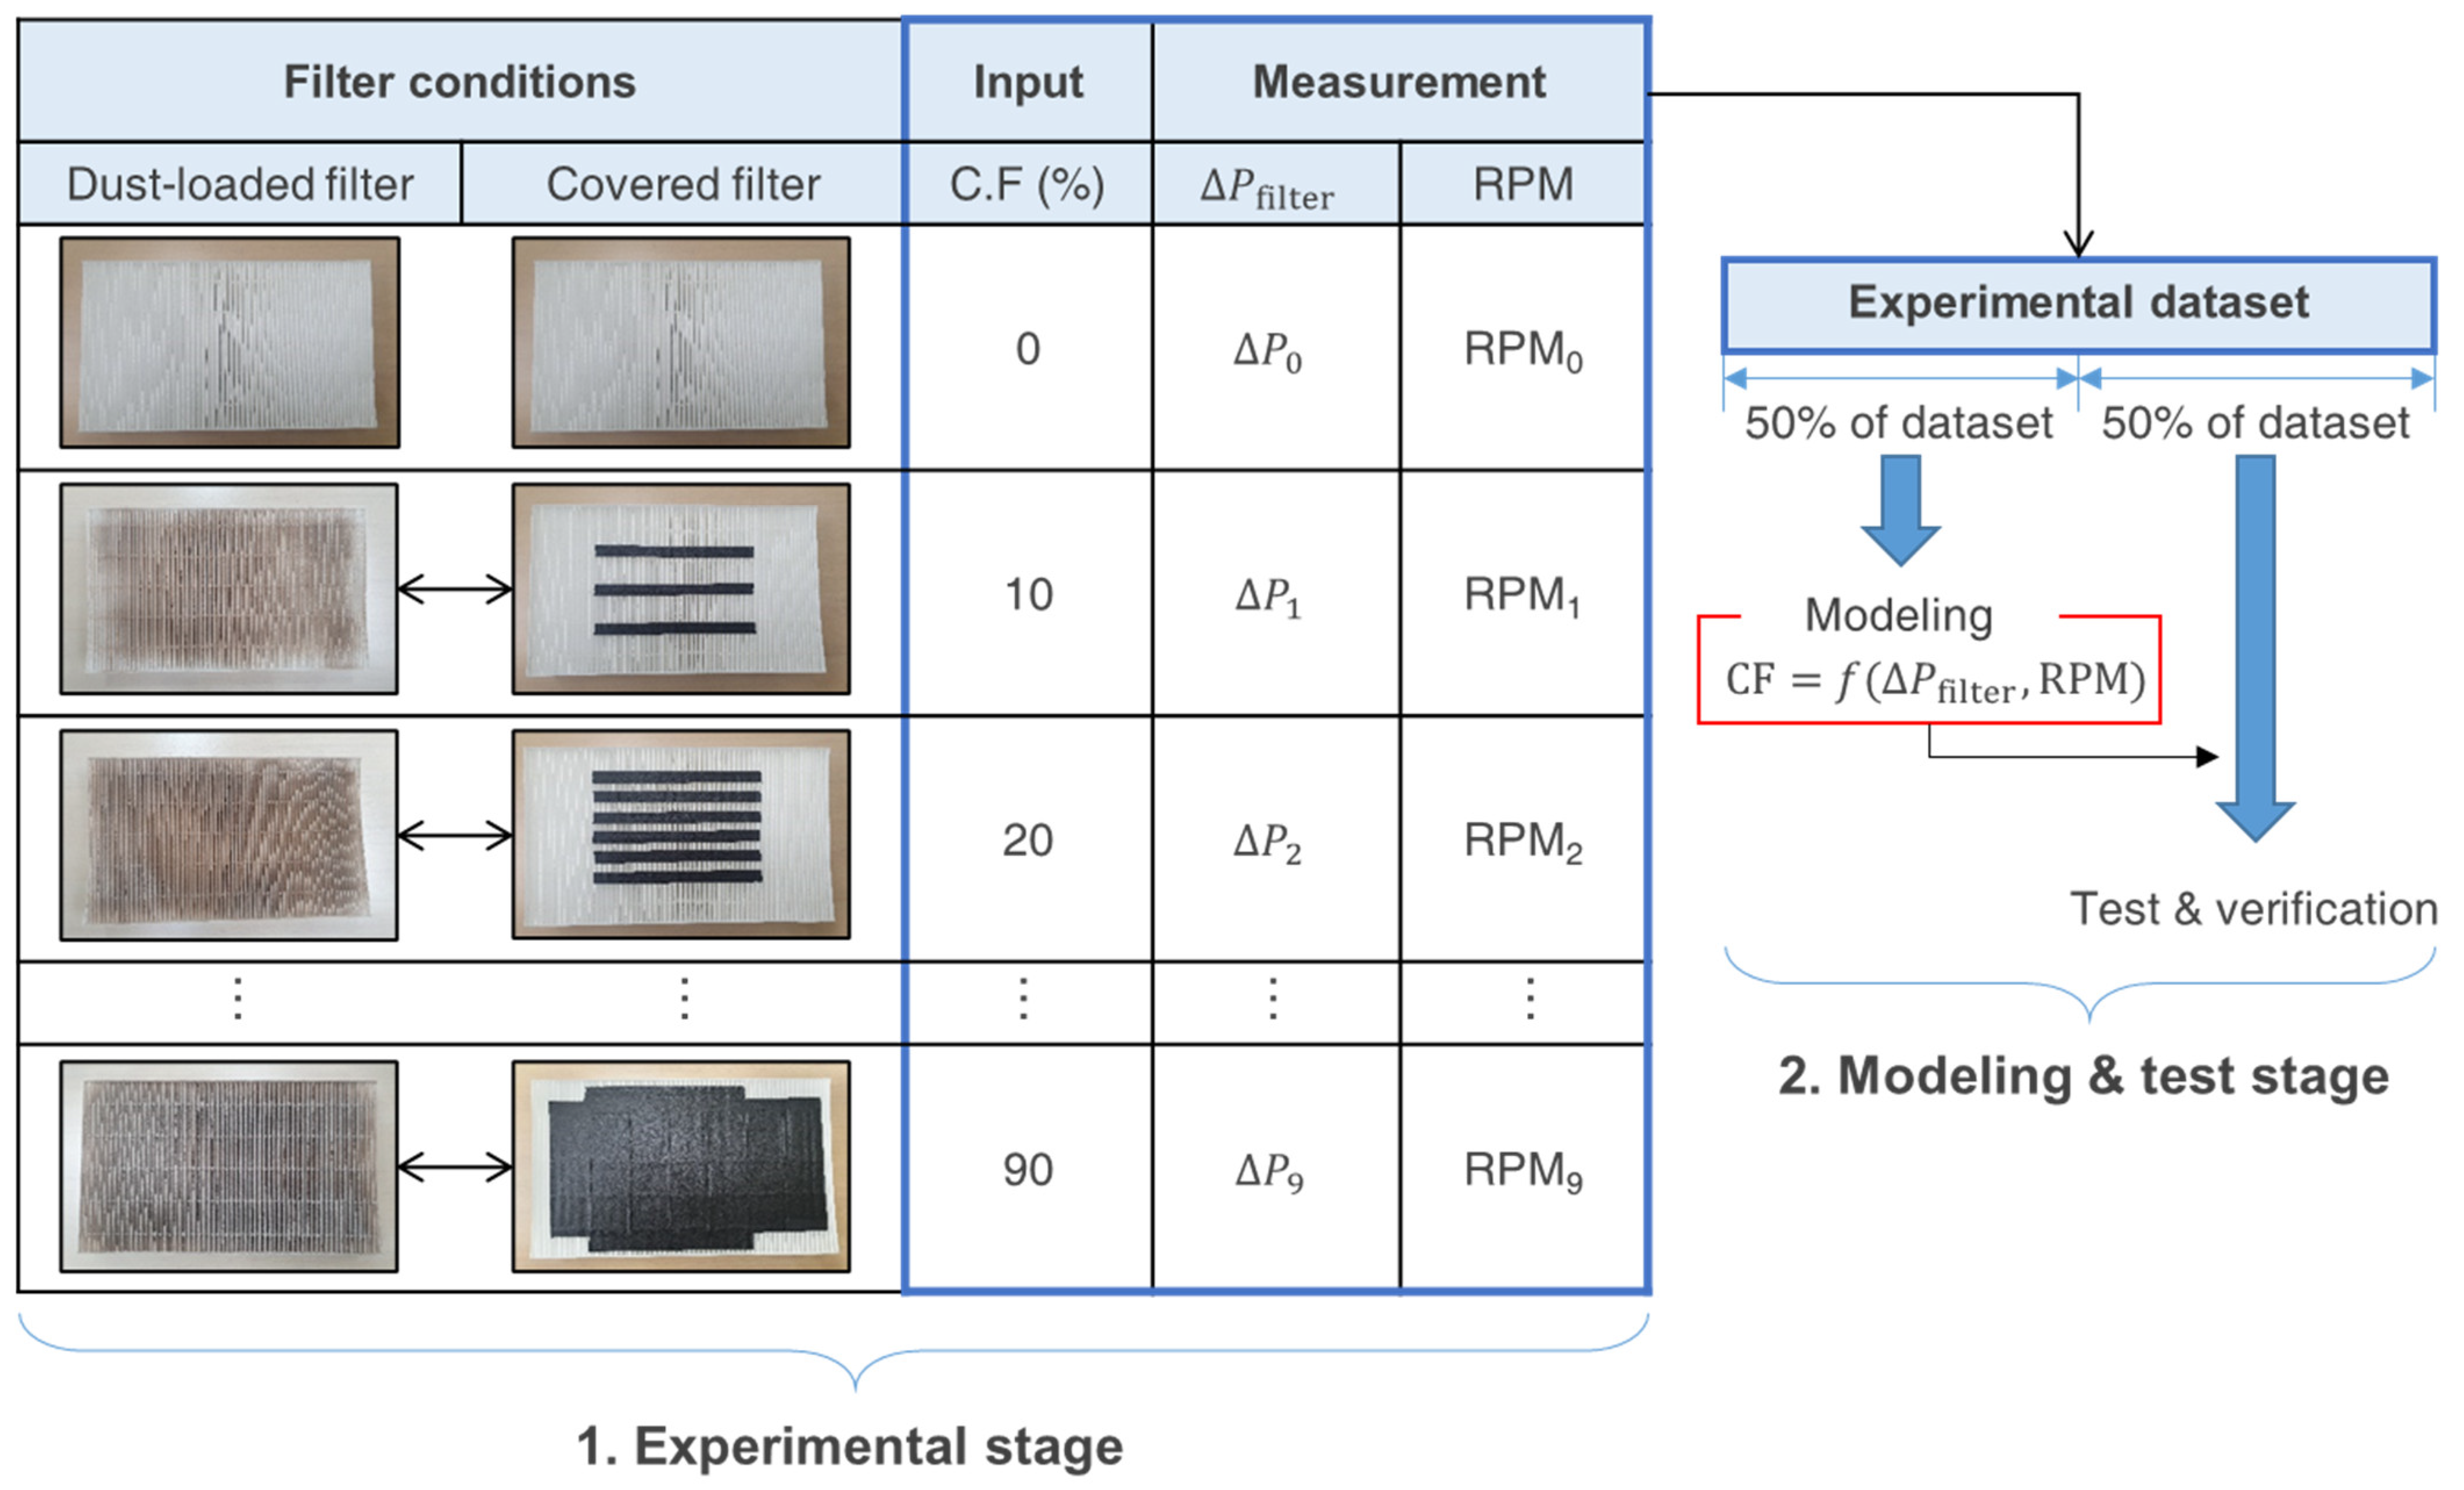
While constructing a regression model, the changes in the measurements of the variables, caused by the increase in the air filter dust-loading level of the system should be clearly indicated. As shown in Figure 4 and Figure 5, the changes in ΔPfilter and RPM of the system, which occurred due to the changes in the CF, were more evident when the rated flow rate was “high” than when it was “low” and were more apparent in the air purification mode than in the ventilation mode; the latter is related to the flow path of the OA in the ERV unit. In the ventilation mode, OA passed through the duct and ERV unit since the ERV flow path opened to the outdoor atmosphere. Accordingly, the SA fan needed to cover the pressure drop that occurred when the outdoor airflow passed through the duct and ERV unit. Additionally, the flow path of the ERV unit in the air purification mode was a closed circuit, that only circulated indoor air, and the pressure drop occurred only in the HEPA filter. Accordingly, the change in the air purification mode was more pronounced than that in the ventilation mode. In addition, as shown in Figure 4b,d and Figure 5b,d, the increment of the ΔPfilter followed a gradual and clear increasing trend in the entire section. However, the increment in the RPM made it difficult to distinguish the rated air flow rates, based only on observing changes in the measured values for CF ≤ 50%. It was only valid for CF ≥ 70% and showed a rapidly increasing trend when the rated flow rate was “high”. This indicated that the mode of the rated air flow rate had to be determined in advance to obtain significant results when the RPM was used as an independent variable. Therefore, the VSP, which determines the rated air flow rate, was used as a categorical variable to distinguish the low, mid, and high rated air flow rates in all of the three models listed in Table 3.

3.2. Test Results with the Proposed Regression Model

Table 4, Table 5 and Table 6 describe regression models that include either or all some of the following as input variables: VSP, ΔPfilter, and RPM as; and CF as the output variable. Since the flow path of the system was different for each operation mode, the results were presented separately for the ventilation and air purification modes and separately according to the rated air flow rates (low, mid, or high). Irrespective of the modes, the regression models for the filter dust-loading level estimation were classified as A, B, or C, according to the input variables that were used. Apart from the VSP, which was included in the models A, B, and C as a categorical variable, ΔPfilter and RPM were used as independent variables in model A, and RPM alone was used in models B and C, as summarized in Table 4. For each model, Equations (2)–(5) were used. The ventilation and air purification modes were distinguished, and coefficients a, b, and c as well as VSP were used, as summarized in Table 5 and Table 6.
Of the overall measured data of the regression models, 50% were used for modeling. 
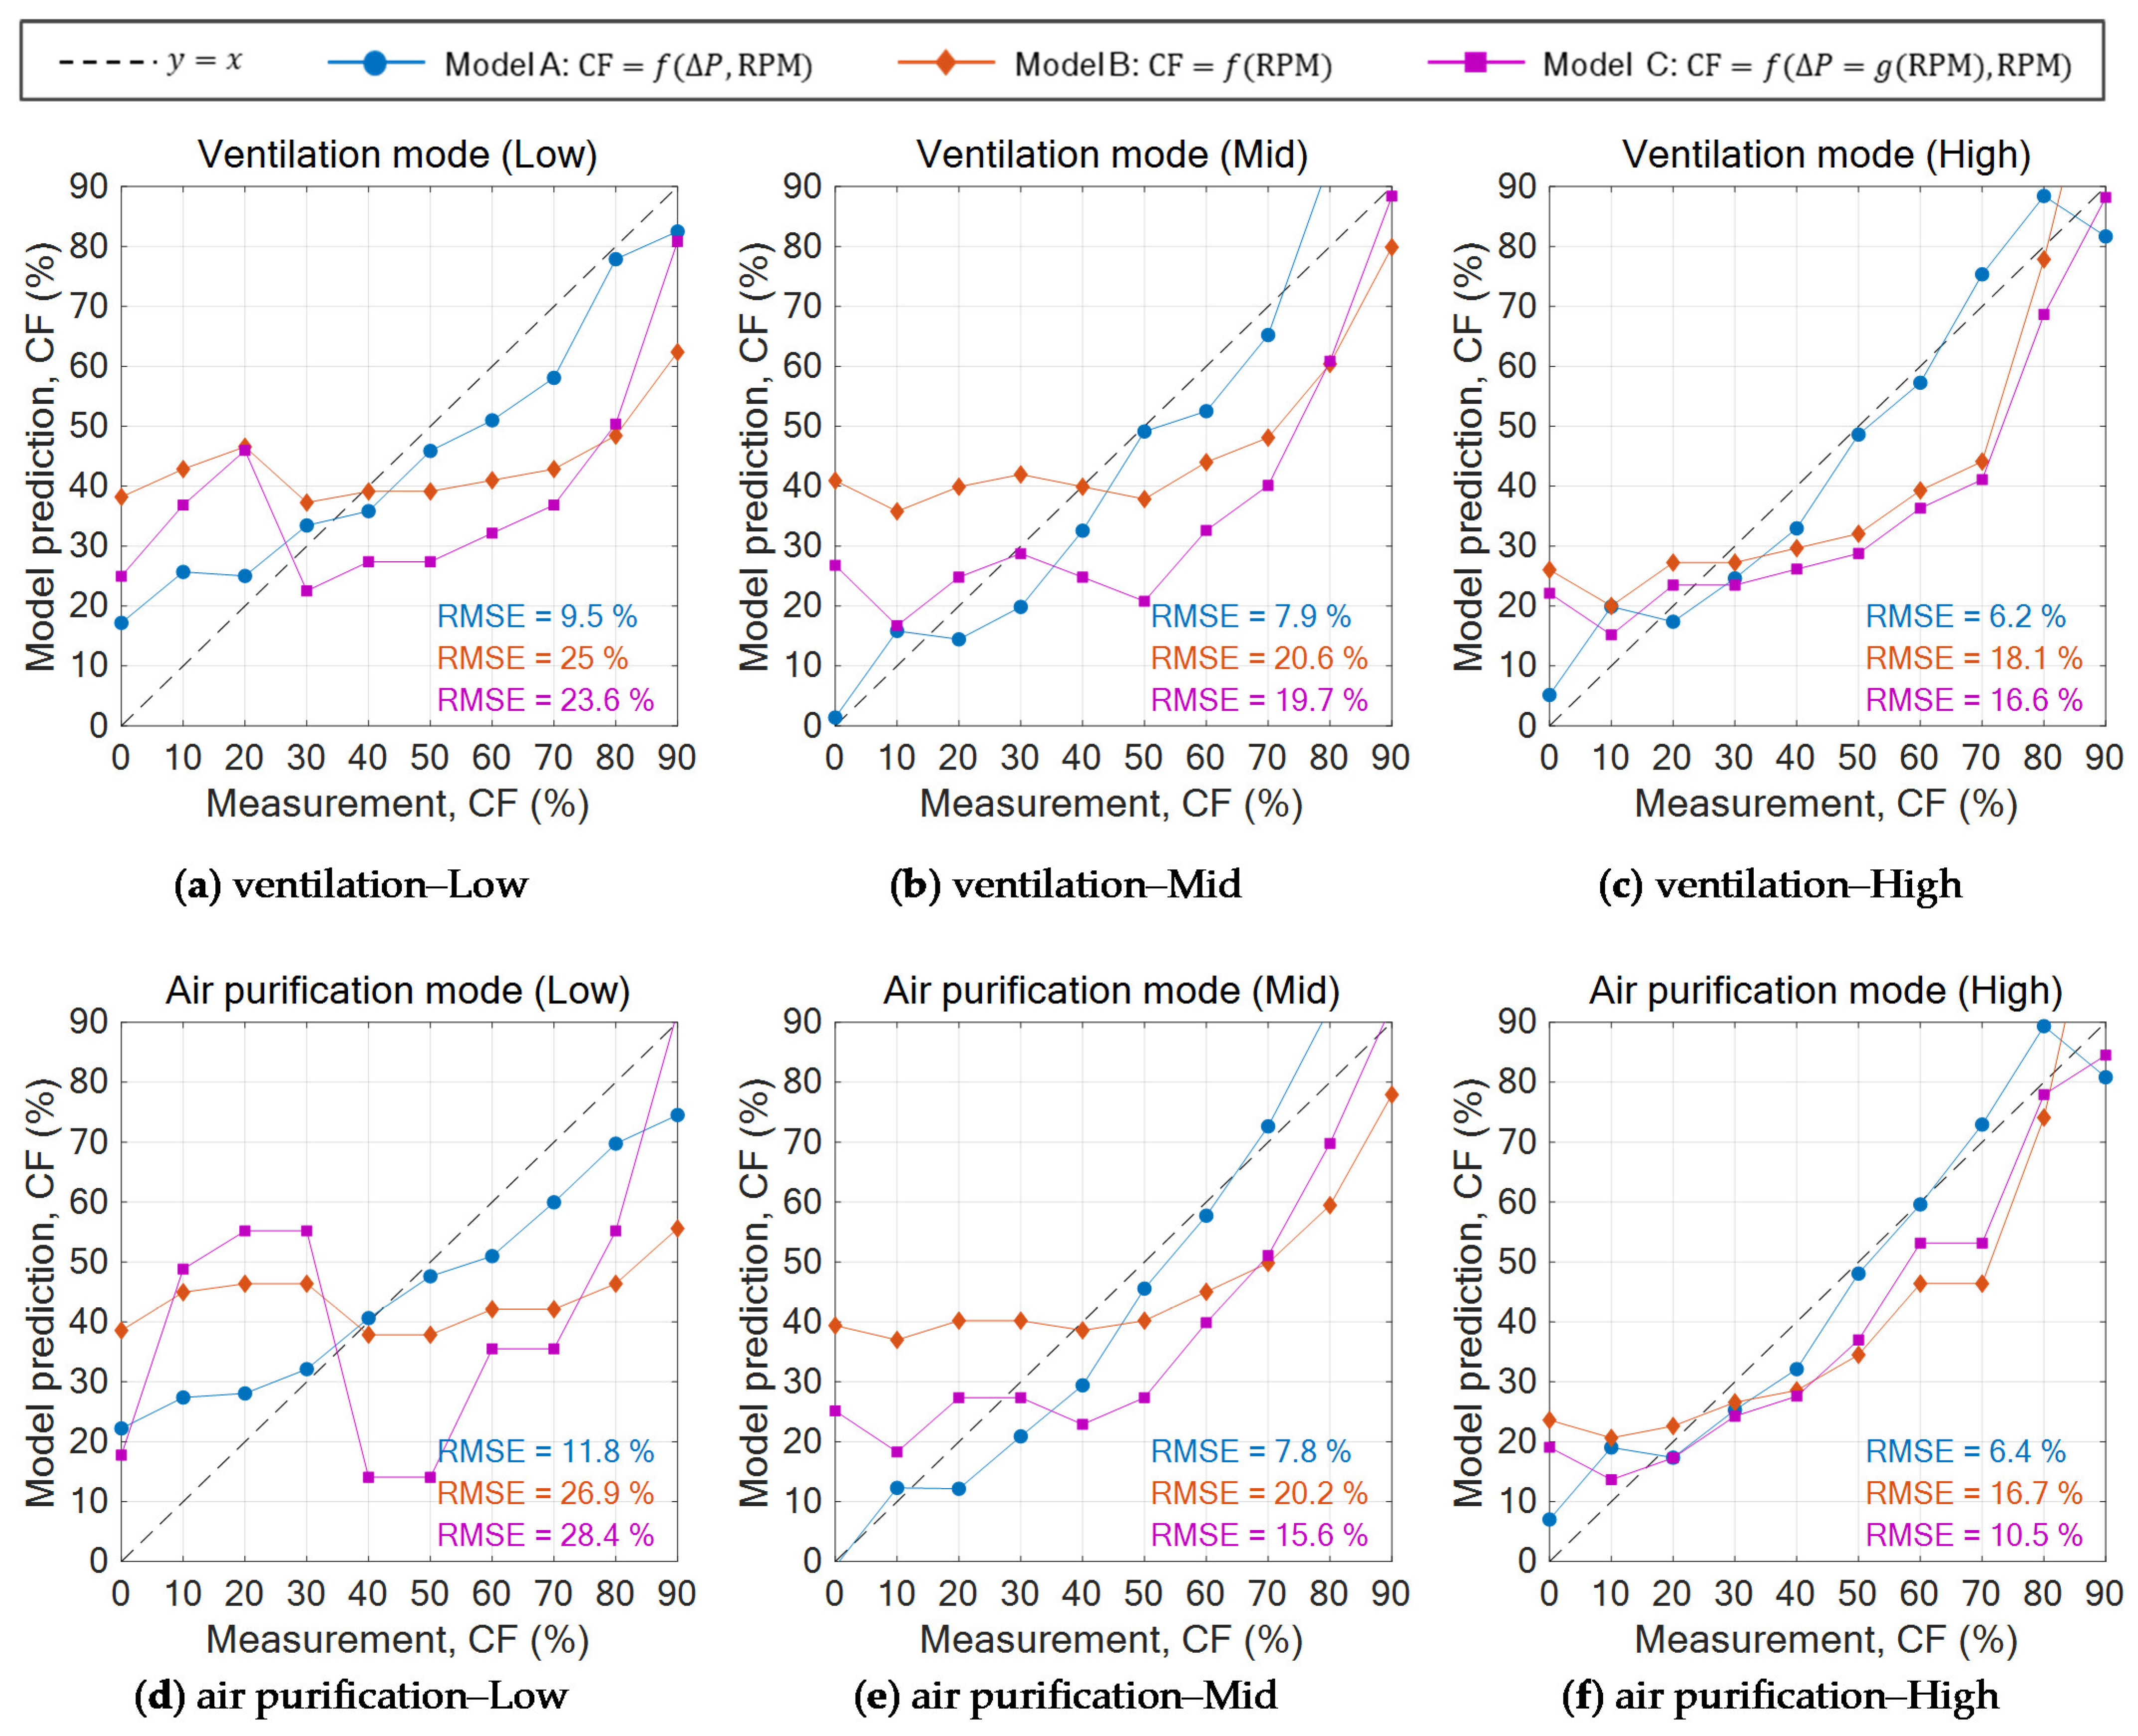
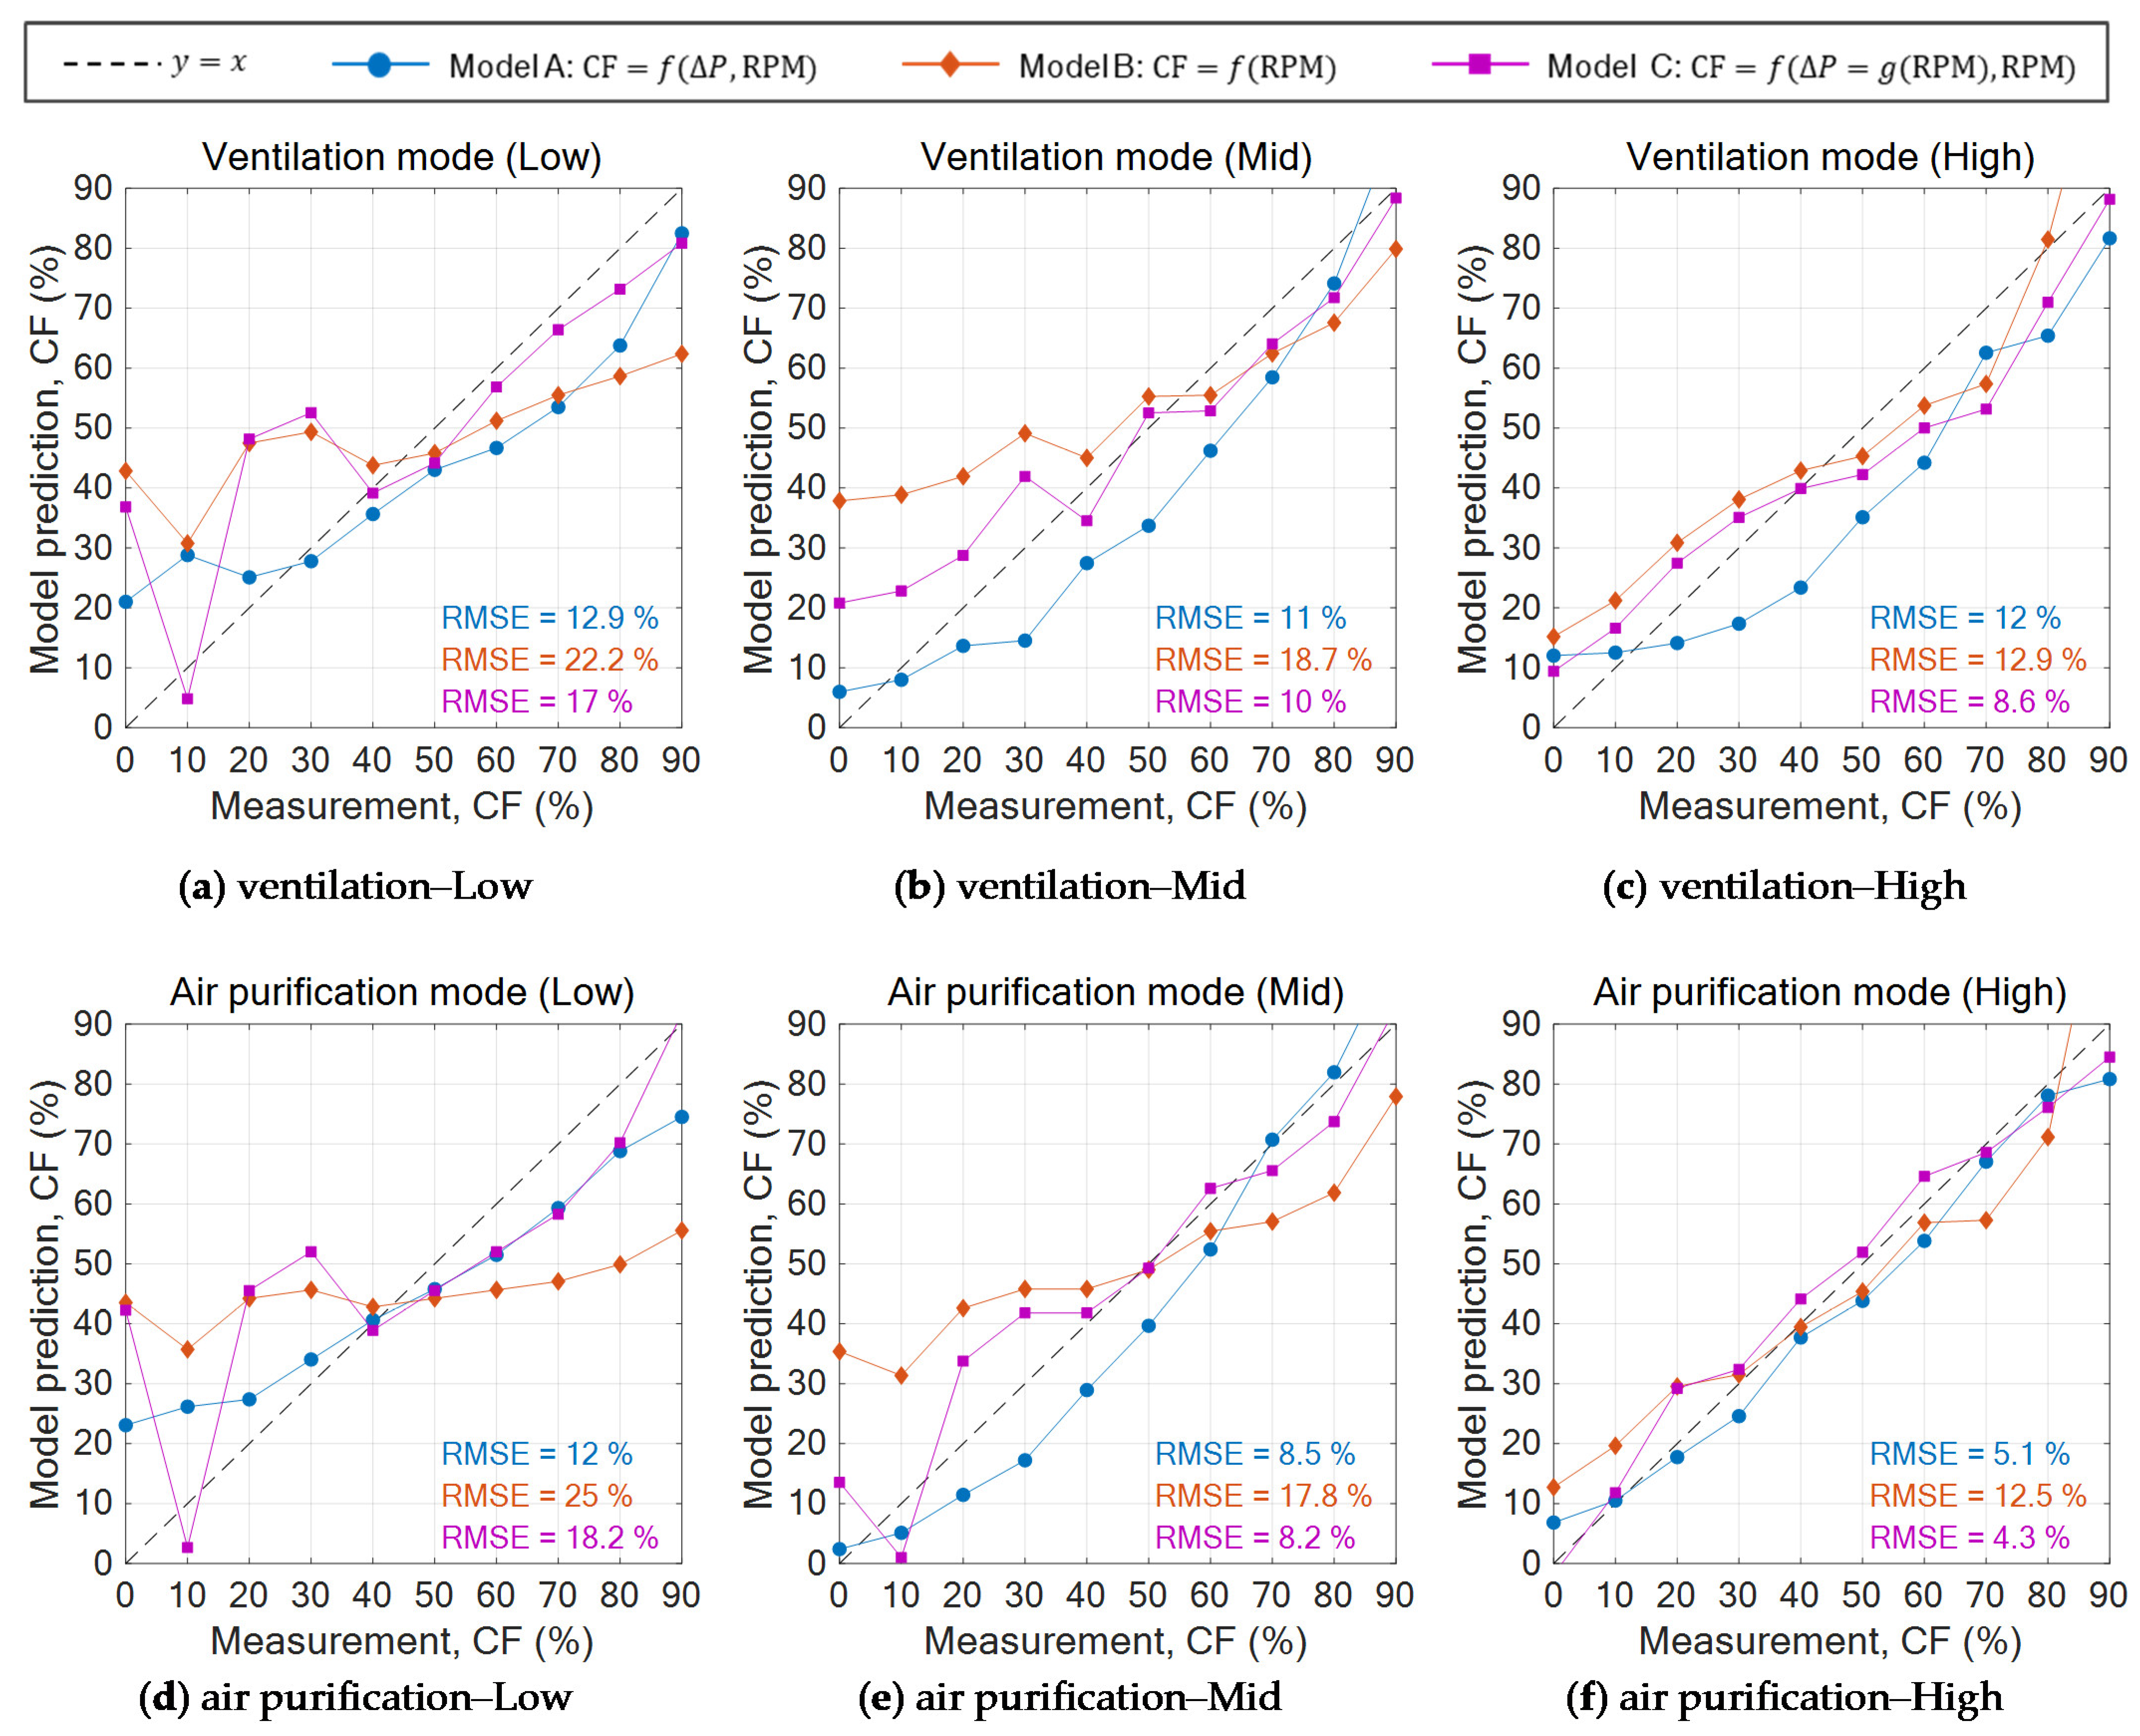
Figure 6 shows the fitting of the regression models for the data used in their construction. The x-axis in each graph shows the actually measured CF value, and the y-axis represents the estimated CF value derived using the regression model. RMSE stands for the root mean square error, which can be calculated using Equation (6). RMSE is the mean error between the CF values estimated by the model, and the actual CF values:
RMSE = 1 n i = 1 n ( CF Prediction . i CF Measurement . i ) 2 ,
where n is the number of datasets, CFPrediction.i represents the prediction values by the regression models, and CFMeasurement.i represents the measured CF values. A lower RMSE value indicates a higher prediction accuracy of the model.
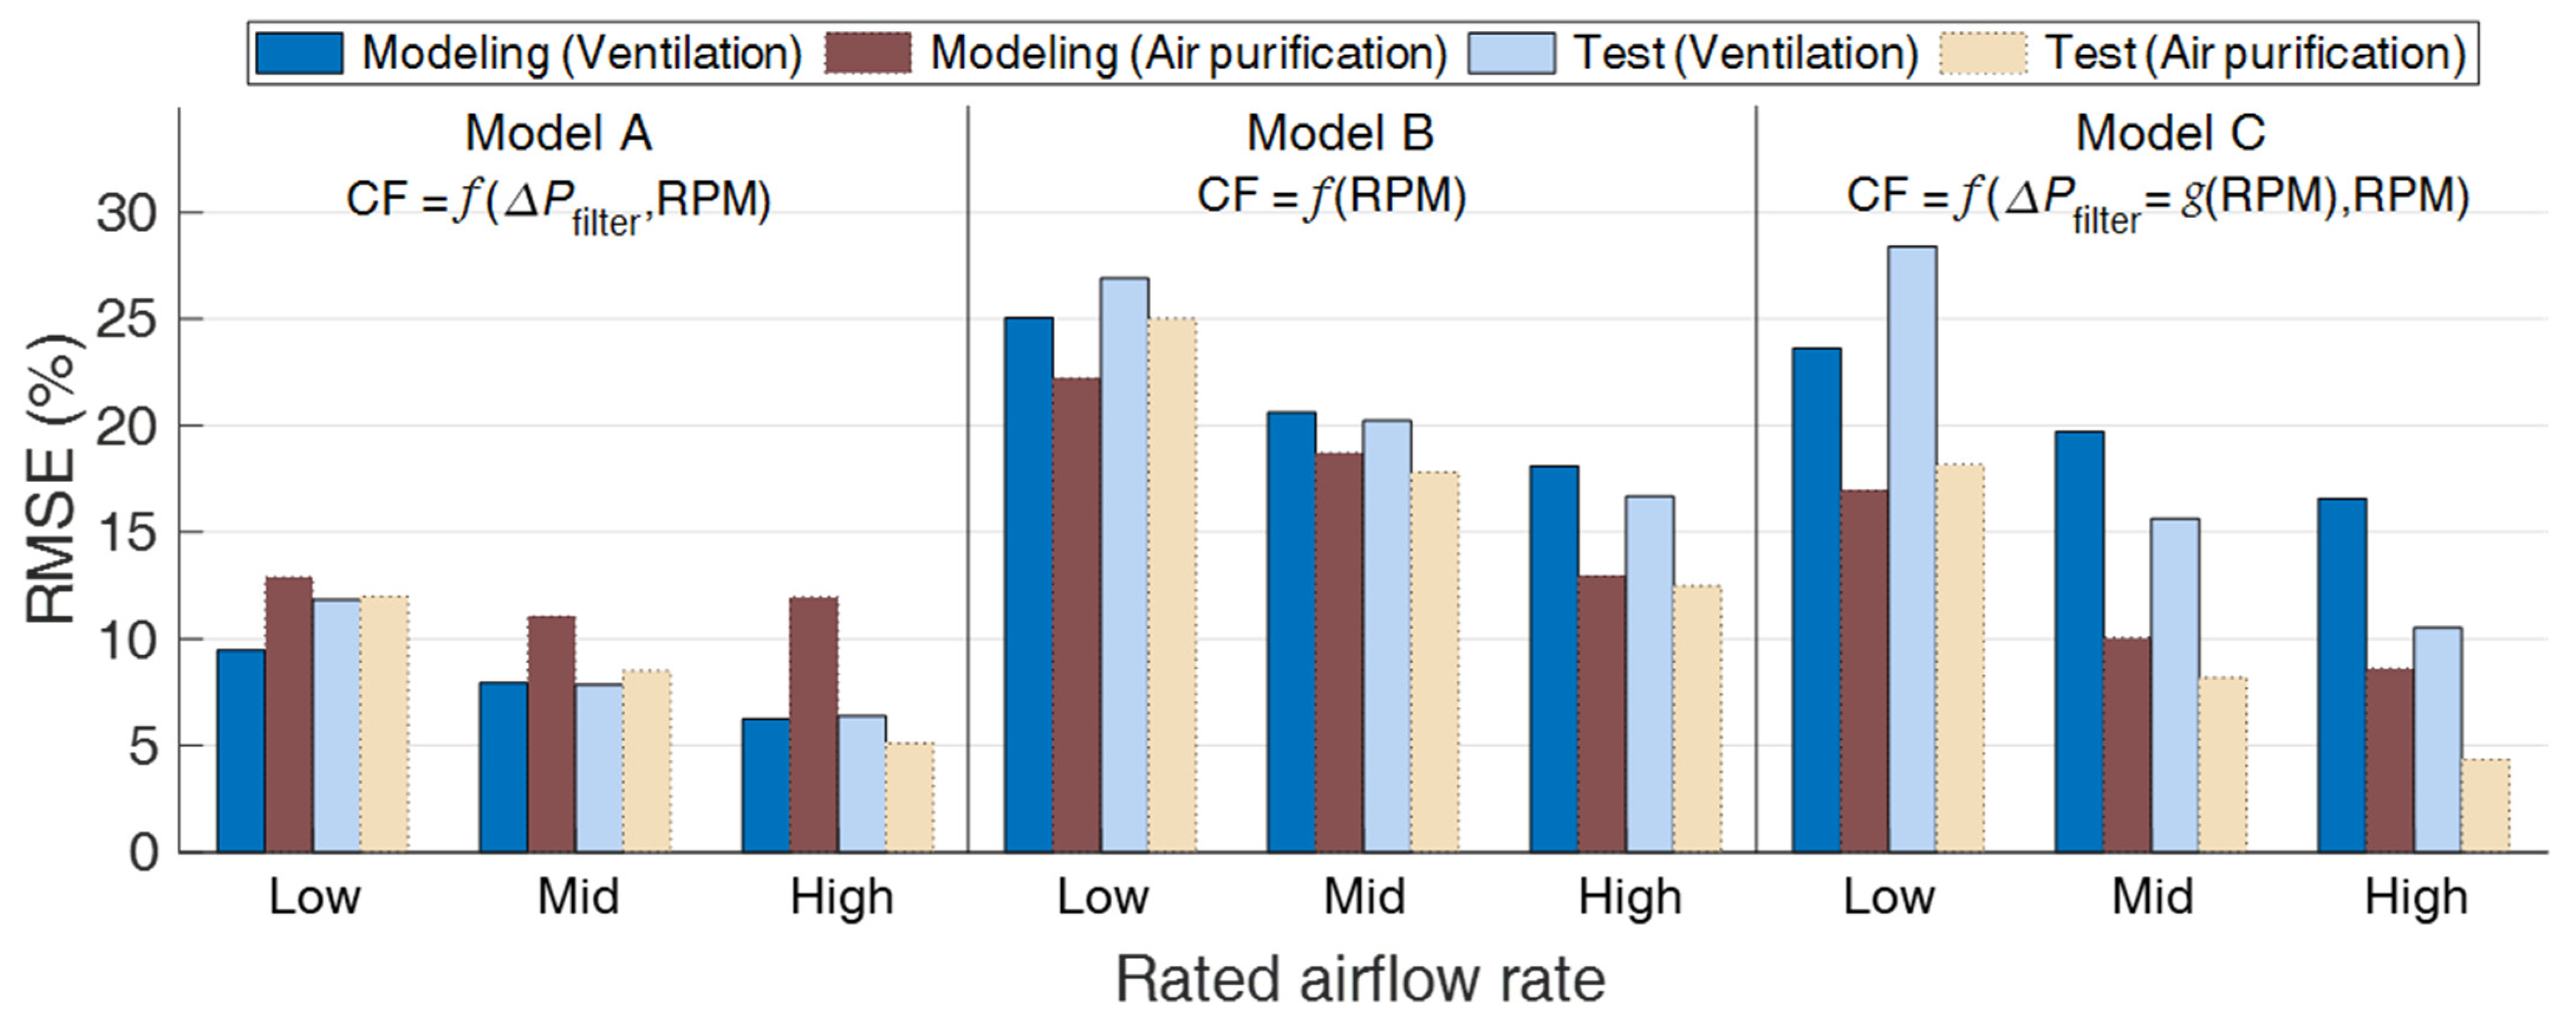
For all the models, i.e., A, B, and C, RMSE values were lower when the rated air flow rate was “high” than when it was “low”. Model A, which used ΔPfilter and RPM as input variables, exhibited lower RMSE values than models B and C. Model B, which used only RPM as an input variable, showed the highest RMSE value. Model C, which compensated for the absence of ΔPfilter with RPM, exhibited 0.9 to 1.5% lower RMSE values than model B.
Case A exhibited the highest prediction accuracy as it showed RMSE values close to 10%, even when the rated airflow rate was “low”. However, the model that was developed based on case A overestimated the predicted CF (%) when the measured CF was 0–30%, and it underestimated the predicted CF (%) as the measured CF became larger. These observations and the RMSE were reduced when the rated airflow rates were higher. Thus, the model must be implemented for an airflow rate with a high operation mode.
Figure 7 shows the predicted performances of the models listed in Table 4 and presented in Figure 6, using the remaining 50% of the measurement data that were not used during the construction of the regression models. As observed in Figure 6, the model-prediction accuracy was higher when the rated airflow rate was “high” than when it was “low”; model A generally exhibited higher prediction accuracy than models B and C.
As shown in Figure 6, the RMSE increased for model, A except in case (f); however, the RMSE decreased for both models B and C. In cases (b), (c), (e), and (f), the RMSE of model C was found to be lower than that of model A. In general, the prediction accuracy of a regression model increases with the number of input variables. The prediction accuracy for the verification data that were not used during the construction of the model was lower than that for the training data used during the construction of the model. However, the RMSE values of models B and C in the six cases, shown in Figure 7, were lower than in the six cases represented in Figure 6, and the RMSE of model C was lower than that of model A. This appears to be because the error was reduced by chance, considering that sufficient data were not used.
The RMSE values of models B and C, which used only RPM as a variable, were found to be lower in the air purification mode than in the ventilation mode. The RPM noises caused by the static-pressure difference between indoor and outdoor occurred in the ventilation mode because the flow path of the ERV system was connected to the outside through the OA duct. However, in the air purification mode, a stable RPM could be maintained, owing to the elimination of the RPM noises. That is because the flow path is independent of indoor and outdoor static-pressure differences in the air purification mode. Thus, the RMSE values of models B and C were lower in the air purification mode than in the ventilation mode. When dust-loading levels were estimated using only the RPM of the SA fan, a method to estimate the dust loading level of the air filter in the air purification mode was necessary to reduce the influence of static pressure fluctuations. Nevertheless, it is highly recommended that at least the ΔPfilter should be used as a variable to improve the accuracy of estimating the air filter dust loading, as seen from Figure 8.

4. Conclusions

Owing to the rising global interest in improved IAQ, the demand for ERVs equipped with HEPA filter (ERV air purifiers) has been increasing. Therefore, existing ERV air purifier manufacturers have recently developed ERV air purifiers that can be used as home appliances. However, it is crucial to implement appropriate management measures so that users can sufficiently recognize the need for regularly replacing their air filters, and the need to use their systems effectively.
In this paper, a method for estimating the HEPA filter dust-loading level for a home appliance type ERV air purifier was proposed, using data-driven models, and the prediction performances of the models were analyzed. The dust loading of the fabric HEPA filter was simulated using the CF (%) of the filter. The RPM of the SA fan and the ΔPfilter, based on the CF of the filter, were measured to realize regression models that used ΔPfilter and RPM as the input variables and CF as the output value. The dust loading of the fabric HEPA filter was simulated using the CF (%) of the filter. The following conclusions were drawn.
  • The presented models exhibited the highest prediction accuracy when the rated airflow rate was high, and the error produced by the model that used ΔPfilter and RPM as variables was lower than those produced by the models that used RPM alone as a variable. This indicated that the highest prediction accuracy could be expected for air filter dust-loading estimation when the rated airflow rate was high, and through the use of several input variables.
  • When RPM is used alone as a variable, without measuring the ΔPfilter, higher accuracy can be expected for air filter dust-loading estimation if performed in the air purification model, which can secure a stable RPM. However, when only RPM is used, it is difficult to expect higher prediction accuracy and stability than that obtained when both the ΔPfilter and RPM are used as variables.
  • If the dust loading levels are measured for a filter replacement alarm rather than through continuously showing the status of air filters, developing and applying a model for the “high” airflow rate in the air purification mode would be more effective.
For the accurate estimation of the status of an HEPA filter, it is necessary to collect more extensive and diverse datasets by constructing a sensor network. Nevertheless, the dust loading level of filters in embedded systems can be estimated using the ΔPfilter and RPM as variables, within simple regression models.
In this study, the dust loading of a HEPA filter was simulated using CF (%). However, whether the results of this study are comparable to the results obtained using an actually contaminated air filter should be examined. In the future, it will be necessary to secure experimental samples of air filters contaminated in an actual use environment over a considerable course of time and compare the corresponding results obtained with the results of this study. Furthermore, the prediction performance of the models must be verified in an actual use environment.

Author Contributions

Conceptualization, S.-H.P. and E.-J.K.; methodology, S.-H.P.; validation, S.-H.P. and E.-J.K.; formal analysis, S.-H.P.; resources, J.-H.J. and E.-J.K.; data curation, S.-H.P.; writing—original draft preparation, S.-H.P.; writing—review and editing, E.-J.K.; visualization, S.-H.P.; supervision, J.-H.J. and E.-J.K.; project administration, E.-J.K. All authors have read and agreed to the published version of the manuscript.

Funding

This research was supported by the Korea Institute of Energy Technology Evaluation and Planning (KETEP) grant, funded by the Korean government (MOTIE) (20192020101170, Development of Energy-Recovery Ventilators Equipped with Air Filters for Fine Dust Removal).

Institutional Review Board Statement

Not applicable.

Informed Consent Statement

Not applicable.

Data Availability Statement

The data used to support the findings of this study are available from the corresponding author upon request.

Acknowledgments

We would like to thank HIMPEL for their technical support.

Conflicts of Interest

The authors declare no conflict of interest.

Abbreviations

AHUAir handling unit
CFCovering factor
HVACHeating, ventilation, and air conditioning
RMSERoot mean square error
RPMRevolutions per minute
VSPMotor speed adjusting voltage

Nomenclatures

AcoverCovering area of HEPA filter
AfilterSurface area of HEPA filter
aiCorrelation coefficient
biCorrelation coefficient
ciCorrelation coefficient
fFunction
gFunction
nNumber of datasets
ΔPfilterPressure difference of HEPA filter

References

  1. Tham, K.W. Indoor air quality and its effects on humans—A review of challenges and developments in the last 30 years. Energy Build. 2016, 130, 637–650. [Google Scholar] [CrossRef]
  2. Zhang, Y.; Mo, J.; Li, Y.; Sundell, J.; Wargocki, P.; Zhang, J.; Little, J.C.; Corsi, R.; Deng, Q.; Leung, M.H.K.; et al. Can commonly-used fan-driven air cleaning technologies improve indoor air quality? A literature review. Atmos. Environ. 2011, 45, 4329–4343. [Google Scholar] [CrossRef]
  3. Boloorani, A.D.; Nabavi, S.O.; Bahrami, H.A.; Mirzapour, F.; Kavosi, M.; Abasi, E.; Azizi, R. Investigation of dust storms entering Western Iran using remotely sensed data and synoptic analysis. J. Environ. Health Sci. Eng. 2014, 12, 1–12. [Google Scholar] [CrossRef] [Green Version]
  4. Boloorani, A.D.; Nabavi, S.O.; Azizi, R.; Bahrami, H.A. Characterization of Dust Storm Sources in Western Iran Using a Synthetic Approach. In Advances in Meteorology, Climatology and Atmospheric Physics; Springer: Berlin/Heidelberg, Germany, 2013; pp. 415–420. [Google Scholar] [CrossRef]
  5. World Health Organization. Chapter 2. Air pollution. In Compendium of WHO and other UN Guidance on Health and Environment; WHO: Geneva, Switzerland, 2021. [Google Scholar]
  6. Al-Harbi, M.; Alhajri, I.; Whalen, J.K. Characteristics and health risk assessment of heavy metal contamination from dust collected on household HVAC air filters. Chemosphere 2021, 277, 130276. [Google Scholar] [CrossRef]
  7. Klepeis, N.E.; Nelson, W.C.; Ott, W.R.; Robinson, J.P.; Tsang, A.M.; Switzer, P.; Behar, J.V.; Hern, S.C.; Engelmann, W.H. The National Human Activity Pattern Survey (NHAPS): A resource for assessing exposure to environmental pollutants. J. Expo. Anal. Environ. Epidemiol. 2001, 11, 231–252. [Google Scholar] [CrossRef] [Green Version]
  8. Samet, J.M. Indoor air pollution: A public health perspective. Indoor Air 1993, 3, 219–226. [Google Scholar] [CrossRef]
  9. Berglund, B.; Brunekreef, B.; Knöppe, H.; Lindvall, T.; Maroni, M.; Mølhave, L.; Skov, P. Effects of indoor air pollution on human health. Indoor Air 1992, 2, 2–25. [Google Scholar] [CrossRef]
  10. Fisk, W.J. Review of some effects of climate change on indoor environmental quality and health and associated no-regrets mitigation measures. Build. Environ. 2015, 86, 70–80. [Google Scholar] [CrossRef] [Green Version]
  11. Abbafati, C.; Abbas, K.M.; Abbasi-Kangevari, M.; Abd-Allah, F.; Abdelalim, A.; Abdollahi, M.; Abdollahpour, I.; Abegaz, K.H.; Abolhassani, H.; Aboyans, V.; et al. Global burden of 87 risk factors in 204 countries and territories, 1990–2019: A systematic analysis for the Global Burden of Disease Study 2019. Lancet 2020, 396, 1223–1249. [Google Scholar] [CrossRef]
  12. Soleimani, Z.; Darvishi Boloorani, A.; Khalifeh, R.; Griffin, D.W.; Mesdaghinia, A. Short-term effects of ambient air pollution and cardiovascular events in Shiraz, Iran, 2009 to 2015. Environ. Sci. Pollut. Res. 2019, 26, 6359–6367. [Google Scholar] [CrossRef] [PubMed]
  13. Soleimani, Z.; Boloorani, A.D.; Khalifeh, R.; Teymouri, P.; Mesdaghinia, A.; Griffin, D.W. Air pollution and respiratory hospital admissions in Shiraz, Iran, 2009 to 2015. Atmos. Environ. 2019, 209, 233–239. [Google Scholar] [CrossRef]
  14. Kaufman, J.D.; Adar, S.D.; Barr, R.G.; Budoff, M.; Burke, G.L.; Curl, C.L.; Daviglus, M.L.; Roux, A.V.D.; Gassett, A.J.; Jacobs, D.R.; et al. Association between air pollution and coronary artery calcification within six metropolitan areas in the USA (the Multi-Ethnic Study of Atherosclerosis and Air Pollution): A longitudinal cohort study. Lancet 2016, 388, 696–704. [Google Scholar] [CrossRef] [Green Version]
  15. World Health Organization. Ambient Air Pollution: A Global Assessment of Exposure and Burden of Disease; WHO: Geneva, Switzerland, 2016. [Google Scholar] [CrossRef]
  16. World Health Organization. WHO Global Air Quality Guidelines: Particulate Matter (PM2.5 and PM10), Ozone, Nitrogen Dioxide, Sulfur Dioxide and Carbon Monoxide: Executive Summary; WHO: Geneva, Switzerland, 2021. [Google Scholar]
  17. Li, C.; Bai, L.; He, Z.; Liu, X.; Xu, X. The effect of air purifiers on the reduction in indoor PM2.5 concentrations and population health improvement. Sustain. Cities Soc. 2021, 75, 103298. [Google Scholar] [CrossRef]
  18. Swamy, G. Development of an indoor air purification system to improve ventilation and air quality. SSRN Electron. J. 2021, 7, e08153. [Google Scholar] [CrossRef] [PubMed]
  19. Xu, Y.; Raja, S.; Ferro, A.R.; Jaques, P.A.; Hopke, P.K.; Gressani, C.; Wetzel, L.E. Effectiveness of heating, ventilation and air conditioning system with HEPA filter unit on indoor air quality and asthmatic children’s health. Build. Environ. 2010, 45, 330–337. [Google Scholar] [CrossRef]
  20. American Society of Heating, Refrigerating and Air-Conditioning Engineers (ASHRAE). Standard 52.2; Method of Testing General Ventilation Air-Cleaning Devices for Removal Efficiency by Particle Size; ASHRAE Inc.: Atlanta, GA, USA, 2017. [Google Scholar]
  21. Choi, J.S.; Lee, J.H.; Kim, E.J. Effects of ERV filter degradation on indoor CO2 levels of a classroom. Sustainability 2018, 10, 1215. [Google Scholar] [CrossRef] [Green Version]
  22. Korean Standard. KS B 6879; Heat Recovery Ventilator; Korean Standard: Seoul, Korea, 2021.
  23. Kumar, P.; Skouloudis, A.N.; Bell, M.; Viana, M.; Carotta, M.C.; Biskos, G.; Morawska, L. Real-time sensors for indoor air monitoring and challenges ahead in deploying them to urban buildings. Sci. Total Environ. 2016, 560–561, 150–159. [Google Scholar] [CrossRef] [Green Version]
  24. Choe, Y.; Shin, J.; Park, J.; Kim, E.; Oh, N.; Min, K.; Kim, D.; Sung, K.; Cho, M.; Yang, W. Inadequacy of air purifier for indoor air quality improvement in classrooms without external ventilation. Build. Environ. 2022, 207, 108450. [Google Scholar] [CrossRef]
  25. Elsaid, A.M.; Mohamed, H.A.; Abdelaziz, G.B.; Ahmed, M.S. A critical review of heating, ventilation, and air conditioning (HVAC) systems within the context of a global SARS-CoV-2 epidemic. Process Saf. Environ. Prot. 2021, 155, 230–261. [Google Scholar] [CrossRef]
  26. Cooper, E.; Wang, Y.; Stamp, S.; Burman, E.; Mumovic, D. Use of portable air purifiers in homes: Operating behaviour, effect on indoor PM2.5 and perceived indoor air quality. Build. Environ. 2021, 191, 107621. [Google Scholar] [CrossRef]
  27. Lee, M.H.; Yang, W.; Chae, N.; Choi, S. Performance assessment of HEPA filter against radioactive aerosols from metal cutting during nuclear decommissioning. Nucl. Eng. Technol. 2020, 52, 1043–1050. [Google Scholar] [CrossRef]
  28. Lowther, S.D.; Deng, W.; Fang, Z.; Booker, D.; Whyatt, D.J.; Wild, O.; Wang, X.; Jones, K.C. How efficiently can HEPA purifiers remove priority fine and ultrafine particles from indoor air? Environ. Int. 2020, 144, 106001. [Google Scholar] [CrossRef] [PubMed]
  29. Oh, H.J.; Nam, I.S.; Yun, H.; Kim, J.; Yang, J.; Sohn, J.R. Characterization of indoor air quality and efficiency of air purifier in childcare centers, Korea. Build. Environ. 2014, 82, 203–214. [Google Scholar] [CrossRef]
  30. Du, L.; Batterman, S.; Parker, E.; Godwin, C.; Chin, J.Y.; O’Toole, A.; Robins, T.; Brakefield-Caldwell, W.; Lewis, T. Particle concentrations and effectiveness of free-standing air filters in bedrooms of children with asthma in Detroit, Michigan. Build. Environ. 2011, 46, 2303–2313. [Google Scholar] [CrossRef] [Green Version]
  31. Araujo, R.; Cabral, J.P.; Rodrigues, A.G. Air filtration systems and restrictive access conditions improve indoor air quality in clinical units: Penicillium as a general indicator of hospital indoor fungal levels. Am. J. Infect. Control 2008, 36, 129–134. [Google Scholar] [CrossRef] [PubMed]
  32. Johnson, R.A.; Wichern, D.W. Applied Multivariate Statistical Analysis, 6th ed.; Prentice Hall: Upper Saddle River, NJ, USA, 1988. [Google Scholar]
  33. Howell, D.C. Statistical Methods for Psychology; Cengage Learning: Boston, MA, USA, 2012. [Google Scholar]
Figure 1. Two different operation modes of the target ERV air purifier. (a) Ventilation mode, (b) Air purification mode.
Sustainability 13 13643 g001
Figure 2. Schematic of changes in SA fan operation characteristics according to the filter conditions (A→B).
Sustainability 13 13643 g002
Figure 3. Modeling process using experimental data of the ERV filter dust-loading levels.
Sustainability 13 13643 g003
Figure 4. Changes in ΔPfilter with increasing CF ((a,b): ventilation mode; (c,d): air purification mode).
Sustainability 13 13643 g004
Figure 5. Changes in RPM with increasing CF ((a,b): ventilation mode and (c,d): air purification mode).
Sustainability 13 13643 g005
Figure 6. Results of the filter dust loading levels estimated by the proposed models for operation modes and rated flow rates; (ac) represent the ventilation modes and (df) represent the air purification modes. (a,d) are “Low”, (b,e) are “Mid”, and (c,f) are “High”.
Sustainability 13 13643 g006
Figure 7. Test and verification results of the models for operation modes and rated flow rates. (ac) represent ventilation modes and (df) represent air purification modes; (a,d) are ‘Low’, (b,e) are ‘Mid’, and (c,f) are ‘High’.
Sustainability 13 13643 g007
Figure 8. Modeled and test RMSE comparisons of each regression model.
Sustainability 13 13643 g008
Table 1. Available literature on the IAQ monitoring capabilities of IAQ devices equipped with HEPA filters.
YearAuthorsTarget Systems
ERVAir PurifierOthers
2022Choe et al. [24] O
2021UNDI, G.S.N.V.K.S.N.S. [18] AHU
2021Elsaid et al. [25]O Air supply system
2021Cooper et al. [26] O
2021Li et al. [17] O
2021Al-Harbi [6] HVAC system
2020Lee et al. [27] Nuclear plant
2020Lowther et al. [28] O
2014Oh et al. [29] O
2011Du et al. [30] Air conditioner
2009Xu et al. [19]OO
2008Araujo et al. [31] O
Table 2. Variables used for developing air filter dust loading models.
VariablesDetectionDescription
RPM (SA fan)MainboardContinuous variable
VSP (SA fan)MainboardCategorical variable
ΔPfilterMeasurement deviceContinuous variable
Table 3. Three formalisms for developing filter dust loading prediction models.
ModelsFormalisms
ACF = fPfilter, RPM)
BCF = f(RPM)
CCF = fPfilter = g(RPM), RPM)
Table 4. Correlation of the dust loading prediction models for the three cases, A, B, and C.
CasesModelsEquations
ACF = fPfilter, RPM)CF = a0 + a1VSP + a2ΔPfilter + a3RPM + a4Pfilter)2 + a5RPM2 + a6Pfilter∙RPM)(2)
BCF = f(RPM)CF = b0 + b1VSP + b2RPM + b3(VSP∙RPM)(3)
CCF = fPfilter = g(RPM), RPM)CF = a0 + a1VSP + a2ΔPfilter + a3RPM + a4Pfilter)2 + a5RPM2 + a6Pfilter∙RPM)(4)
ΔPfilter = g(RPM)ΔPfilter = c0 + c1VSP + c2RPM + c3VSP2 + c4(VSP∙RPM) + c5RPM2(5)
Table 5. Coefficients of the equations in Table 4 for the ventilation and air purification modes.
iaibici
VentilationAir PurificationVentilationAir PurificationVentilationAir Purification
07.7592 × 10−12.78346.96246.24433.877 × 1022.111 × 102
13.3098 × 10⁻²−1.7218 × 10⁻²−1.8137 × 10⁻¹−1.5289 × 10−11.101 × 103.863 × 10
24.6533 × 10−23.9422 × 10−21.3951 × 10−36.6956 × 10−4−9.116 × 10⁻¹−2.109
3−4.3098 × 10⁻³−4.7847 × 10−34.2284 × 10−54.1662 × 10⁻⁵−5.918 × 10⁻¹−1.276
41.8318 × 10−58.9173 × 10−6--4.024 × 10−29.214 × 10−2
51.2284 × 10−62.3912 × 10−6--−4.417 × 10⁻⁴−1.333 × 10⁻³
6−2.4598 × 10⁵−2.2817 × 10⁻⁵----
Table 6. VSP values according to the rated airflow rates in Table 4 for the ventilation and air purification modes.
Rated Airflow RateVentilation ModeAir Purification Mode
Low5552
Mid6461
High8179
Publisher’s Note: MDPI stays neutral with regard to jurisdictional claims in published maps and institutional affiliations.

