Article

Multi-Temporal Evaluation of Quantitative and Phenological Vegetation Dynamics Using Sentinel-2 Images in North Horr (Kenya)

1
Interuniversity Department of Regional and Urban Studies and Planning (DIST), Politecnico di Torino & Università di Torino, 10125 Torino, Italy
2
Department of Environmental, Land and Infrastructure Engineering (DIATI), Politecnico di Torino, 10125 Torino, Italy
*
Author to whom correspondence should be addressed.
Both authors contributed equally to this work.
Sustainability 2021, 13(24), 13554; https://doi.org/10.3390/su132413554
Submission received: 14 September 2021 / Revised: 28 November 2021 / Accepted: 2 December 2021 / Published: 8 December 2021

Abstract

:
According to the Intergovernmental Panel on Climate Change, the Horn of Africa is getting drier. This research aims at assessing browning and/or greening dynamics and the suitability of Sentinel-2 satellite images to map changes in land cover in a semiarid area. Vegetation dynamics are assessed through a remote sensing approach based on densely vegetated areas in a pilot area of North Horr Sub-County, in northern Kenya, between 2016–2020. Four spectral vegetation indices are calculated from Sentinel-2 images to create annual multi-temporal images. Two different supervised classification methods—Minimum Distance and Spectral Angle Mapper—are then applied in order to identify dense vegetated areas. A general greening is found to have occurred in this period with the exception of the year 2020, with an average annual percentage increase of 19%. Results also highlight a latency between climatic conditions and vegetation growth. This approach is for the first time applied in North Horr Sub-County and supports local decision-making processes for sustainable land management strategies.

1. Introduction

Continuous desertification processes in the Great Horn of Africa create serious concern for the future suitability for human livelihood in the area. Land degradation in Arid and Semi-Arid Lands (ASALs) entails “the reduction and loss of the biological and economic productive capacity of land” [1]. Climatic and direct or indirect human-induced processes, including climate change, are responsible for these negative trends [ibid.]. Erosion, wildfire, saline soils, increasing temperature, low water availability and invasive plants are examples of land degradation drivers [2,3]. Further contributions to desertification are institutional, policy and socio-economic drivers, such as insecure land tenure and lack of property rights [4,5,6].
In Kenyan ASALs, land degradation is menacing the livelihood of these areas. Low rainfall only supports the widespread shrub vegetation and seasonal grassland, since the climate is too extreme to support large woody plants [7]. These drylands areas are traditionally devoted to extensive grazing for livestock, though the variability of dry seasons represents a constraint [7] and for which it is necessary to provide a grazing plan [8]. However, uncontrolled grazing, cutting of trees for fuel practices as well as climate change are exacerbating environmental degradation, reducing livestock productivity [9,10], threatening the disappearance of some native species how it is occurring in other countries [11,12,13] and thus causing poverty [2,4]. The pressure on natural resources is threatening the sustenance of livestock, which is pivotal to support the growing population of nomadic pastoralists. In the 1980s, projects encouraging agroforestry practices promoted the planting of shrubs and trees to increase the vegetation cover in eastern ASALs [14,15,16]. Non-indigenous vegetation species were introduced for the first time in Kenya [7,17,18] with different ecological and economic functions [19] resulting in divergent effects. Nowadays, to halt and reverse the current trend of land desertification and degradation, there is an urgent need to enhance mapping of degraded lands, as required by the Sustainable Development Goals [20].
Among different methods for studying and monitoring land degradation, remote sensing approach provides a cost-effective and time efficient evaluation [21,22]. Moreover, it is generally used to determine the land cover over extensive areas and retrieve time series of optical remote sensing data. Different available techniques and indices are reviewed by [21,23].
In Africa, over 70% of all phenological studies are satellite-based remote sensing phenological estimates [23]. In fact, these approaches are effective in retrieving detailed spatial patterns of vegetation phenology for semi-arid rangelands with short vegetation cycles [24,25,26], and in detecting invasive plants [27,28,29]. Moreover, the use of vegetation indices, which have become increasingly important, enhances the potential of the remote sensing approach in this field [29,30].
Observed trends of land cover changes and land degradation in Kenya have conflicting findings. An assessment of land degradation, based on the use of Normalized Difference Vegetation Index (NDVI) derived from Advanced Very High Resolution Radiometer data and the use of high-quality satellite data from Moderate Resolution Imaging Spectroradiometer (MODIS), evaluated the net change within each cover class. Results show that the net gainers were grasslands (32%) and woodlands (3%), while the net losers were bare land (32%), shrubland (24%) and forests (23%) [21]. Studies on the distribution of land degradation show that the Eastern parts and North Eastern parts of the country [9,31] are the most hit. Using the MODIS sensors, declining NDVI and browning trends were also found in Marsabit County [31,32]. By contrast, although a general browning trend (21.6%) is occurring in the country, Gichenje and Godinho [33] proved that 8.9% of Kenya, in particular the Turkana district, experienced a greening between 1992 and 2015.
In light of the non-consistent existing literature, from which emerges conflicting findings, the assessment of desertification processes and greening dynamics at a local level is necessary. This work presents the results of the monitoring of the spatial and temporal distribution of the most densely vegetated areas near North Horr city. Due to the remoteness of the area, a satellite-based remote sensing approach was employed. Freely available Sentinel-2 images for the period 2016–2020 were used for the computation of common spectral vegetation indices. A supervised classification was applied, based on the local annual vegetation phenology. The aims of the monitoring were the identification of the ongoing greening or browning dynamics in the area through the use of satellite derived spectral indices and the assessment of the potentiality of Sentinel-2 to monitor land cover in ASALs. The outcomes will be used as a guideline for the sustainable logistic planning of monitoring activities in the area, resulting in targeted field surveys.
This study was conducted in the framework of an international cooperation project that aims to improve the human, animal and environmental health (https://www.who.int/news-room/q-a-detail/one-health (accessed on 11 November 2021)) in North Horr Sub-County.
The Section 2 describes in detail the methodology adopted, while Section 3 presents the main results of the analysis. In Section 4, the results of the classification process are discussed in relation to the climatic information elaborated for the area. Finally, the main outcomes of this research together with suggestions for further investigation are summarized in the Conclusion (Section 5).

2. Material and Methods
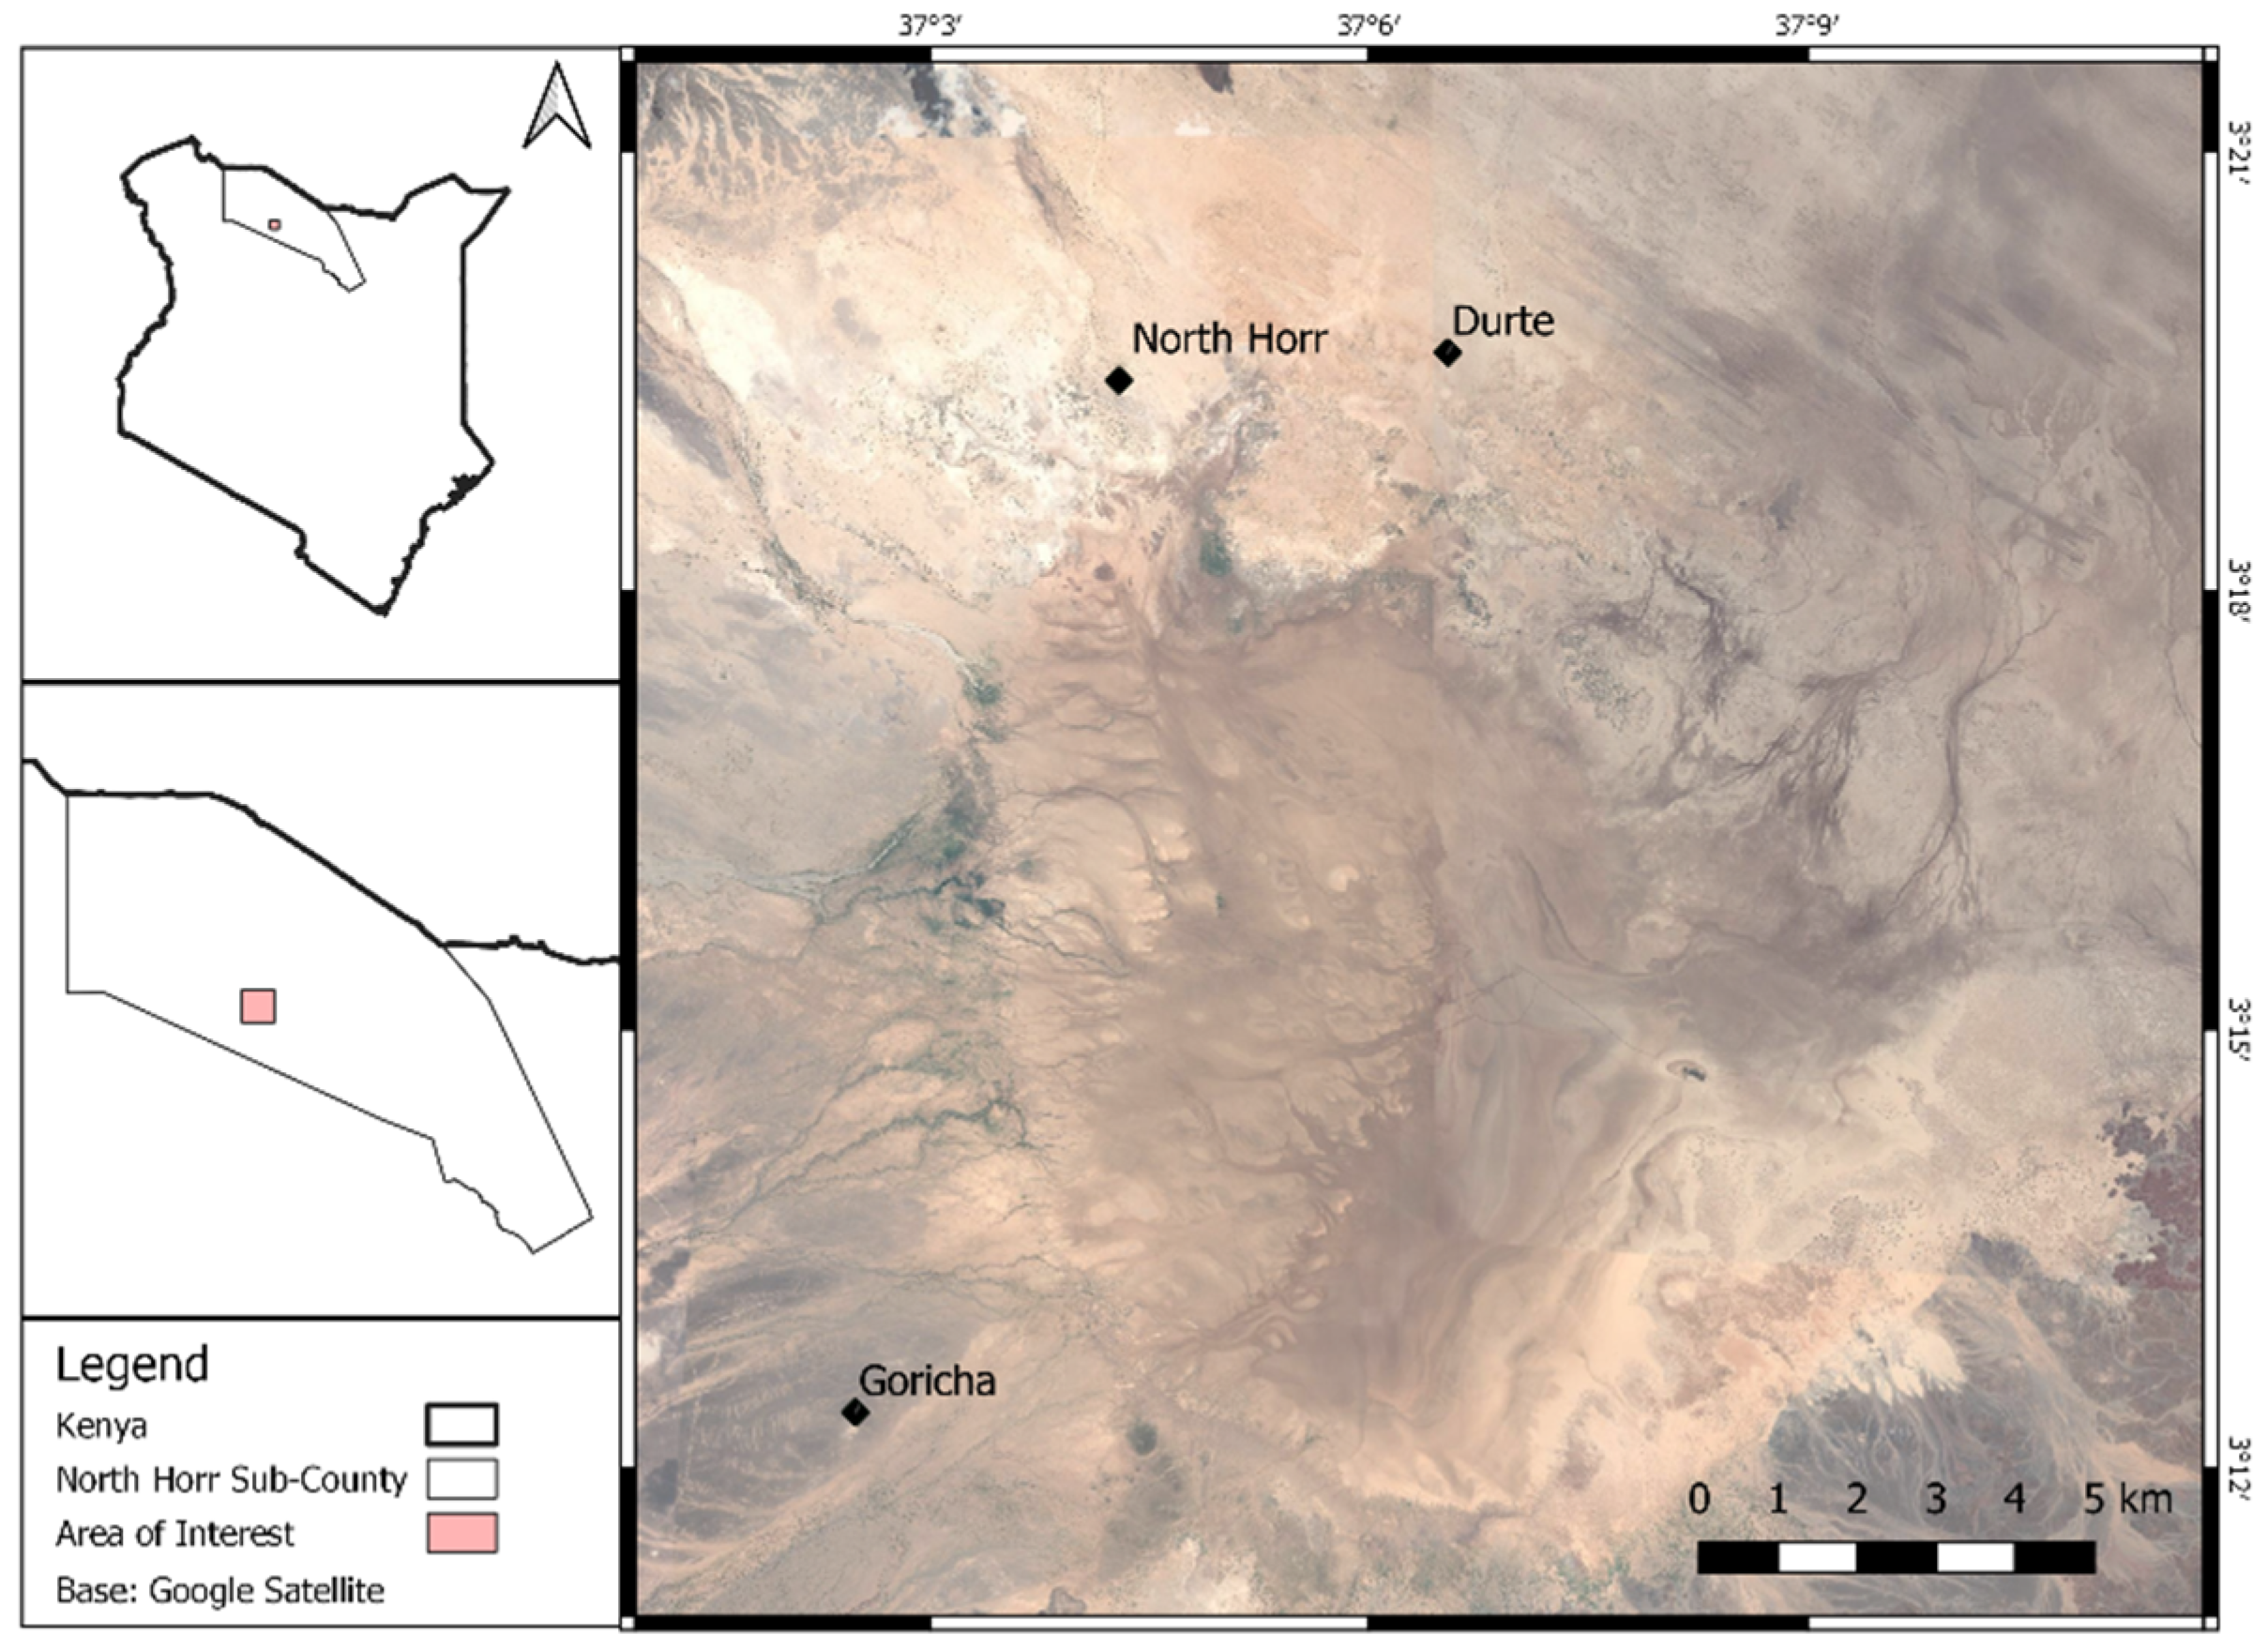
2.1. Area of Study

The area of interest (AOI) (Figure 1) covers 380 km2 and is situated in North Horr Sub-County (Marsabit County) in northern Kenya. North Horr is the chief town of the Sub-County. The other main settlements in the area are Durte and Goricha, however other dwellings are found scattered in the area. The AOI belongs to the ASALs and is situated at the edge of the Chalbi desert, a low land with highly saline soils that receive seasonal water flows from the surrounding highlands, resulting in large flooded areas [34,35]. The characteristic vegetation of this area is annual grasses with shrubs and scattered large woody plants (e.g., Acacia sp.) mainly found in depressions in the landscape or on soils of impeded drainage [16]. The vegetation is sustained by seasonal precipitation that occur in the long rains season (conventionally from March to May) and the short rain season (conventionally from October to December), which differ for the total amount of precipitation received on average [36,37,38]. Nevertheless, precipitations are subjected to erratic patterns in terms of high variability in length and deviation from the traditional seasons. This is also due to the influence of two climatic phenomena ENSO (El Niño-Southern Oscillation) and IOD (Indian Ocean Dipole) [39,40]. Years of negative ENSO and IOD are associated to drier-than-normal conditions, while years of positive ENSO and IOD are associated to wetter-than normal conditions [41,42,43].

2.2. Input Data

2.2.1. Satellite Data

Sentinel-2 optical images, retrieved through the Copernicus Open Access Hub, were used for the analysis. Since these images provide the highest spatial resolution (<20 m) among freely available optical images, they are the best suited for an analysis at a local scale and assure its replicability in other low-resources contexts. Sentinel-2 mission comprises two polar-orbiting satellites in the same orbit, phased at 180° to each other, which allow the acquisition frequency of 5 days at the Equator. The MSI optical multispectral sensor onboard Sentinel-2 satellite acquires images made of 13 spectral bands [44]. The Level 2A raster product, providing Bottom-Of-Atmosphere reflectance, was used for this analysis.
Four images were chosen for each year, going from 2016, which is the first year of acquisition, to 2020. Following the distribution of the precipitation through the year, one cloud-free image per season was selected for each year in order to obtain a representative dataset of the different local humidity conditions and vegetative stages. The selection was not only based on the conventional calendar of the seasons, but also on the actual rainfall and drought period of each year. This was possible by means of the observation of the vegetation vigorousness and of the level of flooding of the Chalbi desert, through the visual interpretation of satellite images. The need for cloud free images for the analysis, which are not frequent during rain seasons, made impossible to find more than one representative images for those seasons for each year. Moreover, a choice of consistency between the different years’ datasets led to the decision of basing the analysis on the same number of images for each year. The complete dataset is described by Table 1.
For each image, three spectral bands that are commonly used for vegetation indices analysis [45,46] were selected:
  • The band number 4 (b4), centered on 665 nm of wavelength and corresponding to the visible red, with a spatial resolution of 10 m;
  • The band number 5 (b5), centered on 705 nm of wavelength and corresponding to the Vegetation Red Edge, with a spatial resolution of 20 m;
  • The band number 8 (b8), centered on 842 nm of wavelength and corresponding to the Near Infrared, with a spatial resolution of 10 m.

2.2.2. Ground Truths

The ground truths information is based on a fieldwork survey carried out during august 2019. It is constituted by seven polygons covering in total 0.365 km2 of the most vegetated areas based on GPS points. The result of the survey was validated through the comparison with the 0.5 m resolution Worldview-2 image acquired on the 17th December 2019, accessed through ArcMap base map imagery function. This validation was intended to assure that the field constraints, caused by the difficulty to penetrate the high dense vegetation, hadn’t affected the quality of the data collected.

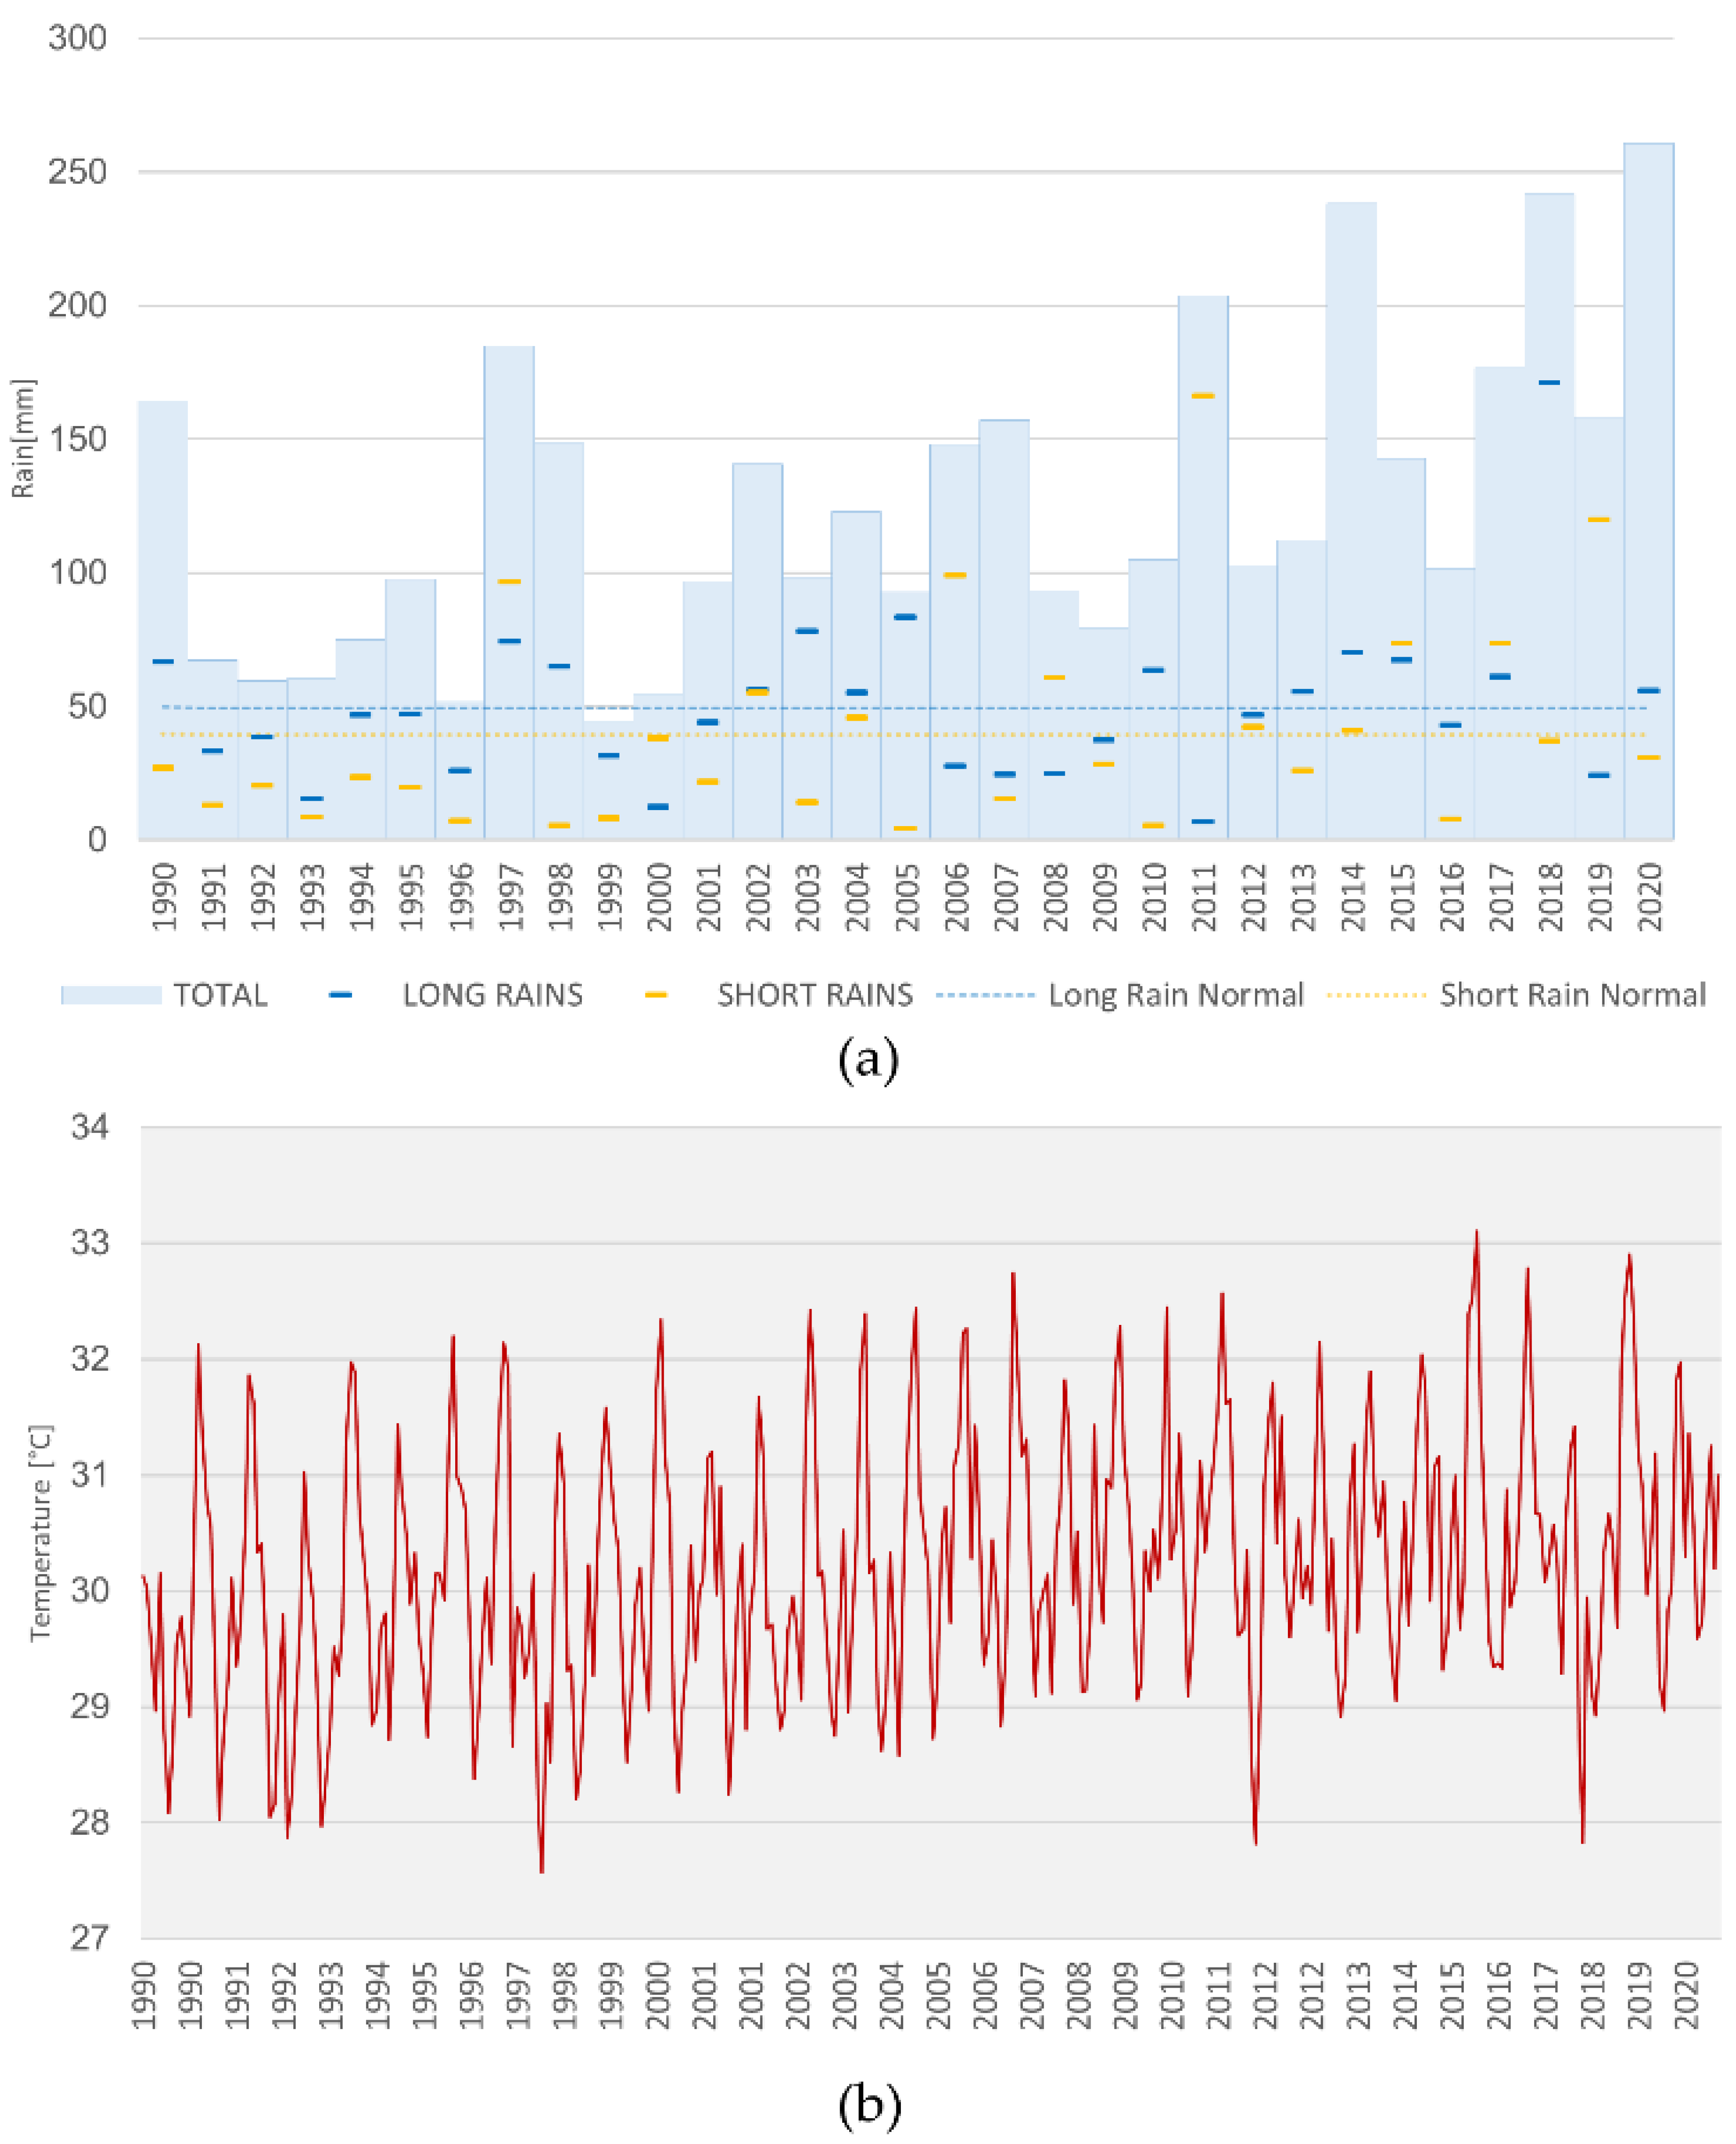
2.2.3. Meteorological Data
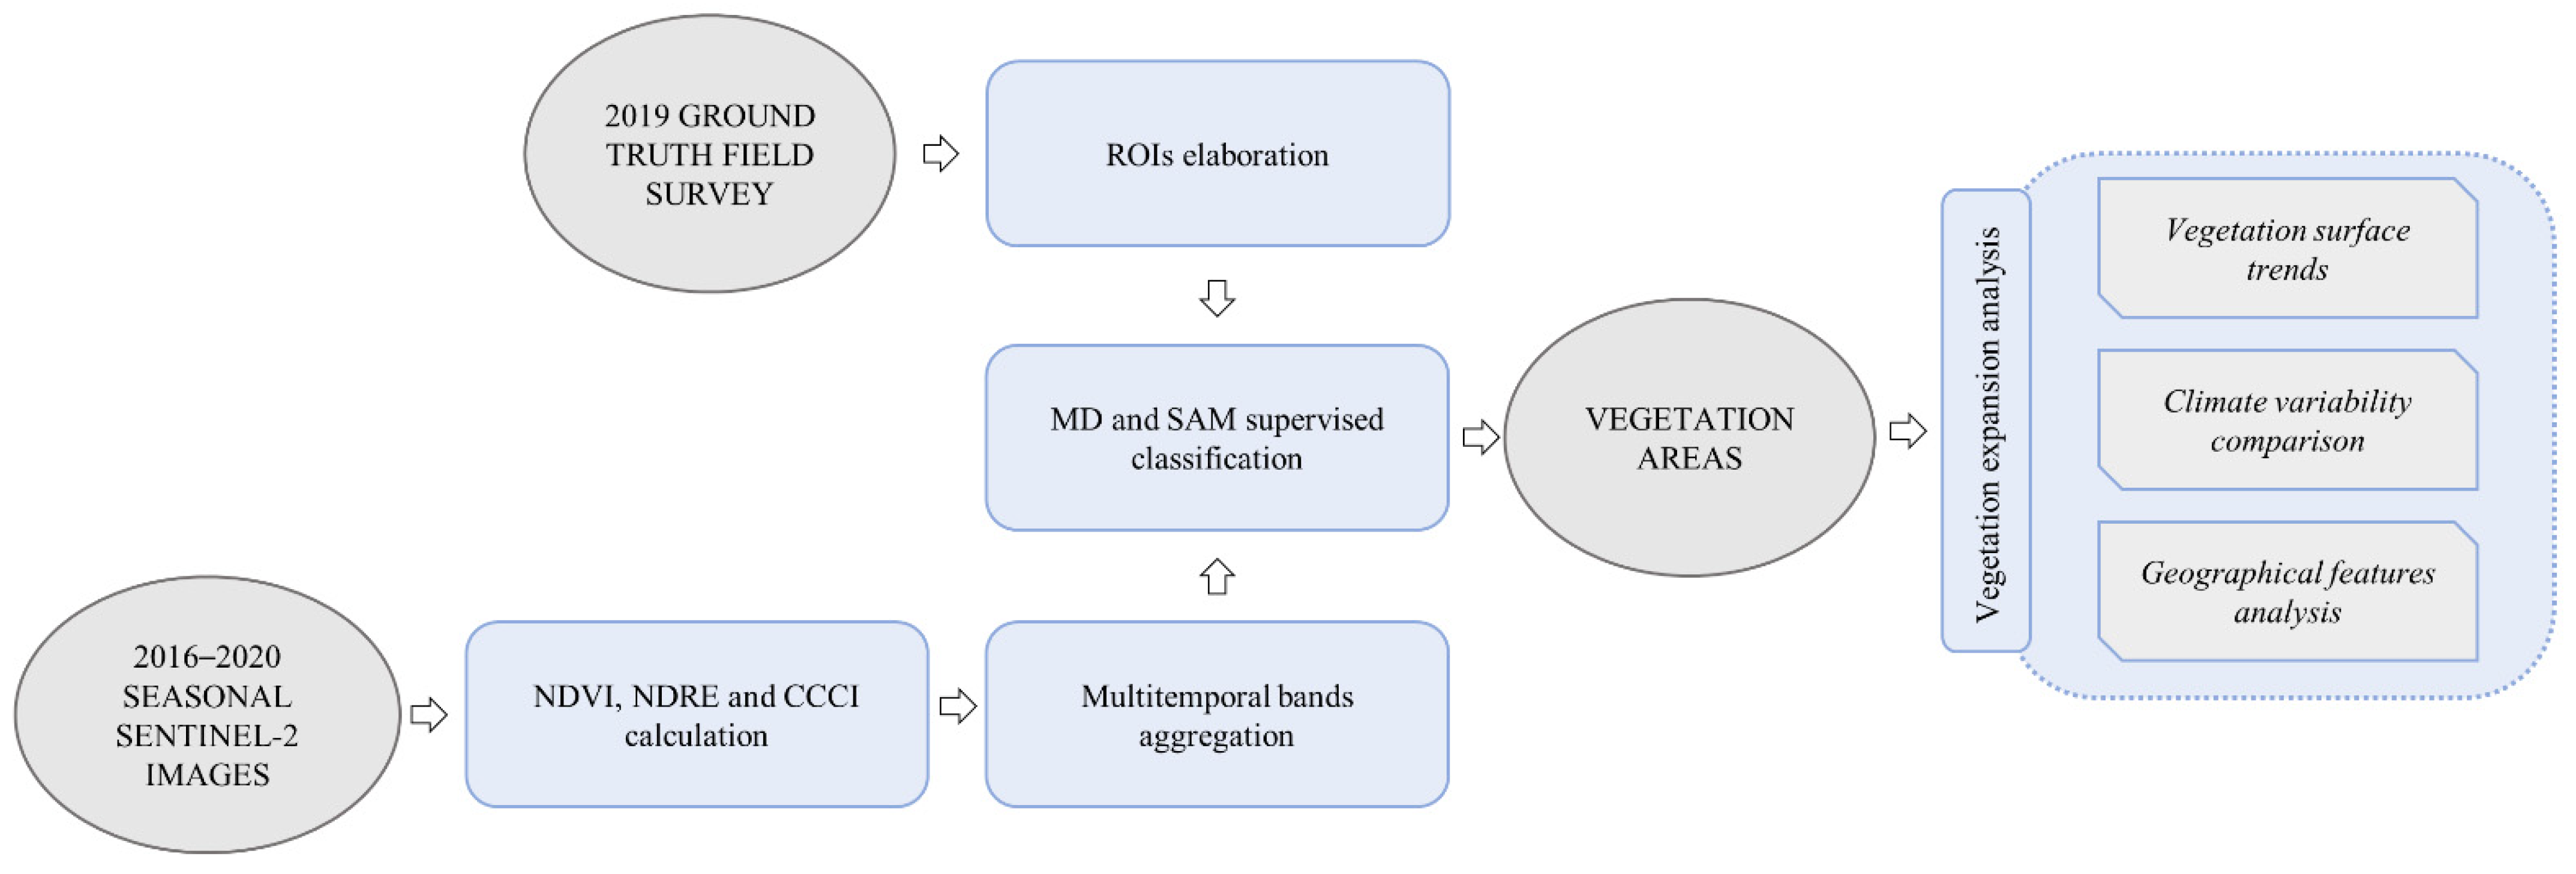
The source of the temperature and precipitation monthly series used in the analysis is the ERA5 reanalysis dataset from the European Centre for Medium-Range Weather Forecasts [47]. The monthly averaged data on single levels version was used, for the period 1990–2020, provided by the Climate Data Store of the Copernicus program. The closest point to the center of the area of study was chosen from the gridded dataset (3.28° N; 37.12° E).
Marked inter annual variability is observable between 1990 and 2020. This variation depends largely on the precipitation occurring outside the traditional boundaries of the rain seasons (MAM and OND). The mean monthly temperature varied between 28 °C and 33 °C. In general, the mean temperatures tend to be higher in the first six months of the year (from January to June) and decrease in the second semester (from July to December). The climatic features described are summarized by Figure 2.

2.3. Methodology

The methodology implemented in this work (see Figure 3) relies on a remote sensing supervised classification approach, based on the local annual vegetation phenology. Each step is described in detail below.

2.3.1. Preliminary Ground Truths Elaboration

The first step of the methodology consisted in the adjustment of the ground truths information, described in Section 2.2.2, in order to adapt it to a historical analysis. The aim of this preliminary step was to obtain seven Region Of Interests (ROIs), which covered only the densely vegetated areas in all the historical images. The shape of the seven original polygons, referring to the year 2019, was modified on the base of a visual comparison with the Sentinel-2 image of the first dry season of 2016. They were then compared with the rest of the images for checking that there has been no reduction in vegetation cover over time and therefore to assure the consistency of the ROIs for all the years. The ROIs constituted the training areas on which the classification process is based.

2.3.2. Images Pre-Processing and Vegetation Indices Calculation

This step was carried out with the SNAP software from the European Space Agency. The first step consisted in the atmospheric, terrain and cirrus correction of Top-of-Atmosphere Level 1C input data through the use of Sen2Cor processor in order to obtain Level-2A Bottom-Of-Atmosphere reflectance products. The second step of pre-processing consisted in the resampling to the 10 m resolution in order to obtain the same resolution for all the spectral bands. Then, three vegetation spectral indices were calculated for each image:
  • The Normalized Difference Vegetation Index (NDVI), a widely used index for vegetation analysis based on the NIR and the red bands, which has been already used for invasive species analysis in the Horn of Africa [48,49]:
NDVI ( b 8 b 4 ) ( b 8 + b 4 )
  • The Normalized Difference Red Edge (NDRE) index [50], which is similar to NDVI but based on the Vegetation Red Edge:
NDRE = ( b 8 b 5 ) ( b 8 + b 5 )
  • The Canopy Chlorophyll Content Index (CCCI) [50], which is a combination of the previous two:
CCCI = N D R E N D V I
All the three indices range from −1 to +1.

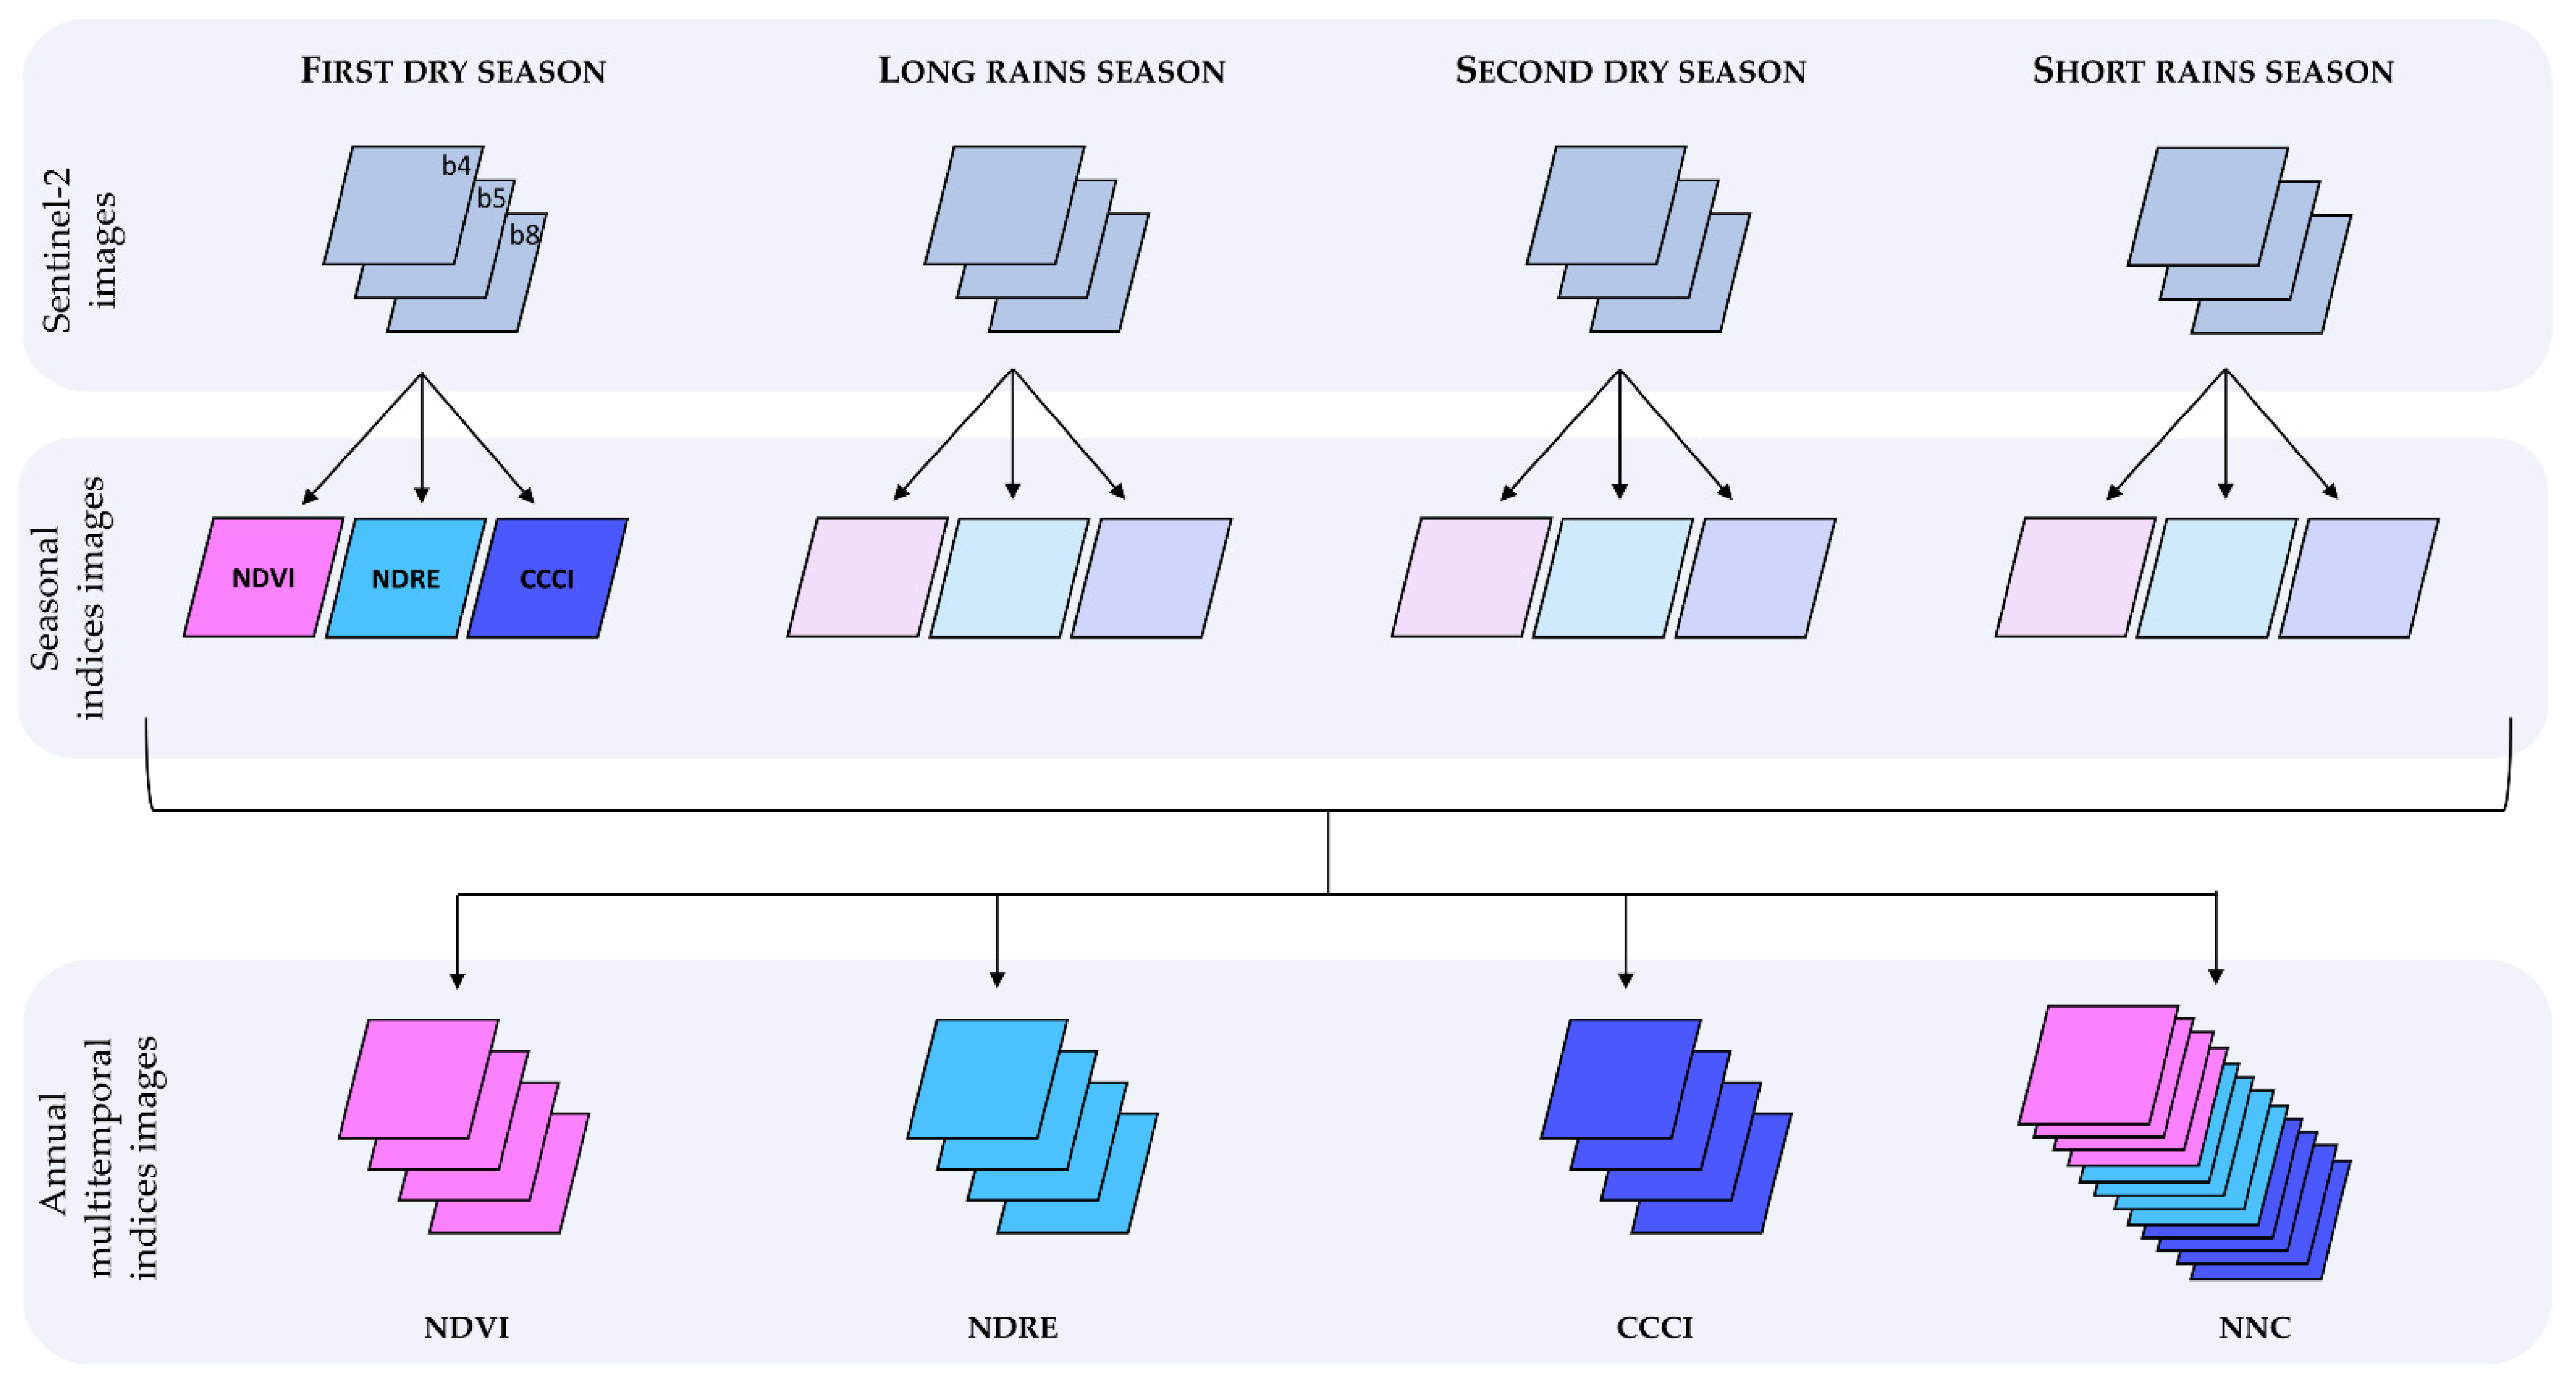
2.3.3. Multi-Temporal Images Creation

To distinguish the perennial vegetation, which appears to be vigorous also during the dry seasons, from the herbaceous vegetation, whose spectral signature greatly varies from wet to dry periods, a phenological approach was used. The indices bands created were combined, in order to obtain one multi-temporal image for each index for each year. Each annual image created, therefore, was made of four bands, one for each season, and contained information on the development of the index over the year. One image merging the three indices (NDVI-NDRE-CCCI, i.e., NNC) was also created for each year, resulting in a 12 bands images. In total 20 multi-temporal images were obtained. The creation process of the annual multi-temporal images is summarized in Figure 4.

2.3.4. Supervised Classification

This step was carried out with the ENVI software. After having tested different supervised classification methods, the Minimum Distance (MD) method was chosen for the NDVI, the NDRE and CCCI indices, while the Spectral Angle Mapper (SAM) method was chosen for the images derived from the combination of the three. One class was used for the classification, corresponding to the perennial vegetated areas, represented by seven ROIs described in Section 2.3.1. A distance from the mean of six times the standard deviation was used as input parameter of the MD, while 0.5 radians angle was used as input parameter for the SAM.

2.3.5. Outputs Surface Analysis

The surface classified as dense vegetation was calculated for each year for each index and analysed. Moreover, for each original Sentinel-2 image, the pixels were graded from 0 to 4 depending on the number of supervised classifications indicating their belonging to the perennial vegetation areas. For example, if a pixel had been identified as densely vegetated by the supervised classifications based on the NDVI and NDRE spectral indices, but not by the supervised classifications based on the CCCI and NNC, it was assigned a grade 2.
Only the pixels graded as 3 or 4 were selected and the results of this modal aggregation for the different years were compared.

2.3.6. Accuracy Validation

The accuracy of the classification performed was assessed in order evaluate the degree of agreement between classified images and reality. The classification accuracy was assessed based on the well-established confusion matrix method [51,52,53] following the three steps of (1) sample design, (2) sample labelling, (3) accuracy estimation [54]. The confusion matrix provides the key information of the correspondence between map and field data and allows estimating accuracy parameters: Overall Accuracy, User’s Accuracy, Producer’s Accuracy and Kappa coefficient [55,56]. The sample design strategy is based on stratified random sampling based on high resolution satellite images. Random points were created in the AOI following the rule of thumb of Congalton [57]: 200 in the whole area and 50 in the densely vegetated areas, for a total of 250 sampling points. The step of sampling labelling is based on the visual interpretation of high-resolution satellite images. The high-resolution Worldview-2 image acquired on the 17 December 2019, freely accessed through ArcMap base map imagery function, was used. Each point was classified as “densely vegetated” or “not densely vegetated” through the visual interpretation of the Worldview-2 image. The classification of the samples was then compared with the result of the supervised classifications for the Sentinel-2 pixel. The procedure was applied for the CCCI, the NDVI, the NDRE and the NNC indices for the year 2019. The same procedure was applied to the 2019 modal aggregation map, by considering the image pixel with grade 3 or 4 as classified as “densely vegetated”.
The accuracy estimations of the confusion matrix for each index were calculated.

2.3.7. Outputs Comparison with Climate Series

The results were finally compared with the precipitation and the temperature seasonal trends for the last 10 years, in order to investigate the relationship between the vegetation expansion and the climate annual variation.

3. Results

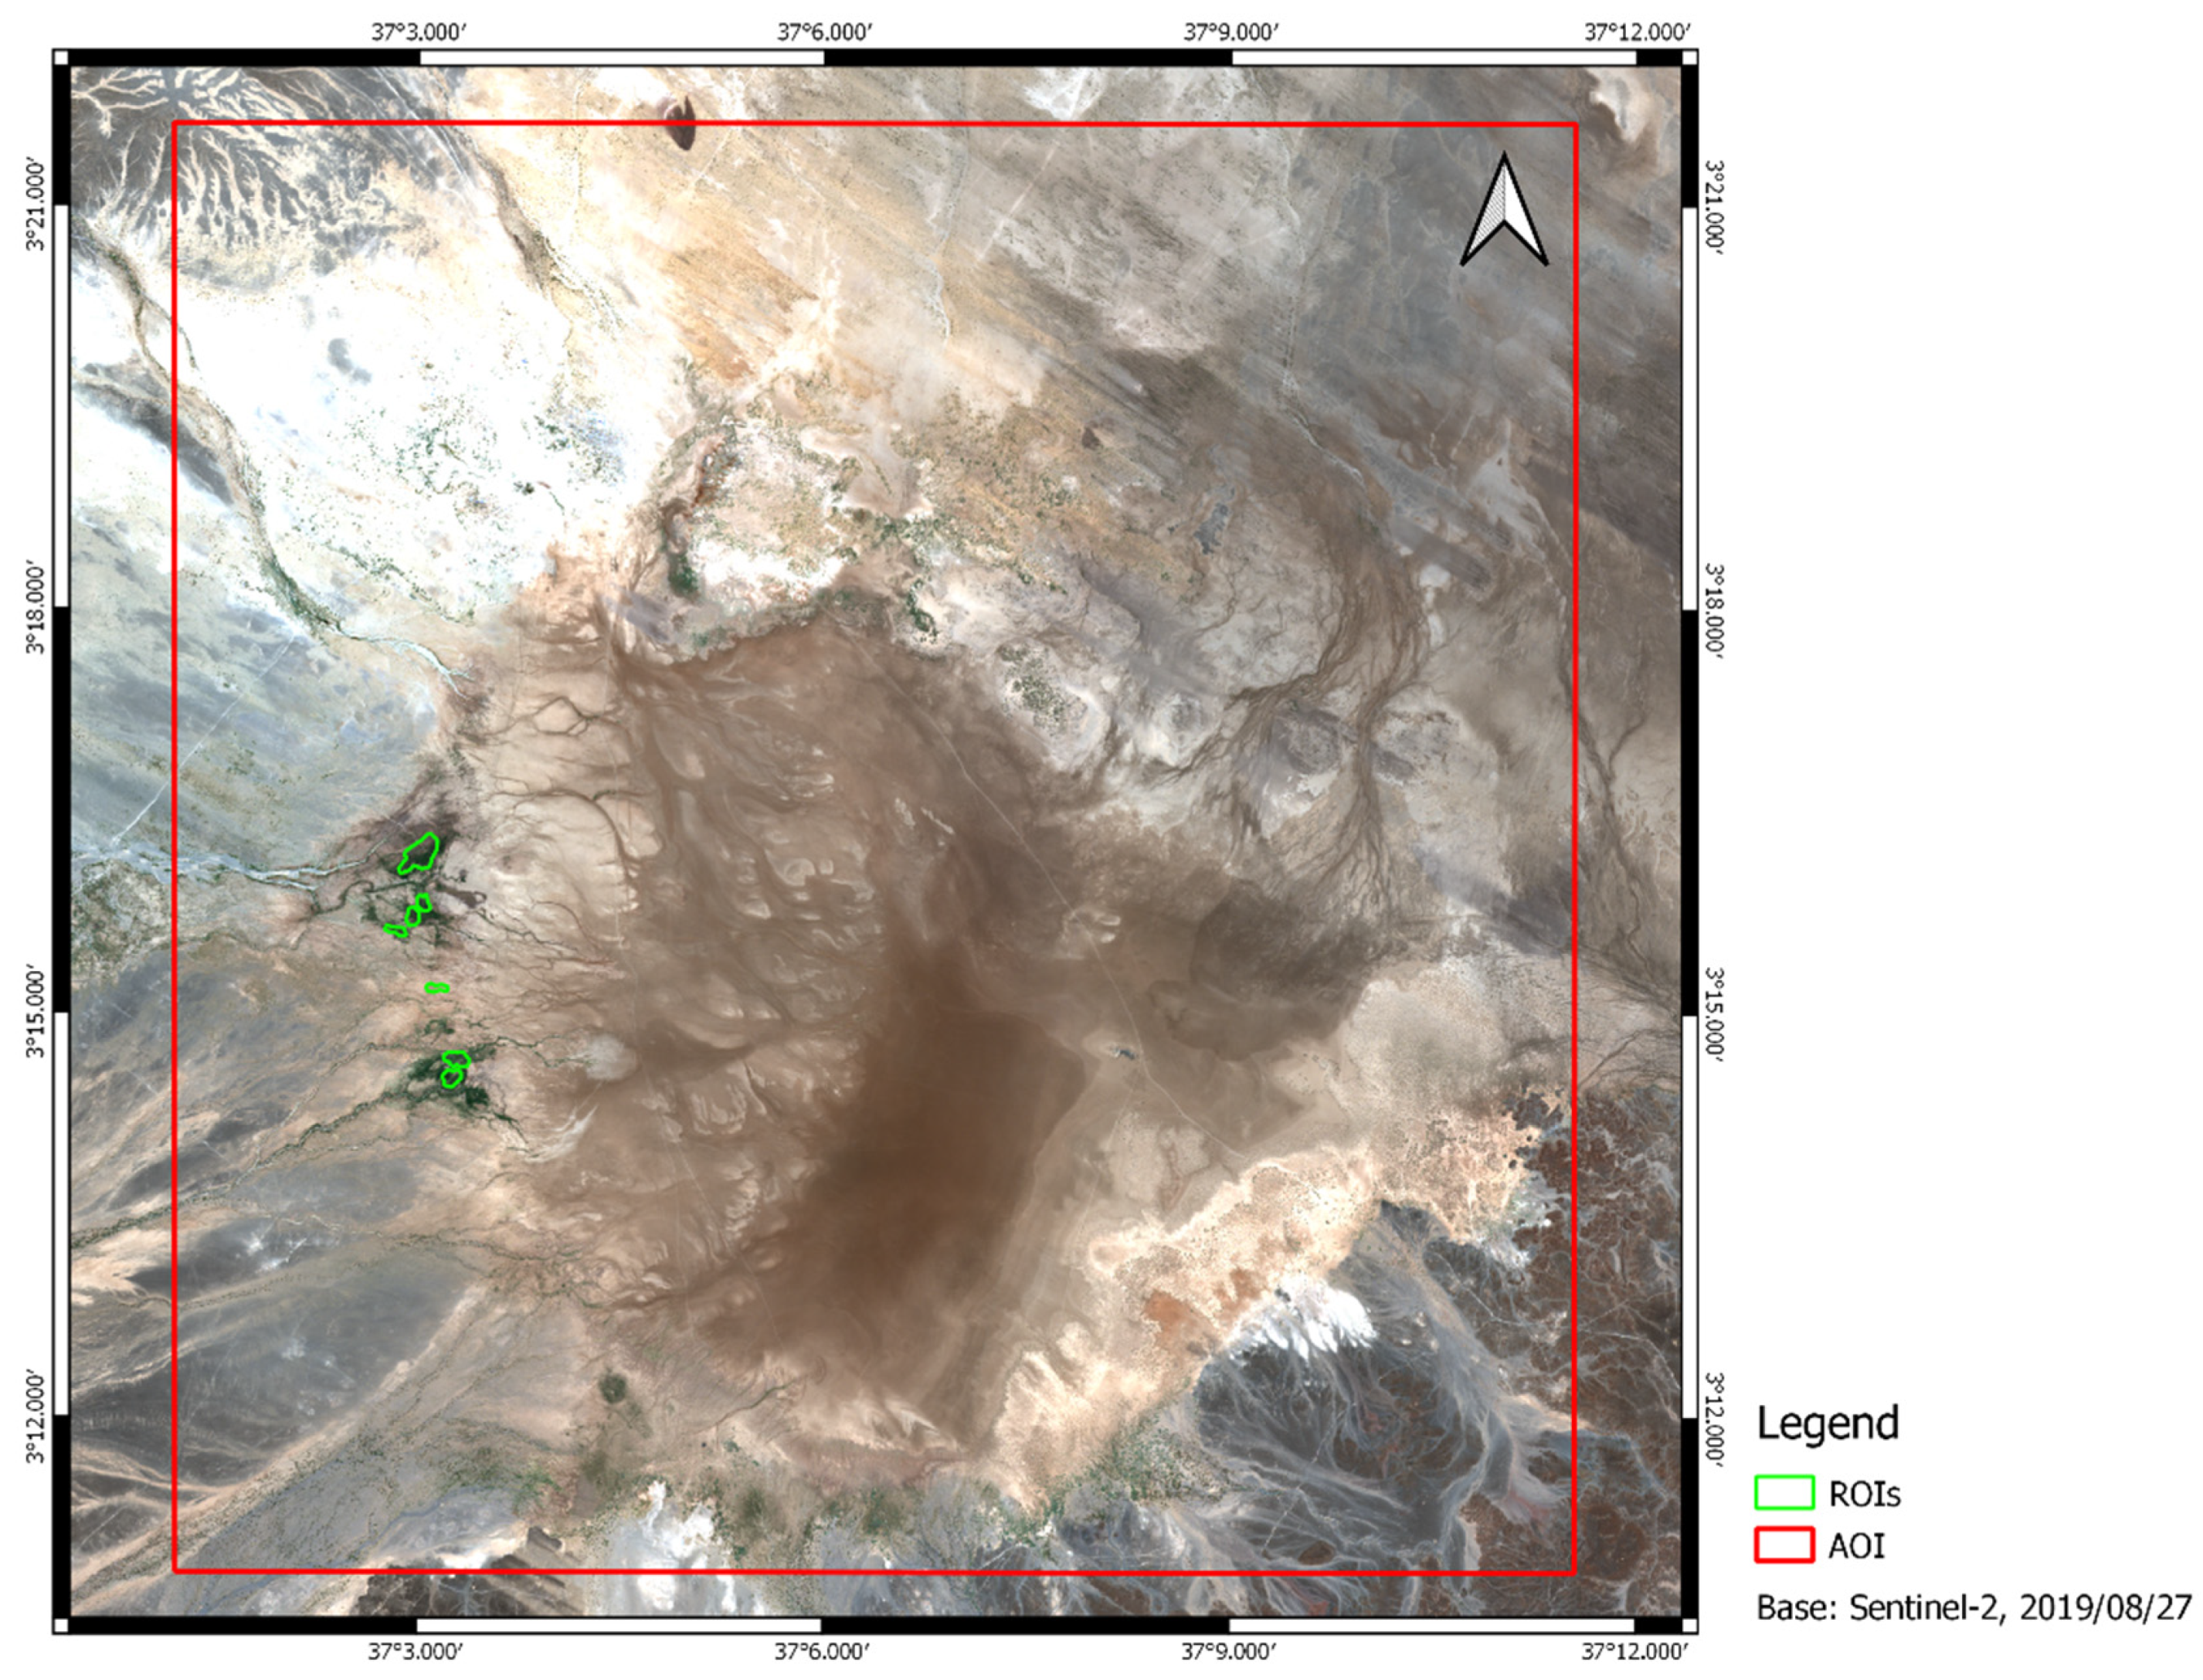
3.1. ROIs Elaboration

The elaboration of the ground truth information led to the identification of seven polygons covering the dense vegetated areas (see Figure 5). They identify perennial vegetation surfaces, which maintained their cover from 2016 to 2020.

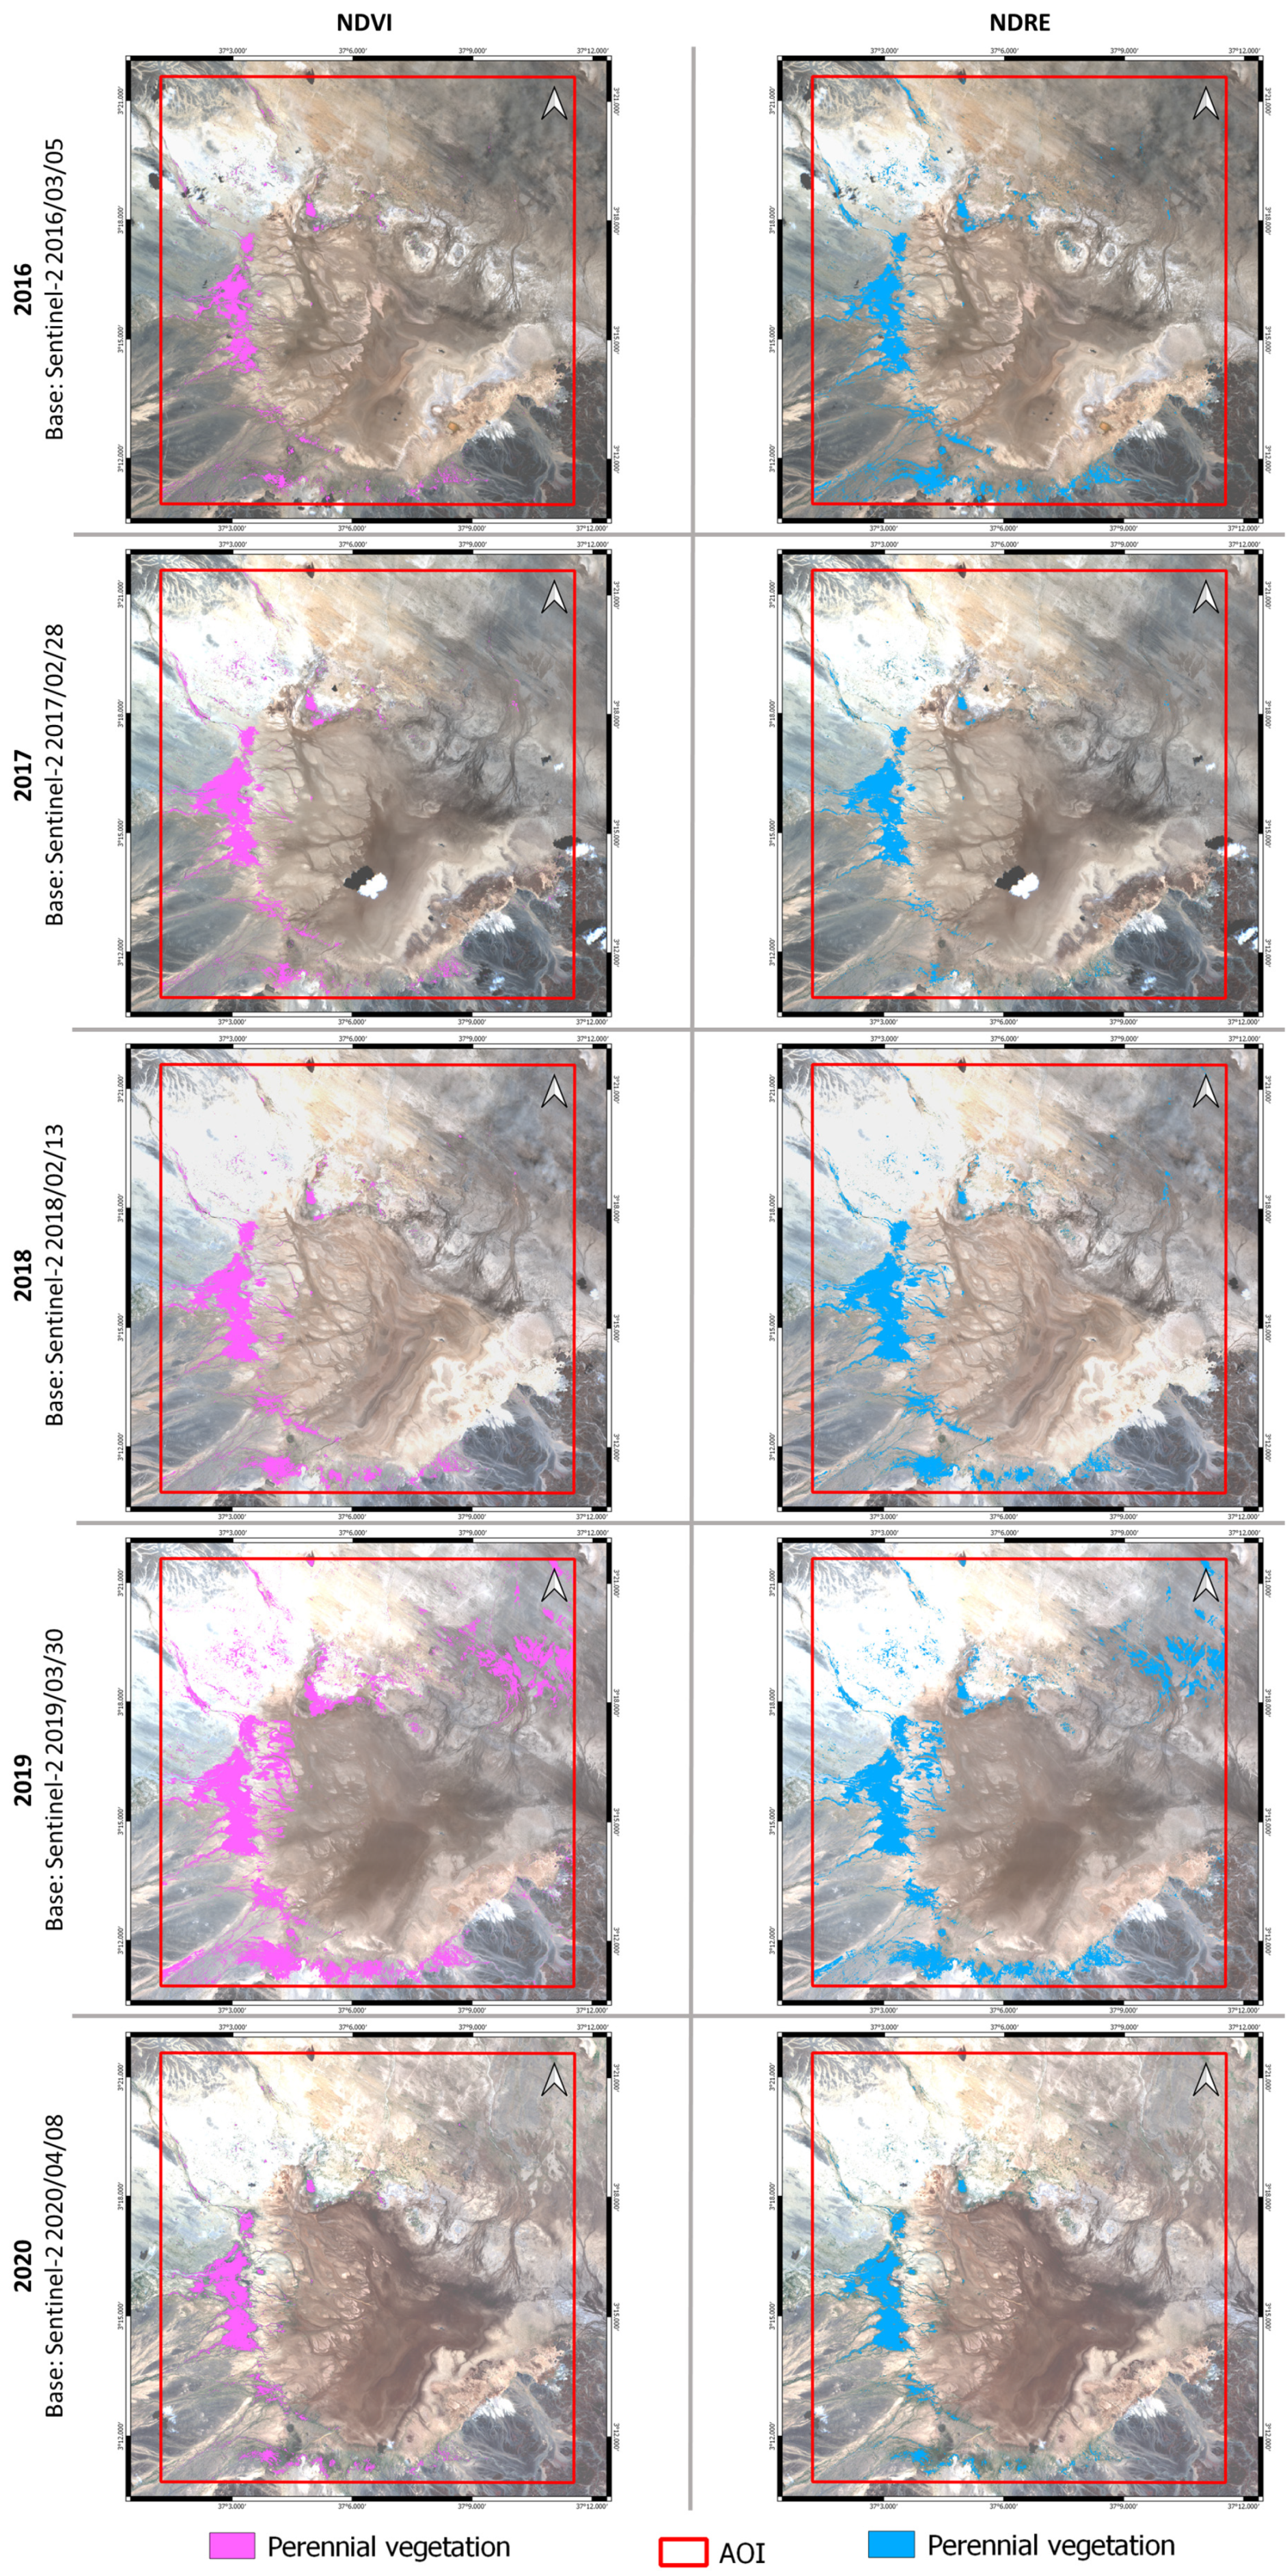
3.2. Multitemporal Indices Classification

The supervised classification of the multi-temporal annual indices images, based on the ROIs, resulted in 20 outputs, four for each analysed year: one classification output for the NDVI, one for the NDRE, one for the CCCI and one for the NNC. The outputs are illustrated by Figure 6 and Figure 7.

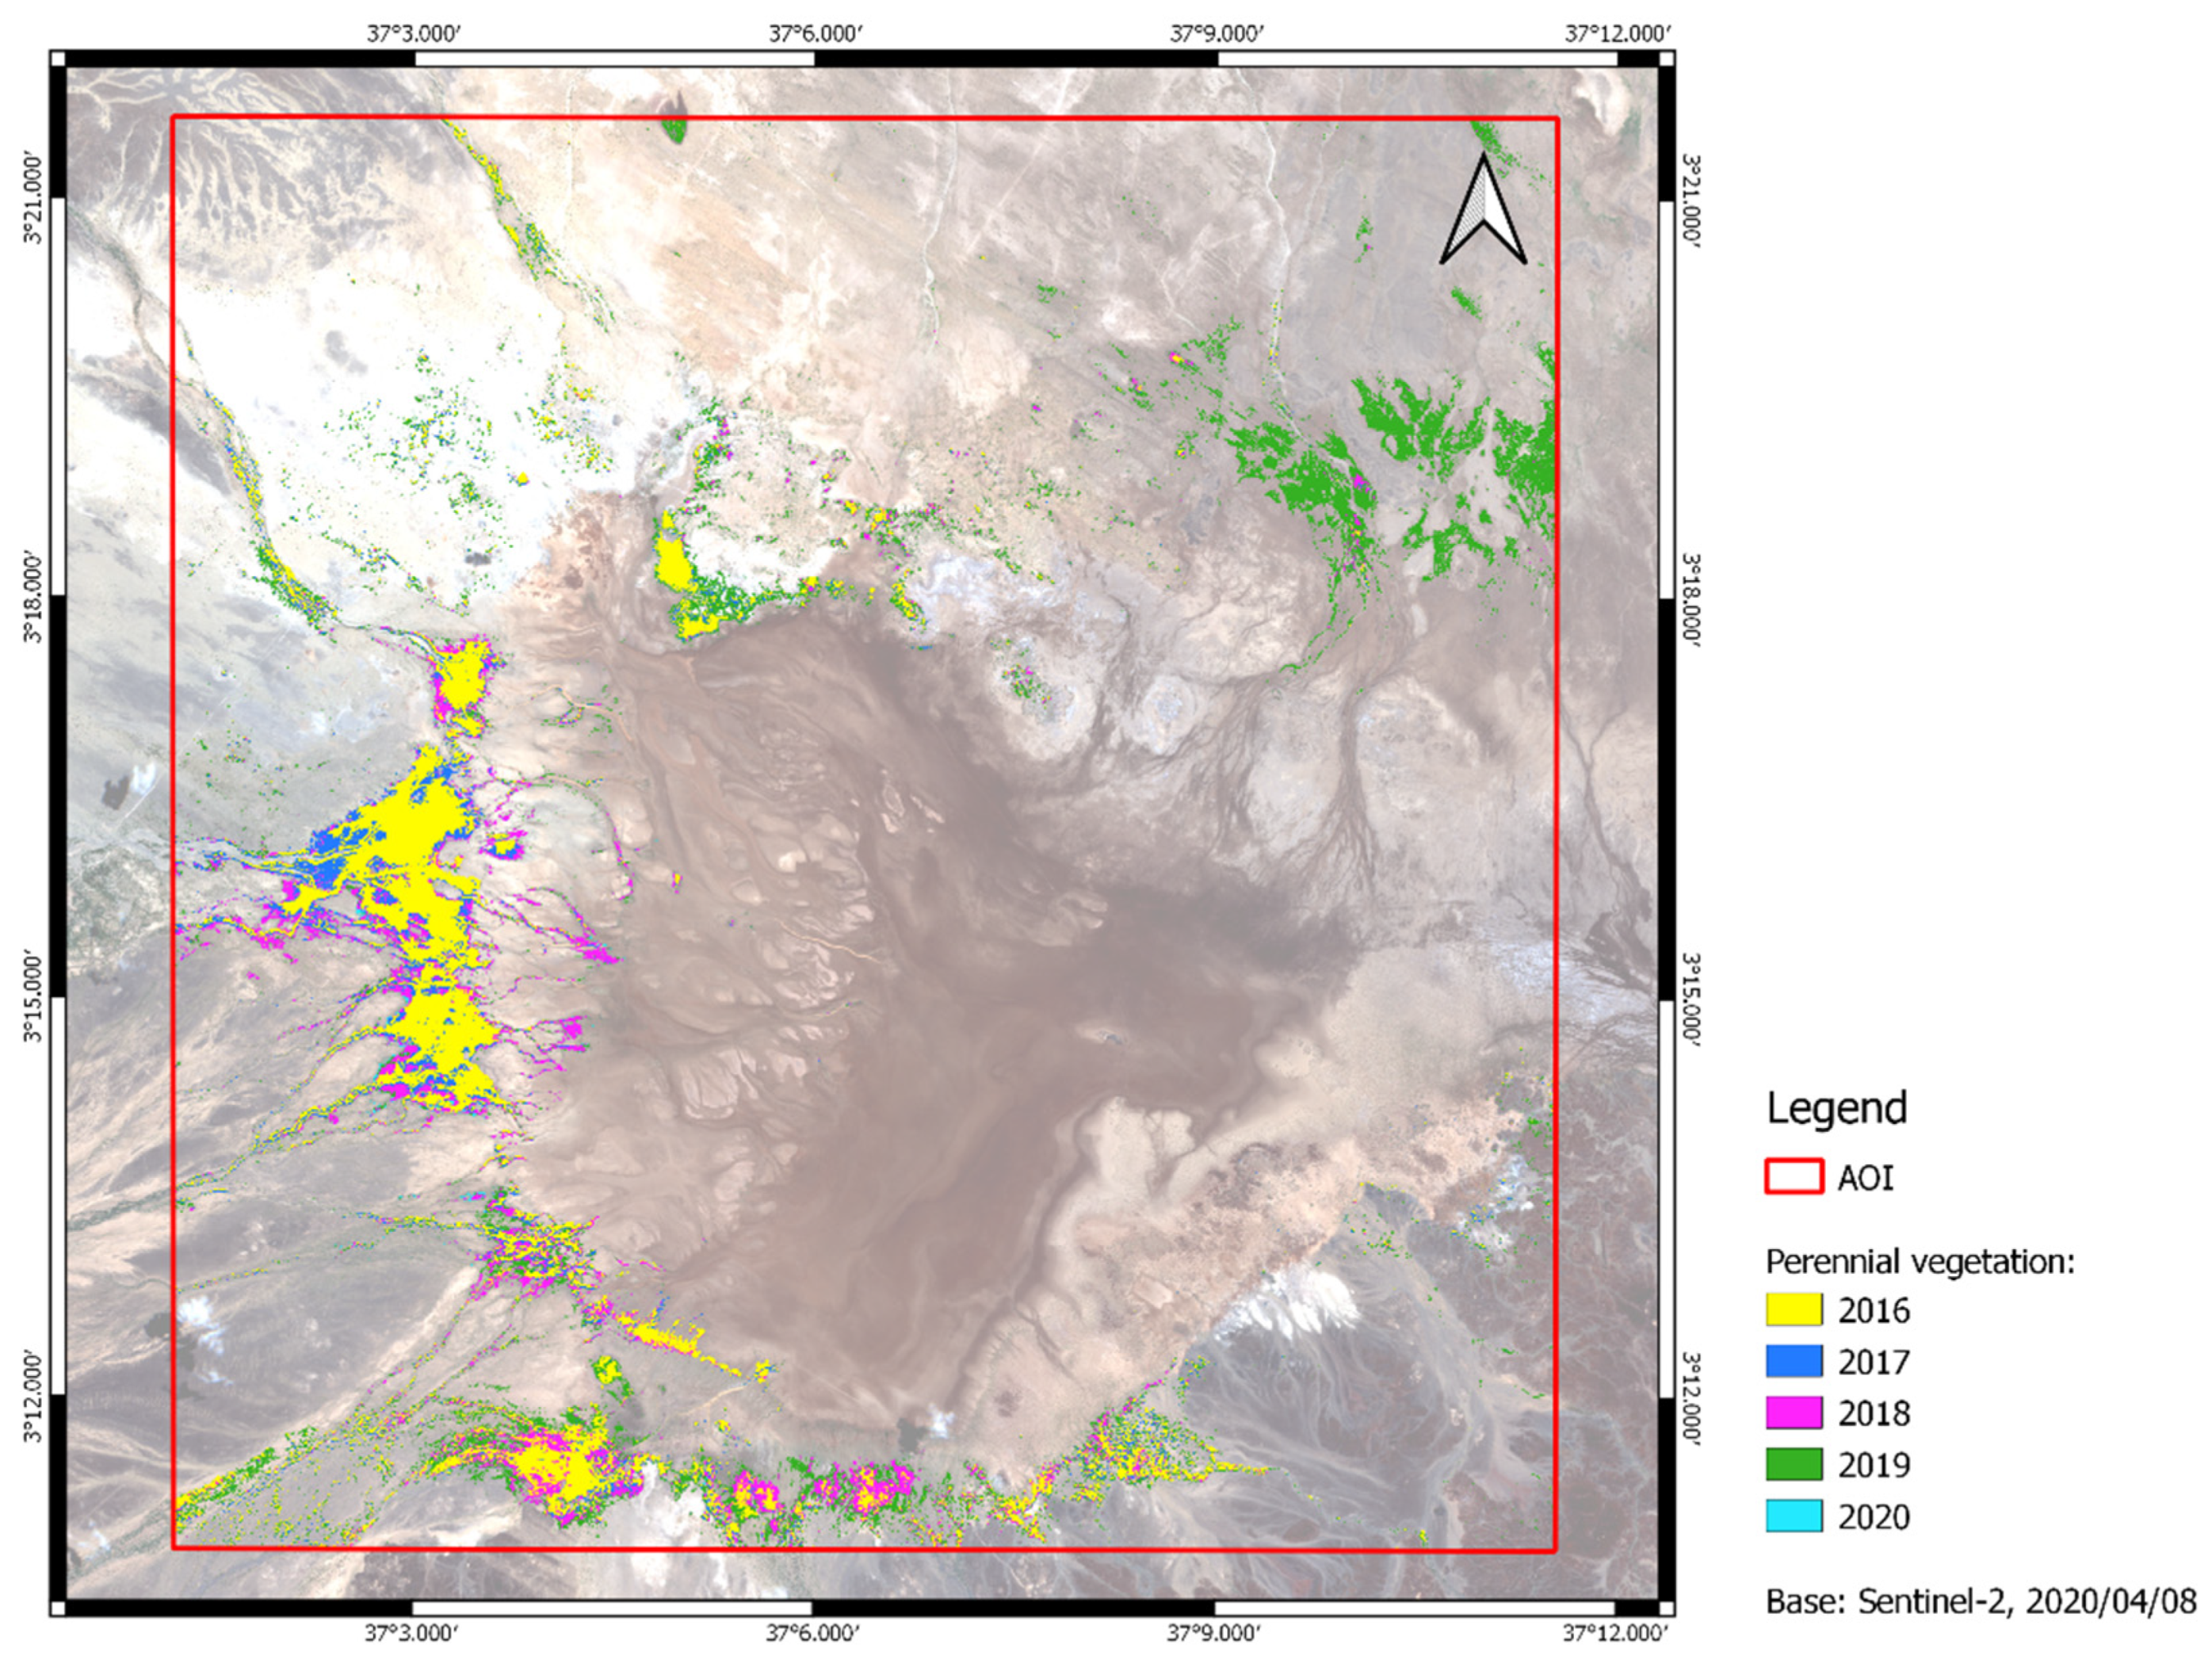
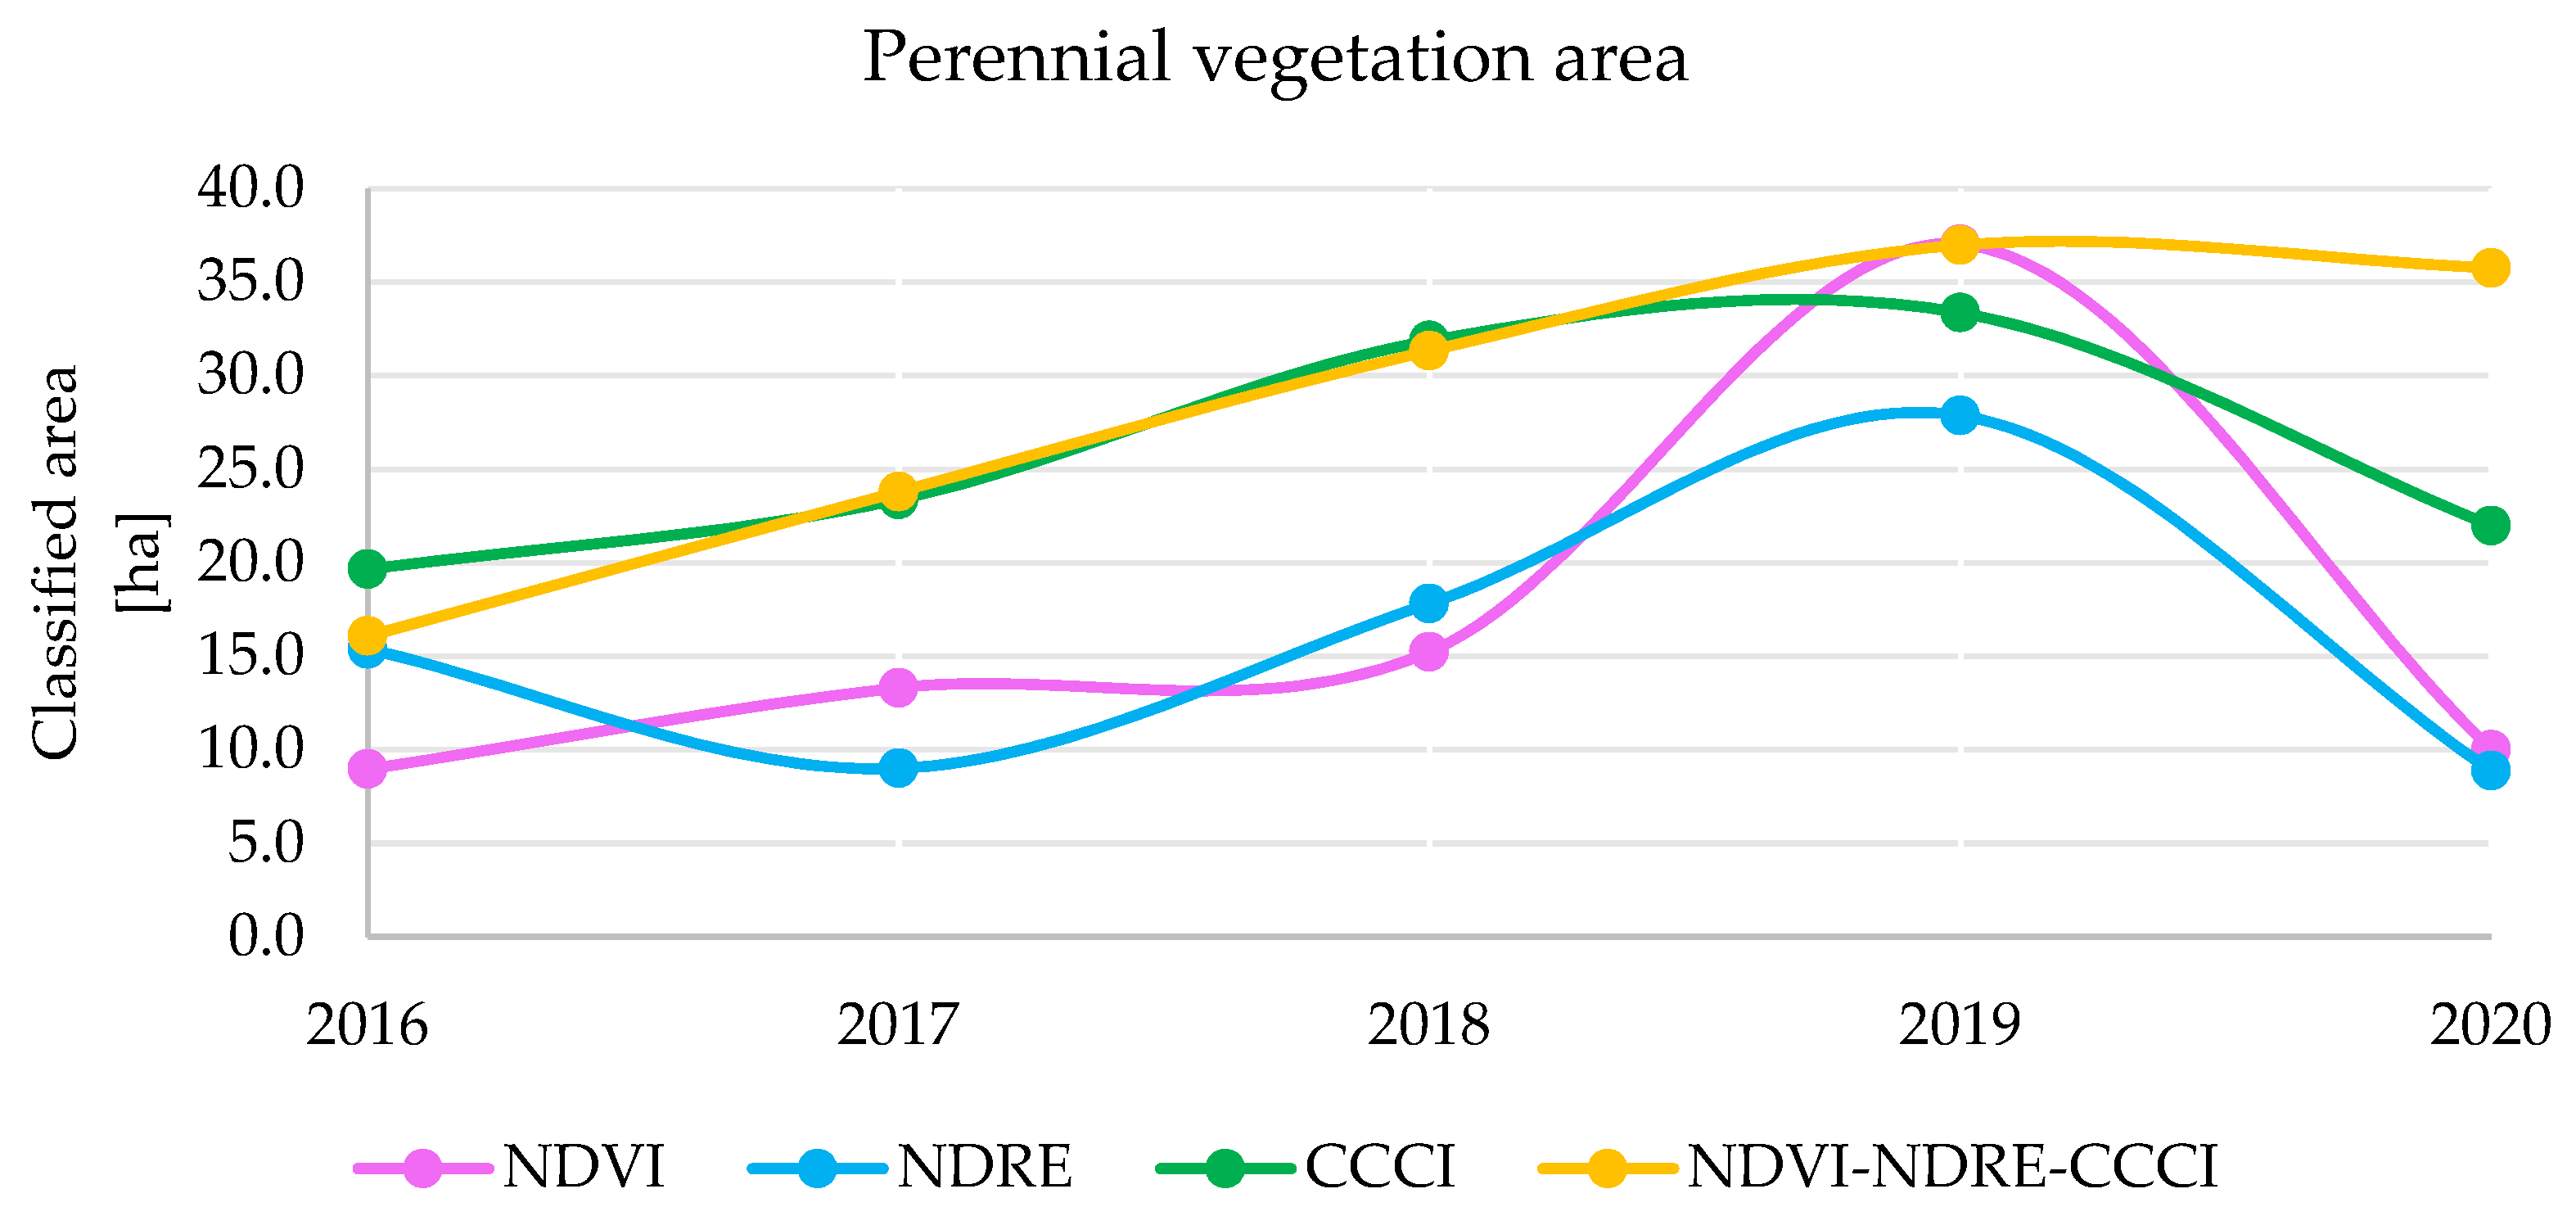
3.3. Vegetation Surface Analysis

In order to analyse the evolution of the distribution of the perennial vegetation between 2016 and 2020, the area classified in at least 3 of the 4 cases, i.e., at least in the 75% of the cases, was selected, obtaining a modal aggregation map. Figure 8 represents this evolution in a cartographic perspective, showing a clear expansion during the period considered, except for 2020.
The area classified for each index for each year was also calculated (see Figure 9). The result is in line with the variation highlighted by the previous figure, showing a general expansion of the perennial vegetated area from 2016 to 2019 and a decrease for the last year analysed. Consistent annual percentage increases are recorded by different indices. The NDVI presents the highest average increase followed by the NNC, with 33% and 24%, respectively. The NDRE and the CCCI show more moderate increases, with 11% and 6%, respectively. In general, an average annual percentage increase of 19% is found in the AOI.

3.4. Results Validation

The results of the validation are summarized in Table 2.
The overall accuracy exceeds 90% for all the indices showing a good agreement between the classified pixels and the reality, therefore always greater than the United State Geological Survey standard of 85% [58]. In general, producer and user’s accuracy for the two classes are satisfying. However, the NDVI show the overall best performances. The producer’s accuracy values of the densely vegetated class for the CCCI, NNC and modal aggregation indices (0.77, 0.88, 0.85, respectively) show that some areas were omitted from this class and were wrongly classified as not densely vegetated areas. The related values for user’s accuracy are higher, showing low commission error. Therefore, the densely vegetated areas do not include pixels from not densely vegetated areas. This pattern may lead to marginal underestimation of densely vegetated areas when using CCCI, NNC and modal aggregation indices.
The Kappa coefficient evaluates the accuracy of the classification compared to values assigned by chance, thus taking into account the possibility that the samples are mapped correctly by pure chance. In this case the high positive values show a very good accuracy for all the indices except for CCCI. The Kappa coefficient results confirm that NDVI index performs better than the other indices.
In conclusion, the overall accuracy of the supervised classification is adequate to the aim of the analysis.

4. Discussion

Results from the multi-temporal indices classification show that there is a consistency in the areas classified as perennial vegetation by each index. The validation supports the significance of the results obtained for all the indices, but in particular for NDVI index; this confirms that NDVI is suitable for land cover assessment in semiarid areas, as found by [48,49]. In general, a vegetation increasing from 2016 to 2020 was observed. Figure 6 and Figure 7 show that for each year—reading horizontally—the indices roughly classify the same area as perennial vegetation. However, NDVI and NDRE indices classify the smallest perennial vegetation area, while CCCI and NNC indices classify the largest. These observations are confirmed by the historical variation for each index in Figure 9. The NDVI and NDRE indices (magenta and cyan lines) are generally lower than CCCI and NNC indices (green and yellow lines) throughout the years. Figure 6 and Figure 7 also show that—reading vertically—according to each index there was an expansion of the vegetated areas. Nevertheless, the area classified as perennial vegetation in 2019 is greater than in 2020. This is probably due to precipitation patterns occurred in 2019 (Figure 2a). The short rain season of 2018 was followed by a long rain season that was drier than normal in 2019. The prolonged drier period coupled with the phenomenon of erratic rain patterns inhibited the regular growth of the vegetation. This expansion is confirmed by Figure 8, which shows the modal aggregation i.e., the area classified as perennial vegetation by at least 3 or 4 classification methods for each year (75–100% of probability). In this figure, it is possible to observe the enlargement of the vegetation from its initial area in 2016 (yellow area) by superimposition of the years. As expected, along the dense vegetated area in the western part, new vegetation appeared in 2017 (blue area), in 2018 (magenta area) and in 2019 (green area). The year 2019 represents the peak of maximum expansion. By contrast, the area in light blue, corresponding to the year 2020, is hardly visible as the dry conditions in 2019 influenced the vegetation growth. In the tropics and specifically in the ASALs, rainfall is the dominant factor affecting vegetation greenness [59]. Although the growth of herbaceous vegetation follows precipitation pattern, the green-up of woody and shrub vegetation shows a delay in time as assessed by [60]. This result allows to interpret the latency between climatic conditions and vegetation growth. In the year 2021 the vegetation will probably increase, based on the abundant precipitation received in the area in 2020 and on an above-normal rainfall during the long rains season in March-April-May 2021 [61]. The relation between precipitation and vegetation dynamic is evident, while temperatures show less influence. appears. Even if temperature ranges, along with continuous water availability, are important for plant germination, they appear not to be directly involved in inter-annual vegetation dynamics.
The results of this study assesses the changes in land cover from 2016 to 2020. However, limits linked to the resolution of satellite images prevent the detection of changes in the biodiversity of plant communities connected to the greening. The greening observed in the area of study, in fact, is likely due to the encroachment of alien species, as confirmed by local sources (personal communications).
Invasive species impact the livelihood of pastoral communities in ASALs encroaching pastures [62], invading riverine plains restricting access to water in dry conditions [25], impoverishing soil quality [63], posing health threat to animals if eaten (when poisonous) [64], enhancing conflicts between pastoralist groups for resource grabbing [65,66]. In North Horr Sub-County, among the alien species introduced, Prosopis juliflora is nowadays the most commonly found in dense vegetated areas. Many studies have focused on the original areas of introduction of the plant near Lake Turkana and Lake Baringo [17,67,68,69] assessing its spread and its presence is confirmed also in Marsabit County [62,70,71]. Other invasive species found in the area are Calotropis Procera [72] Solanum species [73], Opuntia species [25,74]. The intended benefits of the introduction of alien species for greening purposes have been counteracted by their adverse impacts on the ecosystems and pastoral communities. Due to the presence of these alien species, the general greening observed can be associated to desertification processes linked to changes in species composition and shrub encroachment [75,76,77]. The pauperization of native-species is an indicator of weak health [8] in the ecosystem, caused by the reduction of species richness and by the decrease of woody plants in favor of bush and shrub [76,78,79]. Biodiversity reduction causes the loss of different ecosystem services and, thus, is considered a form of land degradation [2,80,81].
In a second phase, the assessment of the presence of alien species might be validated in situ through the support of local staff and citizen science activities, as already performed for similar projects. In this way, due to the remoteness and wideness of the area, it is possible to carry targeted and effective monitoring activities.

5. Conclusions

This study based on Sentinel-2 satellite images confirms the existence of a greening in the ASALs of northern Kenya.
The methodology used in this study assessed vegetation dynamics in areas with scant data issues and problems of access by using a remote sensing approach. A validation procedure based on the visual interpretation of high-resolution satellite images was also proposed to cope with the lack of high-quality ground-truth information. Thanks to freely available data, relations were found between the diffusion of perennial vegetation and meteorological conditions and were also discussed.
However, local information sources and studies in surroundings areas suggest the ongoing encroachment of alien species in the area. The vegetation increasing, therefore, could be linked with a loss of biodiversity, especially the vegetation species that constitute a resource for the local people. For this reason, the results of this study might be used to support targeted field analysis in the areas characterised by ongoing greening processes for assessing the composition of plant communities.
In addition, the results of this work confirm the suitability of Sentinel-2 images for vegetation analysis in scant data contexts in arid and semi-arid areas. However, although Sentinel-2 images represent a valid support tool to understand and monitor land cover changes taking place in the area, higher resolution images would help in assessing the presence of some selected species.
The results of this study greatly support the local decision-making processes to tackle the issues connected to the changes in land cover. The success of this method, moreover, sets the basis for future research that focuses on citizen science activities in remote locations by facilitating the identification of the areas that need to be monitored in situ.

Author Contributions

Conceptualization, V.B., I.V., E.C.; methodology, V.B., I.V.; formal analysis, V.B., I.V.; writing—original draft preparation V.B., I.V.; writing—review and editing, V.B., I.V., E.C., A.P.; supervision, E.C., A.P.; project administration, A.P. All authors have read and agreed to the published version of the manuscript.

Funding

This research received no external funding.

Institutional Review Board Statement

Not applicable.

Informed Consent Statement

Not applicable.

Data Availability Statement

All the data analyzed in this study are part of public databases, which have been cited in the text. For further information about their elaboration, please contact the correspondence author.

Acknowledgments

This study was partially conducted within the framework of the International Cooperation Project “ONE HEALTH: Multidisciplinary approach to promote the health and resilience of shepherds’ communities in northern Kenya” funded by the Italian Agency for Development Cooperation (AICS). The authors would like to thank the project coordinator (CCM- now AMREF) and the project partners (TRIM and VSF-Germany).

Conflicts of Interest

The authors declare no conflict of interest.

References

  1. UNCCD. Land Degradation Neutrality Target Setting—A Technical Guide; UNCCD: Bonn, Germany, 2016. [Google Scholar]
  2. Mirzabaev, A.; Wu, J.; Evans, J.; García-Oliva, F.; Hussein, I.A.G.; Iqbal, M.H.; Kimutai, J.; Knowles, T.; Meza, F.; Nedjraoui, D.; et al. Desertification. In Climate Change and Land: An IPCC Special Report on Climate Change, Desertification, Land Degradation, Sustainable Land Management, Food Security, and Greenhouse Gas Fluxes in Terrestrial Ecosystems; Shukla, P.R., Skea, J., Buendia, E.C., Masson-Delmotte, V., Pörtner, H.-O., Roberts, D.C., Zhai, P., Slade, R., Belkacemi, M., Malley, J., et al., Eds.; IPCC: Geneva, Switzerland, 2019; in press. [Google Scholar]
  3. Mirzabaev, A.; Nkonya, E.; Goedecke, J.; Johnson, T.; Anderson, W.; Mirzabaev, A.; Goedecke, Á.J.; Goedecke, J.; Nkonya, E.; Johnson, Á.T.; et al. Global Drivers of Land Degradation and Improvement. In Economics of Land Degradation and Improvement—A Global Assessment for Sustainable Development; Nkonya, E., Mirzabaev, A., von Braun, J., Eds.; Springer International Publishing: Cham, Switzerland, 2016; pp. 167–195. ISBN 9783319191683. [Google Scholar]
  4. Barbier, E.B. The economic determinants of land degradation in developing countries. Philos. Trans. R. Soc. London. Ser. B Biol. Sci. 1997, 352, 891–899. [Google Scholar] [CrossRef] [Green Version]
  5. Shittu, A.M.; Kehinde, M.O.; Ogunnaike, M.G.; Oyawole, F.P. Effects of Land Tenure and Property Rights on Farm Households’ Willingness to Accept Incentives to Invest in Measures to Combat Land Degradation in Nigeria. Agric. Resour. Econ. Rev. 2018, 47, 336–356. [Google Scholar] [CrossRef] [Green Version]
  6. Besley, T. Property rights and investment incentives: Theory and evidence from Ghana. J. Polit. Econ. 1995, 103, 903–937. [Google Scholar] [CrossRef] [Green Version]
  7. Kilewe, A.M.; Kealey, K.M.; Kebaara, K.K. (Eds.) The International Council for Research in Agroforestry Agroforestry Development in Kenya. In Proceedings of the Second Kenya National Seminar on Agroforestry; International Council for Research in Agroforestry: Nairobi, Kenya, 1989; p. 534. [Google Scholar]
  8. Perrino, E.V.; Musarella, C.M.; Magazzini, P. Management of grazing Italian river buffalo to preserve habitats defined by Directive 92/43/EEC in a protected wetland area on the Mediterranean coast: Palude Frattarolo, Apulia, Italy. Euro-Mediterr. J. Environ. Integr. 2021, 6, 1–18. [Google Scholar] [CrossRef]
  9. Mulinge, W.; Gicheru, P.; Murithi, F.; Maingi, P.; Kihiu, E.; Kirui, O.K.; Mirzabaev, A. Economics of land degradation and improvement in Kenya. In Economics of Land Degradation and Improvement—A Global Assessment for Sustainable Development; Nkonya, E., Mirzabaev, A., von Braun, J., Eds.; Springer International Publishing: Cham, Switzerland, 2015; pp. 471–498. ISBN 9783319191683. [Google Scholar]
  10. Macharia, P.N.; Ekaya, W. Vegetation degradation and its influence on rangeland of condition and trend in semi-arid Mashuru division, Kajiado district, Kenya: Oil. In Proceedings of the Soil Science Society of East Africa (SSSEA), Annual Conference, Nairobi, Kenya, 1–5 December 2003. [Google Scholar]
  11. Wagensommer, R.P.; Bartolucci, F.; Fiorentino, M.; Licht, W.; Peccenini, S.; Perrino, E.V.; Venanzoni, R. First record for the flora of Italy and lectotypification of the name Linum elegans (Linaceae). Phytotaxa 2017, 296, 161–170. [Google Scholar] [CrossRef]
  12. Xu, H.; Qiang, S.; Han, Z.; Guo, J.; Huang, Z.; Sun, H.; He, S.; Ding, H.; Wu, H.; Wan, F. The status and causes of alien species invasion in China. Biodivers. Conserv. 2006, 15, 2893–2904. [Google Scholar] [CrossRef]
  13. Shackleton, C.M.; Mcgarry, D.; Fourie, S.; Gambiza, J.; Shackleton, S.E.; Fabricius, C. Assessing the Effects of Invasive Alien Species on Rural Livelihoods: Case Examples and a Framework from South Africa. Hum. Ecol. 2006, 35, 1. [Google Scholar] [CrossRef]
  14. Jama, B.; Zeila, A. Agroforestry in the Drylands of Eastern Africa: A Call to Action; International Council for Research in Agroforestry: Nairobi, Kenya, 2005. [Google Scholar]
  15. Bradley, P.N. Methodology for Woodfuel Development Planning in the Kenyan Highlands. J. Biogeogr. 1988, 15, 157. [Google Scholar] [CrossRef]
  16. Harrison, P. The Greening of Africa: Breaking through in the Battle for Land and Food by Paul Harrison. J. Mod. Afr. Stud. 1991, 29, 336–338. [Google Scholar]
  17. Ng, W.-T.; Immitzer, M.; Floriansitz, M.; Vuolo, F.; Luminari, L.; Adede, C.; Wahome, R.; Atzberger, C. Mapping Prosopis spp. within the Tarach water basin, Turkana, Kenya using Sentinel-2 imagery. In Proceedings of the Remote Sensing for Agriculture, Ecosystems, and Hydrology XVIII; Neale, C.M.U., Maltese, A., Eds.; SPIE: Edinburgh, UK, 2016; Volume 9998, p. 99980L. [Google Scholar]
  18. Olukoye, G.A.; Kinyamario, J.I. Community participation in the rehabilitation of a sand dune environment in Kenya. L. Degrad. Dev. 2019, 20, 397–409. [Google Scholar] [CrossRef]
  19. Olukoye, G.; Wamicha, W.N.; van Eckert, M.; Mwanje, J.I.; Kinyamario, J.I. The place of agroforestry in the rehabilitation and utilisation of semi-desert environments of northern Kenya. In Rebuilding Africa’s Capacity for Agricultural Development—The Role of Tertiary Education; Temu, A., Chakeredza, S., Mogotsi, K., Munthali, D., Mulinge, R., Eds.; African Network for Agroforestry Education: Nairobi, Kenya, 2004; pp. 218–226. [Google Scholar]
  20. UN General Assembly A/RES/71/313. UN Doc. 2017, pp. 1–6. Available online: https://undocs.org/A/RES/71/313 (accessed on 12 August 2021).
  21. Kirui, O.K.; Mirzabaev, A.; von Braun, J. Assessment of land degradation ‘on the ground’ and from ‘above’. SN Appl. Sci. 2021, 3, 1–13. [Google Scholar] [CrossRef]
  22. Dubovyk, O. The role of Remote Sensing in land degradation assessments: Opportunities and challenges. Eur. J. Remote Sens. 2017, 50, 601–613. [Google Scholar] [CrossRef]
  23. Adole, T.; Dash, J.; Atkinson, P.M. A systematic review of vegetation phenology in Africa. Ecol. Inform. 2016, 34, 117–128. [Google Scholar] [CrossRef]
  24. Cheng, Y.; Vrieling, A.; Fava, F.; Meroni, M.; Marshall, M. Stella Gachoki Phenology of short vegetation cycles in a Kenyan rangeland from PlanetScope and Sentinel-2|Elsevier Enhanced Reader. Remote Sens. Environ. 2020, 248, 112004. [Google Scholar] [CrossRef]
  25. Muthoka, J.M.; Salakpi, E.E.; Ouko, E.; Yi, Z.-F.; Antonarakis, A.S.; Rowhani, P. Mapping Opuntia stricta in the Arid and Semi-Arid Environment of Kenya Using Sentinel-2 Imagery and Ensemble Machine Learning Classifiers. Remote Sens. 2021, 13, 1494. [Google Scholar] [CrossRef]
  26. Kganyago, M.; Mhangara, P.; Alexandridis, T.; Laneve, G.; Ovakoglou, G.; Mashiyi, N. Validation of sentinel-2 leaf area index (LAI) product derived from SNAP toolbox and its comparison with global LAI products in an African semi-arid agricultural landscape. Remote Sens. Lett. 2020, 11, 883–892. [Google Scholar] [CrossRef]
  27. Mudereri, B.T.; Dube, T.; Adel-Rahman, E.M.; Niassy, S.; Kimathi, E.; Khan, Z.; Landmann, T. A comparative analysis of PlanetScope and Sentinel-2 space-borne sensors in mapping Striga weed using Guided Regularised Random Forest classification ensemble. Int. Arch. Photogramm. Remote Sens. Spat. Inf. Sci. 2019, 42. [Google Scholar] [CrossRef] [Green Version]
  28. Masemola, C.; Cho, M.A.; Ramoelo, A. Sentinel-2 time series based optimal features and time window for mapping invasive Australian native Acacia species in KwaZulu Natal, South Africa. Int. J. Appl. Earth Obs. Geoinf. 2020, 93, 102207. [Google Scholar] [CrossRef]
  29. Rajah, P.; Odindi, J.; Mutanga, O. Evaluating the potential of freely available multispectral remotely sensed imagery in mapping American bramble (Rubus cuneifolius). S. Afr. Geogr. J. 2018, 100, 291–307. [Google Scholar] [CrossRef]
  30. Huete, A.; Didan, K.; Miura, T.; Rodriguez, E.P.; Gao, X.; Ferreira, L.G. Overview of the radiometric and biophysical performance of the MODIS vegetation indices. Remote Sens. Environ. 2002, 83, 195–213. [Google Scholar] [CrossRef]
  31. Shaban Waswa, B. Assessment of Land Degradation Patterns in Western Kenya—Implications for Restoration and Rehabilitation. Doctoral Dissertation, Universitäts-und Landesbibliothek Bonn, Bonn, Germany, 2012. [Google Scholar]
  32. Gichenje, H.; Muñoz-Rojas, J.; Pinto-Correia, T. Opportunities and Limitations for Achieving Land Degradation-Neutrality through the Current Land-Use Policy Framework in Kenya. Land 2019, 8, 115. [Google Scholar] [CrossRef] [Green Version]
  33. Gichenje, H.; Godinho, S. Establishing a land degradation neutrality national baseline through trend analysis of GIMMS NDVI Time-series. L. Degrad. Dev. 2018, 29, 2985–2997. [Google Scholar] [CrossRef]
  34. Ghazanfar, S.A. Saline and alkaline vegetation of NE Africa and the Arabian peninsula: An overview. In Biosaline Agriculture and Salinity Tolerance in Plants; Birkhäuser Basel: Basel, Switzerland, 2007; pp. 101–108. [Google Scholar]
  35. Government of Kenya Vision 2030—Development Strategy for Northern Kenya and Other Arid Lands Final; Republic of Kenya: Nairobi, Kenya, 2012.
  36. Vigna, I.; Bigi, V.; Pezzoli, A.; Besana, A. Comparison and Bias-Correction of Satellite-Derived Precipitation Datasets at Local Level in Northern Kenya. Sustainability 2020, 12, 2896. [Google Scholar] [CrossRef] [Green Version]
  37. Siciliano, G.; Bigi, V.; Vigna, I.; Comino, E.; Rosso, M.; Cristofori, E.; Demarchi, A.; Pezzoli, A. Comparison of Multiple Maximum and Minimum Temperature Datasets at Local Level: The Case Study of North Horr Sub-County, Kenya. Climate 2021, 9, 62. [Google Scholar] [CrossRef]
  38. Orindi, V.A.; Ochieng, A. Kenya Seed Fairs as a Drought Recovery Strategy in Kenya. In Vulnerability, Adaptation and Climate Disasters; IDSBulletin: Brighton, UK, 2005; pp. 87–102. ISBN 5826505826. [Google Scholar]
  39. Karanja, F.; Mutua Nairobi, F. Reducing the Impact of Environmental Emergencies Through Early Warning and Preparedness—The Case of El Niño-Southern Oscillation (ENSO); University of Nairobi: Nairobi, Kenya, 2000. [Google Scholar]
  40. Owiti, Z.; Ogallo, L.A.; Mutemi, J. Linkages between the Indian Ocean Dipole and East African Seasonal Rainfall Anomalies. Available online: https://www.kms.or.ke/all-articles/262-linkages-between-the-indian-ocean-dipole-and-east-african-seasonal-rainfall-anomalies.html (accessed on 10 September 2021).
  41. Kiflie, K.A.; Tao, L. Opposite Effects of ENSO on the Rainfall over the Northern and Equatorial Great Horn of Africa and Possible Causes. Adv. Meteorol. 2020, 2020, 9028523. [Google Scholar] [CrossRef]
  42. Wenhaji Ndomeni, C.; Cattani, E.; Merino, A.; Levizzani, V. An observational study of the variability of East African rainfall with respect to sea surface temperature and soil moisture. Q. J. R. Meteorol. Soc. 2018, 144, 384–404. [Google Scholar] [CrossRef] [Green Version]
  43. Nicholson, S.E. The predictability of rainfall over the greater horn of Africa. Part I: Prediction of seasonal rainfall. J. Hydrometeorol. 2014, 15, 1011–1027. [Google Scholar] [CrossRef]
  44. European Space Agency. SENTINEL-2 User Handbook; European Space Agency: Paris, France, 2013. [Google Scholar]
  45. Gao, L.; Wang, X.; Johnson, B.A.; Tian, Q.; Wang, Y.; Verrelst, J.; Mu, X.; Gu, X. Remote sensing algorithms for estimation of fractional vegetation cover using pure vegetation index values: A review. ISPRS J. Photogramm. Remote Sens. 2020, 159, 364–377. [Google Scholar] [CrossRef]
  46. Xue, J.; Su, B. Significant remote sensing vegetation indices: A review of developments and applications. J. Sens. 2017, 2017, 1353691. [Google Scholar] [CrossRef] [Green Version]
  47. Hersbach, H.; Bell, B.; Berrisford, P.; Biavati, G.; Horányi, A.; Muñoz Sabater, J.; Nicolas, J.; Peubey, C.; Radu, R.; Rozum, I.; et al. ERA5 Monthly Averaged Data on Single Levels from 1979 to Present. Available online: https://cds.climate.copernicus.eu/cdsapp#!/dataset/reanalysis-era5-single-levels-monthly-means?tab=overview (accessed on 18 November 2021).
  48. Meroni, M.; Ng, W.T.; Rembold, F.; Leonardi, U.; Atzberger, C.; Gadain, H.; Shaiye, M. Mapping Prosopis juliflora in West Somaliland with Landsat 8 Satellite Imagery and Ground Information. L. Degrad. Dev. 2017, 28, 494–506. [Google Scholar] [CrossRef]
  49. Wakie, T.T.; Evangelista, P.H.; Jarnevich, C.S.; Laituri, M. Mapping current and potential distribution of non-native prosopis juliflorain the Afar region of Ethiopia. PLoS ONE 2014, 9, e112854. [Google Scholar] [CrossRef]
  50. Barnes, E.M.; Clarke, T.R.; Richards, S.E.; Colaizzi, P.D.; Haberland, J.; Kostrzewski, M.; Waller, P.; Choi, C.; Riley, E.; Thompson, T.; et al. Coincident detection of crop water stress, nitrogen status and canopy density using ground-based multispectral data. In Proceedings of the Fifth International Conference on Precision Agriculture, Bloomington, MN, USA, 16–19 July 2000; Volume 1619, pp. 1–15. [Google Scholar]
  51. Stehman, S.V. Sampling designs for accuracy assessment of land cover. Int. J. Remote Sens. 2009, 30, 5243–5272. [Google Scholar] [CrossRef]
  52. Foody, G.M. Status of land cover classification accuracy assessment. Remote Sens. Environ. 2002, 80, 185–201. [Google Scholar] [CrossRef]
  53. Lewis, H.G.; Brown, M. A generalized confusion matrix for assessing area estimates from remotely sensed data. Int. J. Remote Sens. 2001, 22, 3223–3235. [Google Scholar] [CrossRef]
  54. Bai, Y.; Feng, M.; Jiang, H.; Wang, J.; Liu, Y. Validation of Land Cover Maps in China Using a Sampling-Based Labeling Approach. Remote Sens. 2015, 7, 10589–10606. [Google Scholar] [CrossRef] [Green Version]
  55. Story, M.; Congalton, R.G. Accuracy Assessment: A User’s Perspective. Photogramm. Eng. Remote Sens. 1986, 52, 397–399. [Google Scholar]
  56. Czaplewski, R.L. Chapter 5: Accuracy assessment of maps of forest condition: Statistical design and methodological considerations. In Remote Sensing of Forest Environments; Springer: Boston, MA, USA, 2003; pp. 115–140. [Google Scholar]
  57. Congalton, R.G. A review of assessing the accuracy of classifications of remotely sensed data. Remote Sens. Environ. 1991, 37, 35–46. [Google Scholar] [CrossRef]
  58. Anderson, J.R.; Hardy, E.E.; Roach, J.T.; Witmer, R.E. A Land Use and Land Cover Classification System for Use With Remote Sensor Data; US Government Printing Office: Washington, DC, USA, 1976; Volume 964.
  59. Herrmann, S.M.; Anyamba, A.; Tucker, C.J. Recent trends in vegetation dynamics in the African Sahel and their relationship to climate. Glob. Environ. Chang. 2005, 15, 394–404. [Google Scholar] [CrossRef]
  60. Archibald, S.; Scholes, R.J. Leaf green-up in a semi-arid African savanna-separating tree and grass responses to environmental cues. J. Veg. Sci. 2007, 18, 583–594. [Google Scholar]
  61. Kenya Meteorological Department. The Weather Outlook for the June-July-August (JJA) 2021 Season and the Rainfall Performance during the March-April-May (MAM) 2021 “Long Rains” Season; Kenya Meteorological Department: Nairobi, Kenya, 2021.
  62. Hazard, B.; Adongo, C.; Wario, A.; Ledant, M.; Hazard, B.; Adongo, C.; Wario, A.; Ledant, M. Comprehensive Study of Pastoral Livelihoods, WASH and Natural Resource Managment in Northern Marsabit. Doctoral Dissertation, IFRA, Nairobi, Kenya, 2018. [Google Scholar]
  63. Rogers, P.; Nunan, F.; Fentie, A.A. Reimagining invasions: The social and cultural impacts of Prosopis on pastoralists in southern Afar, Ethiopia. Pastoralism 2017, 7, 1–13. [Google Scholar] [CrossRef] [Green Version]
  64. Shiferaw, W.; Demissew, S.; Bekele, T. Invasive alien plant species in Ethiopia: Ecological impacts on biodiversity a review paper. Int. J. Mol. Biol. 2018, 3, 171–178. [Google Scholar] [CrossRef] [Green Version]
  65. Shiferaw, H.; Schaffner, U.; Bewket, W.; Alamirew, T.; Zeleke, G.; Teketay, D.; Eckert, S. Modelling the current fractional cover of an invasive alien plant and drivers of its invasion in a dryland ecosystem. Sci. Rep. 2019, 9, 1–12. [Google Scholar] [CrossRef] [Green Version]
  66. Sintayehu, D.W.; Dalle, G.; Bobasa, A.F. Impacts of climate change on current and future invasion of Prosopis juliflora in Ethiopia: Environmental and socio-economic implications. Heliyon 2020, 6, e04596. [Google Scholar] [CrossRef] [PubMed]
  67. Maundu, P.; Kibet, S.; Morimoto, Y.; Imbumi, M.; Adeka, R. Impact of prosopis juliflora on kenya’s semi-arid and arid ecosystems and local livelihoods. Biodiversity 2009, 10, 33–50. [Google Scholar] [CrossRef]
  68. Masakha, E.J.; Wegulo, F.N. Impacts of Prosopis Juliflora on Land Use and Ecology of Salabani Location, Marigat District, Baringo County, Kenya. J. Environ. Earth Sci. 2015, 5, 17–23. [Google Scholar]
  69. Mbaabu, P.R.; Ng, W.T.; Schaffner, U.; Gichaba, M.; Olago, D.; Choge, S.; Oriaso, S.; Eckert, S. Spatial evolution of prosopis invasion and its effects on LULC and livelihoods in Baringo, Kenya. Remote Sens. 2019, 11, 1217. [Google Scholar] [CrossRef] [Green Version]
  70. Forestry, M.E. Prosopis Juliflora (Mathenge) and Its Genesis in Kenya. Available online: http://www.environment.go.ke/?p=5344 (accessed on 6 October 2021).
  71. Huho, J.M.; Omar, M.H. Prosopis Juliflora In Asals Of Kenya: A Friend Or A Foe Plant? Int. J. Sci. Res. Publ. 2020, 10, 9968. [Google Scholar] [CrossRef]
  72. IPC. Kenya ASAL—IPC Acute Food Insecurity and Acute Malnutrition Analysis; IPC: Nairobi, Kenya, 2021. [Google Scholar]
  73. County Government of Marsabit. Second County Integrated Development Plan 2018–2022; County Government of Marsabit: Marsabit, Kenya, 2018.
  74. Ouko, E.; Omondi, S.; Mugo, R.; Wahome, A.; Kasera, K.; Nkurunziza, E.; Kiema, J.; Flores, A.; Adams, E.C.; Kuraru, S.; et al. Modeling Invasive Plant Species in Kenya’s Northern Rangelands. Front. Environ. Sci. 2020, 8, 69. [Google Scholar] [CrossRef]
  75. Saha, M.V.; Scanlon, T.M.; Odorico, P.D. Examining the linkage between shrub encroachment and recent greening in water-limited southern Africa. Ecosphere 2015, 6, 1–16. [Google Scholar] [CrossRef] [Green Version]
  76. Herrmann, S.M.; Tappan, G.G. Vegetation impoverishment despite greening: A case study from central Senegal. J. Arid Environ. 2013, 90, 55–66. [Google Scholar] [CrossRef]
  77. Ibrahim, Y.Z.; Balzter, H.; Kaduk, J. Land degradation continues despite greening in the Nigeria-Niger border region. Glob. Ecol. Conserv. 2018, 16, e00505. [Google Scholar] [CrossRef]
  78. Zhang, Z.; Zhang, B.; Zhang, X.; Yang, X.; Shi, Z.; Liu, Y. Grazing altered the pattern of woody plants and shrub encroachment in a temperate savanna ecosystem. Int. J. Environ. Res. Public Health 2019, 16, 330. [Google Scholar] [CrossRef] [Green Version]
  79. Bazgir, M.; Omidipour, R.; Heydari, M.; Zainali, N.; Hamidi, M.; Dey, D.C. Prioritizing woody species for the rehabilitation of arid lands in western Iran based on soil properties and carbon sequestration. J. Arid. Land 2020, 12, 640–652. [Google Scholar] [CrossRef]
  80. Dougill, A.J.; Fraser, E.D.G.; Reed, M. Anticipating Vulnerability to Climate Change in Dryland Pastoral Systems: Using Dynamic Systems Models for the Kalahari. Ecol. Soc. 2010, 15, 17. [Google Scholar] [CrossRef] [Green Version]
  81. Reid, R.S.; Gachimbi, L.N.; Worden, J.; Wangui, E.E.; Mathai, S.; Mugatha, S.M.; Campbell, D.; Maitima, J.M.; Butt, B.; Gichohi, H.; et al. Linkages between Changes in Land Use, Biodiversity and Land Degradation in the Loitokitok Area of Kenya; LUCID: Nairobi, Kenya, 2004. [Google Scholar]
Figure 1. Area of Interest.
Sustainability 13 13554 g001
Figure 2. Climate of the area: total and seasonal precipitation amount (a) and mean temperature variation (b) for the period 1990–2020. Long rain and short rain normal are calculated as seasonal cumulate average (MAM and OND respectively) on the period 1990–2020.
Sustainability 13 13554 g002
Figure 3. Synthetic schema of the methodology applied (ROI: Region Of Interest).
Sustainability 13 13554 g003
Figure 4. Schema of the creation process of the annual multi-temporal images, from original Sentinel-2 images to the final composite indices images. The process represented refers to one year of analysis and is therefore replicated for each year.
Sustainability 13 13554 g004
Figure 5. Map of the ROIs of dense vegetation elaborated from the field survey.
Sustainability 13 13554 g005
Figure 6. Results of the MD supervised classification for the multi-temporal NDVI and NDRE images. For each index, changes over time of the perennial vegetate areas are visible.
Sustainability 13 13554 g006
Figure 7. Results of the MD supervised classification for the multi-temporal CCCI and of the SAM supervised classification for the NNC images. Reading the figure vertically, changes over time of the perennial vegetate areas are visible.
Sustainability 13 13554 g007
Figure 8. Map of modal aggregation i.e., the area classified as perennial vegetation in at least 3 of the 4 classification cases, for each year. The surfaces are superimposed, going from the most recent to the least recent.
Sustainability 13 13554 g008
Figure 9. Historical variation of the surface classified as perennial vegetation for each index and for the combination of the three indices.
Sustainability 13 13554 g009
Table 1. Description of the Sentinel-2 images dataset used for the analysis.
First Dry SeasonLong Rains SeasonSecond Dry SeasonShort Rains Season
201614 February14 May21 September10 December
201728 February19 May27 August20 November
201813 February4 May22 August25 December
201930 March9 May27 August20 December
20208 April13 May31 August24 November
Table 2. Results of the validation process carried out on 250 random points in the AOI for the year 2019. For the modal aggregation map, the pixel classified as densely vegetated for at least 3 indices were considered.
ParametersNDVINDRECCCINNCModal
Aggregation
Overall accuracy0.950.930.900.940.94
Producer’s accuracy (densely vegetated)0.920.840.770.880.85
User’s accuracy (densely vegetated)0.910.930.880.920.94
Producer’s accuracy (not densely vegetated)0.960.970.950.970.98
User’s accuracy (not densely vegetated)0.970.930.910.950.94
Kappa coefficient0.950.820.750.860.85
Publisher’s Note: MDPI stays neutral with regard to jurisdictional claims in published maps and institutional affiliations.

