Abstract
The rapidly growing output of solid waste has brought tremendous pressure to urban development. China launched an action plan known as “Zero-waste city” (ZWC), that refers to an urban development model aimed at reducing the generation of and enhancing the recycling of solid waste, in order to alleviate environmental impacts. Eleven cities and five special zones achieved positive results of solid waste management were selected as pilot areas for exploring empirical methods until 2019. The practices and lessons of the pilot cities need to be deeply analyzed and summarized, so as to promote successful models, learn lessons and better implement the policy comprehensively for other cities. This study presents a review of China’s ZWC policies and practices with constructive suggestions for further development. Based on the policy objective of ZWC and the field investigation of solid waste flow, five crucial approaches to developing ZWC are proposed, namely, solid waste reduction throughout the industrial chain, collaborative treatment of classified municipal solid waste (MSW), efficient utilization of agricultural waste with multiple purposes, safety control of hazardous waste flow, and optimization of market mechanisms. The case study demonstrates that the five paths are appropriate to Xuzhou city. However, deficiencies in MSW classification, pesticide packaging waste collection systems, solid waste product application, management, and policymaking, have emerged. Regulatory prohibitions, extended producer responsibility and market vitality should be adopted to improve the collection, transportation, and utilization of solid waste. Key findings from this research are to summarize crucial paths toward fulfiling ZWC goal, and to reveal some successful practices of, and lessons from ZWC construction by case studies. This study provides a method to further implement zero solid waste management in a targeted manner. The recommendations drawn from the study, which include law, market and institutional measures, may contribute to the achievement of developing sustainable cities.
1. Introduction
The acceleration of urbanization and industrialization have led to a sharp increase in solid waste output. Many urban areas in China are facing severe problems in managing thousands of tons of solid waste per day. Effectively dealing with solid waste has become a major challenge that must be solved in urban development. The State Council of the People’s Republic of China issued the work plan of the “Zero-waste City” Pilot Program in China” in 2019. It proposed the concept of a zero-waste city which refers to an urban development model aimed at reducing the generation of, and promoting the recycling of, solid waste, reducing landfill, and minimizing the environmental impact of solid waste by promoting green development and green lifestyles.
At present, there is no universal definition of the concept of ZWC [,,]. Zaman and Lehmann conceptualized ZWC as entailing a 100% rate of recycling and recovery of all resources from waste materials []. The idea of ZWC is similar to that of circular economy (CE). Both propose that the resources extracted and produced be kept in a cyclical flow [,,,,,]. The close-cycle material flow based on nature’s no-waste principles is applied in the zero-waste system, which also promotes circular economy [,]. These concepts promote the adoption of closing-the-loop production patterns to increase the efficiency of resource use and reduce landfill of solid waste, to achieve a better balance and harmony between economy, environment and society [,,,,,,,]. Circular economy practices were examined widely in developed countries in North America, Europe [,,,], and East Asia []. For instance, Japan started to build a recycling society in 2000, The European Commission launched “Towards a circular economy: A zero waste program for Europe” in 2014, and Singapore put forward its national vision of zero waste in 2015. In fact, developed countries regard CE as a specific and key measure to achieve the goal of zero waste.
In fact, CE practices have also been promoted in China since 2005. By 2016, 61 CEs have been established, led by National Development and Reform Commission (NDRC), and which focused on resource utilization. CE practices in China, which start from cleaner production in enterprises and eco-industrial development in a top-down way, take a different road from Germany and Japan and other countries, whose CE originated in the field of waste disposal and reuse [,,,,]. On the other hand, ZWC is led by the Ministry of Ecology and Environment (MEE), and focuses on minimizing the environmental impact of solid waste, which is different from the CE program with “resource efficiency” as the core principle. Thus, the ZWC program is the inheritance and development of CE, and casts a wider net to include these significant aspects of China’s economic and social development.
Although a few developed countries have made some progress in ZWCs construction, this concept has not been widely promoted globally, mainly owing to the differences among nations in terms of social and economic development, which determine the types of solid wastes included in ZWCs and the measures adopted. Solid waste management in developing countries represents a real environmental and social concern, since open dump sites or unsuitable sanitary landfills become the main final disposal method due to a lack of technical means and financial input [,,,,]. Compared with those of cities in developed countries, China’s ZWC work plan is more comprehensive and includes solid waste from social, agricultural, and industrial sources. Developed countries or regions already have relatively mature solid waste management systems. China needs to take a holistic approach to promote waste management and sustainable economic and social development, which is a priority for other developing countries too as they implement more stringent waste management strategies. China’s practice and experience can provide a useful reference to developing countries to carry out sustainable urban waste management and offer strong impetus to the sustainable development of global waste management. In May 2019, MEE published a list of 11 + 5 pilot cities and introduced the ZWC index system on a trial basis. In September 2019, the implementation plan of each pilot city was announced.
The zero-waste program and studies have not yet been documented in a large number of countries around the globe, and the experiences of all jurisdictions that implement zero-waste programs are important and necessary to consider when developing zero-waste strategies in a new place [,]. More empirical studies about ZW implementation are necessary [,,].
Using systematic policy collection, case studies and solid waste flow analysis, this paper reviews the policy of Chinese ZWC and the basic situation of pilot cities for the first time, and conducts an in-depth scientific investigation into the solid waste flow of Xuzhou, as well as conducting a comprehensive analyzation of solid waste performance by an empirical case study. The paper proposes a ZWC development path with Chinese characteristics, on the basis of the objectives of solid waste minimization in landfill and the actual solid waste flow. In addition, this paper also aims to distil the experience of China and lessons learned thus far in ZWC development. Finally, an outlook of the policies to best support future ZWC development is proposed and discussed.
2. ZWC Policies and Pilot City Conditions
2.1. ZWC Policy Framework of China
According to Chinese government documents, a “1-1-4-1” action plan, shown in Figure 1, was proposed to realize the objective of building a ZWC. The name of the plan refers to a set of ZWC indicators, a group of backbone solid waste recycling enterprises, four systems, i.e., institutions, technology, markets, and supervision listed in Table 1, and several ZWC models, which are replicable and applicable []. The index system of ZWC construction (trial) was issued by MEE, including 5 first-level indicators, 18 second-level indicators and 59 third-level indicators, listed in Appendix A.
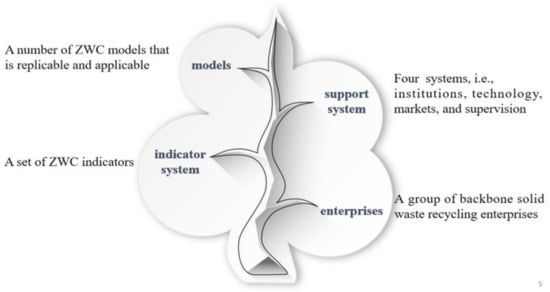
Figure 1.
The main objective content of ZWC action plan.

Table 1.
Support systems for ZWC policy.
Four principles should be strictly complied with in the implementation of the ZWC plan. (1) Solve prominent problems, such as large production, poor utilization, illegal transfer and dumping, and difficulties in disposal of solid waste. (2) Identify the weak points and key links in the production, collection, transfer, utilization, and disposal of major solid waste. (3) Integrate empirical approaches and techniques to manage solid waste in a pilot demonstration. (4) Promote simple, moderate, green, low-carbon, civilized, and healthy lifestyles and consumption patterns. The concept of ZWC does not imply that the city generates no waste at all, nor does it mean that solid waste can be fully utilized. Instead, it is a long-term exploration and practice aimed at minimizing the generation, maximizing recycling, and disposing of solid waste in the administrative region of a city.
2.2. Conditions of Pilot Cities
The pilot cities were recommended by the relevant provincial departments and determined by MEE in conjunction with the relevant national departments. The procedures and steps to build ZWC are illustrated in Figure 2. The selected pilot cities were required to compile the implementation plan for the construction of ZWCs, determine pilot objectives and task lists, divide tasks and allocate them to various departments, and define the detailed work to be accomplished within each time period. MEE set up an expert committee on ZWC to review the implementation plan of each pilot city, and the approved plans were printed and implemented. MEE selected 11 pilot cities, listed in Table 2. In addition, the Xiongan New Area Hebei, Beijing Economic and Technological Development Zone, Sino-Singapore Eco-City, Guangze county in Fujian province, and Ruijin city in Jiangxi province were selected as special regions to be promoted in the context of ZWC construction. Pilot cities and regions proceeded with construction tasks in accordance with the approved implementation plans.
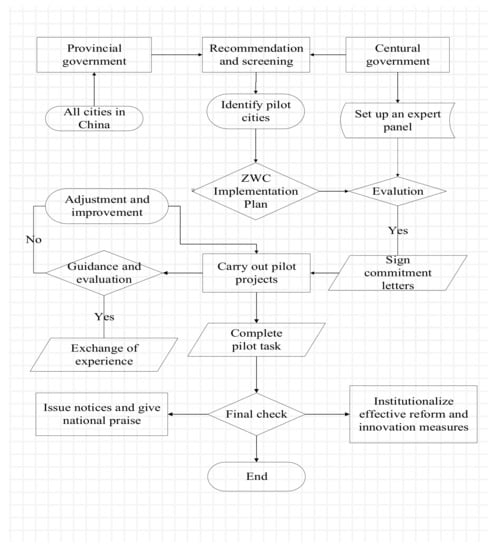
Figure 2.
Procedures for planning, implementing and evaluating ZWC.
Table 2.
The basic information of 11 pilot cities in 2018.
The distribution of the 11 + 5 pilot cities and regions selected is shown in Figure 3. Two factors were considered in the selection of pilot cities. First, representative cities playing a dominant role in national strategic initiatives, such as Beijing–Tianjin–Hebei integration, Yangtze Economic Belt, and Guangdong–Hong Kong–Macao Greater Bay Area, were selected. Second, considering the industrial characteristics of different areas in the eastern and western regions, as well as the enthusiasm of the local governments, cities which had implemented or were implementing various types of solid waste recycling pilot projects and had achieved positive results were selected preferentially. The selection of pilot regions is to explore the construction modes of zero waste in different regions, such as economic development zone, new development zone and county-level city, so as to promote the implementation of a national solid waste management strategy and better serve the national major development strategy.
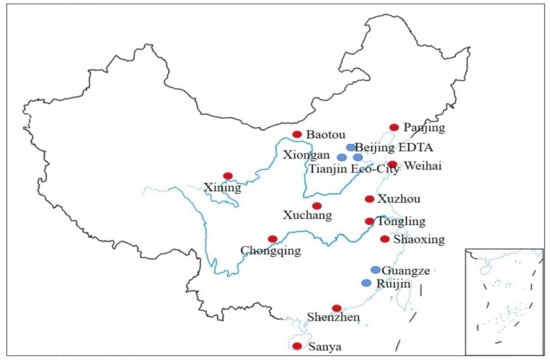
Figure 3.
Location of the 11 pilot cities and 5 special areas.
In fact, the pilot cities have different spatial and objective representativeness. First, they are distributed in different regions. Among the 11 cities, 4 are in the east, which is the highest number of pilot cities in any given region. The main reason is that they are located in the economically developed area of the Yangtze Economic Delta, which possesses a good solid waste management foundation. Other cities are more evenly distributed across different regions: two each in the south, west, and north, and one city in the middle. Of the five pilot areas, the Xiongan New Area Hebei, Beijing Economic and Technological Development Zone, and Sino-Singapore Eco-City are located in the Beijing–Tianjin–Hebei integration strategic region.
Household income, population density, and degree of urbanization have often been found to be correlated with the amount and type of solid waste production [,,,]. Sanya has the smallest population of 615,000, while Chongqing and Shenzhen are two very big cities with a population of more than 10 million each. Most of the other cities have a population of 1~5 million. There are significant differences among the cities in terms of their levels of economic development. Xining has the lowest per capita income of CNY 52,200, which is lower than China’s per capita income of CNY 64,600. Shenzhen has the highest per capita income of CNY 189,500, which is comparable with that of developed countries. The urbanization rates of the permanent population of the pilot cities also varies significantly, from 99.7% in Shenzhen to 52.6% in Xuchang.
Furthermore, the solid waste management capacities of the pilot cities are evidently different. According to the goal of near-zero landfill in ZWCs, MSW treatment in some cities is far from the target, such as 100% landfill treatment in Xining and Baotou. However, in Chongqing, all MSW is incinerated and the landfill volume is zero. A combination of landfill and incineration was adopted in most pilot cities, with landfill rates in the range 31~64%.
3. Critical Path to ZWC and Case Study of Xuzhou City
With a population of 8.76 million and an urbanization rate of 65.1%, Xuzhou has a GDP of CNY 675.5 billion and a per capita income of CNY 76,915, both of which are the median values of the 11 pilot cities. Entrusted by the Xuzhou municipal government, our team participated in the formulation of “Implementation plan of ZWC construction in Xuzhou”. The plan has been issued by Xuzhou municipal government after being reviewed and approved by MEE experts. A thorough field investigation in several districts of Xuzhou was conducted to assess solid waste flows of life cycle process, shown in Figure 4, and index value of solid waste [], listed in Table 3. The spatial boundary is the geographical area corresponding to Xuzhou City and its ten municipal districts, and the temporal boundary is the year 2018, when the local authority provided the first substantial dataset on the city’s solid waste system. These data are assumed to be sufficiently accurate and typical to ensure acceptable and indicative material flow analysis results. The target material is all solid waste, including industrial solid waste, MSW, agricultural solid waste, and hazardous waste. The three main subsystems/processes are solid waste generation, solid waste collection, and solid waste treatment as well as final disposal. The data were collected from the municipal authority of Xuzhou and from relevant studies and reports on Xuzhou City.
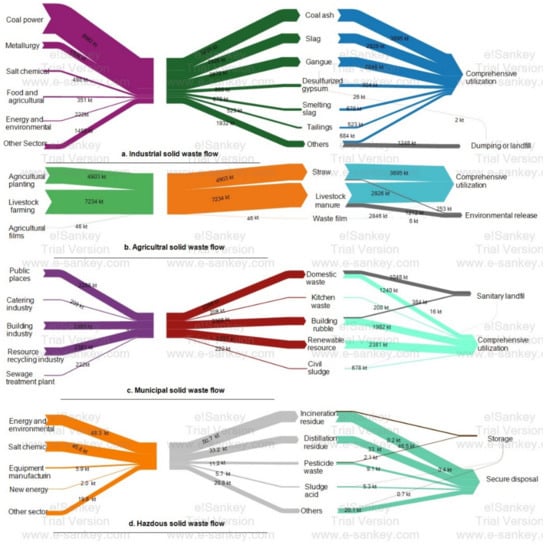
Figure 4.
Solid waste streams in Xuzhou.
Table 3.
Evaluation indexes of solid waste and Xuzhou values.
Based on the national policy objectives and solid waste flow of Xuzhou, as well as the actual recovery and utilization rate of solid waste and the amount of landfill, five key paths of developing ZWCs are deduced and proposed creatively: solid waste reduction throughout the entire industrial chain, classification and collaborative treatment of MSW, full multiway utilization of agricultural waste, comprehensive safety control of hazardous waste flow, and optimization of institutional and market mechanisms. After the implementation of the five major paths in Xuzhou, the indicator values of solid waste management performance in 2018 and 2020, listed in Table 3, changed significantly. Moreover, a comparison of solid waste management efficiency between Kunming city and Xuzhou city, which have a similar population and economic scale, have been introduced. In 2020, the populations of Xuzhou and Kunming were 9.08 million and 8.46 million, respectively, and the Gross Domestic Products were CNY 731.9 billion and CNY 673.3 billion, respectively. Kunming has not carried out zero-waste city construction, nor implemented the corresponding paths proposed in this paper. The solid waste management index values of Kunming city are introduced in each path.
3.1. Solid Waste Reduction throughout Entire Industrial Chain
Waste reduction along the industrial chain is aimed at promoting zero growth in the total storage and disposal of large-scale industrial solid waste (ISW) through the incorporation of waste-reduction technology in all the links of the industrial chain. To achieve this goal, filling technologies will be adopted in mineral industries, and solid waste will be promoted in the mining industry to produce construction materials or address subsidence areas. Second, green design and green supply-chain management will be vigorously promoted to improve product detachability and recyclability. Third, categories of technical standards will be formulated for industrial byproducts and comprehensive utilization products, with a focus on tailings, coal gangue, fly ash, smelting slag, industrial byproduct gypsum, etc., to promote the utilization of large-scale ISW as resources.
The data of eight indicators for evaluating the ISW management performance are listed in Table 3, and material flow of industrial solid waste is shown in Figure 4. The dominating industries in Xuzhou were power plants and coal mining. Correspondingly, fly ash, slag and coal gangue accounted for 27.2%, 21.6% and 21.2% of the total solid wastes, respectively. Therefore, it is necessary to implement waste reduction in the whole-process industrial chain in power plants and coal mining, so as to better reduce the generation of solid waste.
Waste reduction of the industrial chain in coal mining is shown Figure 5. The closure of technologically backward coal mining enterprises has reduced the number of mines from more than 300 to 7. Green mine management has been implemented in all these seven mines to reduce the production of coal gangue and tailings. The steel, cement, coking coal, and thermal power industries have eliminated backward production capacities; steel and coking coal outputs have decreased by 30% and 50%, respectively. By 2018, 71% of the enterprises had implemented cleaner production, and six industrial parks had completed industrial park recycling transformation similar to ecoindustrial park construction [], shown in Figure 5. A material flow analysis of core enterprises and industries such as iron and steel, coking, and the cement industry, which consume the most resources and produce the most waste, should be conducted in order to find production chain extension and industrial symbiosis opportunities, for example, waste heat recovery and utilization in the coking industry, cooperative disposal of solid waste in the cement industry, high-end building materials for solid waste utilization, and central heating in the thermoelectric industry. The relevant projects have been implemented to ultimately reduce coal consumption and improve energy and mineral resource efficiency; ISW was reduced by approximately 4.7 million tons from 2017 to 2020 (Table 2). Solid waste multichannel resource utilization is encouraged, such as the use of coal gangue to produce mortar ceramic granules and other building materials, as is collaborative disposal of industrial sludge. The comprehensive utilization rate of general industrial solid waste of Xuzhou city reached 98% in 2020, an increase of 8% over 2018, far exceeding China’s average of 41.7% and Kunming city’s average of 27.9%, which indicated a reduction in environmental pollution from landfills and better living conditions for urban citizens.
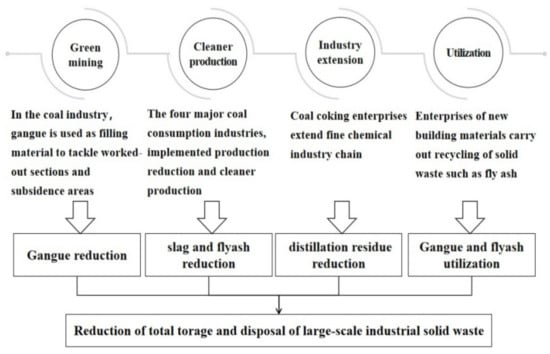
Figure 5.
Solid waste reduction of the whole industrial chain in Xuzhou.
3.2. Source Classification and Collaborative Utilization of MSW
Improper management of MSW through open burning, open dumping, and unsanitary landfilling contributes to many environmental problems, such as global warming, ozone depletion, human health hazards, ecosystem damages, and abiotic resource depletion [,,]. As the world’s largest MSW generator, China generated around 242.062 million tons of MSW in 2019, up 6.16% year on year. China is deeply troubled by the “garbage Siege”, lacking in inadequate collection, classification, and disposal systems for MSW. The generated waste is not fully collected in some urban and rural joint areas, due to the limited collecting ability of the related government department. Therefore, source classification and collaborative utilization of MSW has been proposed to ensure that MSW is strictly classified and all kinds of waste are utilized in a coordinated manner to improve the utilization rate of waste resources and reduce environmental pollution. In addition, water separation relied on the buoyant and the sink force of water, and mechanical separation relied on size sorting and mechanical rules are adopted to supplement mixed MSW classification.
The indicator data in Table 3 and material flow in Figure 4 are taken to evaluate the performance of MSW management. It can be seen that construction waste, renewable waste and household waste account for more than 94% of MSW in Xuzhou. The total amount of renewable waste was 2.381 million tons, all of which were recycled. Construction waste totaled 2.36 million tons, 83.8% of which was reused as building materials. More than 1.048 million tons of domestic garbage was disposed of by landfills, and the rest was incinerated, accounting for 52.8% of the total. Xuzhou is constantly exploring MSW source classification and collaborative utilization in practice, as shown in Figure 6.
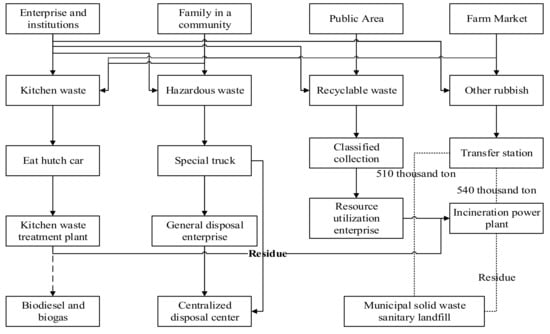
Figure 6.
Classification and collaborative utilization of municipal solid waste in Xuzhou.
About 21% of the communities built a classification system in which MSW is divided into kitchen waste, hazardous waste, reclaimable waste, and other garbage (Figure 6). The recycling of reclaimable waste and kitchen waste is growing rapidly. The daily volume of MSW generated was 8400 tons in 2018, including 1700 tons of recyclables and 400 tons of kitchen waste. Hence, the recycling rate of MSW is 25%. The MSW collaborative utilization project has been established. Recyclable wastes, such as plastic bottles and paper, are transformed into new products by resource utilization enterprises, while material waste and sewage sludge are transported to incineration plants to generate electricity. Kitchen waste is fermented to produce biomass fuel and natural gas, and biogas residue is transported to incineration plants to generate electricity. Other domestic waste is transported to incineration power plants and landfills. The slag generated by power plants is used to produce building materials, and the fly ash finally enters the landfill. The landfill site was equipped with a biogas power-generation project. The biogas generated by the landfill is collected by the gas well, purified and dedusted, and sent to the internal combustion generator to generate electricity. Therefore, the incineration rate of MSW in Xuzhou increased from less than 45% in 2018 to 100% by the end of 2020, realizing zero landfill of domestic waste. Kunming city, by contrast, only started classified collection in 2020, and its incineration rate is only 35%, much lower than Xuzhou’s.
3.3. Multichannel Resource Utilization of Agricultural Waste
The improper disposal of agricultural waste leads to the generation of large quantities of N2O, SO2, CH4, and smoke, and the deterioration of soil and water at the regional scale [,,,,]. Therefore, the importance of establishing an alternative method to improve the environmental conditions cannot be neglected. The concept of multichannel resource utilization of agricultural waste entails the adoption of various green agricultural technologies, such as cyclic development mechanisms for planting and breeding, and energy utilization, to realize the full utilization of agricultural waste.
Nine indicator dates listed in Table 3 and agricultural waste flow in Figure 4 are used to assess agricultural waste management. Xuzhou city had initially established an agricultural waste utilization model, shown in Figure 7. In 2018, approximately 2.24 million tons of manure from non-large-scale farmers were composted in nearby fields for fertilizer production. A total of 2.688 million tons of biomass energy and organic fertilizers were produced from large-scale livestock and poultry manure, with a comprehensive utilization rate of 83.25%. Most of the straw, approximately 3.29 million tons, was returned to the fields onsite. The remainder was used to produce 620,000 tons of fuel, 330,000 tons of fodder, 240,000 tons of fertilizer, 140,000 tons of base material, and 80,000 tons of raw materials. The comprehensive utilization rate of straw reached 94.86%, far exceeding China’s 2020 target of 85% as determined by the action plan to address agricultural and rural pollution control []. Agricultural film was recycled to produce plastic particles, and the recovery rate reached 75.8%. The coverage ratio of agricultural waste collection, storage and transportation systems and the comprehensive utilization rate of livestock and poultry manure in 2020 reached 98% and 95.6%, respectively, 15% and 12.3% higher than 2018. The government of Yunnan Province and Kunming city started the resource utilization of poultry breeding waste in December 2017, adopting a similar path proposed in this paper, i.e., multichannel resource utilization, which achieved remarkable results similarly to Xuzhou, with the resource utilization rate reaching 94%.
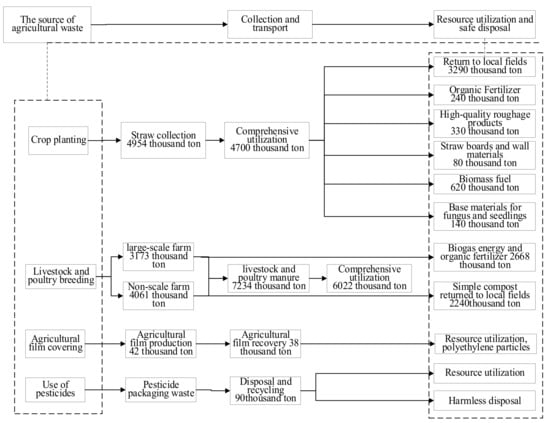
Figure 7.
Multichannel utilization of agricultural waste in Xuzhou.
3.4. Comprehensive Safety Control of Hazardous Waste Flow
A comprehensive safety control of hazardous waste flow is proposed, i.e., the entire process of generation, storage, transfer, utilization, and disposal of hazardous waste is strictly managed to ensure safe disposal of waste. First, new construction projects entailing hazardous waste generation should strictly implement management requirements, such as environmental impact assessment guidelines for hazardous waste in construction projects, clarify management targets and pollution sources, prevent secondary pollution, and control environmental risks. Second, assessment requirements for the standardized management of hazardous waste should be strictly implemented to strengthen ongoing- and post-supervision, and control of the generation, recycling, transfer, storage, and disposal of hazardous waste. Third, the requirements for controlling secondary pollution in the process of hazardous waste disposal and protecting the environment during resource utilization should be clarified, and the limits of toxic and hazardous substances in resource utilization products should be specified to promote the safe use of hazardous waste.
It can be seen from Table 3 and Figure 4 that the hazardous wastes in Xuzhou mainly come from the energy environment and the salt chemical industry, and the incineration residue and rectification residue generated account for 77.2% of the total amount of hazardous wastes. The total amount of hazardous waste produced in 2018 was about 121,700 tons, and the incineration and landfill disposal capacity of hazardous waste is about 459,500 tons, far exceeding the amount of hazardous waste produced. Therefore, the focus of hazardous waste management is to ensure that hazardous waste is collected and disposed of.
Xuzhou has established a supervision system for the generation, storage, transfer, utilization, and disposal of hazardous waste, which is shown in Figure 8. The enterprises concerned use loadometers to regularly weigh the hazardous waste produced and attach a distinguishing mark and electronic labels to the packaging containers to identify the type and production volume. The combined hazardous waste transfer form and electronic tag scanning code are supplied to the transportation vehicles, which are equipped with global positioning systems and on-board videos for positioning and monitoring. The hazardous waste disposal enterprise, which obtains its license only after its disposal technology meets the standards as verified by the environmental protection department, checks the waste information of the transportation vehicles through electronic tag scanning, video monitoring, and license plate recognition systems to ensure that the hazardous waste indeed originated from the enterprise specified and is finally disposed of safely. In 2020, the safe disposal ratio of hazardous waste and coverage ratio of medical waste collection and disposal system was 100%, and the pass rate for standardized management of hazardous waste was 97.3%, which indicates little illegal diversion or dumping of hazardous waste. Similarly, Kunming has adopted a strict hazardous waste management strategy since December 2019, that is, control of the whole process of hazardous waste generation, transfer and disposal has been implemented, and the utilization rate of industrial hazardous waste disposal reached 94.4%.
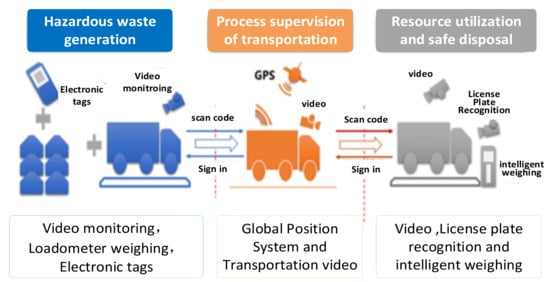
Figure 8.
Comprehensive safety control of hazardous waste flows in Xuzhou.
3.5. Optimization of Institutional and Market Mechanisms
Optimization of institutional and market mechanisms refers to the solving of the problems of decentralization of solid waste management functions and lack of market vitality based on regulations or policies. A list of responsibilities for the relevant departments should be established to clarify further their responsibilities and boundaries pertaining to the generation, collection, transfer, recycling, and disposal of solid waste, to enhance their regulatory capacities. The solid waste generation, recycling, and disposal enterprises should be included in the scope of corporate environmental credit evaluation, and cross-department joint punishment should be implemented according to the evaluation results. A few practices pertaining to market mechanism are being followed in Xuzhou, and the relevant indicator data for 2018 are listed in Table 4.
Table 4.
Indicators for support system and Xuzhou index value.
Measures for the collection and management of fees for the treatment of MSW have been introduced. Stipulating that units and individuals must pay a fee for the treatment of MSW reduces government subsidy funds and is beneficial to sustainable MSW treatment. Approximately 59% of the enterprises producing, utilizing, and disposing solid waste in 2018 and 71% in 2020 have been included in the scope of enterprise environmental credit evaluation. The environmental behavior of these enterprises in the previous year are evaluated and the results are divided into five grades: green, blue, yellow, red, and black. The different grades merit different treatments in terms of financial support, such as tax incentives and different water and electricity prices. For instance, enterprises in the red and black grades incur additional electricity charges of USD 0.05/kWh and USD 0.1/kWh, respectively. Therefore, this will render costs prohibitive for these companies and indirectly affect the economic behavior of local businesses.
4. Discussion and Suggestions
After more than two years of ZWC pilot work, the pilot cities and regions have formulated high-level implementation plans and achieved phased results, with a total of more than 900 tasks and more than 500 projects, involving an investment of CNY 124.4 billion. Remarkable achievements have been made in Xuzhou city, such as a 10.2% decrease in the intensity of ISW generation, an effective increase in resource utilization rate of various solid waste, and a significant decrease in the amount of landfill. There remains scope for improvement, particularly in the application of ISW resource products, compulsory classification of MSW, collection of agricultural packaging waste, and recycling and treatment of domestic hazardous waste, such as lead-acid batteries and power batteries. In this section, we discuss the urgent need to develop targeted policies in this field and the role of local governments in advocating relevant regulations to expand the construction scale of ZWC.
4.1. Regulations and Bans on Solid Waste Should Be Further Improved
Regulations and bans are among the crucial methods for accomplishing ZWC. For instance, Capannori in Italy and Sydney in Australia have different regulations for different solid wastes. The classification of MSW is compulsory, production and usage of plastic bags are prohibited, and the use of degradable plastic bags is mandatory. Currently, in China there are no regulations pertaining to the recycling of agricultural films and pesticide packaging waste as well as the classification of MSW. Law of the People’s Republic of China on the Prevention and Control of Environmental Pollution by Solid Waste, as the basic law of solid waste management, has no provisions on agricultural waste management. Only administrative measures, such as documentation and special action plans, are enforced by the pilot cities. Hence, lack of enforcement hinders the sustainable and efficient development of ZWCs. Therefore, regulations pertaining to the prevention and control of environmental pollution by solid waste should be formulated as soon as possible to make them basic guidelines for promoting ZWC. The use of livestock and poultry manure in combined planting with breeding, recycling of agricultural films and pesticide packaging waste, and classification of MSW should be stipulated, and individuals or enterprises violating these rules should be fined.
Regulations of Xuzhou MSW management were implemented in December 2020, stipulating the implementation of the MSW classification system and the obligations of producers. In accordance with the requirements of the prescribed place, time, and classification standards, individuals and enterprises are required to separate MSW into designated garbage containers or collection places, failing which they will be subject to legal sanctions and fines. However, lacking regulations on agricultural films and pesticide packaging waste will restrict the further development of agricultural solid waste in Xuzhou.
4.2. Shift the Development Model from Government-Led to Government and Market Co-Led
Projects on MSW are mainly promoted by the Chinese local governments, which play a key role in planning, guiding, and promoting the construction of solid waste infrastructure. However, owing to the complexity of solid waste collection, transportation, and treatment, stimulating the vitality of market entities is conducive to effective management. The San Francisco municipal government outsourced the placement of garbage cans and MSW collection and disposal, including recycling via incineration and landfill usage, to a professional waste treatment company, and the two entities worked together to develop the city’s waste management plan. Conversely, the government-led model is applied to the collection and disposal of MSW in many cities in China with more effort being expended on infrastructure construction, which leads to lower efficiency and higher processing costs of MSW treatment. Increasing effort should be made to attract participation from enterprises and/or social capital, and to stimulate market vitality. For instance, construction projects and solid waste collection, recycling, and disposal facilities should be promoted with the cooperation of third-party governance or public–private partnerships (PPPs), to achieve effective solid waste management and sharing of risks and profits using social capital.
The PPP model in the fields of MSW collection and treatment is being explored by the Xuzhou municipal government. For instance, the second MSW incineration power plant project, which began in July 2019, has adopted the build–operate–transfer operation mode in PPP. The project company, established with a 30% investment from the municipal government and 70% investment from social capital, is responsible for the financing, investment, construction, and operation of the MSW incineration power plant, and is forecast to obtain reasonable return on investment through the feasibility gap subsidy and power generation income. Upon the end of the 28-year period of cooperation, the project company will transfer all the assets of the project to the local government in good condition, whereas the classification and collection of MSW in Xuzhou is still driven by administrative means and the lack of market participation, leading to low efficiency and difficulty in sustainability.
4.3. Extended Producer Responsibility Should Be Diffusely Implemented
Extended producer responsibility (EPR) refers to a system in which the resource and environmental responsibility of producers for their products extends from the production process to the full life cycle of recycling and waste disposal [,,]. The EPR system can not only promote waste recycling significantly but also encourage enterprises to choose or produce products with little impact on the environment at the source [,]. In early 2006, the provincial government of British Columbia passed an EPR regulation for selected electronics. In August 2007, Vancouver City utilized this EPR program to recycle outdated electronics, such as desktop computers, desktop servers, portable computers, and televisions. Since then, the city has expanded the application scope and fields of EPR. In 2017, a few manufacturing enterprises in various industries, such as printing paper and packaging, textile carpets, furniture, and construction and demolition materials, were added to the implementation scope of the EPR program.
Early regulations in China [,,,] only embodied the concept of EPR without including strong operability []. The Administrative Measure on Tax Levy and Use for E-waste Recycling was implemented on 1 July 2012, and directed that China begin to put EPR into effect. The EPR program for electrical and electronic products achieved significant progress, with a recovery rate of approximately 86.2% for these materials in 2014 []. If the EPR system had not been implemented in the field of electronic products in 2012, based on the annual average recycling rate of less than 20% from 2005 to 2010, and the recycling rate of 28.13% in 2012, then the recovery rate in 2014 would be more than 50%, which is much lower than the actual value of 86.2%. The EPR system had an obvious effect on guiding the recycling and disposal of waste electronic products. The EPR system has not been promoted by Xuzhou and numerous other Chinese cities in most solid waste fields, barring that of electronic waste as stipulated by the central government. Furthermore, many products are sourced from other cities, and the relevant producers are not regulated by the local governments. Therefore, the use of the EPR system in more fields, such as lead-acid batteries, electrical appliances, electronic products, and automobiles, should be promoted at the provincial or national levels [,,].
5. Conclusions
The review of China’s ZWC policy and a survey of 11 pilot cities and 5 pilot special areas show significant differences among the cities in terms of population, urbanization, economic development, and status of solid waste disposal and utilization. In this study, we attempted to propose five approaches for China toward ZWC construction, and revealed some successful practices of China’s ZWC management using the case of Xuzhou city as an example. We presented some critical discussion on the current solid waste management situation and recommended management measures for further development of ZWC practices. Regulations and bans should be formulated to clarify legal responsibilities pertaining to the source classification of MSW and recovery of agricultural packaging waste. The EPR system should be implemented in more fields, such as lead-acid batteries, power batteries, and automobiles. Moreover, the participation of enterprises and social capital should be encouraged in the collection, transportation, utilization, and disposal of solid waste by adopting professional third-party governance or PPPs to enhance the effectiveness of solid waste management. Further study is suggested to explore how to assess the effectiveness of ZWC policy and uncover the best assessment tools or means.
This study revealed that the ZWC concept in China is being applied widely in different phases of production, and diverse solid waste management systems. Although the study focused on Xuzhou, it can be argued that the findings can be of use in any other Chinese city, and even in other emerging countries. Based on an empirical case study, this study concludes that cities may be able to achieve the goal of minimizing the environmental impact of solid waste by developing a national or regional zero-waste strategy and by integrating and promoting zero-waste initiatives (in society, agriculture, and industry) into their waste-management policies. The findings of the study assist to provide a method to further implement zero-solid-waste management in a targeted manner for researchers, and help to identify ZWC strategies and guidelines for policymakers.
Author Contributions
Conceptualization, M.M., Z.W. and W.L; methodology, Z.W. and M.M.; analysis, M.M.; investigation, M.M.; writing—original draft preparation, M.M.; writing—review and editing, M.M., Z.W., W.L. and S.W. All authors have read and agreed to the published version of the manuscript version of the manuscript.
Funding
This research was funded by the National Natural Science Foundation of China (NO. 71774099), Chinese Academy of Sciences(NO. XDB40020100), National Natural Science Foundation of China(NO. 41673121), and Volvo Group in a research project of the Research Center for Green Economy and Sustainable Development, Tsinghua University.
Institutional Review Board Statement
Not applicable.
Informed Consent Statement
Informed consent was obtained from all subjects involved in the study.
Data Availability Statement
Data was obtained from the local authorities involved in the study and are available from the authors with the permission of the respective local authorities.
Acknowledgments
The authors would like to thank the editors and referees for their valuable comments and suggestions to help improve this paper.
Conflicts of Interest
The authors declare no conflict of interest.
Appendix A
Table A1.
ZWC Construction Index System (Trial).
Table A1.
ZWC Construction Index System (Trial).
| No | Level 1 Indicators | Level 2 Indicators | Level 3 Indicators | Units | Data Sources |
|---|---|---|---|---|---|
| 1 | Source reduction of solid waste | Industrial source reduction | Intensity of ISW generation | ton/CNY 10,000 | Bureau of Ecology and Environment, Bureau of Statistics |
| 2 | Proportion of industrial enterprises with cleaner production | % | Bureau of Ecology and Environment, Development and Reform Commission | ||
| 3 | Number of green factories | pcs | Bureau of Industry Information | ||
| 4 | Number of ecoindustrial parks | pcs | Bureau of Ecology and Environment, Development and Reform Commission | ||
| 5 | Number of green mines | pcs | Bureau of Natural Resources | ||
| 6 | Agricultural source reduction | Number of ecoagriculture demonstration counties and circular agriculture demonstration counties | pcs | Bureau of Agriculture and Rural Affairs | |
| 7 | Amount of pesticides and fertilizers | ton | Bureau of Agriculture and Rural Affairs, Bureau of Statistics | ||
| 8 | Percentage of organic agricultural acreage | % | Bureau of Agriculture and Rural Affairs | ||
| 9 | Construction source reduction | Proportion of green buildings to new buildings | % | Bureau of Housing and Urban-Rural Development | |
| 10 | Areas of life source reduction | Per capita daily production of MSW | ton | Bureau of Housing and Urban-Rural Development, Bureau of Agriculture and Rural Affairs | |
| 11 | Classified system coverage rate of MSW | % | Bureau of Housing and Urban-Rural Development, Development and Reform Commission, Bureau of Agriculture and Rural Affairs | ||
| 12 | Number of units carrying out ZWC cells (organs, enterprises and institutions, hotels, shopping centers, markets, communities, villages, families) | pcs | Relevant departments | ||
| 13 | Proportion of green packages used by couriers | % | City Postal Administration | ||
| 14 | Solid waste resource utilization | ISW resource utilization | General ISW utilization ratio | % | Bureau of Ecology and Environment |
| 15 | Comprehensive utilization rate of industrial hazardous waste | % | Bureau of Ecology and Environment | ||
| 16 | Utilization of agricultural waste | Agricultural waste collection and transportation system coverage | % | Bureau of Agriculture and Rural Affairs | |
| 17 | Comprehensive utilization ratio of straw | % | Bureau of Agriculture and Rural Affairs | ||
| 18 | Comprehensive utilization ratio of livestock and poultry manure | % | Bureau of Agriculture and Rural Affairs | ||
| 19 | Film recovery rate | % | Bureau of Agriculture and Rural Affairs | ||
| 20 | Utilization of construction waste | Comprehensive utilization ratio of construction waste | % | Bureau of Housing and Urban-Rural Development | |
| 21 | Utilization of solid waste resources in field of life | Recycling rate of MSW | % | Bureau of Housing and Urban-Rural Development | |
| 22 | Growth rate of renewable resource recycling | % | Bureau of Commerce | ||
| 23 | Growth rate of kitchen waste recycling | % | Bureau of Housing and Urban-Rural Development, Development and Reform Commission | ||
| 24 | Growth rate of recovery and utilization of major waste products | % | Identify relevant departments according to the industry to which the product belongs | ||
| 25 | Recovery rate of recoverable resources in medical and health institutions | % | Municipal Health Commission, Bureau of Commerce | ||
| 26 | Final disposal of solid waste | Safe disposal of hazardous waste | Safe disposal of industrial hazardous waste | ton | Bureau of Ecology and Environment |
| 27 | Medical waste collection and disposal system coverage ratio | % | Municipal Health Commission | ||
| 28 | Social hazardous waste collection and disposal system coverage ratio | % | Relevant departments | ||
| 29 | General ISW storage and disposal | General ISW storage and disposal amount | ton | Bureau of Ecology and Environment | |
| 30 | Proportion of sites carrying out comprehensive remediation of bulk ISW storage sites (including tailings) | % | Bureau of Natural Resources, Bureau of Ecology and Environment, Bureau of Emergency Management | ||
| 31 | Disposal of agricultural waste | Clinical treatment rate of sick and dead pigs | % | Bureau of Agriculture and Rural Affairs | |
| 32 | Pesticide packaging waste recovery and disposal amount | ton | Bureau of Agriculture and Rural Affairs, Bureau of Ecology and Environment | ||
| 33 | Disposal of construction waste | Construction waste consumption | ton | Bureau of Housing and Urban-Rural Development | |
| 34 | Solid waste disposal in field of life | MSW landfill amount | ton | Bureau of Housing and Urban-Rural Development, Bureau of Agriculture and Rural Affairs | |
| 35 | Rural sanitary toilet penetration rate | % | Bureau of Agriculture and Rural Affairs | ||
| 36 | Hazardous waste collection and disposal system coverage | % | Bureau of Housing and Urban-Rural Development | ||
| 37 | Completion rate of remediation of informal landfills | % | Bureau of Housing and Urban-Rural Development | ||
| 38 | Support capacity | Institutional system construction | Local regulations or policy documents for ZWC management | pcs | Coordinating bodies responsible for ZWC construction |
| 39 | Coordination mechanism for ZWC management | - | Coordinating bodies responsible for ZWC construction | ||
| 40 | ZWC construction included in local government performance appraisal | - | Municipal Party Committee Organization Department, Supervision Department | ||
| 41 | Market system construction | Proportion of solid waste recycling and disposal investment in total investment in environmental pollution control | % | Bureau of Ecology and Environment | |
| 42 | Percentage of solid waste-related enterprises included in environmental credit assessment | % | Bureau of Ecology and Environment | ||
| 43 | Environmental pollution liability insurance coverage for hazardous waste operators | % | Bureau of Ecology and Environment, Bureau of banking and insurance supervision or Bureau of Local Financial Supervision | ||
| 44 | Green credit balance for ZWC projects | CNY | Bureau of banking and insurance supervision or Bureau of Local Financial Supervision | ||
| 45 | Number of solid waste recycling and disposal backbone enterprises | pcs | Development and Reform Commission, Bureau of Commerce, Bureau of Industry and Information Technology, Bureau of Ecology and Environment | ||
| 46 | Proportion of industrial added value of resource recycling industry in regional GDP | % | Bureau of Statistics | ||
| 47 | Technical system construction | Demonstration of bulk ISW reduction, resources, and innocuity technology | pcs | Bureau of Industry and Information Technology, Development and Reform Commission | |
| 48 | Technical demonstration of total utilization of agricultural waste | pcs | Bureau of Agriculture and Rural Affairs | ||
| 49 | Waste reduction and recycling technology demonstration | Bureau of Housing and Urban-Rural Development | |||
| 50 | Technical demonstration of comprehensive safety control of hazardous waste | pcs | Bureau of Ecology and Environment | ||
| 51 | Key technologies for solid waste recycling and disposal, equipment development, and application demonstration | pcs | Bureau of Science and Technology | ||
| 52 | Regulatory system construction | Solid waste regulatory capacity | - | Coordinating bodies responsible for ZWC construction | |
| 53 | Pass rate for standardized management of hazardous waste | % | Bureau of Ecology and Environment | ||
| 54 | Number of criminal cases of environmental pollution caused by solid waste detected and disposed of | pcs | Bureau of Public Security, Bureau of Ecology and Environment | ||
| 55 | Number of solid waste-related environmental pollution incidents | pcs | Bureau of Ecology and Environment | ||
| 56 | Closure rate of solid waste-related letters, complaints, and case reports | % | Bureau of Ecology and Environment | ||
| 57 | Masses’ sense of acquisition | Public perception | ZWC construction publicity, education, and training popularization rate | % | Third party surveys |
| 58 | Degree of government, enterprise, institution, and public participation in ZWC construction | % | Third party surveys | ||
| 59 | Public satisfaction with the effectiveness of ZWC construction | % | Third party surveys |
References
- Zaman, A.U. A comprehensive review of the development of zero waste management: Lessons learned and guidelines. J. Clean. Prod. 2015, 91, 12–25. [Google Scholar] [CrossRef]
- Zaman, A.U.; Lehmann, S. Urban growth and waste management optimization towards ‘zero waste city’. City Cult. Soc. 2011, 2, 177–187. [Google Scholar] [CrossRef]
- Pietzsch, N.; Ribeiro, J.L.D.; de Medeiros, J.F. Benefits, challenges and critical factors of success for Zero Waste: A systematic literature review. Waste Manag. 2017, 67, 324–353. [Google Scholar] [CrossRef]
- Lehmann, S. Urban metabolism and the zero waste city: Transforming cities through sustainable design and behaviour change. Green Cities 2012, 2012, 108–135. [Google Scholar]
- Greyson, J. An economic instrument for zero waste, economic growth and sustainability. J. Clean. Prod. 2007, 15, 1382–1390. [Google Scholar] [CrossRef]
- McCormick, K.; Anderberg, S.; Coenen, L.; Neij, L. Advancing sustainable urban transformation. J. Clean. Prod. 2013, 50, 1–11. [Google Scholar] [CrossRef] [Green Version]
- Li, J.; Pan, S.Y.; Kim, H.; Linn, J.H.; Chiang, P.C. Building green supply chains in eco-industrial parks towards a green economy: Barriers and strategies. Environ. Manag. 2015, 162, 158–170. [Google Scholar] [CrossRef]
- Ghisellini, P.; Cialani, C.; Ulgiati, S. A review on circular economy: The expected transition to a balanced interplay of environmental and economic systems. J. Clean. Prod. 2016, 114, 11–32. [Google Scholar] [CrossRef]
- Djuric Ilic, D.; Eriksson, O.; Ödlund, L.; Åberg, M. No zero burden assumption in a circular economy. J. Clean. Prod. 2018, 182, 352–362. [Google Scholar] [CrossRef]
- Salmenperä, H.; Pitkänen, K.; Kautto, P.; Saikku, L. Critical factors for enhancing the circular economy in waste management. J. Clean. Prod. 2021, 280, 124339. [Google Scholar] [CrossRef]
- Zaman, A.U.; Lehmann, S. The Zero Waste Index: A Performance Measurement Tool for Waste Management Systems in a ‘Zero Waste City’. J. Clean. Prod. 2013, 50, 123–132. [Google Scholar] [CrossRef]
- Gentil, E.C.; Gallo, D.; Christensen, T.H. Environmental evaluation of municipal waste prevention. Waste Manag. 2011, 31, 2371–2379. [Google Scholar] [CrossRef]
- Curran, T.; Williams, I. A zero waste vision for industrial networks in Europe. J. Hazard. Mater. 2012, 207–208, 3–7. [Google Scholar] [CrossRef] [PubMed]
- Lu, W.; Yuan, H. Investigating waste reduction potential in the upstream processes of offshore prefabrication construction. Renew. Sustain. Energy Rev. 2013, 28, 804–811. [Google Scholar] [CrossRef] [Green Version]
- Strazza, C.; Magrassi, F.; Gallo, M.; Del Borghi, A. Life Cycle Assessment from food to food: A case study of circular economy from cruise ships to aquaculture. Sustain. Prod. Consum. 2015, 2, 40–51. [Google Scholar] [CrossRef]
- Bratina, B.; Šorgo, A.; Kramberger, J.; Ajdnik, U.; Zemljič, L.F.; Ekart, J.; Šafarič, R. From municipal/industrial wastewater sludge and FOG to fertilizer: A proposal for economic sustainable sludge management. J. Environ. Manag. 2016, 183, 1009–1025. [Google Scholar] [CrossRef] [PubMed]
- Mohan, S.V.; Nikhil, G.N.; Chiranjeevi, P.; Reddy, C.N.; Rohit, M.V.; Kumar, A.N.; Sarkar, O. Waste biorefifinery models towards sustainable circular bioeconomy: Critical review and future perspectives. Biores. Technol. 2016, 215, 2–12. [Google Scholar] [CrossRef] [PubMed]
- Govindan, K.; Hasanagic, M. A systematic review on drivers, barriers, and practices towards circular economy: A supply chain perspective. Int. J. Prod. Res. 2018, 56, 278–311. [Google Scholar] [CrossRef]
- Taelman, S.; Tonini, D.; Wandl, A.; Dewulf, J. A holistic sustainability framework for waste management in European cities: Concept development. Sustainability 2018, 10, 2184. [Google Scholar] [CrossRef] [Green Version]
- Cole, C.; Osmani, M.; Quddus, M.; Wheatley, A.; Kay, K. Towards a Zero Waste Strategy for an English Local Authority. Resour. Conserv. Recycl. 2014, 89, 64–75. [Google Scholar] [CrossRef]
- European Commission. Towards a Circular Economy: A Zero Waste Programme for Europe. In Communication from the Commission to the European Parliament, the Council, the European Economic and Social Committee and the Committee of the Regions; COM (2014) 398 Final/2; European Commission: Brussels, Belgium, 2014. [Google Scholar]
- SF Environment. “Zero Waste FAQ”. Zero Waste. 2015. Available online: http://www.sfenvironment.org/zero-waste/overview/zero-waste-faq (accessed on 13 August 2015).
- Leo, S.; Salvia, M. Local strategies and action plans towards resource efficiency in South East Europe. Renew. Sustain. Energy Rev. 2017, 68, 286–305. [Google Scholar] [CrossRef]
- Chang, Y.-M.; Liu, C.-C.; Dai, W.-C.; Tseng, A.H.C.-H.; Chou, C.-M. Municipal solid waste management for total resource recycling: A case study on Haulien County in Taiwan. Waste Manag. Res. 2013, 31, 87–97. [Google Scholar] [CrossRef]
- Fan, Y.; Fang, C. Circular economy development in China-current situation, evaluation and policy implications. Environ. Impact Assess Rev. 2020, 84, 106441. [Google Scholar] [CrossRef]
- Liu, Q.; Li, H.M.; Zuo, X.L.; Zhang, F.F.; Wang, L. A survey and analysis on public awareness and performance for promoting circular economy in China: A case study from Tianjin. J. Clean. Prod. 2009, 17, 265–270. [Google Scholar] [CrossRef]
- Li, W.B. Comprehensive evaluation research on circular economic performance of eco-industrial parks. Energy Procedia 2011, 5, 1682–1688. [Google Scholar]
- Sarkis, J.; Zhu, H. Information technology and systems in China’s circular economy: Implications for sustainability. J. Syst. Inf. Technol. 2008, 10, 202–217. [Google Scholar] [CrossRef]
- Yoshida, F. The Cyclical Economy of Japan, 2nd ed.; Hokkaido University Press: Hokkaido, Japan, 2007. [Google Scholar]
- Al-Khatib, I.A.; Monou, M.; Zahra, A.S.F.A.; Shaheen, H.Q.; Kassinos, D. Solid waste characterization, quantification and management practices in developing countries. A case study: Nablus district–Palestine. J. Environ. Manag. 2010, 91, 1131–1138. [Google Scholar] [CrossRef]
- Ravindra, K.; Kaur, K.; Mor, S. System analysis of municipal solid waste management in Chandigarh and minimization practices for cleaner emissions. J. Clean. Prod. 2015, 89, 251–256. [Google Scholar] [CrossRef]
- Maheshi, D. Environmental and economic assessment of “open waste dump” mining in Sri Lanka. Resour. Conserv. Recycl. 2015, 102, 67–79. [Google Scholar] [CrossRef]
- Ferronato, N.; Gorritty, P.M.; Guisbert, L.E.G.; Torretta, V.; Bezzi, M.; Ragazzi, M. The municipal solid waste management of La Paz (Bolivia): Challenges and opportunities for a sustainable development. Waste Manag. Res. 2018, 36, 288–299. [Google Scholar] [CrossRef]
- Ferronato, N.; Rada, E.C.; Portillo MA, G.; Cioca, L.I.; Ragazzi, M.; Torretta, V. Introduction of the circular economy within developing regions: A comparative analysis of advantages and opportunities for waste valorization. Environ. Manag. 2019, 230, 366–378. [Google Scholar] [CrossRef] [PubMed]
- Song, Q.; Li, J.; Zeng, X. Minimizing the increasing solid waste through zero waste strategy. J. Clean. Prod. 2015, 104, 99–210. [Google Scholar] [CrossRef]
- State Council of PRC. Work Plan on “Zero-Waste City” Pilot Program in China. 2018. Available online: http://www.gov.cn/zhengce/content/2019-01/21/content_5359620.htm (accessed on 21 January 2019).
- Wertz, K.L. Economic Factors Influencing Household’s Production of Refuse. J. Environ. Econ. Manag. 1976, 2, 263–272. [Google Scholar] [CrossRef]
- Dayal, G.; Yadav, A.; Singh, R.P.; Upadhyay, R. Impact of Climatic Conditions and SocioEconomic Status on Solid Waste Characteristics: A Case Study. Sci. Total Environ. 1993, 136, 143–153. [Google Scholar] [CrossRef]
- Henricks, S.L. Socio-Economic Determinants of Solid Waste Generation and Composition in Florida. Master’s Thesis, Duke University School of the Environment, Durham, NC, USA, 1994. [Google Scholar]
- Ministry of Ecology and Environment, China. “Zero Waste City” Construction Index System (Trial). 2019. Available online: http://www.mee.gov.cn/xxgk2018/xxgk/xxgk06/201905/t20190513_702598.html (accessed on 13 May 2019).
- Fei, F.; Wen, Z.; Huang, S.; De Clercq, D. Mechanical biological treatment of municipal solid waste: Energy efficiency, environmental impact and economic feasibility analysis. J. Clean. Prod. 2018, 178, 731–739. [Google Scholar] [CrossRef]
- Khandelwal, H.; Dhar, H.; Thalla, A.K.; Kumar, S. Application of life cycle assessment in municipal solid waste management: A worldwide critical review. J. Clean. Prod. 2019, 209, 630–654. [Google Scholar] [CrossRef]
- Chen, G.; Sun, Y.; Xu, Z.; Shan, X.; Chen, Z. Assessment of Shallow Groundwater Contamination Resulting from a Municipal Solid Waste Landfill—A Case Study in Lianyungang, China. Water 2019, 11, 2496. [Google Scholar] [CrossRef] [Green Version]
- Hu, L.; Wang, W.; Long, Y.; Wei, F.; Nie, Z.; Fang, C. Fate and migration of arsenic in large-scale anaerobic landfill. Waste Manag. 2019, 87, 559–564. [Google Scholar] [CrossRef] [PubMed]
- Zadjali, S.A.; Morse, S.; Chenoweth, J.; Deadman, M. Disposal of pesticide waste from agricultural production in the Al-Batinah region of Northern Oman. Sci. Total Environ. 2013, 463–464, 237–242. [Google Scholar] [CrossRef] [PubMed]
- Pardo, G.; Moral, R.; Del Prado, A. SIMSWASTE-AD-A modelling framework for the environmental assessment of agricultural waste management strategies: Anaerobic digestion. Sci. Total Environ. 2017, 574, 806–817. [Google Scholar] [CrossRef]
- Dai, Y.J.; Sun, Q.Y.; Wang, W.S.; Lu, L.; Liu, M.; Li, J.J.; Yang, S.S.; Sun, Y.; Zhang, K.X.; Xu, J.Y.; et al. Utilizations of agricultural waste as adsorbent for the removal of contaminants: A review. Chemosphere 2018, 211, 235–253. [Google Scholar] [CrossRef] [PubMed]
- Broitman, D.; Raviv, O.; Ayalon, O.; Kan, I. Designing an agricultural vegetative waste-management system under uncertain prices of treatment-technology output products. Waste Manag. 2018, 75, 37–43. [Google Scholar] [CrossRef] [PubMed]
- He, K.; Zhang, J.; Zeng, Y. Knowledge domain and emerging trends of agricultural waste management in the field of social science: A scientometric review. Sci. Total Environ. 2019, 670, 236–244. [Google Scholar] [CrossRef] [PubMed]
- Ministry of Ecology and Environment, China. Action Plan for Tough Battle against Rural and Agricultural Pollution. 2018. Available online: http://www.mee.gov.cn/xxgk2018/xxgk/xxgk03/201811/t20181108_672959.html (accessed on 8 November 2018).
- Lindhqvist, T.; Lifset, R. What’s in a name: Producer or product responsibility? J. Ind. Ecol. 1997, 1, 6–7. [Google Scholar] [CrossRef]
- OECD. Extended Producer Responsibility: A Guidance Manual for Governments; OECD Publishing: Paris, France, 2001. [Google Scholar] [CrossRef]
- Hilton, M.; Sherrington, C.; McCarthy, A.; Börkey, P. Extended Producer Responsibility (EPR) and the Impact of Online Sales; OECD Environment Working Papers, No. 142; OECD Publishing: Paris, France, 2019. [Google Scholar] [CrossRef]
- Leclerc, S.H.; Badami, M.G. Extended producer responsibility for E-waste management: Policy drivers and challenges. J. Clean. Prod. 2020, 251, 119657. [Google Scholar] [CrossRef]
- Ribeiro, F.d.M.; Kruglianskas, I. Critical factors for environmental regulation change management: Evidences from an extended producer responsibility case study. J. Clean. Prod. 2020, 246, 119013. [Google Scholar] [CrossRef]
- NPC Standing Committee. Law on the Prevention and Control of Solid Waste Pollution. 2004. Available online: http://www.gov.cn/flflfg/2005-06/21/content_8289.htm (accessed on 21 June 2005).
- NPC Standing Committee. Circular Economy Promotion Law. 2008. Available online: http://www.gov.cn/flflfg/2008-08/29/content_1084355.htm (accessed on 29 August 2008).
- State Council of PRC. Regulations on the Management of Recycling and Disposal for Waste Electronic Products. 2008. Available online: http://www.gov.cn/zhengce/content/2009-03/04/content_4835.htm (accessed on 4 March 2009).
- Ministry of Finance, China. Administrative Measure on Tax Levy and Use for E-Waste Recycling. 2012. Available online: http://www.gov.cn/gzdt/2012-05/30/content_2149195.htm (accessed on 30 May 2012).
- Shan, H.; Yang, J. Promoting the implementation of extended producer responsibility systems in China: A behavioral game perspective. J. Clean. Prod. 2019, 250, 119446. [Google Scholar] [CrossRef]
- Cao, J.; Lu, B.; Chen, Y.; Zhang, X.; Zhai, G.; Zhou, G.; Jiang, B.; Schnoor, J.L. Extended producer responsibility system in China improves e-waste recycling: Government policies, enterprise, and public awareness. Renew. Sustain. Energy Rev. 2016, 62, 882–894. [Google Scholar] [CrossRef]
- Li, X.; Guo, C.; Chen, Y.; Long, J.; Dong, M.; Li, Z.; Yang, W.; Wang, Z.; Zhang, S. Difficulties and solutions of lead-acid battery industry EPR implementation in China. China J. Environ. Eng. 2020, 14, 3–8. [Google Scholar]
Publisher’s Note: MDPI stays neutral with regard to jurisdictional claims in published maps and institutional affiliations. |
© 2021 by the authors. Licensee MDPI, Basel, Switzerland. This article is an open access article distributed under the terms and conditions of the Creative Commons Attribution (CC BY) license (https://creativecommons.org/licenses/by/4.0/).