
Spatial Characteristics of Wildlife-Vehicle Collisions of Water Deer in Korea Expressway


Abstract
1. Introduction
2. Materials and Method
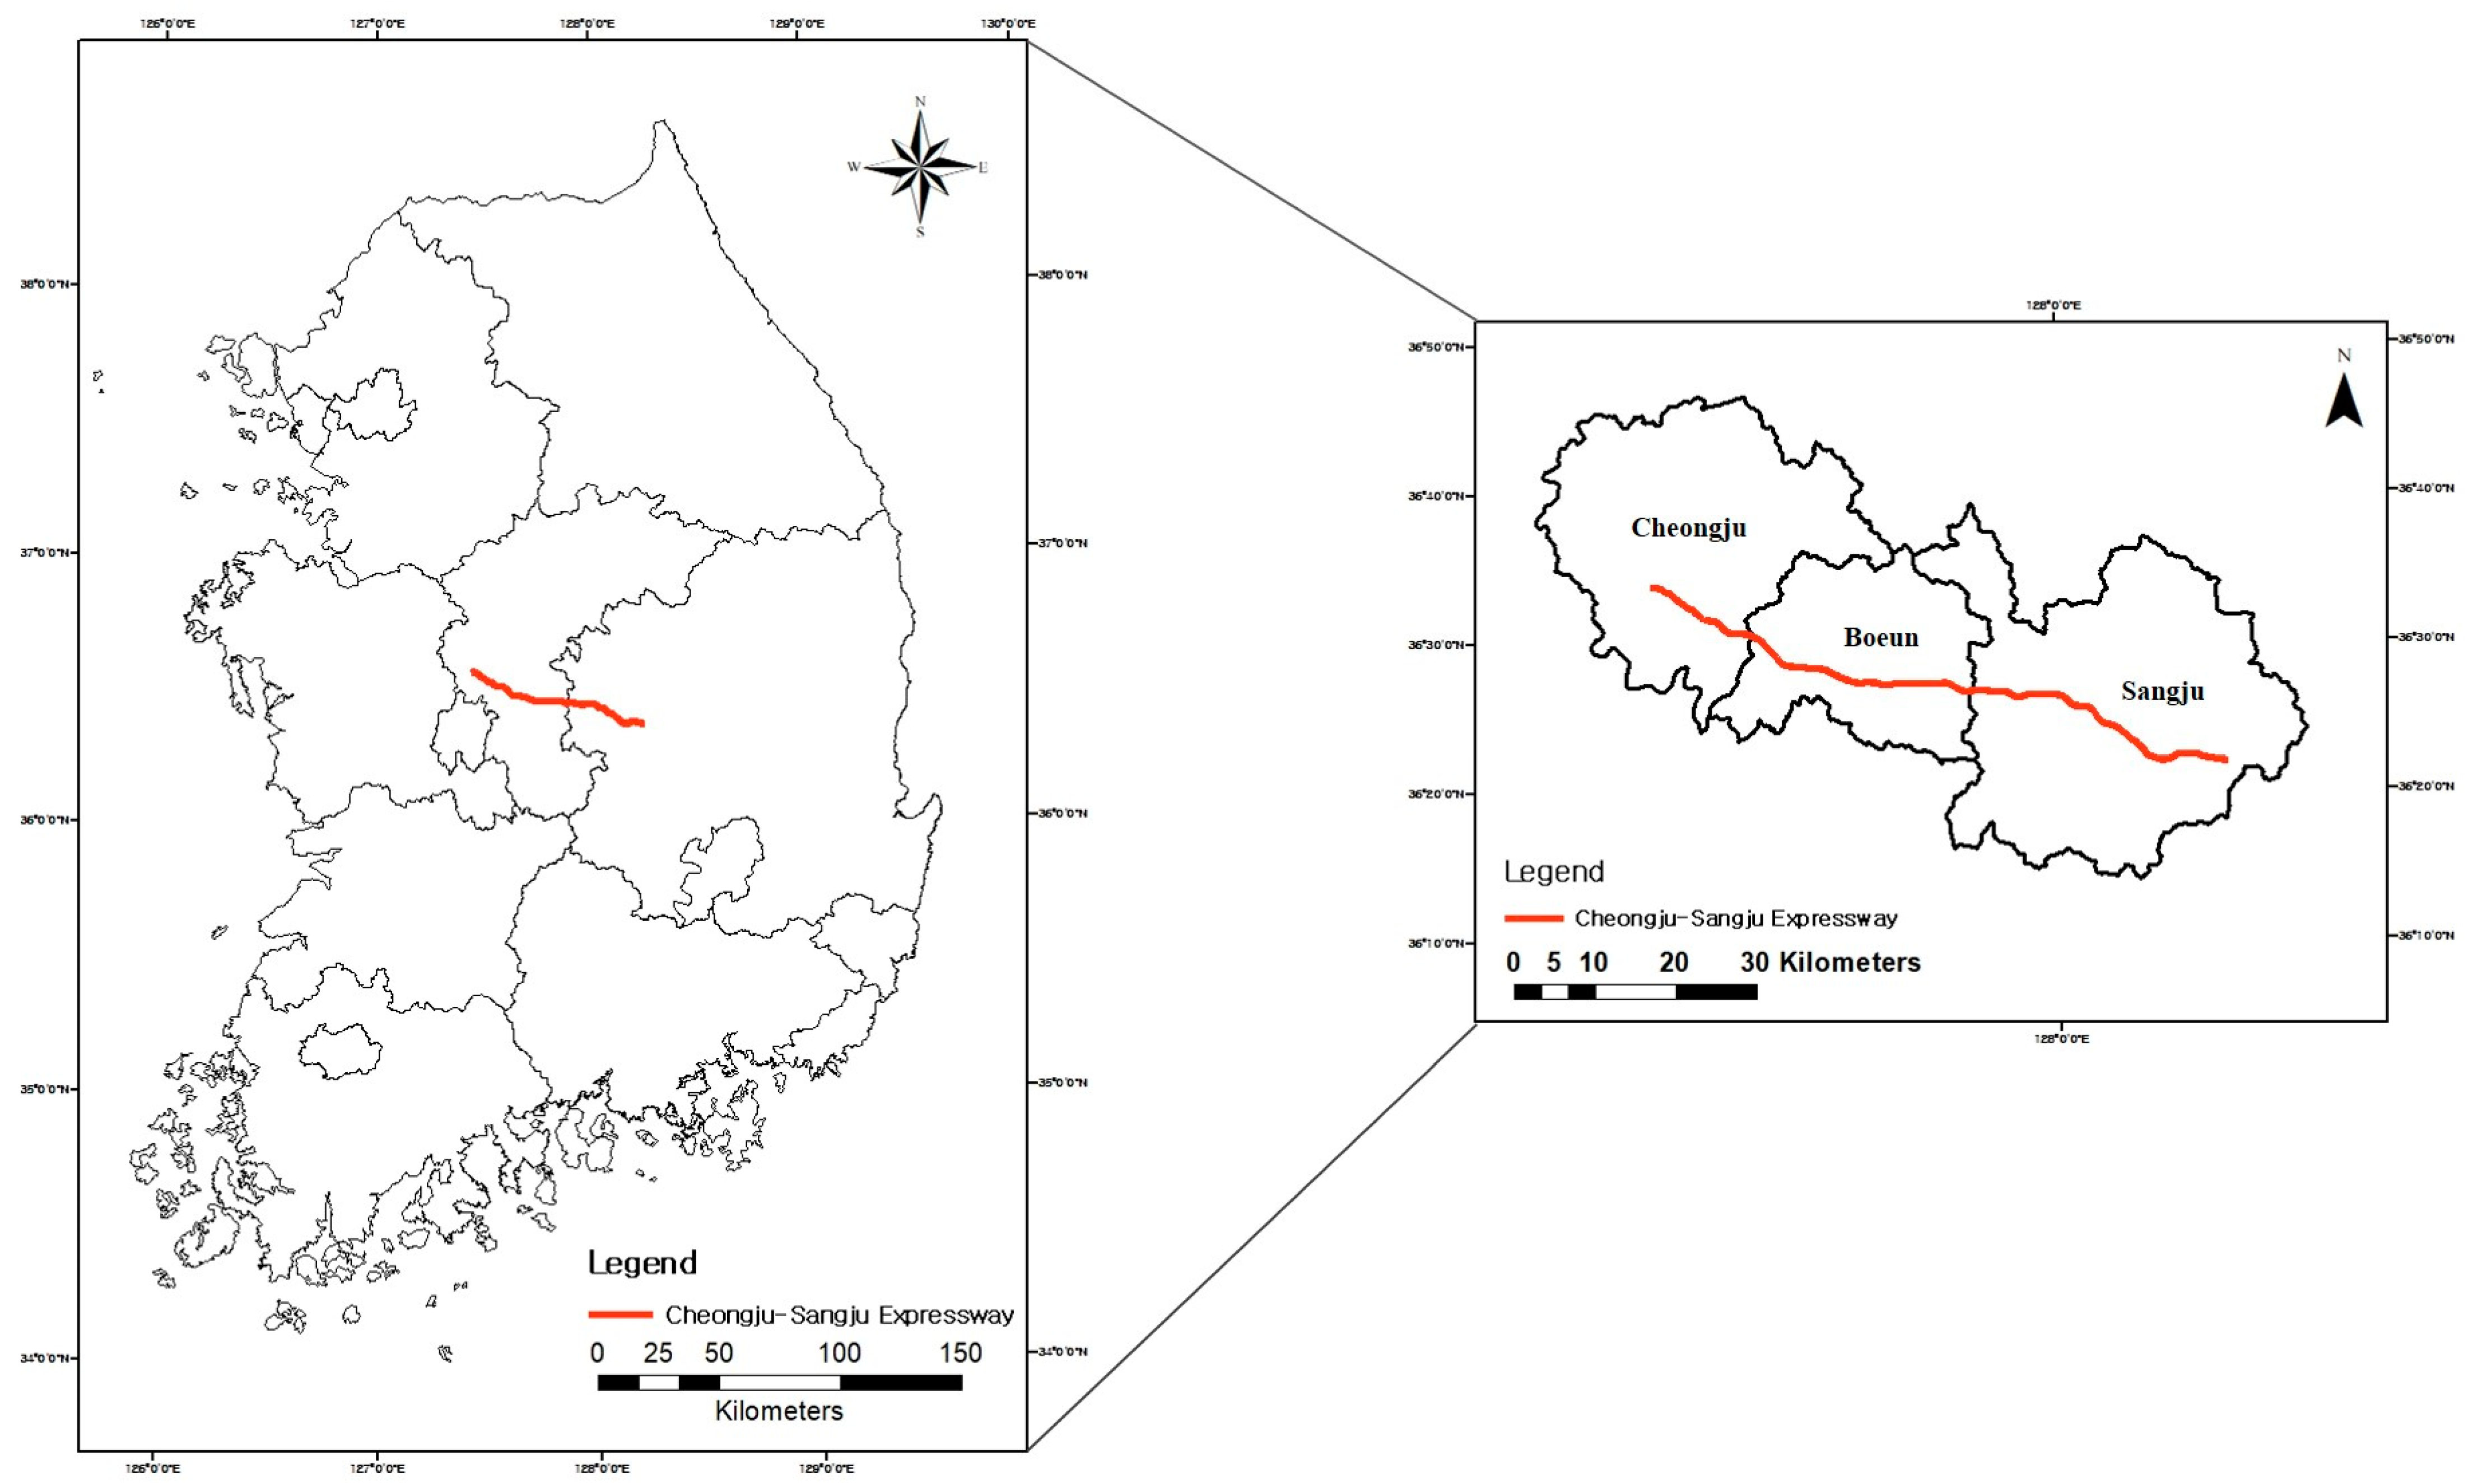
2.1. Study Area
2.2. Data Collection
2.3. Study Species
2.4. Data Analysis
2.4.1. Spatial Analysis Using Land Cover
2.4.2. WVC Hotspot Modelling
2.4.3. WVC Occurrence Cluster Analysis
3. Results and Discussion
3.1. Spatial Analysis Using Land Cover
3.2. WVC Hotspot Modelling
3.3. WVC Occurrence Cluster Analysis
4. Conclusions
Author Contributions
Funding
Institutional Review Board Statement
Informed Consent Statement
Data Availability Statement
Conflicts of Interest
References
- Ascensão, F.; Grilo, C.; LaPoint, S.; Tracey, J.; Clevenger, A.P.; Santos-Reis, M. Inter-individual variability of stone marten behavioral responses to a highway. PLoS ONE 2014, 9, e103544. [Google Scholar]
- Poessel, S.A.; Burdett, C.L.; Boydston, E.E.; Lyren, L.M.; Alonso, R.S.; Fisher, R.N.; Crooks, K.R. Roads influence movement and home ranges of a fragmentation-sensitive carnivore, the bobcat, in an urban landscape. Biol. Conserv. 2014, 180, 224–232. [Google Scholar] [CrossRef]
- Laurance, W.F.; Croes, B.M.; Guissouegou, N.; Buij, R.; Dethier, M.; Alonso, A. Impacts of roads, hunting, and habitat alteration on nocturnal mammals in African rainforests. Conserv. Biol. 2008, 22, 721–732. [Google Scholar] [CrossRef] [PubMed]
- Laurance, W.F.; Goosem, M.; Laurance, S. Impacts of roads and linear clearings on tropical forests. Trends Ecol. Evol. 2009, 24, 659–669. [Google Scholar] [CrossRef]
- Borda-de-Água, L.; Navarro, L.; Gavinhos, C.; Pereira, H.M. Spatio-temporal impacts of roads on the persistence of populations: Analytic and numerical approaches. Lands. Ecol. 2011, 26, 253–265. [Google Scholar] [CrossRef]
- Jaeger, J.A.G.; Bowman, J.; Brennan, J.; Fahing, L.; Bert, D.; Bouchard, J.; Charbonneau, N.; Frank, K.; Gruber, B.; Toschanowitz, K.T. Predicting when animal populations are at risk from roads: An interactive model of road avoidance behavior. Ecol. Model. 2005, 185, 329–348. [Google Scholar] [CrossRef]
- Forman, R.T.T. Land mosaics: The ecology of landscapes and regions 1995. In The Ecological Design and Planning Reader; Island Press: Washington, DC, USA, 2014; pp. 217–234. [Google Scholar]
- Forman, R.T.T.; Alexander, L.E. Roads and their major ecological effects. Annu. Rev. Ecol. Syst. 1998, 29, 207–231. [Google Scholar] [CrossRef]
- Jackson, S.D. Overview of transportation impacts on wildlife movement and populations. Wildlife and highways: Seeking solutions to an ecological and socio-economic dilemma. Wildl. Soc. 2000, 7–20. [Google Scholar]
- Coffin, A.W. From roadkill to road ecology: A review of the ecological effects of roads. J. Transp. Geogr. 2007, 15, 396–406. [Google Scholar] [CrossRef]
- Ascensão, F.; Yogui, D.R.; Alves, M.H.; Alves, A.C.; Abra, F.; Desbiez, A.L. Preventing wildlife roadkill can offset mitigation investments in short-medium term. Biol. Conserv. 2021, 253, 108902. [Google Scholar] [CrossRef]
- Ager, A.; Fontoura, V. Evaluation of the effectiveness of a wildlife roadkill mitigation system in wetland habitat. Ecol. Eng. 2013, 53, 31–38. [Google Scholar]
- Hobday, A.J.; Melinda, L.M. Distribution and abundance of roadkill on Tasmanian highways: Human management options. Wildl. Res. 2008, 35, 712–726. [Google Scholar] [CrossRef]
- Kioko, J.; Kiffner, C.; Jenkins, N.; Collinson, W.J. Wildlife roadkill patterns on a major highway in northern Tanzania. Afr. Zool. 2015, 50, 17–22. [Google Scholar] [CrossRef]
- Loss, S.R.; Will, T.; Marra, P.P. Estimation of bird-vehicle collision mortality on U.S. roads. J. Wildl. Manag. 2014, 78, 763–771. [Google Scholar] [CrossRef]
- Lodé, T. Effect of a motorway on mortality and isolation of wildlife populations. AMBIO 2000, 29, 163–166. [Google Scholar] [CrossRef]
- Huijser, M.P.; Duffield, J.W.; Clevenger, A.P.; Ament, R.J.; McGowen, P.T. Cost-benefit analyses of mitigation measures aimed at reducing collisions with large ungulates in the United States and Canada: A decision support tool. Ecol. Soc. 2009, 14, 2. [Google Scholar] [CrossRef]
- Lister, N.M.; Brocki, M.; Ament, R. Integrated adaptive design for wildlife movement under climate change. Front. Ecol. Environ. 2015, 13, 493–502. [Google Scholar] [CrossRef]
- Choi, J.; Lee, S.D. Application of habitat evaluation procedure with quantifying the eco-corridor in the process of environmental impact assessment. Int. J. Environ. Res. Public Health 2019, 16, 1437. [Google Scholar] [CrossRef]
- Jones, D.; Blacker, A. Road barrier effect on small birds removed by vegetated overpass in South East Queensland March. Ecol. Manag. Restor. 2010, 11, 65–67. [Google Scholar] [CrossRef]
- Bencin, H.L.; Prange, S.; Rose, C.; Popescu, V.D. Roadkill and space use data predict vehicle-strike hotspots and mortality rates in a recovering bobcat (Lynx rufus) population. Sci. Rep. 2019, 9, 15391. [Google Scholar] [CrossRef]
- Medinas, D.; Marques, J.T.; Costa, P.; Santos, S.; Rebelo, H.; Barbosa, A.M.; Mira, A. Spatiotemporal persistence of bat roadkill hotspots in response to dynamics of habitat suitability and activity patterns. J. Environ. Manag. 2021, 277, 111412. [Google Scholar] [CrossRef]
- Huang, J.C.C.; Chen, W.J.; Lin, T.E. Landscape and Species Traits Co-Drive Roadkills of Bats in a Subtropical Island. Diversity 2021, 13, 117. [Google Scholar] [CrossRef]
- Seiler, A.; Olsson, M.; Rosell, C.; Van Der Grift, E.A. SAFEROAD safe roads for wildlife and people: Cost-benefit analyses for wildlife and traffic safety. SAFEROAD Tech. Rep. 2016, 4, 40. [Google Scholar]
- Yu, H.; Liu, P.; Chen, J.; Wang, H. Comparative analysis of the spatial analysis methods for hotspot identification. Accid. Anal. Prev. 2014, 66, 80–88. [Google Scholar] [CrossRef] [PubMed]
- Ramp, D.; Caldwell, J.; Edwards, K.A.; Warton, D.; Croft, D.B. Modelling of wildlife fatality hotspots along the snowy mountain highway in New South Wales. Aus. Biol. Conserv. 2005, 126, 474–490. [Google Scholar] [CrossRef]
- Snow, N.P.; Williams, D.M.; Porter, W.F. A landscape-based approach for delineating hotspots of wildlife–vehicle collisions. Landsc. Ecol. 2014, 29, 817–829. [Google Scholar] [CrossRef]
- Bíl, M.; Andrášik, R. The effect of wildlife carcass underreporting on KDE+ hotspots identification and importance. J. Environ. Manag. 2020, 275, 111254. [Google Scholar] [CrossRef] [PubMed]
- Won, C.; Smith, K.G. History and current status of mammals of the Korean Peninsula. Mammal. Rev. 1999, 29, 3–33. [Google Scholar] [CrossRef]
- National Institute of Biological Resources. 2019 Wildlife Survey; National Institute of Ecology: Seocheon, Korea, 2019. [Google Scholar]
- Rost, G.R.; Bailey, J.A. Distribution of mule deer and elk in relation to roads. J. Wildl. Manag. 1979, 43, 634–641. [Google Scholar] [CrossRef]
- Singer, F.J.; Beattie, J.B. The controlled traffic system and associated wildlife responses in Denali National Park. Arctic 1986, 39, 195–203. [Google Scholar] [CrossRef]
- Park, H.; Lee, S. Habitat Use Pattern of Korean Waterdeer based on the Land Coverage Map. J. Wetl. Res. 2013, 15, 567–572. [Google Scholar] [CrossRef]
- O’Sullivan, D.; Unwin, D.J. Point pattern analysis. In Geographic Information Analysi; John Wiley & Sons, Inc.: Hoboken, NY, USA, 2010; pp. 121–154. [Google Scholar]
- Levine, N. Manual of CrimeStat III; National Institute of Justice: Washington, DC, USA, 2004. [Google Scholar]
- Lloyd, C.D. Local Models for Spatial Analysis; CRC Press: Boca Raton, FL, USA, 2010. [Google Scholar]
- Ishii, N.; Torii, I.; Bao, Y.; Tanaka, H. Mapping of nearest neighbor for classification. In Proceedings of the 2013 IEEE/ACIS 12th International Conference on Computer and Information Science (ICIS), Niigata, Japan, 16–20 June 2013; pp. 121–126. [Google Scholar]
- Seo, C.; Thorne, J.H.; Choi, T.; Kwon, H.; Park, C.H. Disentangling roadkill: The influence of landscape and season on cumulative vertebrate mortality in South Korea. Landsc. Ecol. Eng. 2015, 11, 87–99. [Google Scholar] [CrossRef]
- Ministry of Environment. National Territory and Natural Environment Seen by Statistics; Ministry of Environment: Sejong, Korea, 2014.
- Kim, B.J.; Oh, D.H.; Chun, S.H.; Lee, S.D. Distribution, density, and habitat use of the Korean water deer (Hydropotes inermis argyropus) in Korea. Landsc. Ecol. Eng. 2011, 7, 291–297. [Google Scholar] [CrossRef]
- Seo, H.; Choi, C.; Lee, K.; Woo, D. Landscape Characteristics Based on Effectiveness of Wildlife Crossing Structures in South Korea. Sustainability 2021, 13, 675. [Google Scholar] [CrossRef]
- Jeong, S.G.; Lee, H.S.; Park, J.H.; Lee, D.K.; Park, C.H.; Seo, C.W. Selecting Suitable Riparian Wildlife Passages Locations for Water Deer based on MaxEnt Model and Wildlife Crossing Analysis. J. Korean Soc. Geospat. Inf. Syst. 2015, 23, 101–111. [Google Scholar]
- Choi, T.Y.; Park, J.H. The effects of land use on the frequency of mammal road-kills in Korea. J. Korean Inst. Landsc. Archit. 2006, 34, 52–58. [Google Scholar]
- Zhang, E. Daytime activity budget in the Chinese water deer. Mammalia 2000, 64, 63–172. [Google Scholar] [CrossRef]
- Son, S.W.; Kil, S.H.; Yun, Y.J.; Yoon, J.H.; Jeon, H.J.; Son, Y.H.; Kim, M.S. Analysis of influential factors of roadkill occurrence: A case study of Seorak national park. J. Korean Inst. Landsc. Archit. 2016, 44, 1–12. [Google Scholar] [CrossRef]
- Puglisi, M.J.; Lindzey, J.S.; Bellis, E.D. Factors associated with highway mortality of white-tailed deer. J. Wildl. Manag. 1974, 38, 799–807. [Google Scholar] [CrossRef]
- Bashore, T.L.; Tzilkowski, W.M.; Bellis, E.D. Analysis of deer-vehicle collision sites in Pennsylvania. J. Wildl. Manag. 1985, 49, 769–774. [Google Scholar] [CrossRef]
- Finder, R.A.; Roseberry, J.L.; Woolf, A. Site and landscape conditions at white-tailed deer/vehicle collision locations in Illinois. Landsc. Urban. Plan. 1999, 44, 77–85. [Google Scholar] [CrossRef]
- Seiler, A. Predicting locations of moose–vehicle collisions in Sweden. J. Appl. Ecol. 2005, 42, 371–382. [Google Scholar] [CrossRef]
- Girardet, X.; Conruyt-Rogeon, G.; Foltête, J.C. Does regional landscape connectivity influence the location of roe deer roadkill hotspots? Eur. J. Wildl. Res. 2015, 61, 731–742. [Google Scholar] [CrossRef]
- Gunson, K.; Teixeira, F.Z. Road-wildlife mitigation planning can be improved by identifying the patterns and processes associated with wildlife–vehicle collisions. In Handbook of Road Ecology; John Wiley & Sons Ltd.: West Sussex, UK, 2015; pp. 101–109. [Google Scholar]
- Clevenger, A.P.; Chruszcz, B.; Gunson, K.E. Spatial patterns and factors influencing small vertebrate fauna road-kill aggregations. Biol. Conserv. 2003, 109, 15–26. [Google Scholar] [CrossRef]
- Danks, Z.D.; Porter, W.F. Temporal, spatial, and landscape habitat characteristics of moose–vehicle collisions in Western Maine. J. Wildl. Manag. 2010, 74, 1229–1241. [Google Scholar]
- Kim, M.; Park, H.; Lee, S. Analysis of Roadkill on the Korean Expressways from 2004 to 2019. Int. J. Environ. Res. Public Health 2021, 18, 10252. [Google Scholar] [CrossRef]


| Species | WVCs | Percentage (%) |
|---|---|---|
| Water deer (Hydropotes inermis) | 985 | 91.04 |
| Raccoon dog (Nyctereutes procyonoides) | 43 | 3.97 |
| Wild boar (Sus scrofa) | 14 | 1.29 |
| Leopard cat (Prionailurus bengalensis) | 14 | 1.29 |
| Asian badger (Meles leucurus) | 14 | 1.29 |
| Korean hare (Lepus coreanus) | 6 | 0.55 |
| others | 6 | 0.55 |
| Total | 1082 | 100 |
| Land Cover Pattern | National Ecosystem Survey (%) | WVCs (%) |
|---|---|---|
| Used Area | 1.75 | 6.19 |
| Agricultural Land | 12.44 | 17.92 |
| Forested Area | 79.17 | 69.72 |
| Grassland | 2.84 | 4.09 |
| Wetland | 1.02 | 0.39 |
| Barren Land | 0.75 | 0.99 |
| Water | 2.02 | 0.71 |
| Total | 100 | 100 |
| Land Cover Pattern | WVCs Density(/km2) | Relative Land Cover Ratio of the Study Area | |
|---|---|---|---|
| National Ecosystem Survey | CSE | ||
| Used Area | 27.4 | 0.41 | 1.37 |
| Agricultural Land | 9.94 | 0.75 | 1.15 |
| Forested Area | 10.36 | 1.12 | 0.97 |
| Grassland | 7.25 | 0.69 | 1.01 |
| Wetland | 12.04 | 1.11 | 0.51 |
| Barren Land | 4.28 | 0.64 | 0.92 |
| Water | 4.57 | 0.89 | 0.33 |
| I | II | III | IV | V | All Routes | Hotspot (I + II) | ||
|---|---|---|---|---|---|---|---|---|
| Land cover value (%) | Used Area | 7.23 | 6.98 | 5.91 | 5.76 | 3.55 | 5.82 | 7.06 |
| Agricultural Land | 19.10 | 19.78 | 26.39 | 15.87 | 7.24 | 18.74 | 19.58 | |
| Forested Area | 64.51 | 65.66 | 60.30 | 72.80 | 87.04 | 69.20 | 65.33 | |
| Grassland | 8.10 | 3.86 | 4.84 | 3.34 | 1.60 | 3.97 | 5.10 | |
| Wetland | 0.08 | 0.68 | 0.79 | 0.32 | 0.07 | 0.47 | 0.50 | |
| Barren Land | 0.87 | 2.27 | 1.23 | 0.60 | 0.39 | 1.05 | 1.86 | |
| Water | 0.11 | 0.76 | 0.53 | 1.32 | 0.12 | 0.76 | 0.57 | |
| Km | 4.23 | 12.13 | 24.58 | 26.16 | 12.6 | 79.70 | 16.36 | |
| WVCs | 150 | 291 | 302 | 220 | 22 | 985 | 441 | |
| WVCs/km | 35.49 | 23.98 | 12.28 | 8.41 | 1.75 | 12.36 | 26.96 | |
| WVCs density (/km2) | 26.31 | 21.24 | 11.92 | 7.40 | 2.03 | 11.55 | 22.73 | |
| I | II | III | IV | V | All Routes | Hotspot (I + II) | ||
|---|---|---|---|---|---|---|---|---|
| WVC density (/km2) | Used Area | 21.83 | 81.53 | 19.36 | 10.52 | 5.20 | 27.41 | 63.55 |
| Agricultural Land | 24.79 | 20.66 | 7.78 | 7.21 | - | 10.58 | 21.85 | |
| Forested Area | 30.45 | 17.01 | 13.10 | 7.31 | 2.12 | 10.90 | 20.91 | |
| Grassland | 4.33 | - | 13.86 | 6.04 | - | 7.39 | 2.02 | |
| Wetland | - | 10.79 | 20.02 | - | - | 12.57 | 10.29 | |
| Barren Land | - | 9.63 | - | 5.61 | - | 4.48 | 8.31 | |
| Water | - | - | - | 7.66 | - | 4.61 | - | |
| Total | 26.31 | 21.24 | 11.92 | 7.40 | 2.03 | 11.55 | 22.73 |
| Nearest Neighbor Ratio | WVC | |
|---|---|---|
| I | 0.086 | 150 |
| II | 0.046 | 291 |
| III | 0.050 | 302 |
| IV | 0.098 | 220 |
| V | 1.950 | 22 |
| All routes | 0.097 | 985 |
| Hotspot I + II | 0.043 | 441 |
Publisher’s Note: MDPI stays neutral with regard to jurisdictional claims in published maps and institutional affiliations. |
© 2021 by the authors. Licensee MDPI, Basel, Switzerland. This article is an open access article distributed under the terms and conditions of the Creative Commons Attribution (CC BY) license (https://creativecommons.org/licenses/by/4.0/).
Share and Cite
Park, H.; Kim, M.; Lee, S. Spatial Characteristics of Wildlife-Vehicle Collisions of Water Deer in Korea Expressway. Sustainability 2021, 13, 13523. https://doi.org/10.3390/su132413523
Park H, Kim M, Lee S. Spatial Characteristics of Wildlife-Vehicle Collisions of Water Deer in Korea Expressway. Sustainability. 2021; 13(24):13523. https://doi.org/10.3390/su132413523
Chicago/Turabian StylePark, Hyomin, Minkyung Kim, and Sangdon Lee. 2021. "Spatial Characteristics of Wildlife-Vehicle Collisions of Water Deer in Korea Expressway" Sustainability 13, no. 24: 13523. https://doi.org/10.3390/su132413523
APA StylePark, H., Kim, M., & Lee, S. (2021). Spatial Characteristics of Wildlife-Vehicle Collisions of Water Deer in Korea Expressway. Sustainability, 13(24), 13523. https://doi.org/10.3390/su132413523