Article

Characterizing the Economic and Environmental Benefits of LNG Heavy-Duty Trucks: A Case Study in Shenzhen, China

1
College of Civil and Transportation Engineering, Shenzhen University, Shenzhen 518060, China
2
Key Laboratory of Coastal Urban Resilient Infrastructures of Ministry of Education, Shenzhen University, Shenzhen 518060, China
3
Underground Polis Academy, Shenzhen University, Shenzhen 518060, China
4
Peng Cheng National Laboratory, Shenzhen 518055, China
5
Department of Civil Engineering, Nanjing Forestry University, Nanjing 210037, China
*
Author to whom correspondence should be addressed.
Sustainability 2021, 13(24), 13522; https://doi.org/10.3390/su132413522
Submission received: 10 October 2021 / Revised: 20 November 2021 / Accepted: 2 December 2021 / Published: 7 December 2021

Abstract

:
Heavy-duty trucks (HDTs) in road freight are a primary contributor of PM2.5 and NOX emissions in many cities. Shenzhen, a megacity of China, has already made great efforts to promote the green transport transition, including via the Liquefied Natural Gas (LNG) HDTs program, which may be the largest alternative fuel vehicle promotion program in the world. In order to fully understand the actual efficiency of such program, the economic and environmental impacts of LNG HDTs were analyzed in this study. The results revealed that, while the capital cost of LNG HDTs is higher than that of diesel HDTs, the aggregated cost during the entire operation period of LNG HDTs is 10% to 17% lower than that of diesel HDTs. By replacing existing diesel HDTs mode (including China-I to China-V) with LNG HDTs (100%), environmental impact analysis showed that PM2.5 and NOX emissions could be reduced by 96.7% and 73.2% in the city level, respectively. Moreover, the environmental benefits of using purely LNG HDTs versus just China-V diesel HDTs were also compared, which indicated that LNG substitution is superior to China-V, with a reduction of 20.9% for PM2.5 and 35.4% for NOX, respectively. Overall, the effectiveness of the promotion of LNG HDTs is notable in Shenzhen, and these findings could provide references for other cities to promote LNG HDTs and beyond.

1. Introduction

Playing a critical role in the national economy, the transportation sector is presented with significant challenges, such as associated environmental issues [1]. Due to rapid economic development and urbanization, there has been a boom in road transportation in China. At the end of 2020 [2], the total number of vehicles in China amounted to 372 million. In India [3], rapid economic growth and massive urbanization has significantly promoted transport emissions. The transport sector consumes 29% of total energy demand, with the dominant 93% share being oil. Along with the large amount of energy consumption, traffic emissions are also high. Among them, 74% of transport emissions are from road transportation. Recent studies show that traffic-related air pollution is causing wide and urgent concern worldwide, especially in large developing countries and regions [4,5,6,7]. All around the world, road freight is one of the largest contributors to energy consumption and exhaust emissions. According to WHO’s report, the most serious atmospheric pollutants are particulate matter (PM10 and PM2.5), nitrogen oxides (NOX) and ground-level ozone (O3), which are harmful tohuman health. From the China Mobile Source Environmental Management Annual Report 2021 [2], PM (Particulate Matter) and NOX (Nitrogen Oxide) emitted by trucks are of a significantly higher level than that of passenger vehicles in China. Heavy-duty trucks (HDTs), with a total mass of 14 tons or more, are mainly used in logistics enterprises in China. The maintenance of exhaust after-treatment devices of trucks is largely overlooked. As a result, it is very difficult to monitor and control emissions derived from HDTs. As shown in Figure 1, there are around 7.62 million HDTs in China, which account for 3.00% of the total number of vehicles. However, these HDTs contribute to 33 thousand tons of PM and 4630 thousand tons of NOX, which accounts for 52.1% and 75.4% of the total emissions from all vehicles, respectively. It is worth noting that PM2.5 is one of key pollutants in atmospheric pollution in China, and NOX is a major precursor of regional O3 and secondary PM2.5 [8,9,10]. With new national air quality standards taking effect, PM2.5 and NOX have become the focus of the future pollution control [11].
Vehicle classification, retention and emissions are based on the China Mobile Source Environmental Management Annual Report 2021 released by the Ministry of Ecology and Environment of the People’s Republic of China [2]. Given that the unit of emissions is 10,000 tons, the amounts of NOX and PM emitted by mini trucks and mini buses are less than 0.001, displayed here approximately as zero.
There are a number of advantages associated with the use of natural gas as a transportation fuel. These include wide availability, cost savings and environmental friendliness [12]. There are two forms of natural gas as a vehicle fuel: compressed natural gas (CNG) and liquefied natural gas (LNG) [13].
The primary fuels of HDTs include gasoline and diesel. There are some choices of substitutions for conventional fuels. While electric vehicles have advantages in environmental protection, due to their significant reduction of emissions per kilometer traveled as compared with conventional vehicles, they are only suitable for light-duty vehicles [14,15]. In addition, CNG’s energy density is too low to maintain the power of HDTs. The advantages of LNG are safety and environmentally friendliness, while its supply safety is just behind diesel and gasoline. Therefore, LNG has become the priority of alternative vehicle fuels in many countries. In addition, the ratio of natural gas in energy supply has increased rapidly.
Shenzhen, a megacity in south China, has transformed from a small fishing village with 60,000 residents in the 1980s to an international city with over 17.49 million permanent population in 2020 [16]. Neighboring the Hong Kong Special Administrative Region, it has become China’s first and the most successful Special Economic Zone. Shenzhen’s gross domestic product (GDP) reached 2767.0 billion RMB by the end of 2020 [17]. As a demonstration city for the national low-carbon strategy, Shenzhen is facing significant environmental challenges similar to other megacities in China, while much attention has been paid to the reduction of PM2.5 at the city scale. Local official statistics revealed that the mileage of urban roads and turnover volume of freight and passenger transport in Shenzhen have increased rapidly due to the rapid economic and social development in the area [17]. Transport has been recognized by the Shenzhen government as a key factor to achieve the goal of urban energy-saving and air quality improvement. The complexity associated with environmental issues has led to much controversy in both environmental policies and the role of the transport sector. Specifically, the Shenzhen government has made a lot of efforts to promote LNG HDTs to replace existing diesel HDTs in the road freight since 2015. The promotion scale aims for up to 15,000 HDTs before 2020, which will be one of the largest LNG truck promotion programs in urban areas around the world [18]. In 2018, Shenzhen issued relevant policies to subsidize LNG HDTs, which once again promoted their development [19].
Natural gas vehicles (NGVs) have played a critical role to improve the air quality of urban areas around the world, e.g., America, Canada, Europe and China [20,21]. NGVs mainly includes school buses, waste haulers and buses especially, since travel distances are relatively short and a central refueling network already exists [21]. In China, CNG buses and LNG buses were introduced to the bus fleet in Beijing in 1999 and 2012, respectively [22,23]. There are a number of advantages associated with LNG buses compared to their CNG counterparts, such as higher energy density, lower investment in supporting infrastructure and longer service life [24]. In the United States, the number of urban buses powered by natural gas (including CNG and LNG) has tripled between 2000 and 2015 [25,26]. An analysis of technology and policy tradeoffs indicated that NGVs could have significant market penetration in Class 7–8 trucks in the United States depending on technological and economic uncertainties [20], which provides a good reference for China, to some extent.
From an environmental perspective, the engine type of HDTs is almost the same as ignition natural gas (NG) buses, and emission patterns are also similar to these vehicles due to their similar characteristics [27]. Natural gas engines have been used in urban transit buses as an alternative to diesel engines due to their lower PM and NOX emissions [28,29]. The regular emissions from spark NG engines are much lower than the emissions from the latest technology diesel engines with after-treatment devices, measured by chassis dynamometer testing facilities [30,31]. By using dual fuel mode (e.g., natural gas and diesel), NOX and PM emissions can be reduced significantly compared with normal diesel combustion [12]. Guo et al. (2014) found that NG buses perform better than diesel buses in terms of lower NOX and PM emissions, fewer particles and smaller particle mass [22]. The PM2.5 emitted from an LNG vehicle is smaller than that from a diesel vehicle [32]. Similarly, CNG and LNG technologies also help to reduce the NOX emissions by as high as 73% compared to Euro-V diesel buses [9].
Some studies attempted to evaluate greenhouse gas (GHG) mitigation potentials. Tong et al. (2015) compared the life cycle GHG emissions from medium and heavy-duty trucks using natural gas as fuel. Their study indicated that two of the key approaches to reducing GHG emissions from natural gas-fueled media and heavy-duty trucks are improving the fuel efficiency and reducing the methane leakage rate [31,33]. Zhang et al. (2014) investigated the fuel consumption and CO2 emissions of urban public buses in Beijing that used various fuel systems (e.g., conventional diesel, natural gas and diesel hybrid). Natural gas buses have slightly lower CO2 emission factors but higher fuel consumption relative to diesel buses [23,34]. In Europe, the transport sector plays a critical role in the GHG emissions mitigation strategy. Arteconi et al. (2010) compared the life cycle of GHG emissions of heavy-duty vehicles in the European market that used diesel and LNG as fuels. Their study suggested that a 10% reduction of GHG emissions can be achieved by using LNG compared to the diesel option [13]. This is in line with Graham et al. (2008)’s study that GHG emissions of heavy-duty vehicles can be reduced by as high as 20% when switching diesel to natural gas [35]. Osorio-Tejada J et al. (2017) found that LNG trucks would be an attractive option compared to diesel oil and hydro-treated vegetable oil (HVO) on the premise of environmental priority and government policy support [36].
In summary, previous studies mainly focused on the emissions reduction of a single HDT for LNG substitution while the policy promotion at the city level was largely overlooked. Thus, this study attempts to fill this gap by focusing on the evaluation of economic and environmental advantages by promoting LNG HDTs at the city level. Normally, alternative fuel vehicles provide fleet operators novel opportunities to reduce fuel costs and emissions. However, fleet operators may be unfamiliar with the performance and costs associated with these vehicles. In this paper, by taking Shenzhen city as an example, a Monte Carlo simulation method is combined with Shenzhen Atmospheric Environmental Quality Improvement Plan (SAEQIP). Then, the economic and environmental effects of the development of LNG HDTs in road freight are predicted dynamically. Using the results obtained, we can finally put forward policy suggestions for developing a cleaner road freight industry.

2. Application of LNG HDTs in Shenzhen

There were over 3.589 million motor vehicles in Shenzhen by the end of 2020. The vehicle density in Shenzhen is approximately 510 vehicles per kilometer of road length, which ranks first in China. In 2020, the total container throughput of the Shenzhen Port reached 26,548 thousand Twenty-foot Equivalent Units (TEUs), ranking the 4th globally in the past year [17]. According to The Fourteenth Five-year Comprehensive Urban Traffic Planning of Shenzhen, Shenzhen is planning to become a global logistics hub [37]. Therefore, it is expected that the freight demand at Shenzhen will remain at a high growth rate in future. The number and vehicle kilometers traveled (VKT) of HDTs will also maintain rapid growth. In Shenzhen, the primary source of local PM2.5 emissions is automobiles, with 52% of PM2.5 coming from existing diesel HDTs [11]. Therefore, controlling the emissions of HDTs has to become a key factor for air quality improvement [34]. The reduction of PM2.5 and NOX emissions would largely rely on the management of HDTs’ emissions.

2.1. The HDTs in Shenzhen

Shenzhen government issued the Shenzhen Atmospheric Environmental Quality Improvement Plan (SAEQIP) (2017–2020) with a target of a rapid replacement of HDTs with newer, cleaner vehicles, the percentage of which was to be more than 20% (about 15,000) before 2020. To promote the application of LNG HDTs, the Shenzhen Development and Reform Commission provides a subsidy of 20,000 RMB to each LNG vehicle purchased from July 2018 [19]. With national and district-level government subsidies [38], the total subsidy amount is up to 6200 USD per vehicle, which almost covers half of the purchase difference between a LNG vehicle and a diesel vehicle in the same configuration. Considering the lower operational cost of LNG vehicles (e.g., the fuel and regular maintenance), a number of enterprises have shown interest in the replacement of old diesel HDTs with LNG HDTs.
These HDTs can be classified as follows: (1) container tractors—around one-thirtieth of these are only used in the ports, while others are long-haul container tractors mainly serving the Pearl River Delta freight; (2) engineering dump trucks; (3) engineering mixer trucks; and (4) other heavy-duty trucks for the logistics sector (see Table 1) [39].
According to the official statistics of the Shenzhen Port and Freight Management Bureau, there were approximately 80,366 HDTs in Shenzhen by the end of 2016, and 1.8% of them (1494 vehicles) were LNG HDTs [17]. The distribution of LNG HDTs in Shenzhen and the performance of these vehicles obtained by our investigation are shown in Table 1. The reason for why the performance of long-haul container trucks, engineering dump trucks and engineering mixer trucks is modest is that there are few LNG filling stations along their transit lines, resulting in unloaded runs which would reduce their benefits.

2.2. LNG Supply Security

China’s natural gas supply is supported by both domestic production and import [39]. For Shenzhen, the main sources of LNG include inter-provincial import and foreign import. One of the major projects supplying LNG from other provinces to Shenzhen is the Second West–East Gas Pipeline Project, supplying 40 billion m³/year gaseous state natural gas. In addition, a small amount of LNG is transported to Shenzhen by road freight from Inner Mongolia, Xinjiang and other regions.
Foreign imports include shipping from Australia, Qatar, Indonesia, Yemen, Malaysia, etc. LNG-receiving terminals are mainly distributed in eastern coastal regions, and Shenzhen has the largest number and scale of LNG terminals in China. The capacity of LNG-receiving terminals in Shenzhen is about 16.1% of the whole country [39]. It would significantly contribute to the security of supply and meeting diversification targets. Along with LNG terminals in adjacent cities (e.g., Dongguan, Zhuhai, Jieyang, Putian and Haikou), LNG supply security is fully guaranteed.

2.3. LNG Fueling Stations

By the end of 2017, there were 24 LNG fueling stations in Shenzhen (Figure 2) [40]. The density of LNG fueling stations is significantly lower than that of gas and diesel fueling stations in Shenzhen. For example, one of the largest automotive LNG suppliers, China National Offshore Oil Corporation (CNOOC, Beijing, China), had built 13 LNG fueling stations scattered in six districts by the end of 2016, providing a LNG refilling service for a variety of vehicles (e.g., buses, coaches, container tractors, engineering dump trucks and engineering mixer trucks) [41]. Refilling a gas tank of a LNG vehicle is quicker than refilling a diesel vehicle due to the high pressure of the gas dispenser. As a result, the level of service of LNG fueling stations is almost the same as gas and diesel fueling stations.

3. Methodology

The promotion of LNG HDTs in Shenzhen’s road freight industry is one of the largest-scale promotion programs around the world. A lot of efforts are required to ensure the efficiency of this program, e.g., government subsidies and voluntary participation by freight fleet operators. Therefore, it is imperative to conduct an economic and environmental analysis of this program. The main focus of the economic analysis is the vehicle cost, with the main indicators being the annual cost and breakeven year of various types of HDTs. Similarly, the environmental analysis mainly focuses on pollutants, such as PM2.5 and NOX, adopting the MOVES model.

3.1. Economic Analysis Methods

Container tractors, engineering dump trucks, and engineering mixer trucks are typical types of LNG vehicles to be promoted in the road freight. To analyze the economic benefits of LNG HDTs compared with diesel HDTs, the first step is to investigate their purchase, maintenance and fuel consumption through a variety of methods, such as an official database, and field survey. Official data sources mainly include the Shenzhen Statistical Yearbook and Shenzhen Port and Freight Management Bureau statistical reports. Field surveys were conducted among ports, freight enterprises and market dealers, including vehicle properties and operating features.
One of the critical factors during the decision-making process for the replacement of diesel HDTs with LNG HDTs is cost-effectiveness [42]. The annual cost per vehicle is a critical indicator of economic benefits. The cost of HDTs mainly consists of purchase cost and operational cost. In terms of purchase cost, LNG HDT cost is higher than diesel HDT cost in the same configuration. This difference is mainly due to the type of engine and fuel tank. As for operational cost, this consists of maintenance cost (includes the cost of regular maintenance and unscheduled repair) and fuel cost (dependent on fuel price and use intensity).
Operating features vary according to types of HDTs. Therefore, different indicators should be used to calculate the use intensity. VKT is the most appropriate indicator for container tractors and engineering dump trucks. For engineering mixer trucks, operational time per year is the most appropriate indicator. The engine is running and emitting pollutants all the time during the transportation process, because it not only makes the vehicle run but also keeps the mixer tank rotating to maintain the concrete’s liquid state [43].
In this study, vehicle purchase cost is distributed among service life to obtain the annual purchase cost. Furthermore, the average annual purchase cost and operational expense are summed to facilitate the comparative analysis of LNG and diesel vehicles.
(1)
Container tractors & engineering dump trucks
C o s t i E = C o s t i Y e a r s + C o s t i , M + F C i × V K T
where i represents the fuel type of each vehicle (LNG or diesel); C o s t i E represents the annual cost of each vehicle powered by fuel i (USD/year); C o s t i represents the purchase cost of each vehicle powered by fuel i (USD); Y e a r s represents the service life of the vehicle (years); C o s t i , M represents the annual average maintenance cost of each vehicle powered by fuel i (USD/year); F C i represents the price of fuel i per kilometer (USD/km); V K T is the annual average vehicle mileage (km/year) [44].
(2)
Engineering mixer trucks
C o s t i E = C o s t i Y e a r s + C o s t i , M + D C i × D a y s  
where i represents the fuel type of vehicle (LNG or diesel); C o s t i E represents the annual cost of each vehicle powered by fuel i (USD/year); C o s t i represents the purchase cost of each vehicle powered by fuel i (USD); Y e a r s represents the service life of this vehicle (years); C o s t i , M represents the annual average maintenance cost of each vehicle powered by fuel i (USD/year); D C i represents the average daily fuel cost of each vehicle powered by fuel i; D a y s is the average vehicle operating days per year (day/year).
The break-even year is another important indicator for road freight enterprises. As the purchase cost of LNG HDTs is higher than that of diesel HDTs, the return on investment is a common consideration to be taken. The breakeven year is influenced by a number of factors, most of which are non-determined factors. Therefore, the breakeven year is simulated through the Monte Carlo method with the assistance of Crystal Ball software in this study. A number of factors were considered during the simulation process such as subsidy, vehicle type, fuel price, use intensity and fuel consumption rate.

3.2. Environmental Analysis Methods

A variety of air pollutants are emitted by vehicles such as PM2.5, NOX, hydrocarbons (HC) and carbon monoxide (CO). The PM2.5 and NOX emissions derived from HDTs account for over 50% of the total emissions in Shenzhen. A series of measures were taken to improve air quality, with the main focus being on the reduction of PM2.5 and NOX. Therefore, this study focuses on the reduction of these two pollutant emissions by means of promoting LNG or China-V diesel HDTs instead of original diesel HDTs. The emissions from vehicles are calculated as follows:
E M I S i = k j V P j k × E F i j k × C F × V K T j × 10 6
where i represents pollutant type (PM2.5 and NOX in this study); j represents fuel type (LNG or diesel); k represents the emission standard (corresponding to China-I, China-II, China-III, China-IV and China-V standard); E M I S i is the vehicle emissions of pollutant i (ton/year); V P j k is the number of emission standard k vehicles using fuel j; E F i j k is the emission factor of pollutant i of emission standard k vehicles using fuel j (g/km); CF is the correction factors of emission factor; V K T j is the annual average vehicle mileage traveled of fuel j vehicle (km/year) [45].
Vehicle emission factor is affected by a large number of factors, such as engine technology, fuels, local meteorological conditions and driving patterns. Local meteorological adjustment factors can significantly affect vehicle emissions, including temperature, humidity and altitude. Since Shenzhen neighbors the South China Sea, there is no need to take altitude into consideration. The temperature and humidity factors were taken into account by referring to the technical guide released by the Ministry of Environmental Protection.

3.3. Introduction of MOVES Model and Parameters Settings

MOVES (Motor Vehicle Emission Simulator) is a traffic emission calculation model developed by United States Environmental Protection Agency (EPA, Washington, DC, USA). This model provides an accurate estimate of vehicle emissions at several scales, which has been developed over 20 years and widely adopted since [46,47]. In this paper, the latest revision, MOVES 2014, was selected to calculate traffic emissions under different conditions. In the MOVES model, four key components were used in the following calculations: Total Activity Generator (TAG), Operating Mode Distribution Generator (running OMDG), Source Bin Distribution Generator (SBDG), and Emission Calculator. In SBDG, the source bin takes vehicle type, age, load, engine type and fuel type into consideration.

3.3.1. Vehicles’ Parameters Settings

In this paper, typical LNG HDTs and diesel HDTs, with the same horsepower and configuration meeting the China-V emission standard, of three types of HDTs were chosen and compared. According to the most common vehicle brand in Shenzhen, a questionnaire survey was conducted among local market dealers in different districts of Shenzhen, including model number, purchase cost, horsepower and drive type. By calculation, the average purchase costs of different vehicle types were obtained. The information of these vehicles is shown in Table A1.
The operating parameters of HDTs mainly include four parts: vehicle maintenance cost, use intensity, service life and fuel consumption rate. Fuel consumption rate, service life and maintenance cost were collected from the Shenzhen Port and Freight Transportation Management Bureau. Vehicles in different enterprises may have different use intensity since their diverse performance. Therefore, the intensity is assigned with three kinds of value, namely the minimum value, the likeliest value and the maximum value, which are obtained by means of expert consultation (see Table A2).

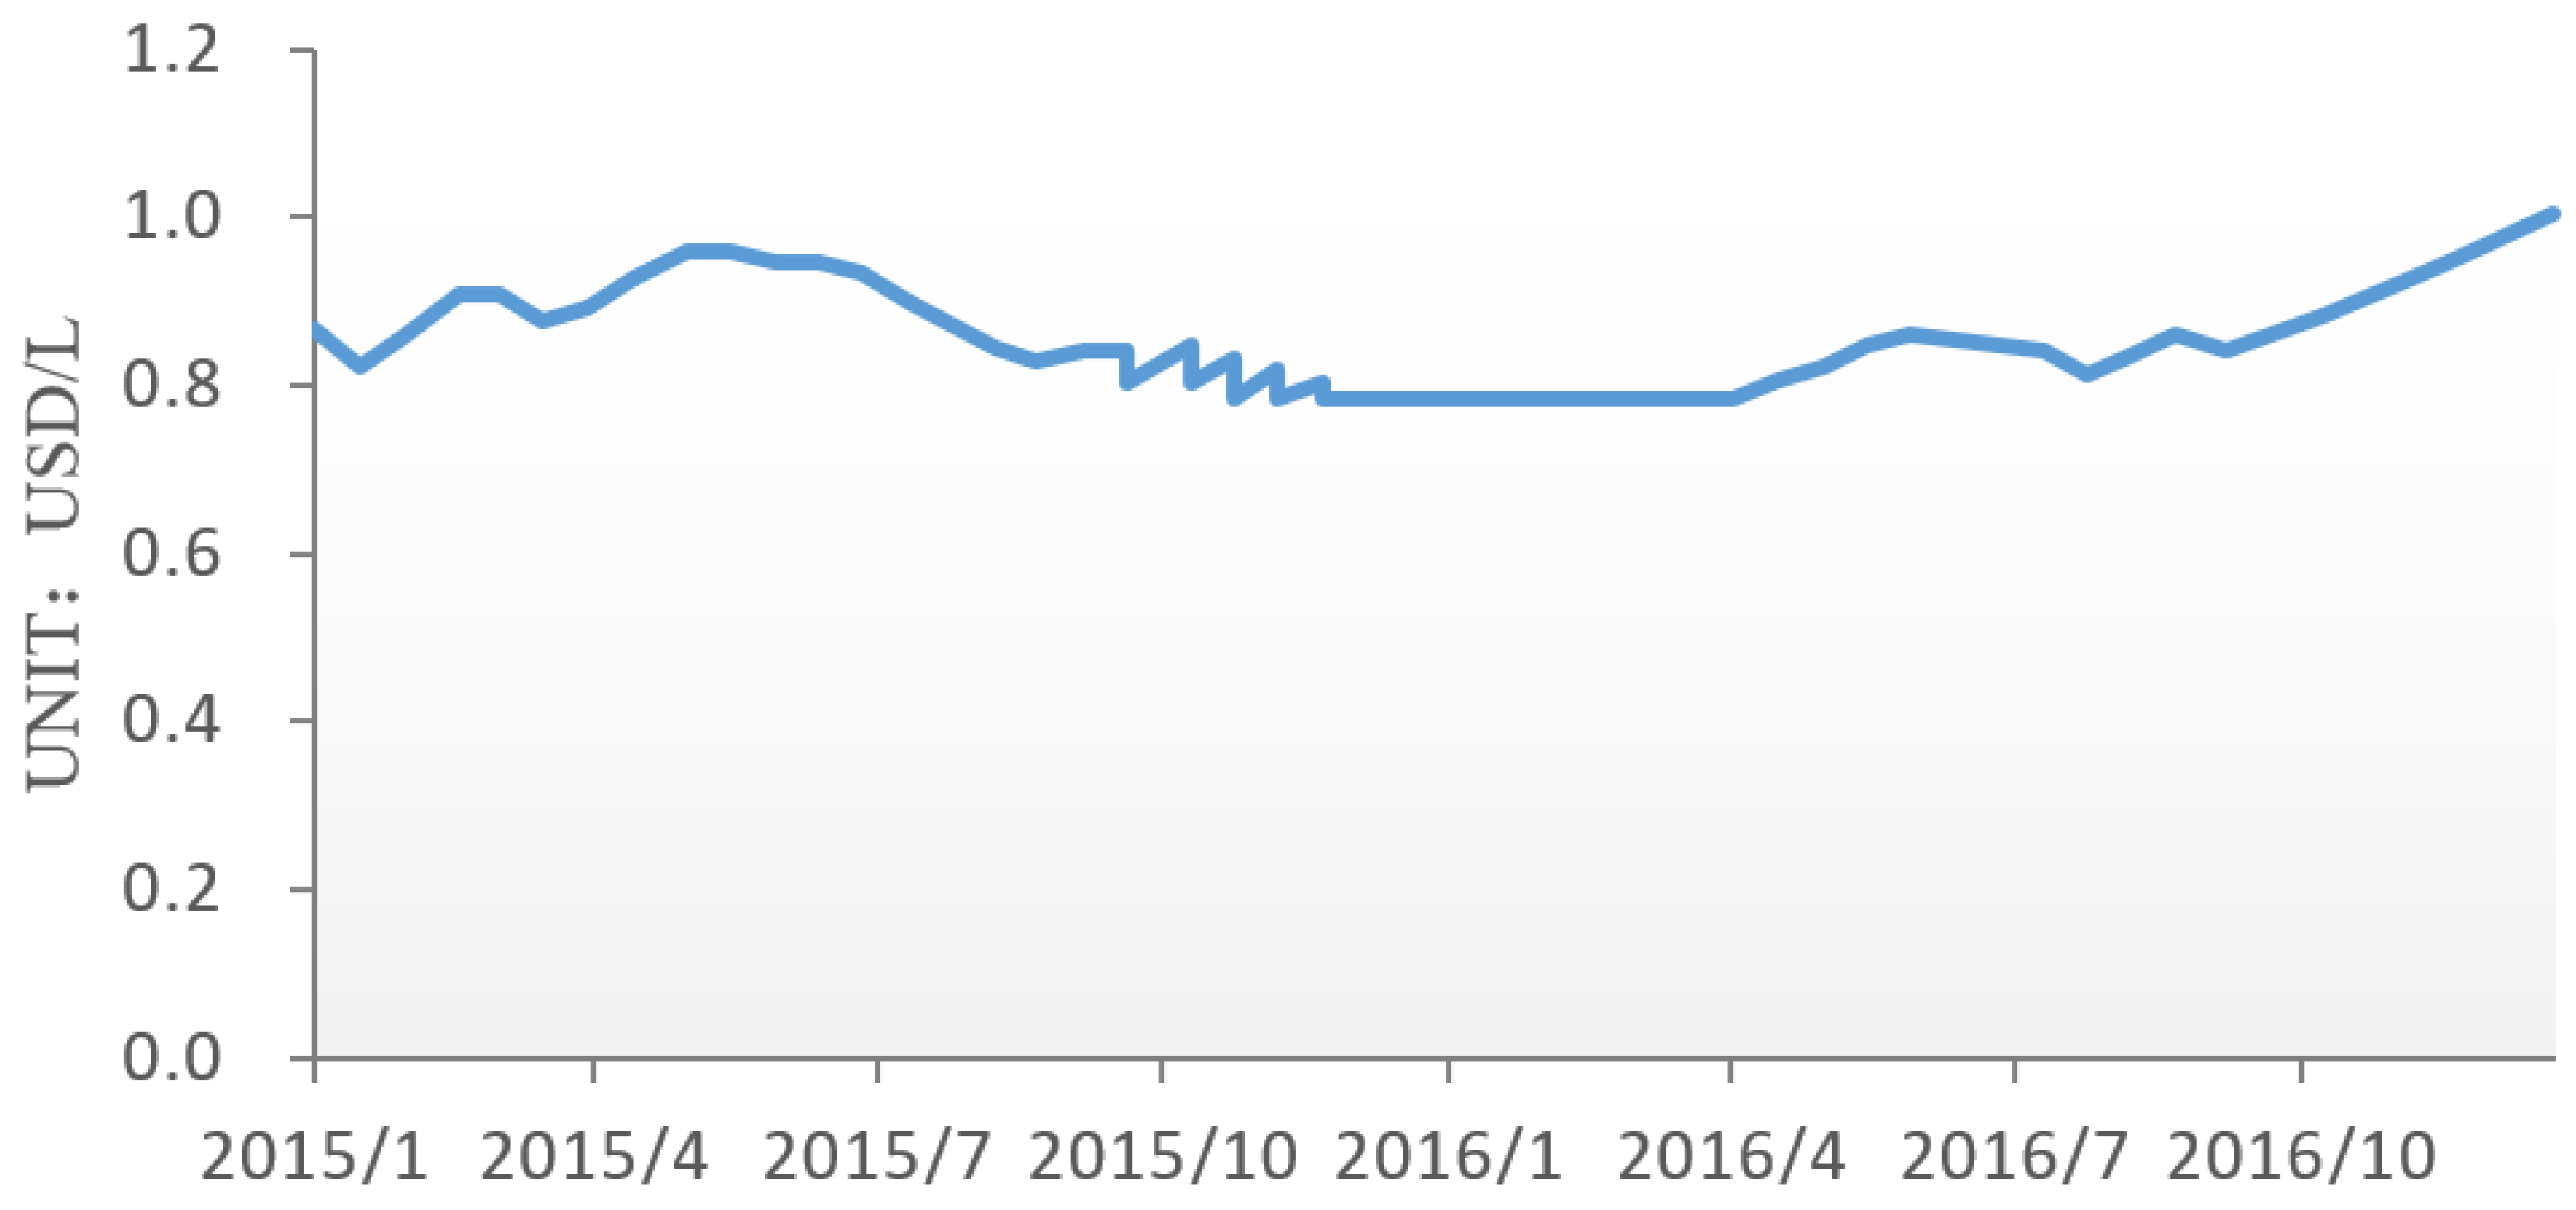
3.3.2. The Prices of Fuels

The past 2 years witnessed a significant fluctuation of fuel prices in China. The fuel prices of diesel and LNG in the past 2 years were collected from the China National Offshore Oil Corporation Shenzhen Gas Energy Co., Ltd., one of the largest automotive LNG suppliers in Shenzhen (See Figure A1).
LNG price is closely linked to the diesel price following the form of Equation (4).
P L N G = a × P D i e s e l
where P L N G represents the price of LNG (USD/kg); P D i e s e l represents the price of diesel in the market (USD/L); a is a coefficient set by the pricing mechanism established by government for new energy industrial development, its value is stabilized at 0.955 with minor change.

3.3.3. Characteristics of Meteorological Conditions

The statistical characteristics of meteorological features in 2016 are shown in Table A3. The humidity was above 50% across the whole year. A temperature of 25 was taken as the critical value. The high-temperature season was classified as those days with an average temperature of higher than 25 (from May to October). The rest of the year was classified as the low-temperature season (from November to April of next year). The emissions during these two types of seasons were calculated separately, which were summed to the annual pollutant emissions.

4. Results and Discussions

4.1. Economic Benefits

In this study, the prices of fuels under different levels were used to analyze the economic benefits comprehensively. These data were combined with the service life and annual use intensity of vehicles in order to calculate the annual cost of a single HDT and its breakeven year.
The results show that LNG HDTs outperform diesel HDTs with respect to the cost savings. However, such economic benefits are subject to the fluctuation of fuel prices. When the price of diesel is relatively low, the economic advantage of LNG HDTs will be weakened to some extent.

4.1.1. Annual Cost Per Vehicle

The annual costs of three types of HDTs is shown in Figure 3. These results shows that, while annual cost will be affected by fuel price to a greater extent, LNG HDTs always perform better economically. The annual cost per LNG HDT is 10% to 17% lower than that of a diesel HDT on average. For container tractors, savings of 4122 USD can be achieved per vehicle every year on average by switching diesel to LNG. With a huge use intensity, the average service life of engineering dump trucks is only 3 years. For dump trucks, replacing diesel with LNG can achieve 8356 USD of savings on average per vehicle every year. LNG engineering mixers can save 6781 USD on average per vehicle every year compared with diesel fuel.

4.1.2. Cost Tradeoff Evaluation

Monte Carlo simulation method is used to explain and leverage the cost, considering two scenarios. The first scenario is without subsidies from the government (Scenario 1). The second scenario is with the maximum subsidies (Scenario 2), namely 6200 USD per vehicle. According to our previous study, the breakeven year of the three types of HDTs under two scenarios are quite different [43].
With the help of subsidies, the breakeven year due to various risks can be reduced to a large extent compared with Scenario 1. Moreover, the uncertainties of the economic impact are the same. Under Scenario 2, the purchase difference of container tractors can be covered by 1.63 years approximately, 1.09 years lower than that without subsidies. As for LNG engineering dump trucks, it would take 0.50 years to recover the cost difference with subsidies and 0.98 years without subsidies. In comparison with diesel mixer trucks, LNG trucks can recover the cost difference within 0.36 years on average with the help of subsidies, which was a third of that without subsidies.

4.2. Environmental Benefits

For the measurement of PM and NOX emissions, the status quo was compared with three promotion scenarios. Based on the aims of SAEQIP (2013–2016) [48], the amount of newly electric or LNG middle-duty trucks (MDTs) and HDTs was supposed to be 25,000 by the end of 2014. Then, before the end of 2015, the increasing number of electric or LNG middle-duty trucks and HDTs should have been roughly 10,000, and the share of electric or LNG trucks should have been no less than 50% of the total trucks. In this research, the emission estimation of LNG HDTs and traditional diesel HDTs are the main focus. Considering a rough ratio of MDTs and HDTs, the number of replaced HDTs was set as 15,000 in Scenario 2, to meet the aim of 2014. Subsequently, the replacing number was set as 35,000 in Scenario 3 to achieve the share of 50%. After that, the situation of upgrading all existing HDTs was put forward as Scenario 4. In each scenario, there are two plans for promotion, namely Plan A (promoting China-V diesel HDTs) and Plan B (promoting LNG HDTs). The baseline and three scenarios are discussed below.
Scenario 1 (S1): Maintaining the status quo, i.e., HDTs will not be upgraded to LNG HDTs or China-V diesel HDTs.
Scenario 2 (S2): Replacing 15,000 heavy-polluting HDTs, which are gasoline vehicles failing to meet the China-I emissions standard or diesel vehicles failing to meet the China-III emissions standard, corresponding to the promotion scale of SAEQIP.
Scenario 3 (S3): Replacing 35,000 existing HDTs, corresponding to the medium-term promotion scale of SAEQIP.
Scenario 4 (S4): Upgrading all existing HDTs to LNG HDTs or China-V (Euro-V) diesel HDTs.

4.2.1. PM2.5 Emissions

The PM2.5 emissions of each scenario are summarized in Table 2 and Figure 4. Compared with Scenario 1, the replacement of 15,000 heavy-polluting HDTs with LNG HDTs could bring about a reduction of 761 tons of PM2.5 (the ratio of reduction is 36.0%). The replacement of 15,000 heavy-polluting HDTs with China-V diesel HDTs could remove 672 tons of PM2.5 (the ratio of reduction is 31.9%), is 89 tons more emissions than that of LNG HDTs. If all existing HDTs are replaced by cleaner vehicles, the PM2.5 emissions would be the lowest among all scenarios. The reduction rate of PM2.5 could be as high as 96.7% if all existing HDTs are replaced by LNG HDTs. If all HDTs are replaced by China-V diesel HDTs, the reduction rate of PM2.5 will be lower, emitting 440 more tons of PM2.5 relative to the LNG HDTs. Therefore, it can be concluded that the promotion of LNG HDTs is better than China-V diesel HDTs in terms of PM2.5 emissions reduction.

4.2.2. NOX Emissions

The NOX emissions of each scenario are summarized in Table 3 and Figure 5. It can be observed that the promotion of LNG HDTs is also better than that of China-V diesel HDTs in terms of NOX emissions reduction. The reduction rate of NOX increases along with the growing number of vehicles. In comparison with Scenario 1, the replacement of 15,000 heavy-polluting HDTs with LNG HDTs could remove 10,266 tons of NOX (the ratio of reduction is 16.3%). By contrast, the replacement of 15,000 heavy-polluting HDTs with China-V diesel HDTs could remove 5880 tons NOX (the ratio of reduction is 9.3%), which is 4386 tons more emissions than that of LNG HDTs. If all existing HDTs are replaced by cleaner vehicles, the NOX emissions will be the smallest among scenarios. The reduction rate of NOX could be as high as 73.2% if all existing HDTs are replaced by LNG HDTs, almost twice the reduction rate of China-V diesel HDTs.

4.3. Discussion

From an economic perspective, LNG trucks have the advantage of saving a considerable amount in fuel costs. The above analysis shows that the LNG truck is more affordable than the diesel truck regardless of changes in current and future prices. Accordingly, the gap of purchase costs of all three types of HDTs can be recovered in 1/3 of the vehicles’ service life without subsidies. When subsidies are available, the economic benefits would be even more significant and the gap of purchase costs can be recovered in 1/6 of the vehicles’ service life. Therefore, LNG HDTs are more efficient than conventional diesel HDTs from an economic perspective. It can be concluded that the economic benefits have a substitute impact on the ownership of LNG HDT. Currently, the LNG/diesel price ratio is about 0.955 in Shenzhen. Under such a price ratio, it is not likely that the ownership of LNG HDTs will see significant growth, except for internal container trucks. However, if the price of diesel is higher or the ratio can be gradually adjusted to 0.8:1 or even lower, the fast growth of LNG HDT ownership can be expected.
In the view of environmental benefits, there are several points for further discussion:
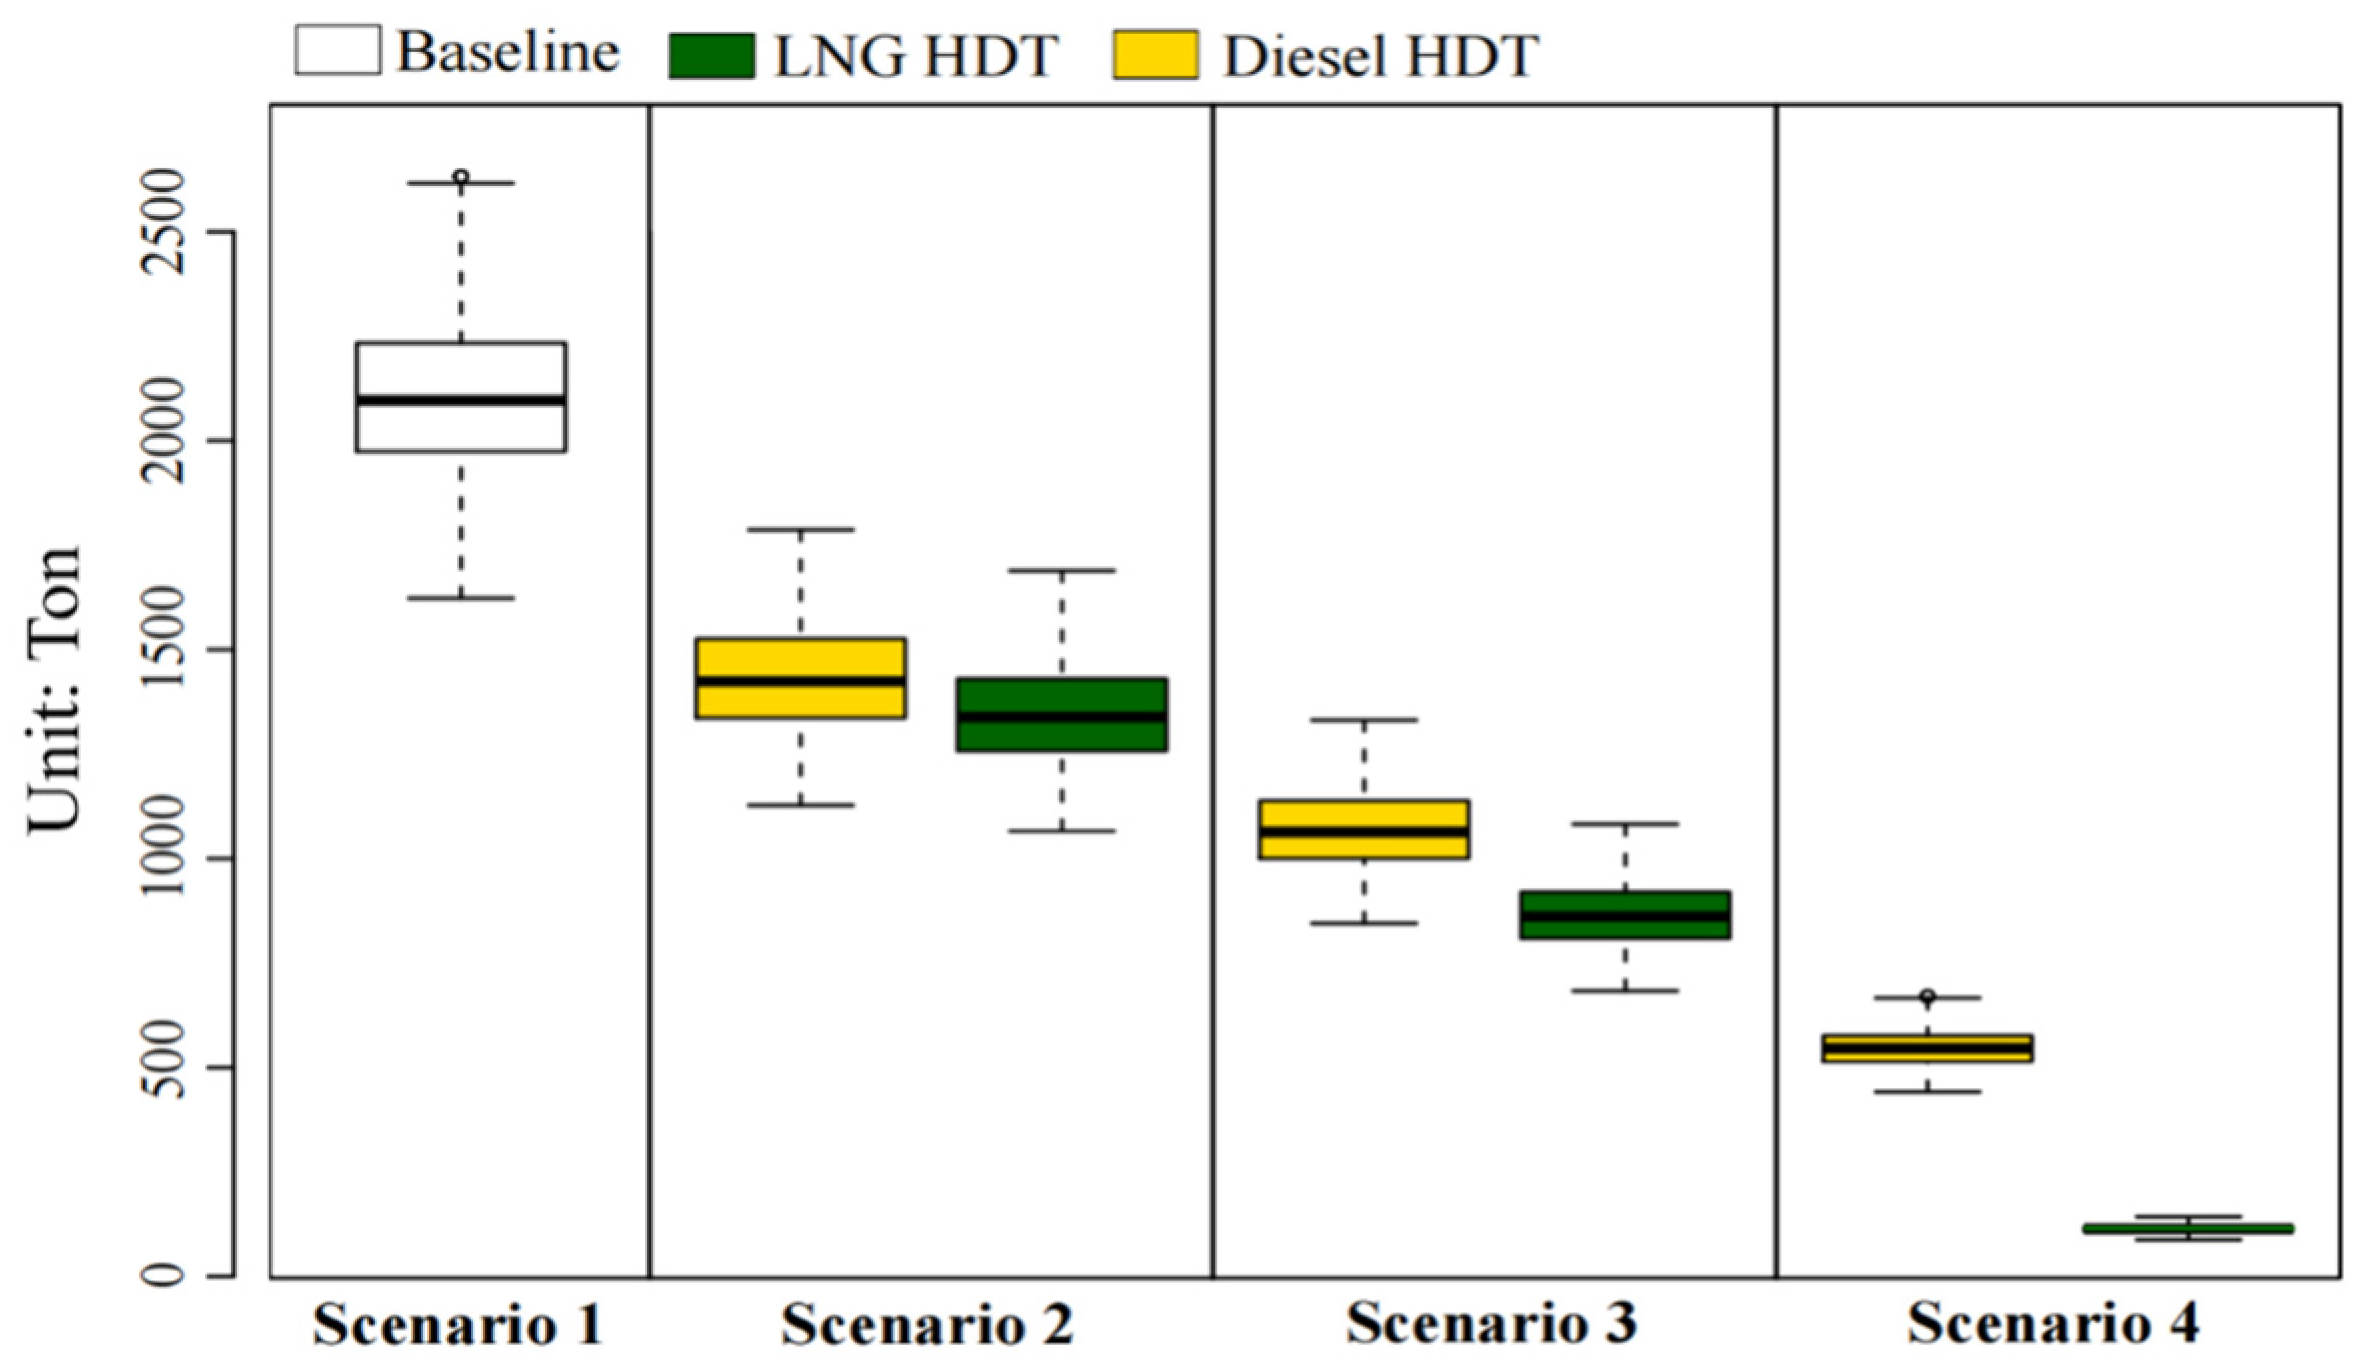
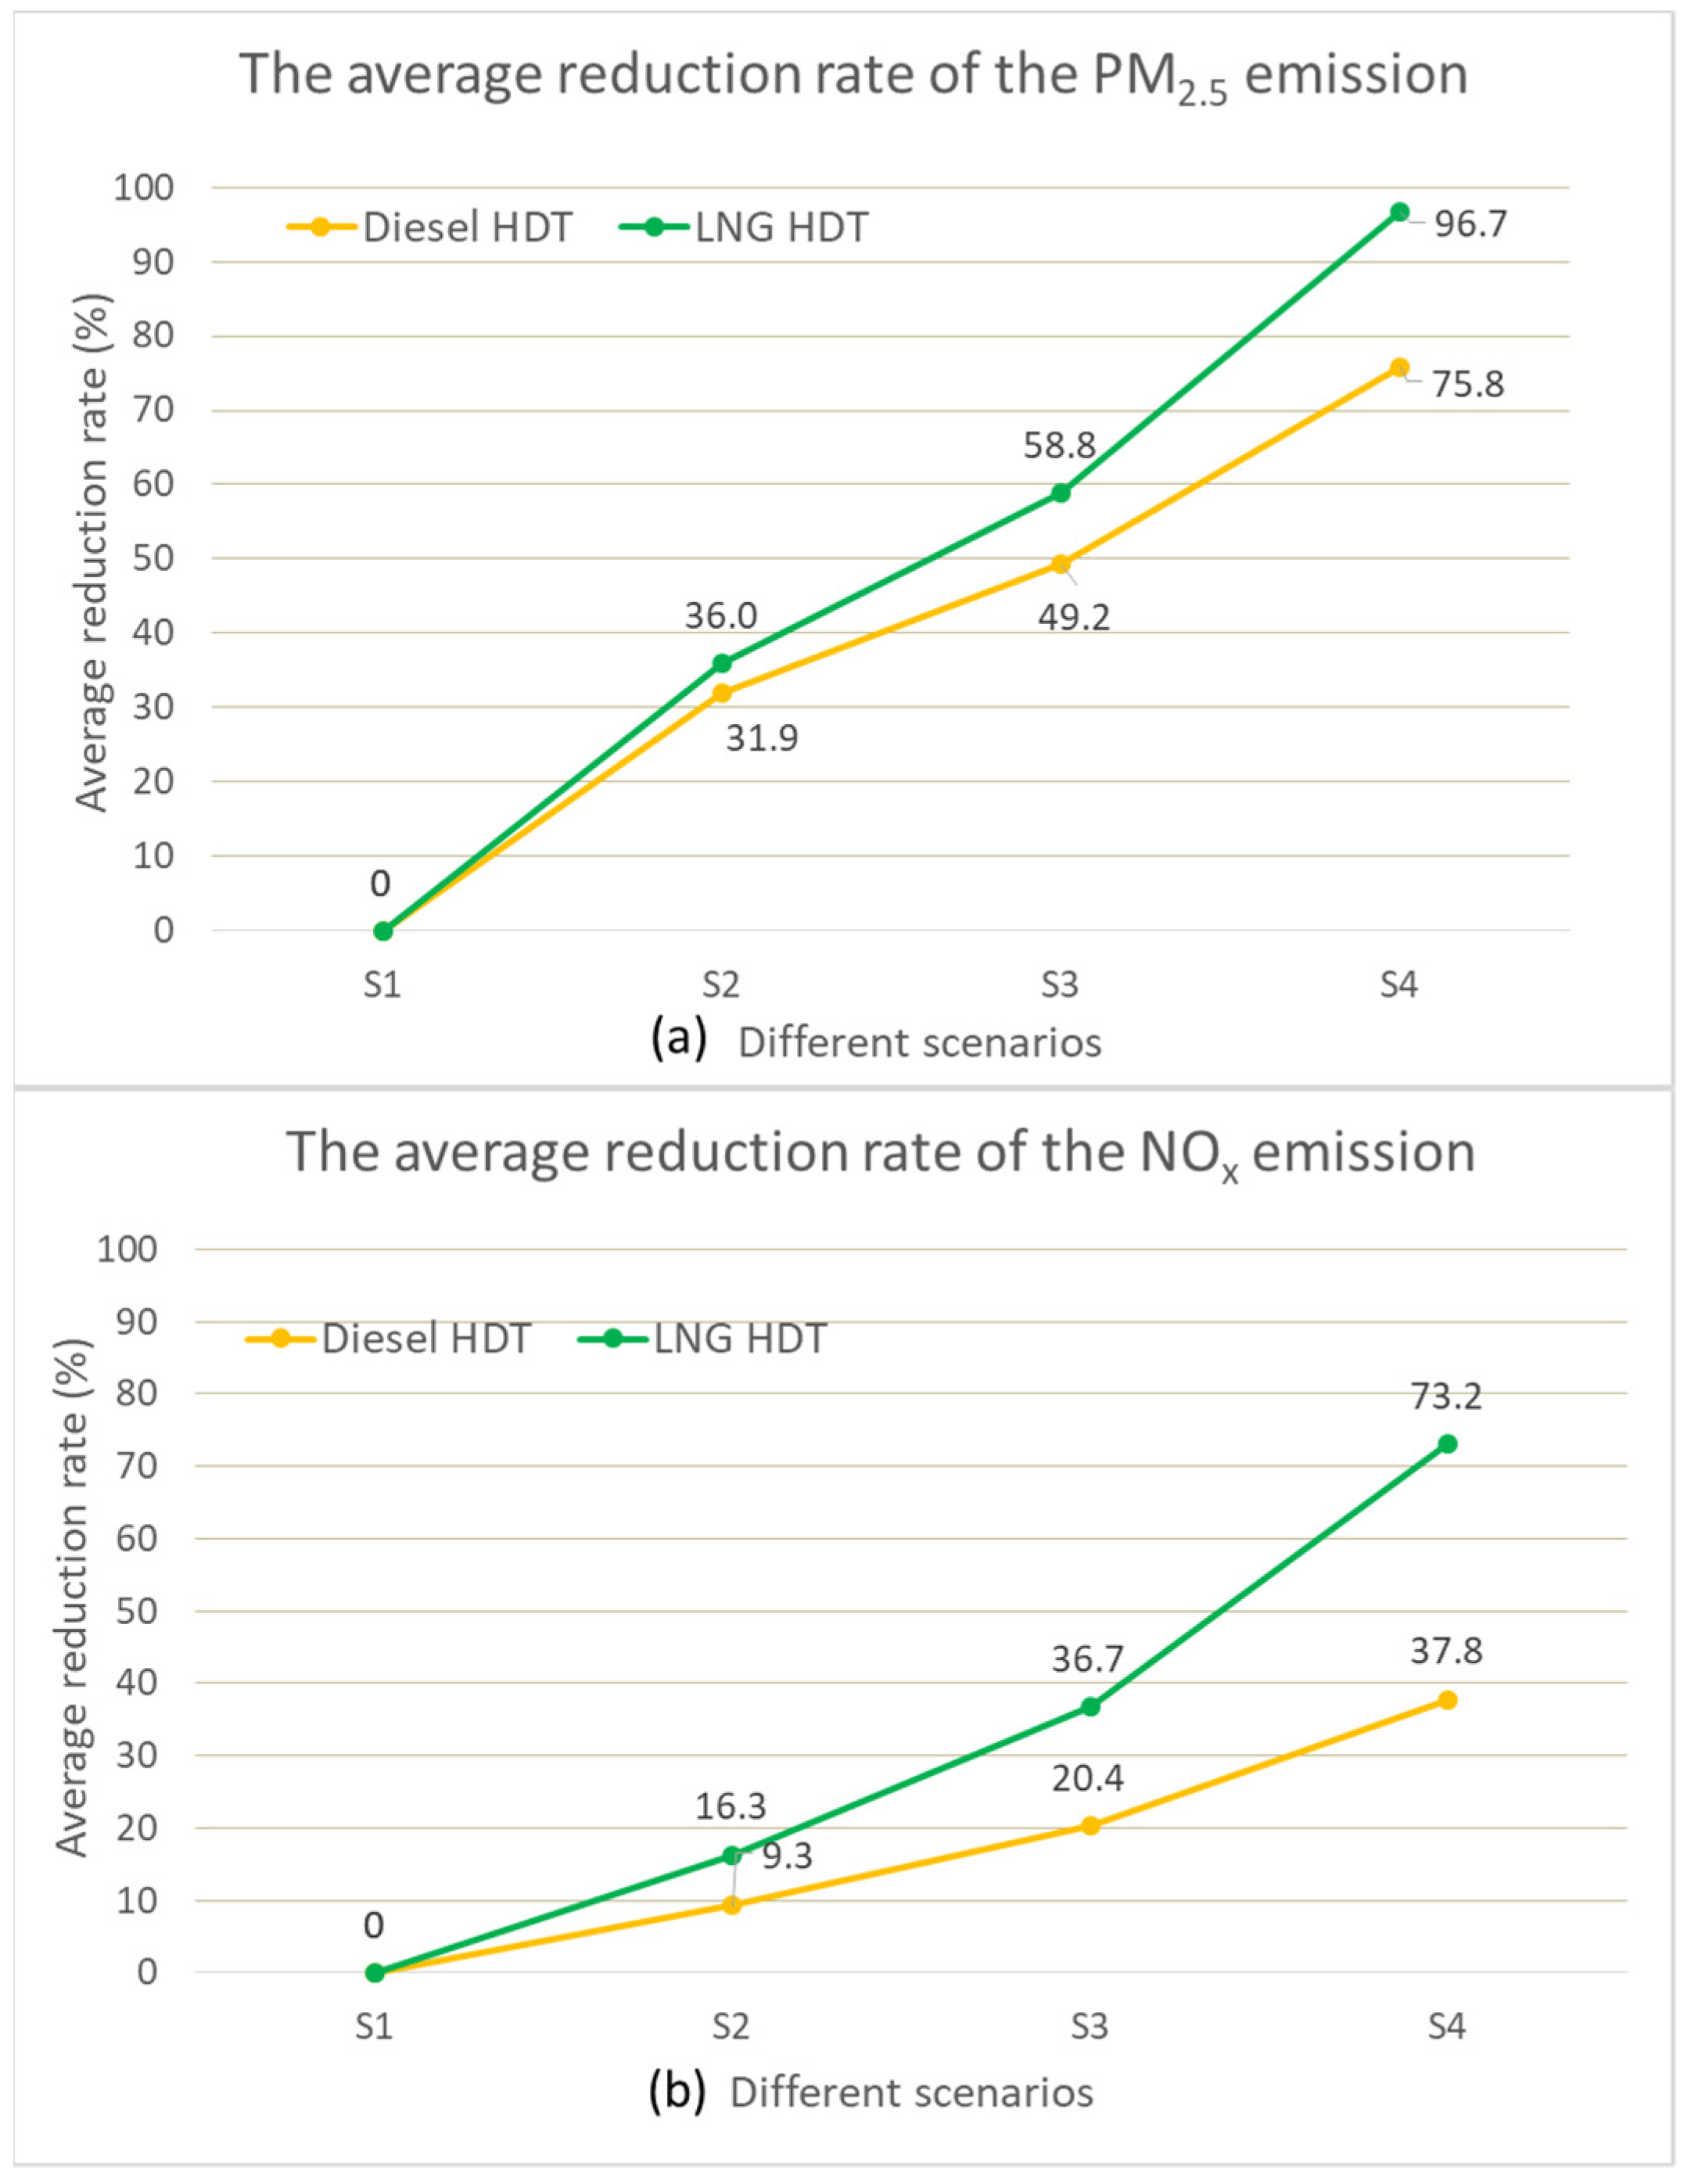
  • According to the curves shown in Figure 6a, both diesel HDTs and LNG HDTs can rapidly decrease PM2.5 emissions, which implies that the existing high-pollutant HDT is one of the main contributors of total PM2.5 emissions. Compared to diesel HDT, LNG HDT performs better in PM2.5 emission reduction under different replacement ratios, and achieves a quite high reduction percentage (96.7%) when totally substituting existing HDTs. The reduction rules can benefit policy-makers to meet several kinds of requirements for arranging vehicle control and replacement in different zones.
  • From Figure 6b, LNG HDT replacement can significantly reduce NOX emissions, while diesel HDT replacement has a relatively slight effect on the reduction. In Scenario 4, LNG HDTs showed a sharp reduction rate of 73.2%, but diesel HDTs reached a rate of just 37.8%, indicating that diesel HDTs are comparatively limited in NOX emission reduction. In this kind of situation, LNG HDTs are a better alternative.

5. Conclusions and Recommendation

In this paper, the economic and environmental benefits of the promotion of LNG HDTs program at the city scale were characterized by using Shenzhen as a case study. LNG HDTs have the advantage of saving considerable fuel costs compared to diesel HDTs, ranging from 10% to 17%. Meanwhile, the promotion of LNG HDTs could significantly reduce PM2.5 and NOX emissions of HDTs, by 36.0% and 16.3% respectively. To summarize, the effectiveness of the promotion of LNG HDTs is significant in Shenzhen city, and these findings could provide references for other cities, particularly port cities, to firmly promote LNG HDTs and beyond.
In order to promote LNG vehicles in the freight industry, two policy measures could be considered. (1) Policy and financial support need to be intensified so as to optimize the quantity and layout of LNG fueling stations. The major obstacles to developing LNG fueling stations include available land for the construction, huge investment and a complicated approval process. Therefore, the government should issue a series of policies and financial support, such as the introduction of private investment, the prioritization of land use and a new approval process for LNG fueling stations. If the security of supply is weak and diversification targets do not meet the requirement of the city, new LNG terminals should be installed on the city outskirts. (2) The market behavior of freight fleet operators could be directed towards LNG HDTs rather than diesel HDTs. Moreover, the advantages of LNG HDTs (e.g., the performance, costs and environmental friendliness) should be publicized properly and effectively. On the other hand, the LNG/diesel price ratio has gradually adjusted to a lower rate and policies need to be strengthened on LNG HDT purchase subsidies. In particular, the subsidy for replacing aging HDTs with LNG vehicles should higher than normal, to accelerate the elimination of aging automobiles to guarantee the goal of reduction of total vehicle emissions while maintaining vehicle fleet growth.
Overall, the potential economic and environmental benefits of LNG HDTs for megacities were analyzed in this study. The findings and recommendations provide useful inputs for the policy-making process. This paper also provides a guiding development framework for promoting LNG HDTs. This is of high relevance to other cities in China and even other countries with an interest in promoting LNG HDTs. However, when borrowing experience from the Shenzhen case, the uniqueness of Shenzhen’s conditions should be fully considered. First, natural gas has been promised as a cleaner energy for the whole country in the near future, and promoting natural gas vehicles is an important aspect of this. However, the reasonableness of developing LNG HDTs should be seriously considered in areas where natural gas supply cannot be guaranteed. Second, the government plays an important role in LNG pricing policy and in keeping LNG prices lower than diesel. In countries where natural gas pricing is market-oriented, the situation would be quite different. Third, policy and regulations are critical for every aspect of promoting LNG HDTs in China, where the government dominates resource allocation. LNG HDT subsidy policy and infrastructure issues are all substantially affected by policies. In other countries, this could be a totally different story.
There are some limitations associated with the macro level approaches proposed in this study: (1) Our approach was concise, and mainly analyzed economic and environmental benefits on the macroscopic level. Some non-critical aspects, such as average load of HDT, were not taken into consideration. (2) The investigation has constraints. Sample sizes, which obtained vehicle property information and operating features, were not big. Even some of the data were obtained through expert consultation. As a result, the triangular distribution was used in a Monte Carlo simulation, instead of normal distribution. (3) The data used to determine the unit emission factors for each type of HDT were taken from governmental databases and may not necessarily be sufficient to represent the current and rapid change in the transportation sector of Shenzhen. Furthermore, many earlier studies of real-world emissions can differ quite a lot from ones based on emission standard requirements. Indeed, extensive data on vehicles is necessary for a detailed study of the transport sector. In the future, this evaluation model could be further improved by expanding its scale, type and variety of impacts. Other critical factors such as rate of inflation, technology, fuels and driving patterns could also be incorporated in future studies.

Author Contributions

Conceptualization, M.H.; Data curation, Q.Z. and W.H.; Formal analysis, M.H.; Investigation, W.H. and M.H.; Methodology, M.H.; Project administration, M.H.; Resources, M.H.; Software, W.H.; Supervision, M.H.; Validation, Q.Z., M.H. and X.X.; Visualization, W.H.; Writing—original draft, W.H.; Writing—review & editing, Q.Z., W.H, M.H. and W.W. All authors have read and agreed to the published version of the manuscript.

Funding

This work was supported by the Consulting Research Project of Guangdong Research Institute of China Engineering Science and Technology Development Strategy (2020-GD-04-1-1).

Institutional Review Board Statement

Not applicable.

Informed Consent Statement

Not applicable.

Data Availability Statement

The data presented in this study are available on request from the corresponding author.

Conflicts of Interest

The authors declare no conflict of interest.

Appendix A

Table A1. The information of chosen three types HDT.
Vehicle TypeFuel TypeBrandModel NumberPurchase CostHorsepowerDrive Type
Container tractorLNGC&C TRUCKSSQR4181N5Z$47,270260 hp4 × 2
DieselDongfengEQ4160GLN$32,021260 hp4 × 2
Engineering dump truckLNGC&C TRUCKSSQR3252N6T4$65,568290 hp6 × 4
DieselDongfengDFL3250AW$53,369290 hp6 × 4
Engineering mixerLNGCIMCZJV5254GJBSZ01$75,937340 hp6 × 4
DieselCIMCZJV5254GJBSZ01$66,788340 hp6 × 4
Data source: fields survey.
Table A2. The operating parameters of HDTs.
Vehicle TypeUse Intensity (Min, Likeliest, Max)Fuel Consumption RateLifetimeMaintain Cost
Container tractor(7000, 8000, 9000) km/monthLNG: 0.247 kg/km; Diesel: 0.30 L/km10 yearsLNG: 3202 USD/year; Diesel: 3586 USD/year
Engineering dump truck(9000, 10,000, 11,000) km/monthLNG: 0.5 kg/km; Diesel: 0.6 L/km5 yearsLNG: 3050 USD/year; Diesel: 2745 USD/year
Engineering mixer(330, 355, 365) day/yearLNG: 90 kg/day; Diesel: 118 L/day3 yearsLNG: 5855 USD/year; Diesel: 4757 USD/year
Data source: Shenzhen Port and Freight Management Bureau and fields survey.
Table A3. The meteorological feature of Shenzhen in 2016.
Meteorological ConditionsJanuaryFebruaryMarchAprilMayJuneJulyAugustSeptemberOctoberNovemberDecember
Avg. temperature (°C)16.317.720.223.327.229.529.129.128.225.723.617.4
Avg. humidity (%)637078728077747371686869
Data source: Shenzhen Climate Bulletin 2016 published by Meteorological Bureau of Shenzhen Municipality.
Figure A1. The history data of diesel price. Data source: Adjustment Calendar of Domestic Refined Oil Price in 2015 and 2016 from China Economic Informatica Service.
Sustainability 13 13522 g0a1

References

  1. Westerdahl, D.; Wang, X.; Pan, X.; Zhang, K.M. Characterization of on-road vehicle emission factors and microenvironmental air quality in Beijing, China. Atmos. Environ. 2009, 43, 697–705. [Google Scholar] [CrossRef]
  2. Ministry of Ecology and Environment of the People’s Republic of China. China Mobile Source Environmental Management Annual Report 2020. 2021. Available online: http://www.mee.gov.cn/hjzl/sthjzk/ydyhjgl/202109/t20210910_920787.shtml (accessed on 6 December 2021).
  3. Ahmed, Z.; Ali, S.; Saud, S.; Shahzad, S.J.H. Transport CO2 emissions, drivers, and mitigation: An empirical investigation in India. Air Qual. Atmos. Heal. 2020, 13, 1367–1374. [Google Scholar] [CrossRef]
  4. Ramacher, M.O.P.; Matthias, V.; Aulinger, A.; Quante, M.; Bieser, J.; Karl, M. Contributions of traffic and shipping emissions to city-scale NOx and PM2.5 exposure in Hamburg. Atmos. Environ. 2020, 237, 117674. [Google Scholar] [CrossRef]
  5. Kholod, N.; Evans, M.; Gusev, E.; Yu, S.; Malyshev, V.; Tretyakova, S.; Barinov, A. A methodology for calculating transport emissions in cities with limited traffic data: Case study of diesel particulates and black carbon emissions in Murmansk. Sci. Total. Environ. 2016, 547, 305–313. [Google Scholar] [CrossRef] [Green Version]
  6. Tischer, V.; Fountas, G.; Polette, M.; Rye, T. Environmental and economic assessment of traffic-related air pollution using aggregate spatial information: A case study of Balneário Camboriú, Brazil. J. Transp. Heal. 2019, 14, 100592. [Google Scholar] [CrossRef]
  7. Dasgupta, S.; Lall, S.; Wheeler, D. Spatiotemporal analysis of traffic congestion, air pollution, and exposure vulnerability in Tanzania. Sci. Total. Environ. 2021, 778, 147114. [Google Scholar] [CrossRef] [PubMed]
  8. D’Angiola, A.; Dawidowski, L.E.; Gómez, D.R.; Osses, M. On-road traffic emissions in a megacity. Atmos. Environ. 2010, 44, 483–493. [Google Scholar] [CrossRef]
  9. Zhang, S.; Wu, Y.; Hu, J.; Huang, R.; Zhou, Y.; Bao, X.; Fu, L.; Hao, J. Can Euro V heavy-duty diesel engines, diesel hybrid and alternative fuel technologies mitigate NO X emissions? New evidence from on-road tests of buses in China. Appl. Energy 2014, 132, 118–126. [Google Scholar] [CrossRef]
  10. Wang, T.; Quiros, D.C.; Thiruvengadam, A.; Pradhan, S.; Hu, S.; Huai, T.; Lee, E.S.; Zhu, Y. Total Particle Number Emissions from Modern Diesel, Natural Gas, and Hybrid Heavy-Duty Vehicles During On-Road Operation. Environ. Sci. Technol. 2017, 51, 6990–6998. [Google Scholar] [CrossRef] [PubMed]
  11. Huang, X.; Yun, H.; Gong, Z.; Li, X.; He, L.; Zhang, Y.; Hu, M. Source apportionment and secondary organic aerosol estimation of PM2.5 in an urban atmosphere in China. Sci. China Earth Sci. 2013, 57, 1352–1362. [Google Scholar] [CrossRef]
  12. Wei, L.; Geng, P. A review on natural gas/diesel dual fuel combustion, emissions and performance. Fuel Process. Technol. 2016, 142, 264–278. [Google Scholar] [CrossRef]
  13. Arteconi, A.; Polonara, F. LNG as vehicle fuel and the problem of supply: The Italian case study. Energy Policy 2013, 62, 503–512. [Google Scholar] [CrossRef]
  14. Ellingsen, L.A.-W.; Singh, B.; Strømman, A.H. The size and range effect: Lifecycle greenhouse gas emissions of electric vehicles. Environ. Res. Lett. 2016, 11, 054010. [Google Scholar] [CrossRef]
  15. Wolfram, P.; Wiedmann, T. Electrifying Australian transport: Hybrid life cycle analysis of a transition to electric light-duty vehicles and renewable electricity. Appl. Energy 2017, 206, 531–540. [Google Scholar] [CrossRef] [Green Version]
  16. National Bureau of Statistic of China. China Statistical Yearbook 2020. 2021. Available online: https://www.stats.gov.cn/tjsj/zxfb/202102/t20210227_1814154.html (accessed on 6 December 2021).
  17. Bureau of Statistics of Shenzhen Municipality, Statistical Bulletin of National Economic and Social Statistical Bulletin of National Economic and Social Development of Shenzhen in 2020. 2021. Available online: https://tjj.sz.gov.cn/nj2020/nianjian.html?2020 (accessed on 6 December 2021).
  18. The Shenzhen Municipal People’s Government. Shenzhen Atmospheric Environmental Quality Improvement Plan (2017–2020). 2017. Available online: https://www.sz.gov.cn/zfgb/2017/gb995/content/post_4995986.html (accessed on 6 December 2021).
  19. Development and Reform Commission of Shenzhen Municipality. Guidelines for Application of Subsidy Funds for Promoting the Use of LNG Freight Vehicles in Shenzhen Road Freight Industry in 2015. In 2015. Available online: https://fgw.sz.gov.cn/zwgk/qt/tzgg/content/post_4599242.html (accessed on 6 December 2021).
  20. Askin, A.C.; Barter, G.; West, T.H.; Manley, D.K. The heavy-duty vehicle future in the United States: A parametric analysis of technology and policy tradeoffs. Energy Policy 2015, 81, 1–13. [Google Scholar] [CrossRef] [Green Version]
  21. Karavalakis, G.; Hajbabaei, M.; Jiang, Y.; Yang, J.; Johnson, K.C.; Cocker, D.R.; Durbin, T.D. Regulated, greenhouse gas, and particulate emissions from lean-burn and stoichiometric natural gas heavy-duty vehicles on different fuel compositions. Fuel 2016, 175, 146–156. [Google Scholar] [CrossRef] [Green Version]
  22. Guo, J.; Ge, Y.; Hao, L.; Tan, J.; Li, J.; Feng, X. On-road measurement of regulated pollutants from diesel and CNG buses with urea selective catalytic reduction systems. Atmos. Environ. 2014, 99, 1–9. [Google Scholar] [CrossRef]
  23. Zhang, S.; Wu, Y.; Liu, H.; Huang, R.; Yang, L.; Li, Z.; Fu, L.; Hao, J. Real-world fuel consumption and CO2 emissions of urban public buses in Beijing. Appl. Energy 2014, 113, 1645–1655. [Google Scholar] [CrossRef]
  24. Kumar, S.; Kwon, H.-T.; Choi, K.-H.; Lim, W.; Cho, J.H.; Tak, K.; Moon, I. LNG: An eco-friendly cryogenic fuel for sustainable development. Appl. Energy 2011, 88, 4264–4273. [Google Scholar] [CrossRef]
  25. Federal Transit Administration. National Transit Database. In 2016; Volume 2016. Available online: https://www.transit.dot.gov/sites/fta.dot.gov/files/docs/ntd/66011/2016-ntst.pdf (accessed on 1 December 2021).
  26. Dickens, M.; Neff, J.; Grisby, D. APTA 2016 Public Transportation Fact Book. In Environmental Protection: 2017. Available online: https://www.apta.com/wp-content/uploads/Resources/resources/statistics/Documents/FactBook/2016-APTA-Fact-Book.pdf (accessed on 1 December 2021).
  27. Li, Y.L.; Lv, J.X.; Li, X.Y. Comparison and Selection of Low-carbon Transportation Vehicles in the Context of Carbon Neutrality. Transp. Energy Conserv. Environ. Prot. 2021, 17, 1–8. [Google Scholar]
  28. Hou, X.J.; Xiong, N.; Wang, Y.H.; Liu, Z.E. articulate Matter Emission Characteristic of Gasoline/Compressed Natural Gas Dual-Fuel Engine. Chin. Intern. Combusion Engine Eng. 2021, 42, 74–80. [Google Scholar]
  29. Yao, M.F.; Yan, B.W.; Zheng, Z.Q.; Qin, Y.F. The development and application of combustion technologies for spark ignition heavy-duty natural gas engines. Nat. Gas Ind. 2017, 37, 79–86. [Google Scholar]
  30. Yoon, S.; Collins, J.; Thiruvengadam, A.; Gautam, M.; Herner, J.; Ayala, A. Criteria pollutant and greenhouse gas emissions from CNG transit buses equipped with three-way catalysts compared to lean-burn engines and oxidation catalyst technologies. J. Air Waste Manag. Assoc. 2013, 63, 926–933. [Google Scholar] [CrossRef] [Green Version]
  31. Yoon, S.; Hu, S.; Kado, N.Y.; Thiruvengadam, A.; Collins, J.F.; Gautam, M.; Herner, J.D.; Ayala, A. Chemical and toxicological properties of emissions from CNG transit buses equipped with three-way catalysts compared to lean-burn engines and oxidation catalyst technologies. Atmos. Environ. 2014, 83, 220–228. [Google Scholar] [CrossRef]
  32. Kwon, S.I.; Hong, J.H. Particle number and size distribution characteristics from diesel- and liquefied-natural-gas-fuelled buses for various emission certification modes in the Republic of Korea. Proc. Inst. Mech. Eng. Part D J. Automob. Eng. 2010, 224, 1569–1579. [Google Scholar] [CrossRef]
  33. Tong, F.; Jaramillo, P.; Azevedo, I.M.L. Comparison of Life Cycle Greenhouse Gases from Natural Gas Pathways for Medium and Heavy-Duty Vehicles. Environ. Sci. Technol. 2015, 49, 7123–7133. [Google Scholar] [CrossRef] [Green Version]
  34. Song, H.; Ou, X.; Yuan, J.; Yu, M.; Wang, C. Energy consumption and greenhouse gas emissions of diesel/LNG heavy-duty vehicle fleets in China based on a bottom-up model analysis. Energy 2017, 140, 966–978. [Google Scholar] [CrossRef]
  35. Graham, L.A.; Rideout, G.; Rosenblatt, D.; Hendren, J. Greenhouse gas emissions from heavy-duty vehicles. Atmos. Environ. 2008, 42, 4665–4681. [Google Scholar] [CrossRef]
  36. Osorio-Tejada, J.L.; Llera-Sastresa, E.; Scarpellini, S. A multi-criteria sustainability assessment for biodiesel and liquefied natural gas as alternative fuels in transport systems. J. Nat. Gas Sci. Eng. 2017, 42, 169–186. [Google Scholar] [CrossRef] [Green Version]
  37. Transport Commission of Shenzhen Municipality. The Fourteenth Five-Year Comprehensive Urban Traffic Planning of Shenzhen. 2021. Available online: https://www.seetao.com/details/62096.html (accessed on 1 December 2021).
  38. Development and Reform Bureau of Yantian District. Special Fund for LNG Container Traitors and LNG Fueling Station in Yantian. 2017. Available online: http://www.yantian.gov.cn/ytfzhggj/gkmlpt/content/5/5912/post_5912565.html#17391 (accessed on 6 December 2021).
  39. Hao, H.; Liu, Z.; Zhao, F.; Li, W. Natural gas as vehicle fuel in China: A review. Renew. Sustain. Energy Rev. 2016, 62, 521–533. [Google Scholar] [CrossRef]
  40. Housing and Construction Bureau of Shenzhen Municipality. LNG Fueling Station. 2017. Available online: http://zjj.sz.gov.cn/ztfw/rqjg/qcjqz2017/index.html (accessed on 6 December 2021).
  41. China National Offshore Oil Corporation Shenzhen Gas Co., L. Provide Clean Energy, Construct Low-carbon Shenzhen. 2018. Available online: https://www.cnoocltd.com/module/download/down.jsp?i_ID=15294594&colID=3881 (accessed on 6 December 2021).
  42. Fan, Y.; Parker, N.; Scheitrum, D.; Dominguez-Faus, R.; Jaffe, A.M.; Medlock, I.K.; Lee, A. Geospatial, Temporal and Economic Analysis of Alternative Fuel Infrastructure: The case of freight and U.S. natural gas markets. Energy J. 2017, 38, 199–230. [Google Scholar] [CrossRef]
  43. Hu, M.; Cai, J.; Huang, W.; Chen, J. The evaluation on liquefied natural gas truck promotion in Shenzhen freight. Adv. Mech. Eng. 2017, 9, 2071939594. [Google Scholar] [CrossRef] [Green Version]
  44. Beijing Sustainability and Development Center, Tsinghua University. Strategy for the Alternative Fuel Vehicles in Beijing. 2012. Available online: https://www.efchina.org/Attachments/Report/reports-efchina-20121122-zh/%E5%8C%97%E4%BA%AC%E5%B8%82%E6%9B%BF%E4%BB%A3%E7%87%83%E6%96%99%E8%BD%A6%E5%8F%91%E5%B1%95%E6%88%98%E7%95%A5%E7%A0%94%E7%A9%B6.pdf (accessed on 6 December 2021).
  45. Zheng, B.; Huo, H.; Zhang, Q.; Yao, Z.L.; Wang, X.T.; Yang, X.F.; Liu, H.; He, K.B. High-resolution mapping of vehicle emissions in China in 2008. Atmos. Chem. Phys. Discuss. 2014, 14, 9787–9805. [Google Scholar] [CrossRef] [Green Version]
  46. Guevara, M.; Tena, C.; Soret, A.; Serradell, K.; Guzmán, D.; Retama, A.; Camacho, P.; Jaimes-Palomera, M.; Mediavilla, A. An emission processing system for air quality modelling in the Mexico City metropolitan area: Evaluation and comparison of the MOBILE6.2-Mexico and MOVES-Mexico traffic emissions. Sci. Total. Environ. 2017, 584-585, 882–900. [Google Scholar] [CrossRef]
  47. Chen, S.; Du, Z.; Shi, X.; Liu, Y.; Li, S.; Shao, C.; Steve-Harold, K.W. MOVES-Beijing-based high spatial and temporal resolution ammonia emissions from road traffic in Beijing. Atmos. Environ. 2021, 256, 118443. [Google Scholar] [CrossRef]
  48. The Shenzhen Municipal People’s Government. Shenzhen atmospheric environmental quality improvement plan (2013–2016). 2013. Available online: http://www.sz.gov.cn/zfgb/2013/gb852/content/post_4952084.html (accessed on 6 December 2021).
Figure 1. Relationships among vehicle retention, PM, and NOX distribution in China in 2020.
Sustainability 13 13522 g001
Figure 2. The distribution of LNG fueling stations in Shenzhen city.
Sustainability 13 13522 g002
Figure 3. Box-plot of annual cost of three types of HDT. Note: the error bars for scenarios denote the variances under the normal distribution with 95% confidence interval.
Sustainability 13 13522 g003
Figure 4. Annual average PM2.5 emissions of four scenarios (The error bars for scenarios denote the variances under the normal distribution with 95% confidence interval).
Sustainability 13 13522 g004
Figure 5. Annual average NOX emissions of four scenarios (The error bars for scenarios denote the variances under the normal distribution with 95% confidence interval).
Sustainability 13 13522 g005
Figure 6. The average reduction rate of emissions under different scenarios: (a) the PM2.5 emission; (b) the NOX emission.
Sustainability 13 13522 g006
Table 1. Major properties of HDTs in Shenzhen city.
TypeContainer TruckEngineering Dump TruckEngineering Mixer TruckOthers
InternalLong-Haul
Sustainability 13 13522 i001 Sustainability 13 13522 i002 Sustainability 13 13522 i003 Sustainability 13 13522 i004 Sustainability 13 13522 i005
Main applicationsTransportation of goods in portTransportation of goods for a long distanceTransportation of sand, soil, etc., with a large open container that can pour goods onto the groundTransportation of concrete, with a mixer tankLogistics
Penetration of all HDTs (%)1%37%5%6%51%
LNG HDT performanceGoodModestModestModest-
Based on the investigation, survey and data of the Shenzhen Port and Freight Management Bureau.
Table 2. The PM2.5 emission and reduction of each scenario.
ScenariosPlanIntroductionEmissions in High-Temperature SeasonEmissions in Low-Temperature SeasonAnnual Emissions Annual ReductionAvg. Reduction Rate
S1-Maintaining the status quo895 t1210 t2106 t--
S2APromoting 15,000 China-V diesel HDTs609 t824 t1434 t672 t31.9%
BPromoting 15,000 LNG HDTs573 t774 t1345 t761 t36.0%
S3APromoting 35,000 China-V diesel HDTs455 t615 t1070 t1036 t49.2%
BPromoting 35,000 LNG HDTs368 t498 t866 t1240 t58.8%
S4APromoting 76,000 China-V diesel HDTs217 t293 t510 t1596 t75.8%
BPromoting 76,000 LNG HDTs 30 t40 t70 t2036 t96.7%
Note: Reduction is the difference between each promoting scenarios and Scenario 1.
Table 3. The NOX emission and reduction of each scenario.
ScenariosPlanIntroductionEmissions in High-Temperature SeasonEmissions in Low-Temperature SeasonAnnual Emissions Annual ReductionAvg. Reduction Rate
S1-Maintaining the status quo32,669 t30,344 t63,013 t--
S2APromoting 15,000 China-V diesel HDTs29,627 t27,518 t57,133 t5880 t9.3%
BPromoting 15,000 LNG HDTs27,352 t25,406 t52,747 t10,266 t16.3%
S3APromoting 35,000 China-V diesel HDTs25,996 t24,146 t50,078 t12,935 t20.4%
BPromoting 35,000 LNG HDTs20,689 t19,218 t39,894 t23,119 t36.7%
S4APromoting 76,000 China-V diesel HDTs20,309 t18,864 t39,103 t23,910 t37.8%
BPromoting 76,000 LNG HDTs 8763 t8140 t16,903 t46,110 t73.2%
Note: Reduction is the difference between each promoting scenarios and Scenario 1.
Publisher’s Note: MDPI stays neutral with regard to jurisdictional claims in published maps and institutional affiliations.

