Article

Changes in Volatile Organic Compounds from Salt-Tolerant Trichoderma and the Biochemical Response and Growth Performance in Saline-Stressed Groundnut

1
Indonesian Legumes and Tuber Crops Research Institute, Indonesian Agency for Agricultural Research and Development, Malang 65101, East Java, Indonesia
2
Indonesian Sweetener and Fiber Crops Research Institute, Indonesian Agency for Agricultural Research and Development, Malang 65152, East Java, Indonesia
3
Indonesian Center for Agricultural Biotechnology and Genetic Resources Research and Development, Indonesian Agency for Agricultural Research and Development, Bogor 16111, West Java, Indonesia
4
Indonesian Tropical Fruit Research Institute, Indonesian Agency for Agricultural Research and Development, Solok 27352, West Sumatera, Indonesia
5
Food and Health Cluster, School of Chemical Engineering, The University of New South Wales, Sydney, NSW 2052, Australia
6
Assessment Institute for Agricultural Technology of Central Java, Indonesian Agency for Agricultural Research and Development, Kabupaten Semarang 50552, Central Java, Indonesia
*
Author to whom correspondence should be addressed.
Sustainability 2021, 13(23), 13226; https://doi.org/10.3390/su132313226
Submission received: 30 September 2021 / Revised: 22 November 2021 / Accepted: 25 November 2021 / Published: 29 November 2021

Abstract

:
Soil salinity is one of the major obstacles that is limiting the growth and yield of groundnut. This study aims to investigate the effect of growth-promoting fungi, Trichoderma, on groundnut plants that were cultivated in saline conditions. Five different Trichoderma isolates were grown in four different NaCl concentrations. Selected Trichoderma were then applied to the groundnut seeds and their growth and development were monitored during the study. Growth inhibition, volatile organic compounds, chlorophylls, carotenoids, total phenolics and flavonoids, and minerals were assessed between the Trichoderma treatments. Increasing the salt concentration from 0.25–0.75 M decreased the growth of the Trichoderma isolates. The amounts and profiles of the volatile organic compounds from the T. asperellum isolate were significantly different to those in the T. virens isolate. In the vegetative growth stage, increased chlorophyll content was recorded in both the T. asperellum and T. virens-treated groundnut. The leaves that were obtained from the groundnut that was treated with T. virens T.v4 contained significantly higher indole-3-acetic acid (420 µg IAA/g) than the same plants’ roots (113.3 µg IAA/g). Compared to the control groundnut, the T. asperellum T.a8-treated groundnut showed increased phenolics (31%) and flavonoids (43%) and increased shoots and biomass weight at the generative growth stage. This study demonstrates that Trichoderma, with their plant growth promotion ability, could potentially be used to improve the growth of groundnut growing under salinity stress. Importantly, salt-tolerant Trichoderma could be regarded as a beneficial and sustainable way to improve the survival of salt-sensitive crops.

1. Introduction

Soil salinity is a limiting factor for plant growth and yield [1]. Salinity is emerging as a critical abiotic stressor. Approximately 20% of all global agricultural land is subject to salinity, this percentage is expected to increase to 30% by 2050 [2]. The impacts of soil salinity are exacerbated by low rainfall, high temperature, and the salt concentration inside the plant cells caused by concentration and exposure time [3,4]. The adverse effects of salinity in salt-sensitive crops include abnormal seed germination, reduced crop vigor, and poor vegetative and generative growth [5]. At the molecular level, salinity affects a range of physiological and biochemical processes. The disturbance of antioxidant enzymes and the formation of reactive oxygen species (ROS) leads to poor nutrient uptake, cell membrane disruption, and tissue damage [6,7,8,9]. Salinity stress also influences the photosynthetic pathway and pigments, soluble proteins, respiration, glycolysis pathway, and nitrogen fixation that collectively cause early senescence [6,7,8,9]. The accumulation of salt in the rhizosphere causes changes in the osmotic pressure and ion uptake balance, membrane dysfunction, and cell dehydration. It also alters water uptake and absorption through the roots, water use efficiency, relative water content, leaf water potential, and transpiration rate [6,7,8,10,11,12].
One of the approaches to mitigating the adverse effects of salinity is to manipulate the plant rhizosphere. The microbial environment around the plant’s root system plays a crucial role in nutrient and water uptake, as well as in soil anchorage [13,14]. Several rhizospheric microorganisms produce plant hormones, such as auxin-like signals, which can improve secondary root branching. These improvements in the roots’ architecture can enhance plant growth and increase plant biomass [6,15].
Trichoderma spp. are well-known saprophytic and endophytic fungi that are commonly used as antagonistic microorganisms in order to control soil-borne pathogens. In addition to having a role as biological control agents, these fungi promote plant growth by producing phytohormones such as indole acetic acids, cytokinin, gibberellins, and zeatin [16,17]. Trichoderma can also induce plant resistance and trigger deeper root growth, which enhances water absorption and nutrient uptake in plants that are under biotic and abiotic stress [18]. Trichoderma alleviates abiotic stress by inducing the expression of local and systemic defense mechanisms and the synthesis of antioxidant enzymes that reduce the number of ROS found in host plants [4]. In addition to the effects from direct contact, Trichoderma also affects plants indirectly by releasing volatile organic compounds. These volatiles can interact with plants and stimulate metabolite changes that improve plant growth [19].
Soil salinity not only limits plant growth and development, but also restricts the growth of soil microorganisms, including Trichoderma [20,21]. Nevertheless, several salt-tolerant Trichoderma species have been reported [11,21,22,23]. The application of salt-tolerant Trichoderma mitigates the negative effects of salinity in salt-sensitive crops such as rice, maize, wheat, tomato, and cucumber [11,22,24,25,26].
In a previous study, we applied salt-tolerant Trichoderma in order to improve the growth of groundnut in a saline environment [27]. This present paper reports the further study of this system, wherein we attempted to elucidate the interactions between the crop, microorganism, and various conditions of abiotic stress. Our aims were to (i) determine the effect of salt on the in vitro growth of Trichoderma; (ii) identify the volatile organic compounds (VOCs) that were released by Trichoderma in salt media; and (iii) evaluate the biochemical changes in groundnut which was treated with the salt-tolerant Trichoderma and cultivated in saline environment.

2. Materials and Methods

2.1. Selection of Salt-Tolerant Trichoderma

Five Trichoderma isolates, specifically two isolates of T. virens and three isolates of T. asperellum, were obtained from the Indonesian Legumes and Tuber Crops Research Institute’s collections [28,29]. The Trichoderma isolates (T. virens T.v4, T. virens T.v3, T. asperellum T.a1, T. asperellum T.a5, and T. asperellum T.a8) were known to have antagonistic activity and plant growth-promoting effects in leguminous crops. In preparation for salt-tolerance trials, the isolates were grown on potato dextrose agar (PDA) and incubated for 3 days. A 5 mm mycelial plug from each isolate was placed on PDA containing 0.25, 0.50, 0.75, or 1.00 M of sodium chloride (NaCl). The diameter of each isolate was measured and used to calculate the percentage of growth inhibition [20]. Six replicates were prepared for each concentration of NaCl.

2.2. Identification of Volatile Organic Compounds from Salt-Tolerant Trichoderma

The methods that were used to prepare the Trichoderma cultures and to determine the VOCs were adopted from Inayati et al. [30]. Initially, T. virens T.v3 and T. asperellum T.a8 were separately grown on PDA containing 0.50 M of NaCl for 4 days. A mycelial plug of each isolate was then sub-cultured into a 20 mL headspace vial containing the same media. The vials were incubated for 48 h at 25 °C.
The VOCs that were produced by both isolates were extracted by solid phase micro extraction (SPME), whereby fiber sorbents that were coated with 65 µm of polydimethylsiloxane (PDMS)/divinylbenzene (DVB) were set up in the autosampler. Samples were extracted for 30 min then analyzed by GC-MS (Trace 1310 GC-MS, Thermo Scientific, Waltham, MA, USA). The oven temperature was programmed as follows: 0–2 min at 40 °C; 2–12 min at 40–200 °C; 12–17 min at 200–260 °C; and then 17–22 min at 260 °C. The spectra were identified using the NIST Mass Spectral Library version 2.2 (Gaithersburg, MD, USA) and Wiley Spectral Library 10th edition (John Wiley and Sons Inc, Hoboken, NJ, USA).

2.3. Trichoderma Conidia and Salinity Treatments for Seeds

The groundnut seeds were provided by the seed production unit of the Indonesian Legumes and Tuber Crops Research Institute. Conidia from four of the Trichoderma strains were harvested after 7 days of culture and made into suspensions (1 × 10⁶ CFU/mL). The groundnut seeds were placed in the conidial suspensions according to a randomized block design with four replicates per Trichoderma treatment, as described by Taufiq and Yusnawan [27]. Non-treated seeds were included in the study and served as control samples (T0 = without Trichoderma). The seeds treated with the four different Trichoderma were identified as T1 (treated with T. virens T.v4), T2 (treated with T. virens T.v3), T3 (treated with T. asperellum T.a8), and T4 (treated with T. asperellum T.a1).
The seeds were then grown in saline soil, which had been treated with 69 kg N/ha of fertilizer. The soil was characterized by slightly high pH (8.0), low N (0.18%), high P2O5 (115 ppm), high K (1.14 me/100 g), and 13.75% Na saturation [27]. All of the other conditions regarding cultivation (i.e., plot dimensions, inter-row spacing, planting density, and sowing method), fertilizer applications, irrigation, and pest management were adopted from a previous study [27]. The samples of groundnut were collected from 30 plants and they were taken diagonally from each plot of 9 × 10 m. Each sample representative was collected from ten plants.

2.4. Chlorophyll Content in Groundnut Leaves

Chlorophyll a (Chl a), chlorophyll b (Chl b), and carotenoids (Car) were extracted from the samples as follows [31]. The fresh groundnut leaves were ground in liquid nitrogen and then extracted in 90% (v/v) methanol/demineralized water. The samples were sonicated, vortexed for 5 min, and centrifuged at 2968× g for 10 min (Thermo Scientific Megafuge 40R, Waltham, MA, USA). The absorbance (A) of the supernatants was measured using a spectrophotometer (Hitachi Double Beam UH5300, Tokyo, Japan). The presence of Chl a, Chl b and Car was quantified and the concentrations were expressed in mg per g of sample, as follows:
Chl a = 16.82 A665.2 − 9.28 A652.4
Chl b = 36.92 A652.4 − 16.54 A665.2
Car = (1000A470 − 1.91 Chl a − 95.15 Chl b)/225

2.5. Determination of Indole-3-Acetic Acid (IAA) Synthase in Groundnut

The IAA synthase concentrations in the groundnut root and leaf samples were estimated according to Inayati et al. [28]. Briefly, 0.5 g of plant tissue was finely ground, mixed with 10 mL of 0.05 M phosphate buffered saline, vortexed, and then centrifuged. The supernatant was mixed with 50 μL of MnCl2, 10 μL of MgSO4, 1.5 mL of PBS, and 500 μL of L-tryptophan and then incubated at 37 °C for 30 min. The mixture was incubated at 37 °C for a further 30 min after the addition of Salkowski reagent. The absorbance at 530 nm was measured using a spectrophotometer. The IAA was expressed as µg IAA per gram of sample. The samples were prepared in triplicate and the IAA solution was used as the standard.

2.6. Determination of Total Phenolic and Flavonoid Contents

The total phenolic content and total flavonoid content in the groundnut shoots were estimated according to Yusnawan and Inayati [32] with minor modifications. Fresh samples were ground in liquid nitrogen in triplicate and kept in 80% (v/v) methanol overnight in the dark. The samples were centrifuged, and the resulting supernatant was used in the total phenolic and total flavonoid assays.
The total phenolic content of the samples was estimated, after the addition of Folin–Ciocâlteu reagent, by means of quantification against a gallic acid calibration curve. The total phenolic content was expressed in gallic acid equivalent (mg GAE/g).
The total flavonoid content was estimated after the addition of aluminum chloride and quantification against a catechin calibration curve. The total content of flavonoids was expressed in catechin equivalent.

2.7. Determination of Minerals

The minerals were extracted using nitric acid and perchloric acid. The analyses of the sodium, potassium, and calcium that was present in the groundnut plants were determined by using atomic absorption spectrometry (Shimadzu AA-7000, Kyoto, Japan) [33].

2.8. Statistical Analysis

The Trichoderma growth inhibition, plant growth, and biochemical data were statistically analyzed using Team R (RStudio Integrated Development for R, RStudio, Inc, Boston, MA, USA). The level of significance was reported by the Least Significance Difference (LSD) at a p-value of 0.05. The top 40 compounds of the VOCs were clustered and visualized in a heatmap using MetaboAnalyst 5.0 (https://dev.metaboanalyst.ca/, accessed on 2 November 2021).

3. Results

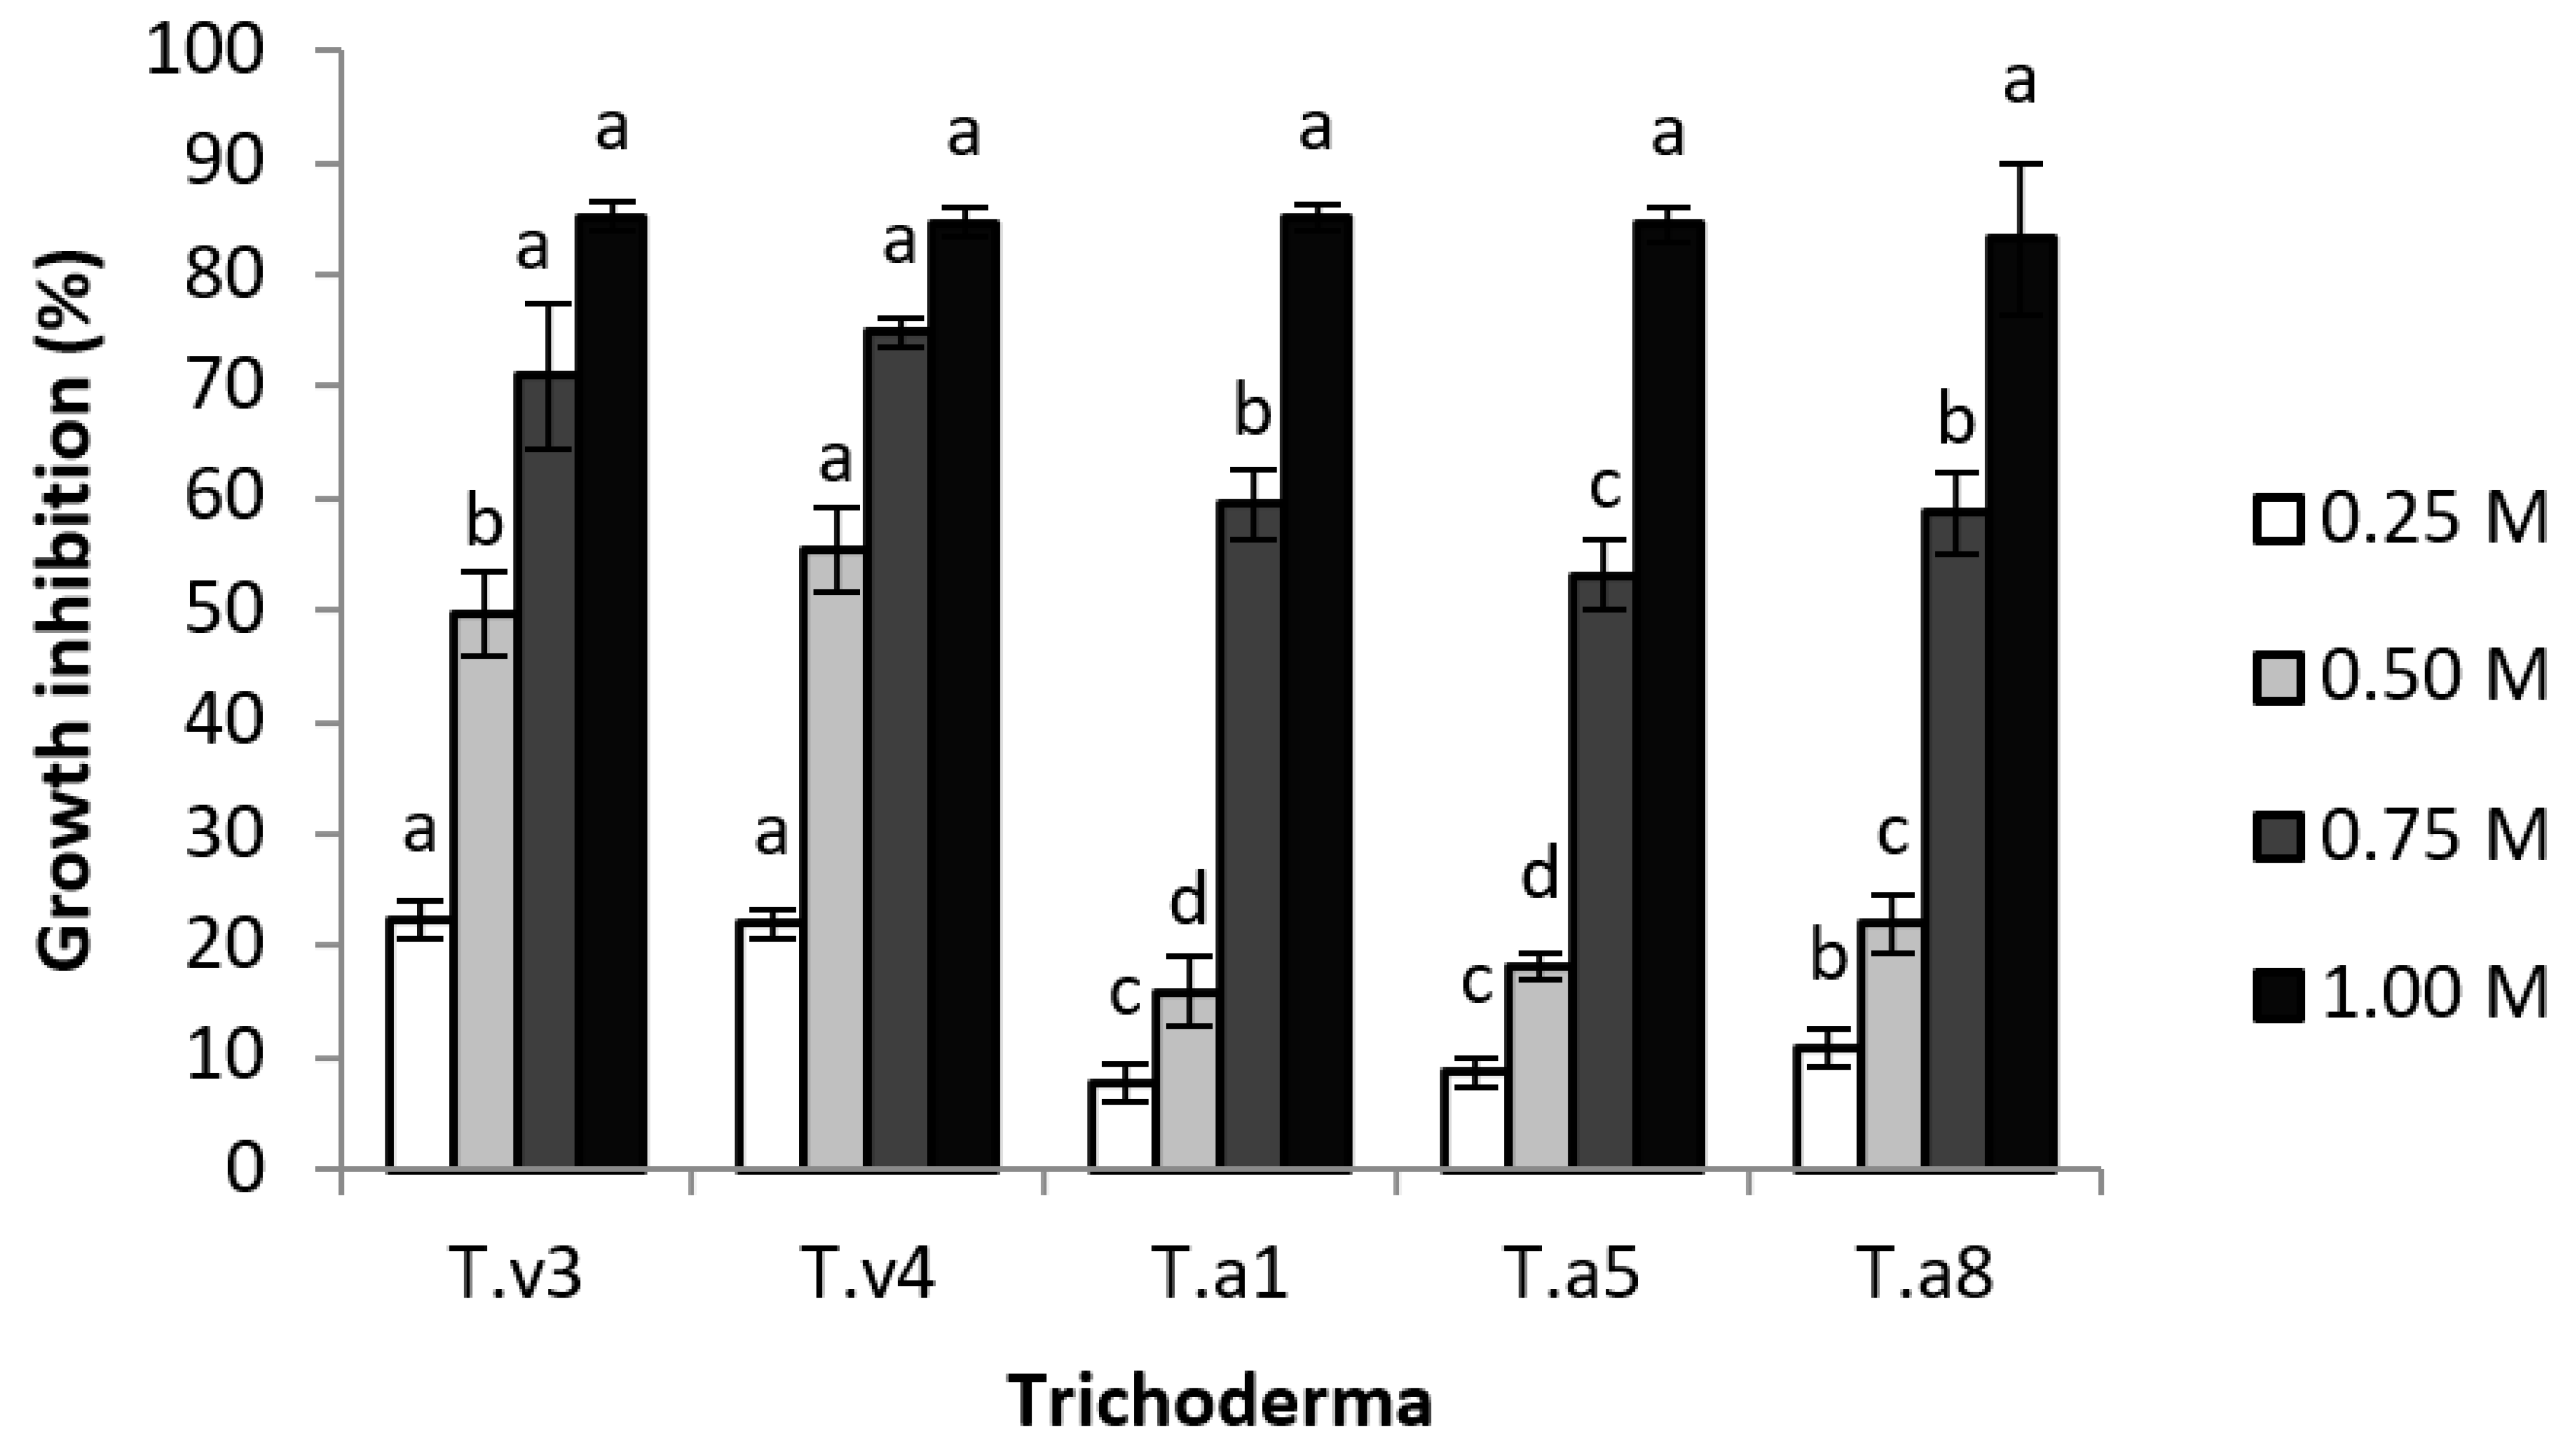
3.1. Growth Inhibition of Trichoderma in PDA Containing Salt

After 4 days incubation, there were significant differences in the growth inhibition of the five Trichoderma isolates that were treated with 0.25, 0.5 and 0.75 M of NaCl (Figure 1). The Trichoderma isolates that were treated with 1 M of NaCl did not show a significant difference in mycelial growth. The Trichoderma isolates without added NaCl (the control condition) grew without any inhibition and fully covered the Petri dish. At the lowest salt concentration (0.25 M of NaCl), T. virens T.v3 and T.v4 suffered from the salinity stress; this is indicated by their having a higher rate of growth inhibition (22.2–22.4%) compared to the T. asperellum T.a1, T.a5, and T.a8 isolates (7.8–10.9%). Overall, increasing the NaCl concentration to 0.75 M also increased the growth inhibition between the Trichoderma isolates and the difference was significant. The greatest growth inhibition rate (74.8%) was found in T. virens T.v4. The T. asperellum T. a1, T.a5, and T.a8 isolates exhibited growth inhibition rates ranging from 53–59% when treated with 0.75 M of NaCl, which were lower than that of T. virens T.v4. When incubation was extended to 7 days, the mycelial growth of the 0.25 and 0.50 M-treated isolates covered the Petri dishes, but the isolate that was grown in 0.75 M of NaCl was unable to reach the edge of the Petri dish.

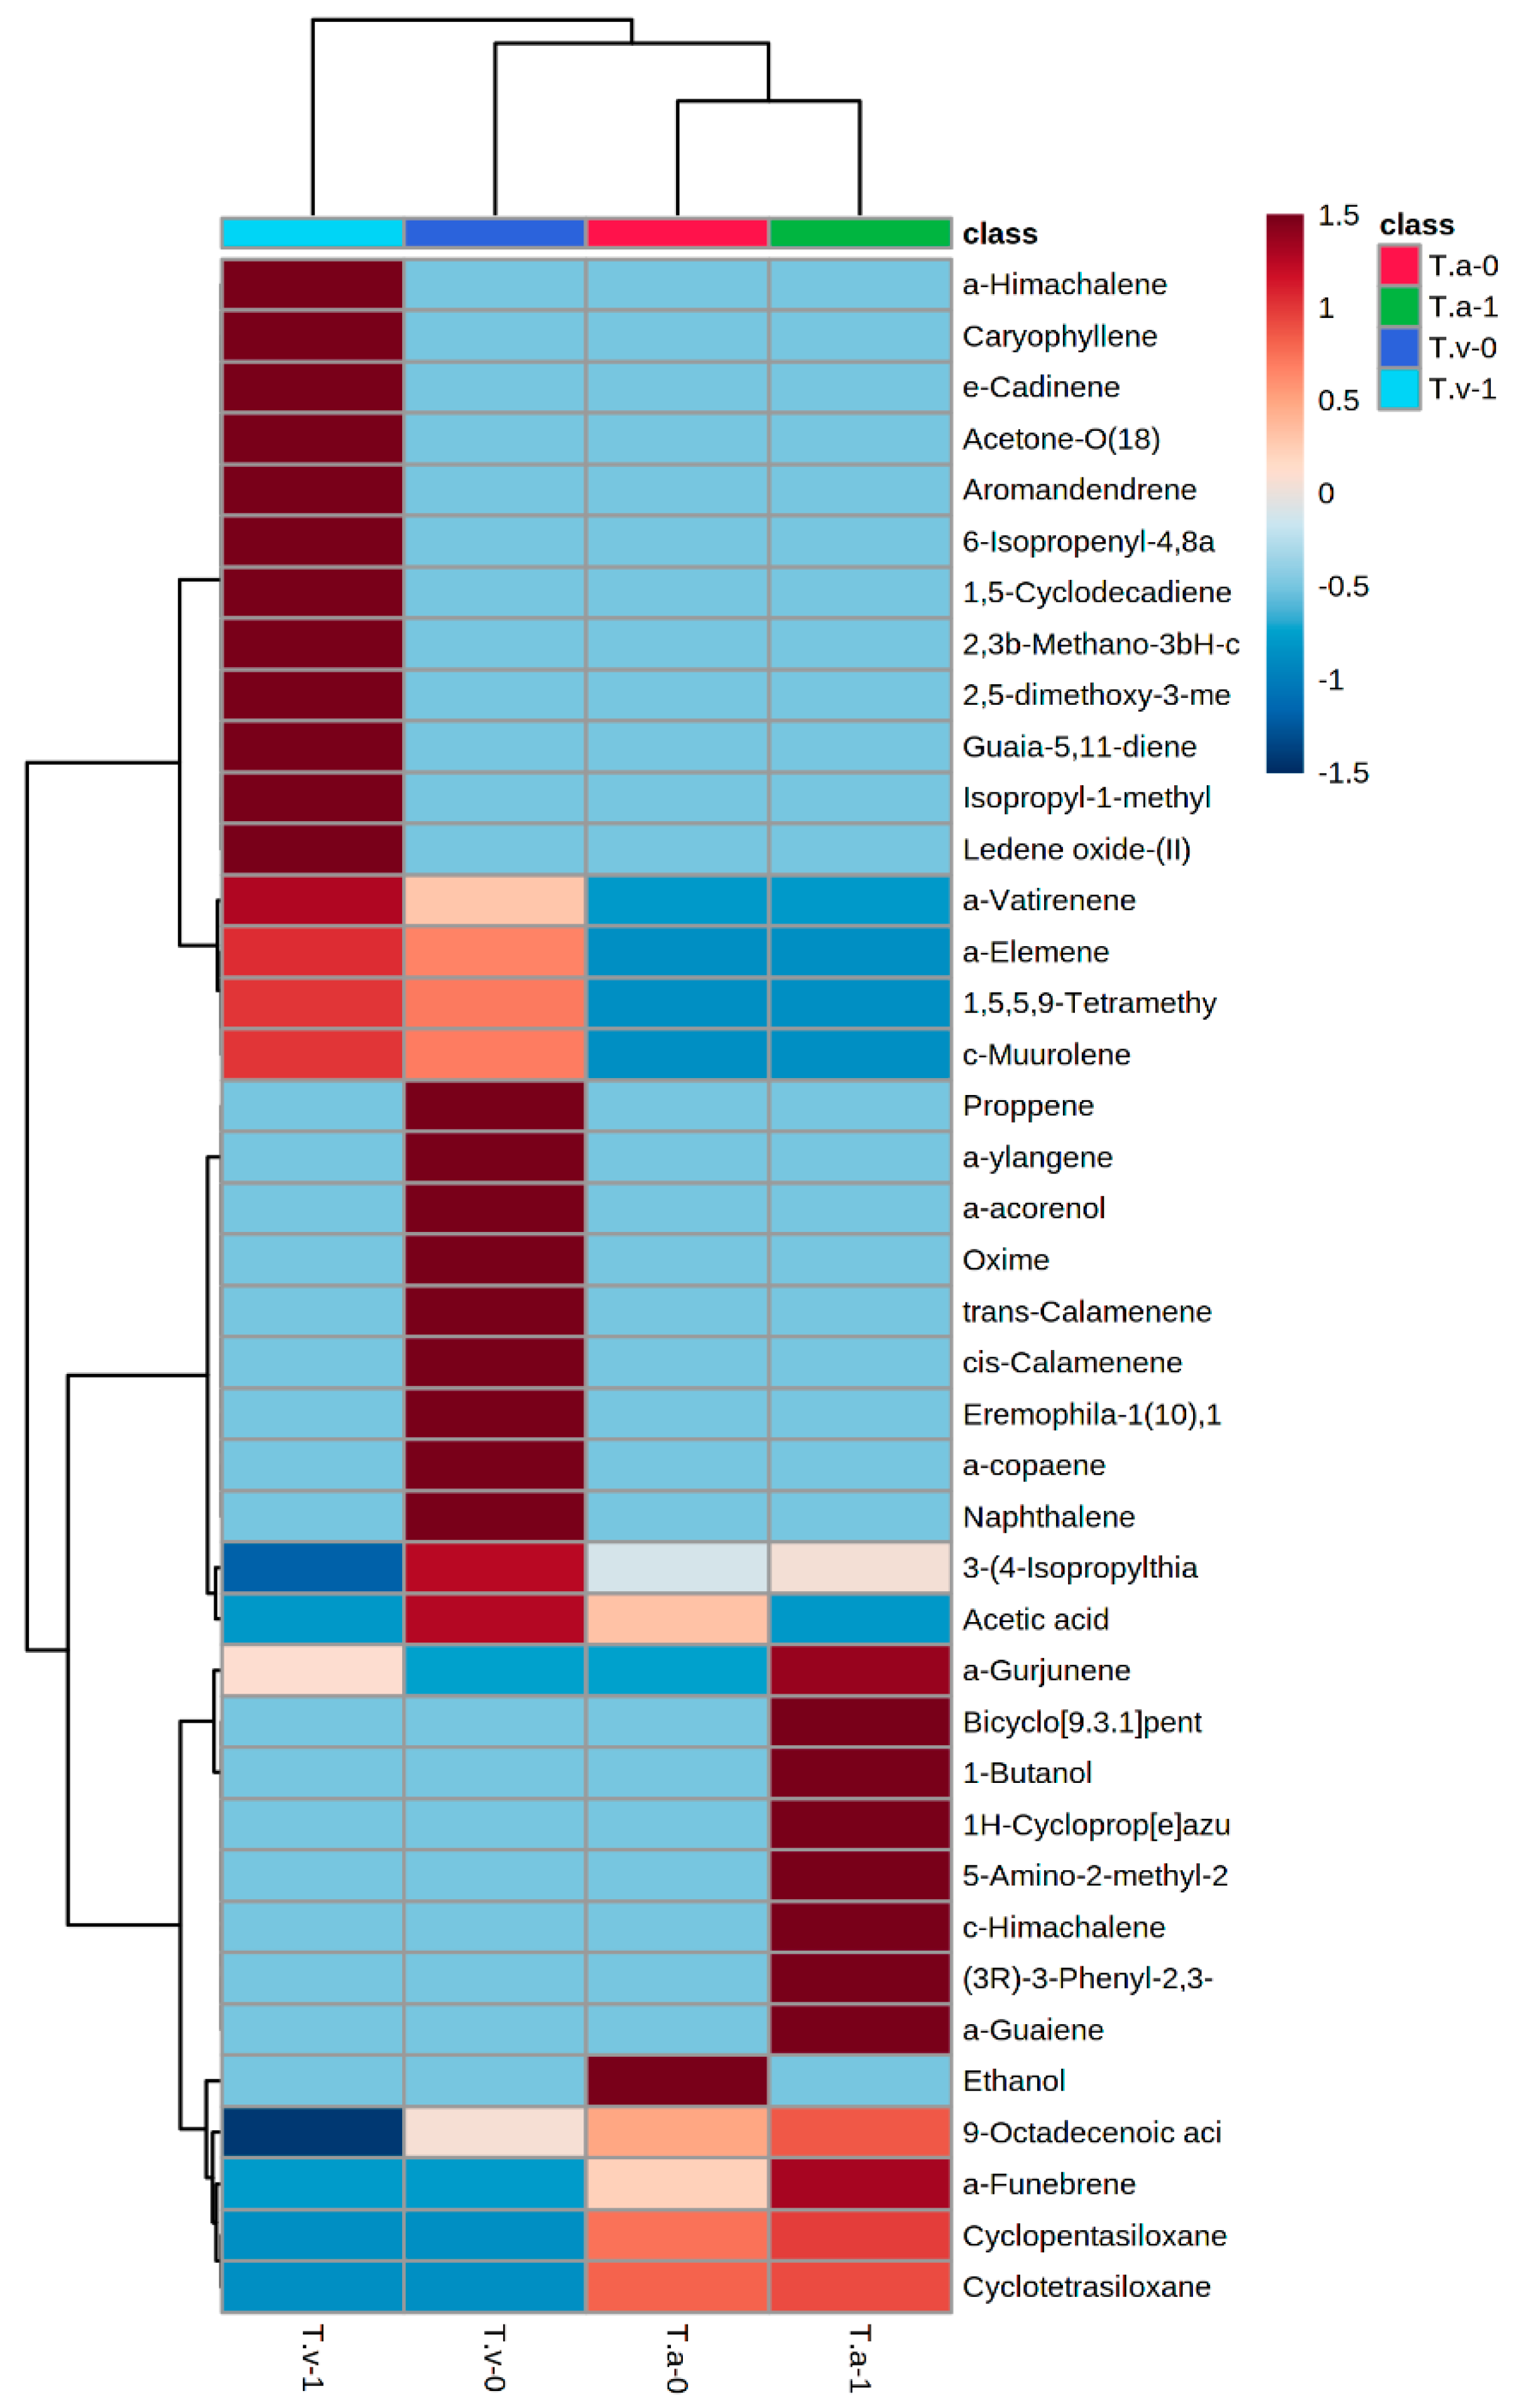
3.2. Identification of Volatile Organic Compounds from Salt-Tolerant Trichoderma

The VOCs that were released by the T. asperellum T.a8 and T. virens T.v3 isolates that were grown for 4 days in 0.50 M of NaCl were identified for comparison. The heatmap (Figure 2) shows that there were significant differences in the amount of VOCs and the VOC profiles between the samples. The volatile compounds from T. virens T.v3 that were present in high amounts are: isoprophyl-1-methyl, ledene oxide, and acetone. Whilst trans-calamenene, cis-calamenene, naphthalene, and ylangene were predominantly found in the T. virens isolates that were grown in media without salt. The amounts of gurjunene, butanol, and himachalene that were identified in T. asperellum T.a8 were relatively higher than those of other volatiles. The T. asperellum control (i.e., the condition that was not treated with NaCl) released mainly ethanamine, cyclododecasiloxane, and cyclopentasiloxane, thus showing a different profile. The only volatile that was identified in both T. virens T.v3 and T. asperellum T.a8 was azulene, though the amount was relatively low.

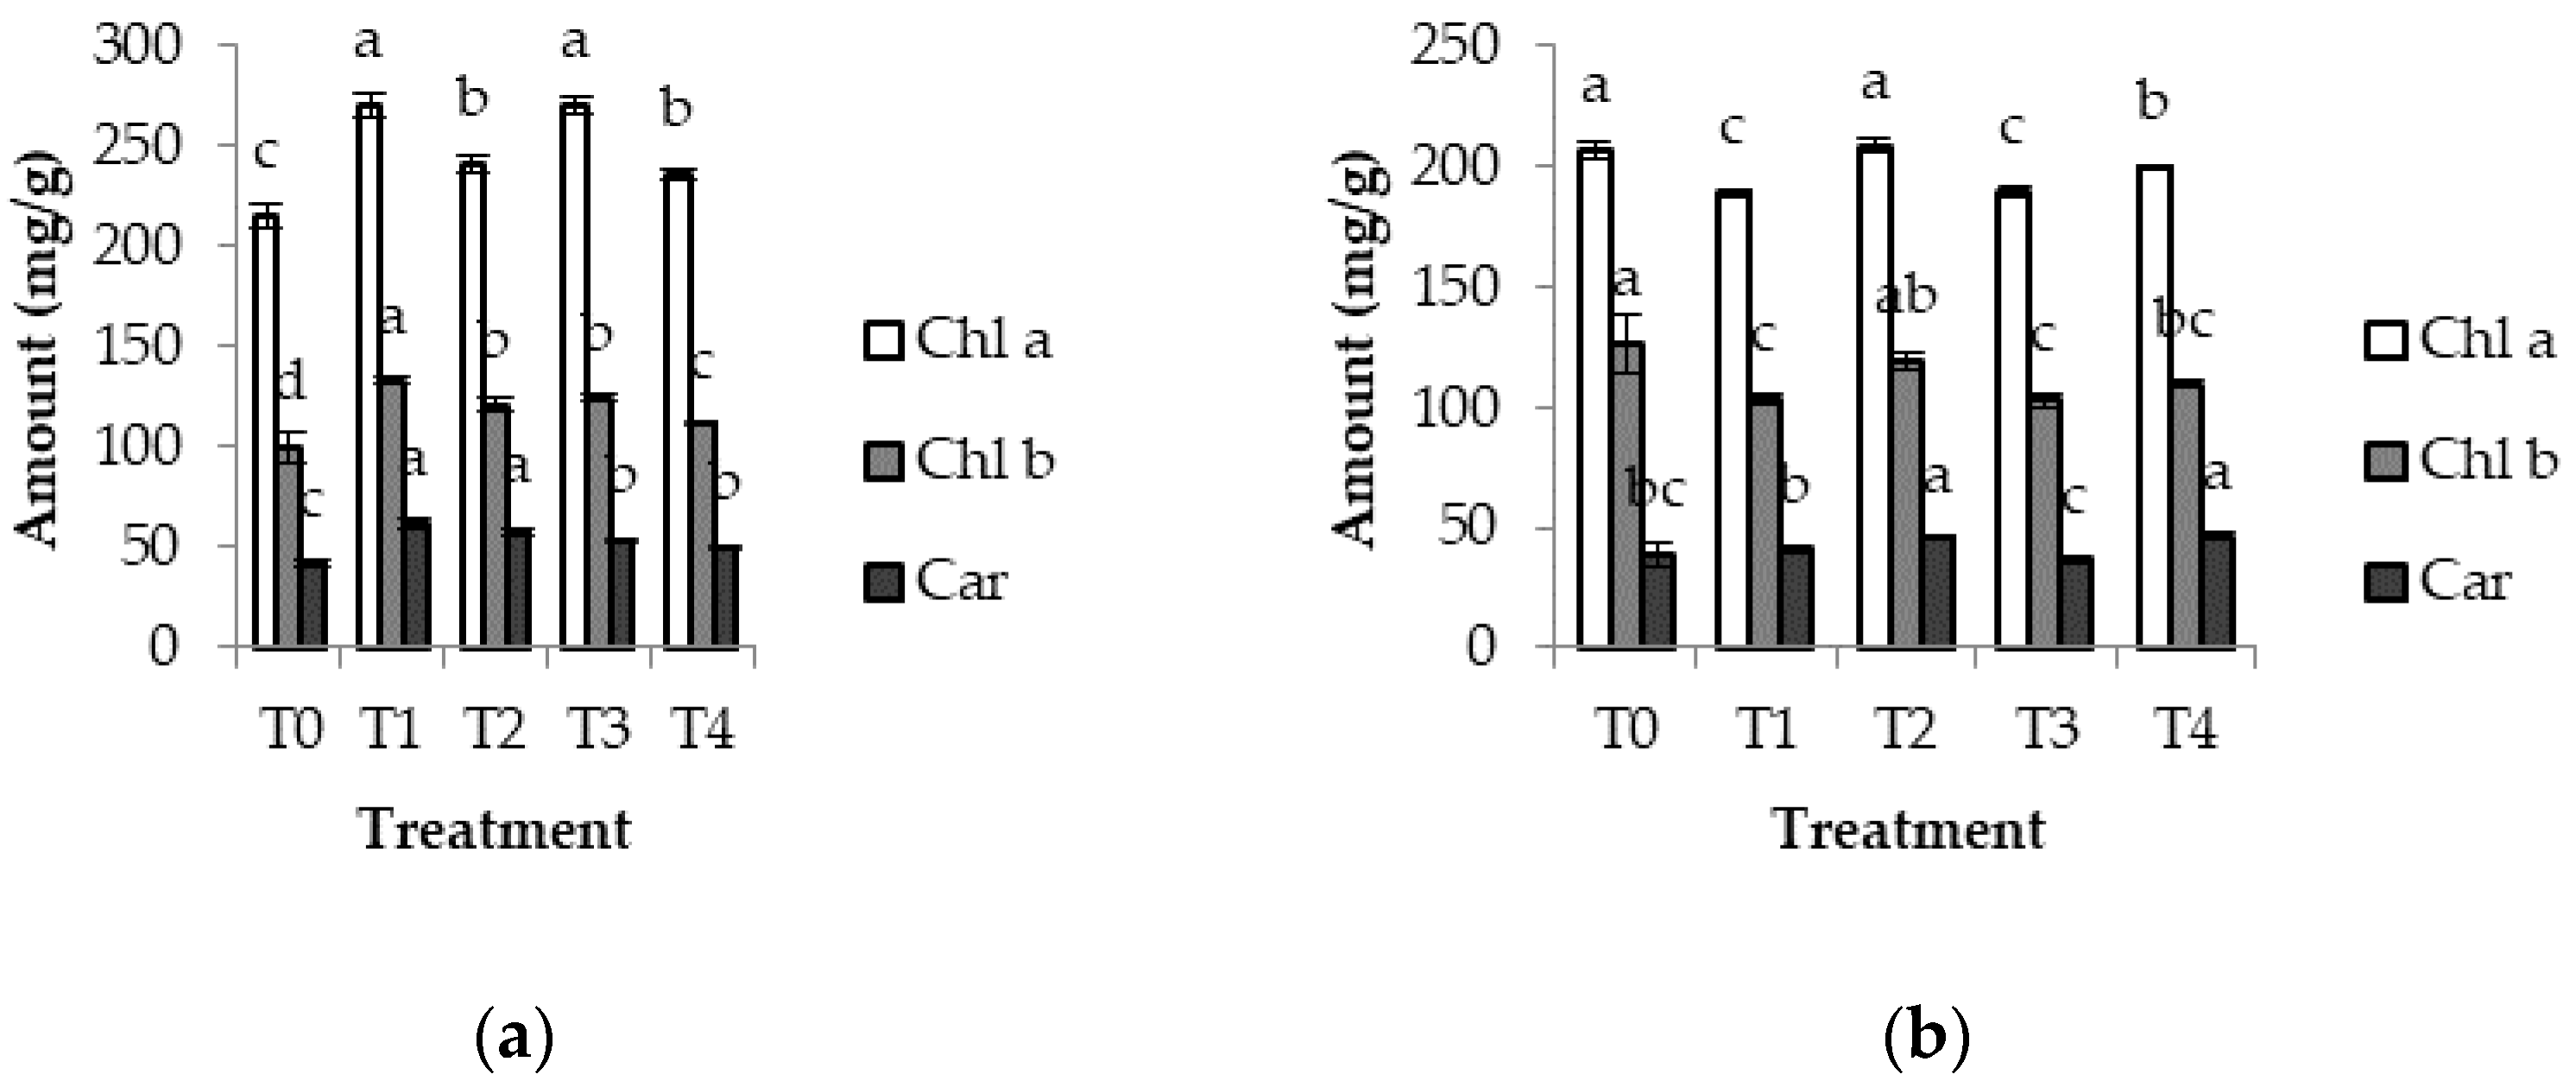
3.3. Chlorophyll Content

In the vegetative growth stage, the levels of chlorophyll a (Chl a), chlorophyll b (Chl b), and carotenoids (Car) significantly increased in the groundnut that was treated with T. virens and T. asperellum compared to the control groundnut (Figure 3). The level of Chl a showed an increase from 9.9–28.1%, the Chl b increased from 11.4–33.0%, and the Car increased from 18.3–46.2%. The highest amount of Chl a (270 mg/g) was discovered in the groundnut that was treated with T. virens T.v4 and T. asperellum T.a8. However, the Chl b and Car contents in the groundnut that were treated with T. virens T.v4 were greater than those in T. asperellum T.a8.
In the generative growth phase, the groundnut control contained a higher level of Chl a and Chl b than the other treated groundnut samples, except those treated with T. virens T.v3. During the vegetative growth phase, the amounts of Chl a, Chl b and Car in the control groundnut were lower than in the treated ones. Whilst, in the generative growth phase, the Chl b level in the control was higher than that of the treated counterparts.

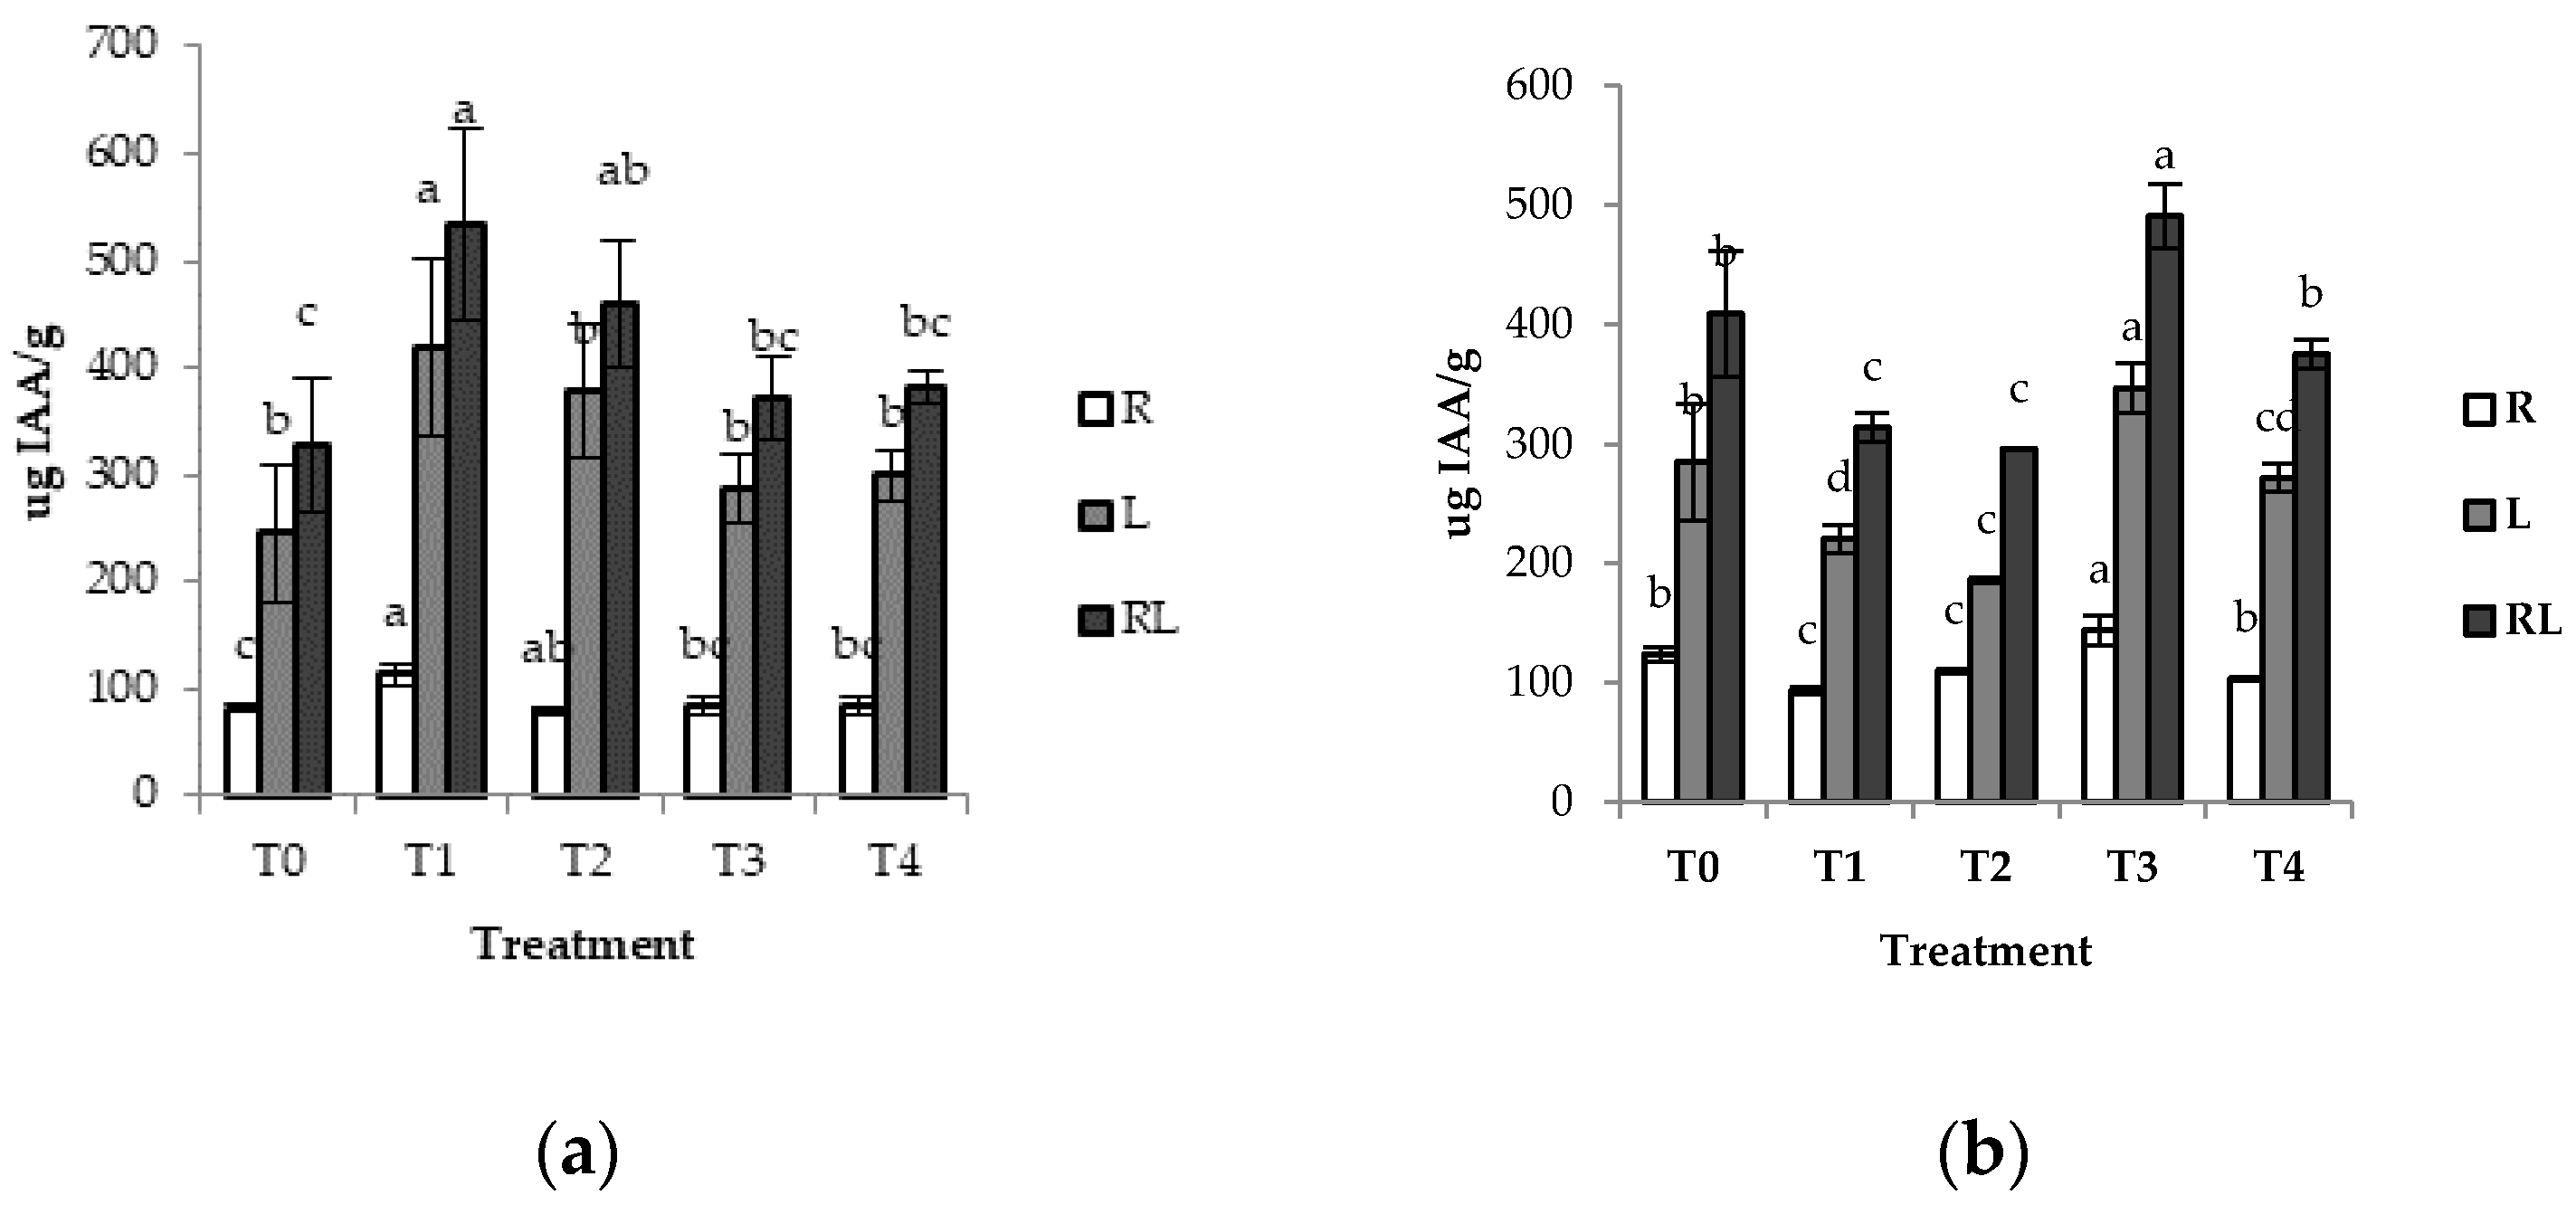
3.4. Determination of Indole-3-Acetic Acid (IAA) Synthase

IAA synthase naturally occurs in plants and this study measured the IAA synthase concentrations present in the plants’ roots and leaves after being exposed to Trichoderma. During both the vegetative and generative growth stages, the measured amount of IAA synthase in the leaves was higher than that in the roots. In the vegetative growth phase, the plants that were treated with T. virens T.v4 (T1) had the highest accumulation of IAA synthase compared to other treatments; specifically, the leaves contained 420 µg/g and the roots 113 µg/g. In general, T. virens T.v4 (T1) apparently increased IAA synthesis in roots and leaves compared to T. asperellum (Figure 4). However, in the generative growth stage, T. virens T.v3 (T2) and T. virens T.v4 (T1) decreased IAA synthesis compared to the T. asperellum isolates. Interestingly, the highest level of IAA synthase was found in the groundnut that was treated with T. asperellum T.a8 (T3) during the generative growth phase; the amount of IAA synthase in the roots and leaves was 144 and 347 µg/g, respectively.

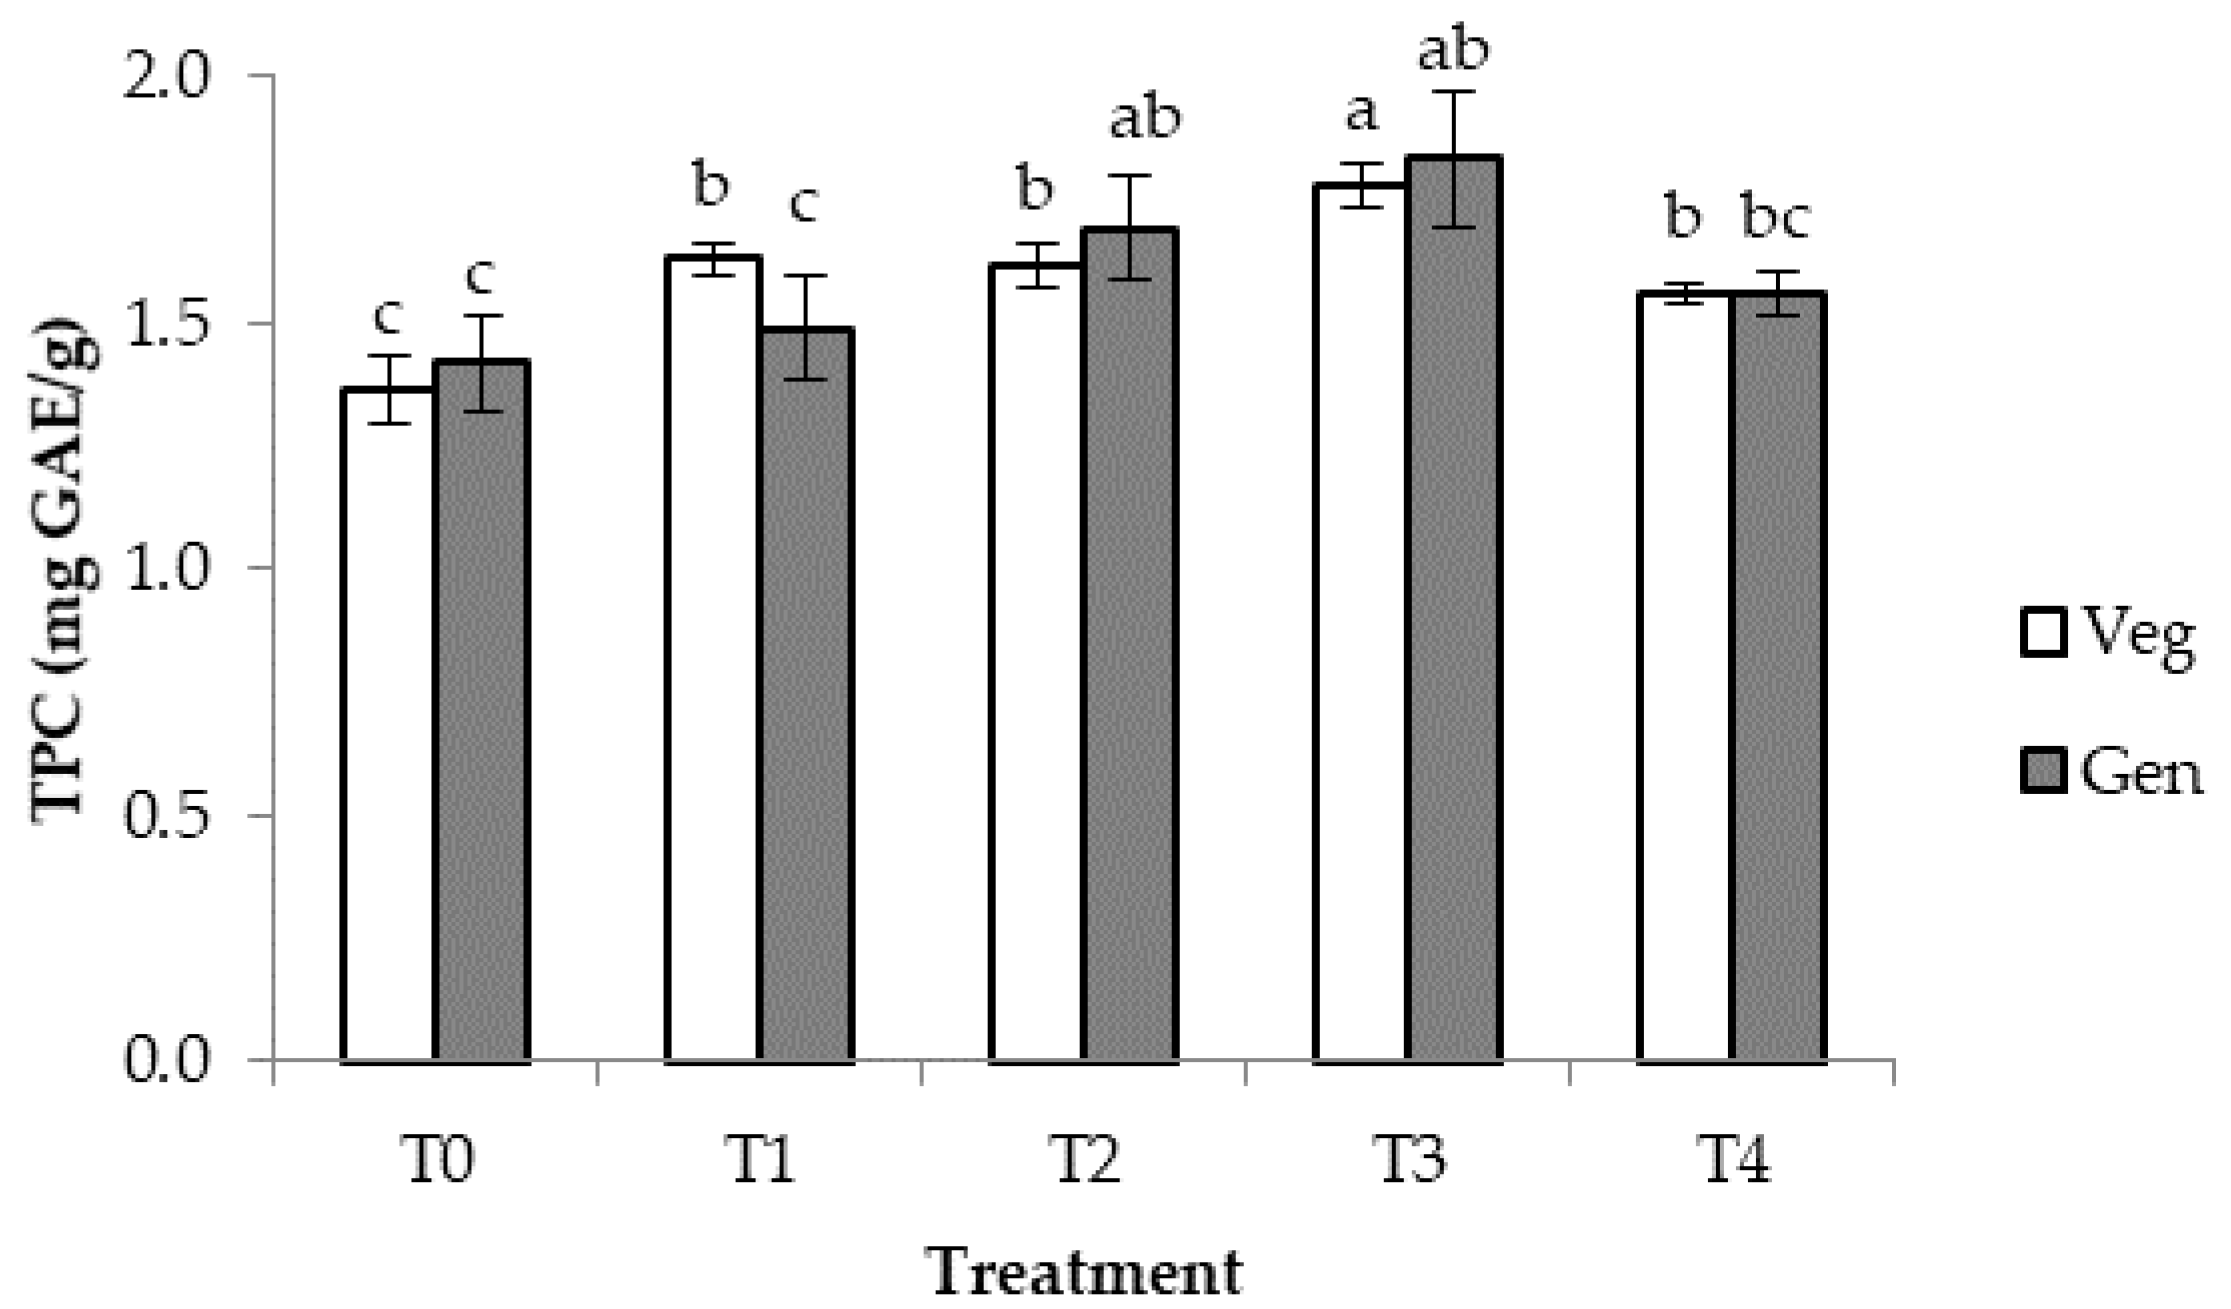
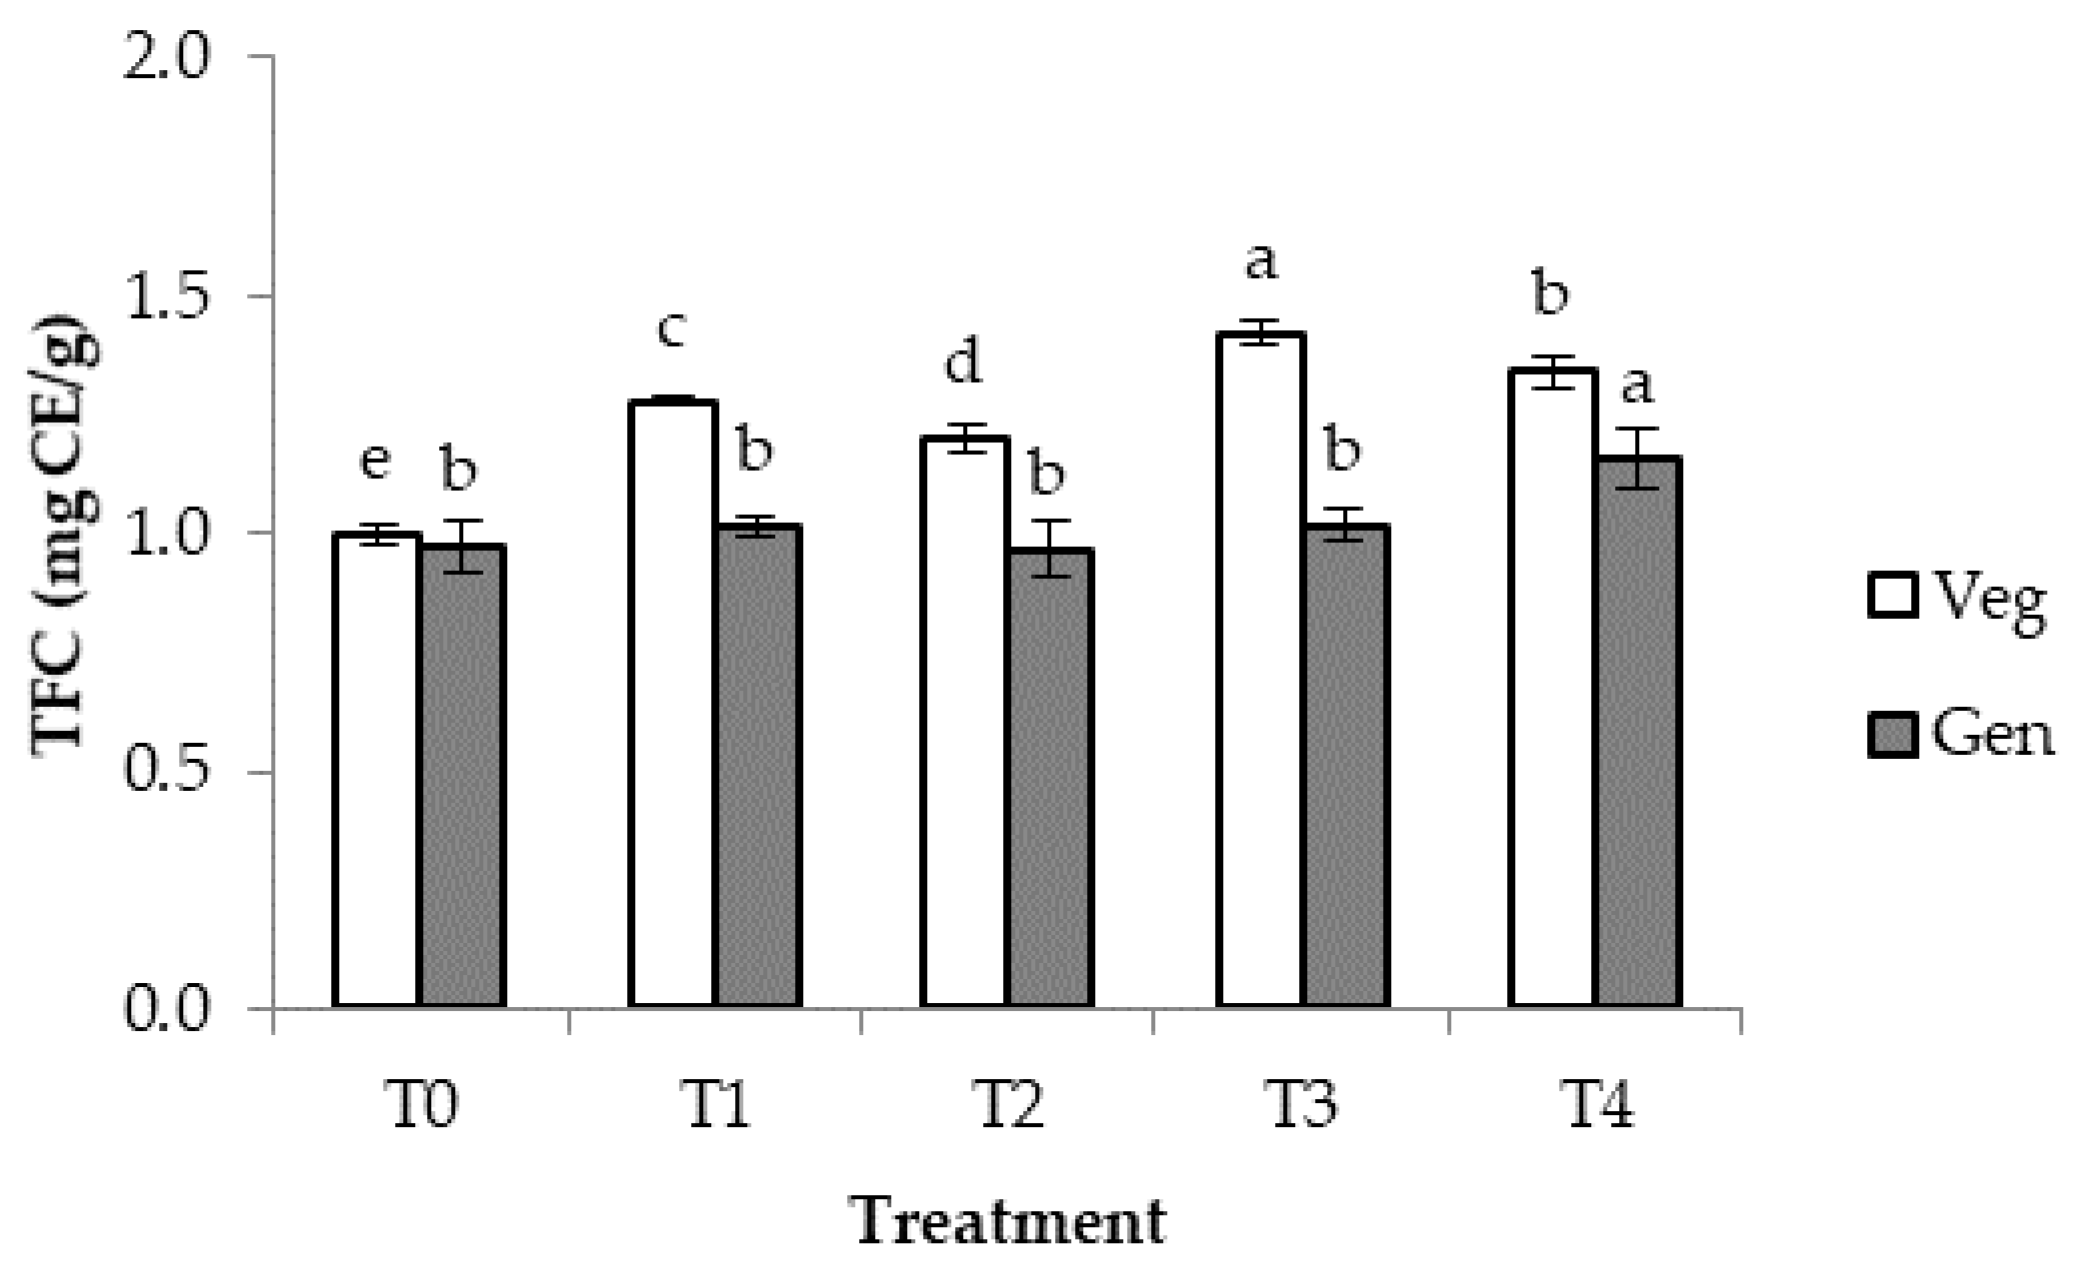
3.5. Total Phenolic and Flavonoid Contents at Vegetative and Generative Growth Stages

The phenolic contents in the treated and control samples were comparable, ranging between 1.4–1.8 mg/g GAE (Figure 5). In the vegetative growth stage, treatment with T. virens (T1 and T2) and T. asperellum (T3 and T4) increased the phenolic content in the treated groundnut compared to the control groundnut. The groundnut that was treated with T. asperellum T.a8 (T3) had a 30.6% higher phenolic content than the control and higher than that of the T. asperellum T.a1 (T4) treatment. The highest phenolic content was 1.83 mg/g GAE, this was determined in the T. asperellum Ta.8-treated groundnut (T3) during the generative growth stage; this represents a 34.5% higher phenolic content than that of the control.
The flavonoid content in the treated groundnut was higher than that of the control samples, particularly in the vegetative growth stage (Figure 6). The groundnut that was treated with T. asperellum T.a8 (T3) and T.a1 (T4) had a higher flavonoid content than the other treatments. This shows that the T. asperellum T.a8 (T3) and T.a1-treated (T4) groundnut had greater phenolic and flavonoid contents than the control. Flavonoid content also increased from 20.5% (T2) to 42.7% (T3) at the vegetative growth stage (Figure 6), and elevated from 1.9% (T3) to 16.4% (T4) at the generative growth stage.

3.6. Changes in Growth Parameters

The seeds that were treated with T. virens and T. asperellum showed a 28.4–32.9% increase in shoot height during the vegetative growth stage, compared to the control (Table 1). However, there were no differences in the root lengths or the dry weights of the shoots, roots and dry biomasses between the control and the sample that was treated with T. asperellum T.a8 (T3). During the generative growth phase, the treatment with T. asperellum T.a8 (treatment T3) led to increased dry weight of shoots and the biomass of 45.3% and 44.2%, respectively (Table 2).
The different superscripts within the columns of Table 1 and Table 2 correspond to significant differences between treatments, based on the LSD test (p < 0.05). T0 = without Trichoderma, T1 = T. virens T.v4, T2 = T. virens T.v3, T3 = T. asperellum T.a8, and T4 = T. asperellum T.a1.

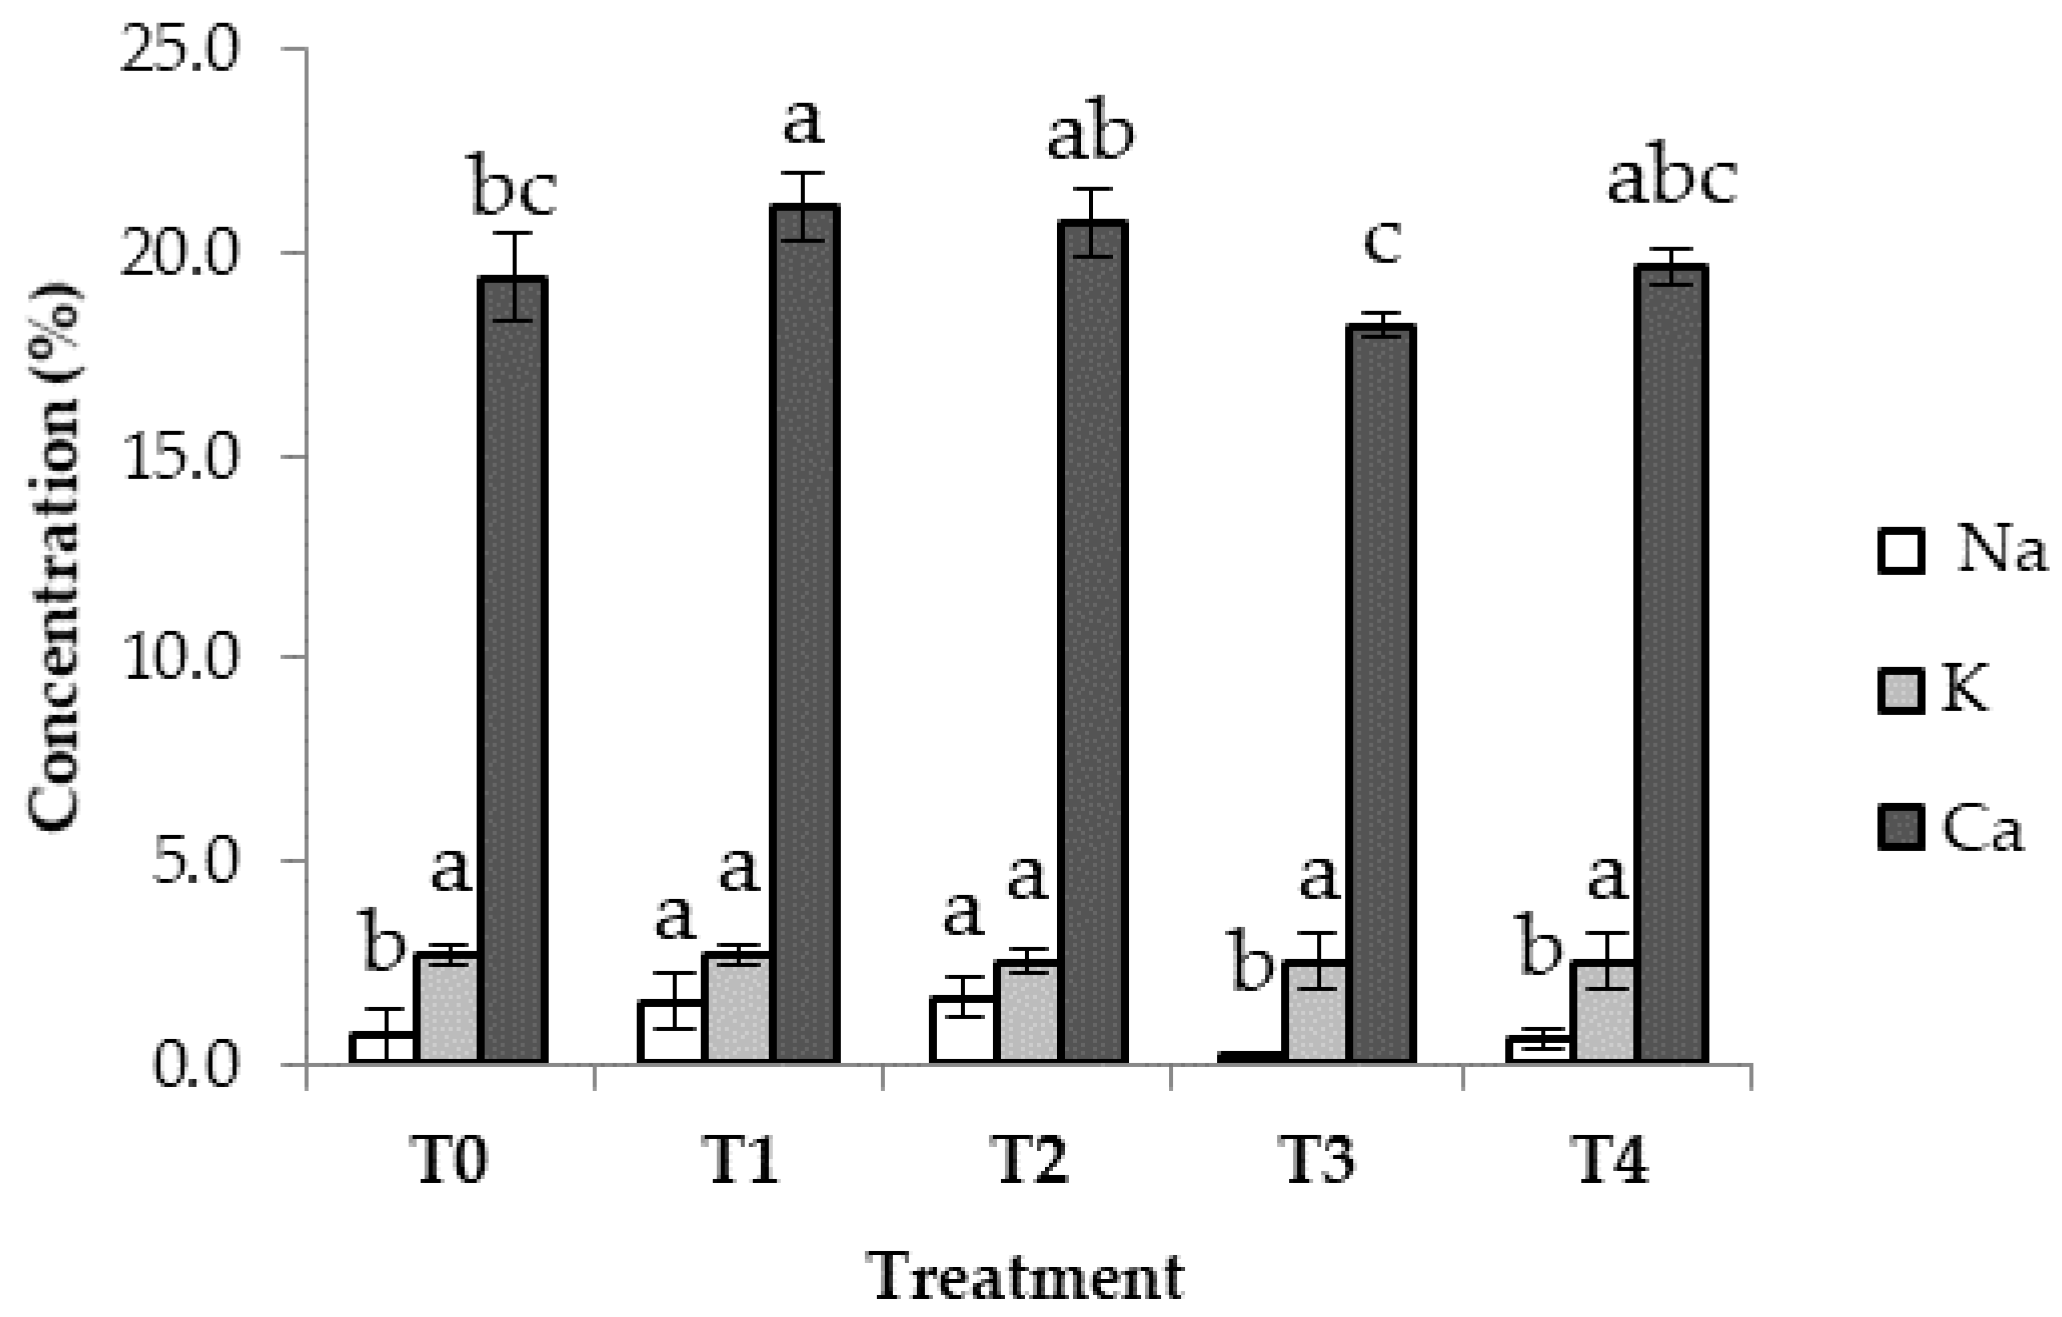
3.7. Minerals in Groundnut Plants

The absorption of sodium (Na) in the groundnut plants that were treated with T. virens was 1.2–1.3-fold higher than the absorption that was seen in the control plants (Figure 7). The potassium (K) concentration in the groundnut that was treated with either T. virens or T. asperellum was similar to that of the control plants. Only the samples that were treated with T. virens T.v4 exhibited increased calcium (Ca) absorption compared to the control samples.

4. Discussion

4.1. Growth Inhibition of Trichoderma

Our experimental data indicate that the isolates of T. virens were more sensitive to sodium than those of T. asperellum, this was the case even when sodium was added to the growth media at the lowest concentration of 0.25 M. The salt tolerance of Trichoderma is likely to depend on the isolate, concentration, and duration of the NaCl exposure. According to Ben Alaya et al. [34], microorganisms that are exposed to high NaCl concentrations in growth media subsequently determine the degree of growth suppression. This is possibly due to the suppression of cellulase and polygalacturonase enzymes.
Our study showed that as NaCl concentration increased so too did the level of growth inhibition of Trichoderma. This is consistent with previous work by Rawat et al. [11]. In their study, Trichoderma isolates were subjected to lower NaCl concentrations (0.07–0.24 M) than in the current study. At 0.24 M of NaCl, the highest salt concentration in study by Contreras et al. [16], one Trichoderma isolate reached a maximum linear growth of 8.8 cm after 4 days of incubation. This is similar to our data, where the growth inhibition in isolates treated with T. asperellum T.a1 and T.a8 showed 8.0 and 8.2 cm of linear growth.
Variation in the salt tolerance of Trichoderma has been observed in both commercial and native Trichoderma isolates. There are reports of 61.2% growth inhibition in Trichoderma that was treated with 0.34 M of NaCl for 4 days [23]; 83–85% from treatment with 1 M of NaCl; and 45% from treatment with 1.4 M of NaCl [21]. A plausible reason for this growth inhibition could be that higher NaCl concentrations slow down the development and growth of Trichoderma, thus causing morphological changes in both the mycelia and conidia [23].

4.2. Volatile Organic Compounds of Salt-Tolerant Trichoderma

The main VOCs that were released by T. virens (isoprophyl-1-methyl, ledene oxide, and acetone) differed from those released by T. asperellum (gurjunene, butanol, and himachalene). The VOCs that were produced by Trichoderma following exposure to 0.5 M of NaCl are suggested to possess antibacterial, antifungal, and antioxidant properties, with roles in cellular repair and as pheromones [19,35,36,37,38]. For instance, himachalene functions as an antioxidant that is capable of reducing singlet oxygen activity in plants that are exposed to abiotic stresses. It is also involved in repairing cell damage [37].

4.3. Chlorophylls in Groundnut

The increased chlorophylls that were found in the Trichoderma-treated roots and leaves of the groundnut are consistent with the results that have been reported in other studies. For example, the total chlorophylls in Mentha piperita were approximately 20% higher when treated with VOCs of Bacillus amyloliquefaciens [39], while the chlorophyll content in Arabidopsis thaliana increased following treatment with VOCs from Trichoderma [40]. Our results indicate that the Trichoderma treatment enhanced photosynthesis, which corresponds with the previous finding that an inoculation with Trichoderma promoted plant growth and increased photosynthetic pigment [22]. Conversely, photosynthetic pigments are known to be negatively affected by salt stress [8].
The untreated control groundnut contained less photosynthetic pigment in the vegetative growth stage than the treated counterparts. This occurred as the chlorophyll synthesis was inhibited and chlorophyllase enzyme was activated, leading to the degradation of chlorophylls [41]. Another explanation for the inhibited photosynthetic process is that NaCl also interferes with enzymes that are crucial to photosynthesis, such as phosphoenolpyruvate carboxylase and rubisco [41,42].
The increased carotenoid content in the treated groundnut was more pronounced in the vegetative growth phase than it was in the regenerative growth phase. This increase reveals the role of carotenoids as reactive oxygen species (ROS) scavengers in the oxidative stress tolerance mechanisms and in protecting the membrane during stress [43,44].

4.4. Indole-3-Acetic Acid (IAA) Synthase

IAA synthase is a plant hormone that is responsible for the regulation of a number of cellular mechanisms that are related to plant growth, including organ development and cell elongation. Our study showed that T. virens T.v4 and T. asperellum T.a8 increased the level of IAA synthase by 63.1 and 17.2% in leaves at the vegetative and generative growth stages, respectively (Figure 3). The application of microbial inducers, such as Trichoderma, has been found to increase the level of IAA in a variety of crops [22,24,45]. For example, T. asperellum Q1 increases IAA in the leaves of cucumber seedlings by 69.6% when under saline stress during the vegetative growth phase [46]. Phytohormones that are produced by Trichoderma spp. promote maize growth under conditions of salt stress [22]. The treatment of wheat grown on 180 mM salt stress with T. reesei increases the level of IAA that is present by approximately 50% [24], similar to the increase observed in our study. It can, therefore, be suggested that treatment with selected Trichoderma species triggers up-regulation of plant hormone and increases IAA synthase production.

4.5. Total Phenolic and Flavonoid Contents in Groundnut

Many plants that are grown under conditions of salt stress produce and accumulate secondary metabolites such as polyphenols, phenols, phenolic acids, flavonoids, anthocyanins, and lignin [8] in order to protect them from further damage. In our study, the phenolic content in the treated groundnut increased. Similar increases are reported to occur in maize [22], buckwheat, and barley that are cultivated in saline soil [47].
Flavonoids are a large group of phenolic compounds [48]; hence, an increase in flavonoids is expected to correlate with an increase in phenolic content. This was indeed observed in our experimental data, especially during the vegetative growth phase. Similar increases in flavonoid concentration have been observed in tomato plants that were exposed to salt stress (450 mM), this exposure almost doubled the flavonoid content from 8.7–13.7 mg of catechin equivalent per gram [42].
Phenolic compounds, including flavonoids, reduce the oxidative process by quenching singlet oxygen, absorbing and neutralizing free radicals, reducing peroxides, and alleviating salinity effects [8,49,50]. Similarly, the quenching of ROS to reduce cell damage by salt stress was also observed in salt-tolerant chickpea genotypes, which have higher concentrations of antioxidant enzymes such as superoxide dismutase, catalase, ascorbate peroxidase, and glutathione reductase than the salt-susceptible genotypes [51]. In particular, high levels of antioxidant enzyme activities minimize the membrane cell oxidative damages that can be caused by ROS [4,52].

4.6. Changes in Growth Parameters and Minerals in Groundnut

The groundnut plants’ heights increased by 13.5–42.3% during the generative phase after having been treated in the manner described in this current study [27]. Taufiq and Yusnawan [27] found that the macro nutrient concentrations of N, P and K in groundnut plants were not affected when the plants were grown in a saline-stressed condition. Notably, there was an increase in sodium, indicating a higher sodium uptake and retention by the groundnut [27]. An increased Na uptake in the plants that were treated with T. virens was also noted in the current study (Figure 7). Although Na uptake increased, the plants did not suffer from salt stress. Higher concentrations of salt cause cell ionic imbalance, whereby Na and Cl ions from the soil migrate into the plants instead of water [4,53] and influence the plants’ homeostasis [10].
The groundnut plants that were treated with T. asperellum had slightly lower sodium contents than the untreated control plants and the plants in the other treatments (Figure 7). The T. asperellum T.a8-treated plants had the lowest level of sodium, at 0.21%. Another mechanism for alleviating salt stress may be in place; Trichoderma may be able to maintain ionic homeostasis by regulating ion accumulation through the restriction of sodium movement inside the plant [54]. However, the groundnut that was treated with T. asperellum T.a8 showed higher shoots and greater total biomass in contrast to the control condition, which is in agreement with the results of a previous work on cucumber seedlings that were treated with T. harzianum [55].
In this current study, in the vegetative phase the growth of the groundnut crops that were treated with Trichoderma was better than their generative phase growth, despite the presence of salt. This result was observed in the form of increases in IAA concentration, total phenolic and flavonoid contents, and shoot height. However, the salt stress had a negative effect on the plant growth in the untreated groundnut during both the vegetative and generative growth phases. Reduced photosynthesis pigments, reduced root growth, and disturbance in mineral uptake [56] are common responses to abiotic stress [42].
The results of this study imply that the groundnut that was treated with Trichoderma developed a tolerance to saline environments by direct and/or indirect mechanisms. Specifically, the application of salt-tolerant Trichoderma seemed to have a direct influence in the form of mitigating salt toxicity in the groundnut and indirectly improved plant growth [57]. The Trichoderma application alleviated salinity stress, possibly due to a higher uptake of plant nutrients, brought about by the enhanced activity of enzymes such as peroxide, catalase, and reduced glutathione [24,57]. The potential presence of antioxidant enzymes in groundnut that could reduce high concentrations of toxic ROS, for example catalase or peroxidase [24], is worthy of future investigation.

5. Conclusions

Two isolates of T. virens and three isolates of T. asperellum were tested on salt media. The T. virens isolates were more sensitive to 0.75 M of NaCl than the T. asperellum isolates. In general, the Trichoderma that was treated with NaCl displayed changes in the compositions and relative amounts of volatile organic compounds that were produced. Trichoderma treatment may potentially alleviate salinity stress during the vegetative and generative growth stages of groundnut. This was demonstrated by increases in the IAA, phenolic and flavonoid contents, shoots and biomass weights that were observed following the application of T. asperellum T.a8 to groundnut plants. Trichoderma treatment may thus represent an alternative approach to minimizing plant abiotic stress. Seed treatment with selected salinity-tolerant Trichoderma is a simple strategy that can be implemented by facilitating root colonization. These treatments may protect crops from the negative impacts of abiotic environmental stress and offer other benefits, such as promoting seed germination, establishment, and enhancing plant growth. T. asperellum T.a8 was found to be the best isolate, in terms of having the potential to alleviate abiotic stress in groundnut crops that are affected by salinity. In summary, the application of salt-tolerant Trichoderma may be an effective approach to improving the survival of salt-sensitive crops and to support more sustainable agriculture.

Author Contributions

Conceptualization, E.Y., A.T. and A.I.; methodology, E.Y., A.T., A.W., D.N.S., R.H.P. and A.I.; data analysis, E.Y. and A.I.; draft preparation, E.Y., A.T. and A.I.; writing—original draft preparation, E.Y. and A.I.; writing—review and editing, E.Y., A.W., R.H.P., M.V.C.-H., A.S. and A.I. All authors have read and agreed to the published version of the manuscript.

Funding

This research received no external funding.

Institutional Review Board Statement

Not applicable.

Informed Consent Statement

Not applicable.

Data Availability Statement

Not applicable.

Acknowledgments

The authors would like to thank Yulius Eko Laxmana Samba for his technical assistance for the GC-MS analysis, Kim-Yen Phan-Thien for proofreading this manuscript, and the Indonesian government for providing internal funding for this study.

Conflicts of Interest

The authors declare no conflict of interest.

References

  1. Safdar, H.; Amin, A.; Shafiq, Y.; Ali, A.; Yasin, R.; Shoukat, A.; Hussan, M.U.; Sarwar, M.I. A review: Impact of salinity on plant growth. Nat. Sci. 2019, 17, 34–40. [Google Scholar]
  2. Otlewska, A.; Migliore, M.; Dybka-Stępień, K.; Manfredini, A.; Struszczyk-Świta, K.; Napoli, R.; Białkowska, A.; Canfora, L.; Pinzari, F. When salt meddles between plant, soil, and microorganisms. Front. Plant Sci. 2020, 11, 1429. [Google Scholar] [CrossRef]
  3. Etesami, H.; Maheshwari, D.K. Use of plant growth promoting rhizobacteria (PGPRs) with multiple plant growth promoting traits in stress agriculture: Action mechanisms and future prospects. Ecotoxicol. Environ. Saf. 2018, 156, 225–246. [Google Scholar] [CrossRef] [PubMed]
  4. Verma, H.; Kumar, D.; Kumar, V.; Kumari, M.; Singh, S.K.; Sharma, V.K.; Droby, S.; Santoyo, G.; White, J.F.; Kumar, A. The potential application of endophytes in management of stress from drought and salinity in crop plants. Microorganisms 2021, 9, 1729. [Google Scholar] [CrossRef] [PubMed]
  5. Jithesh, M.; Prashanth, S.; Sivaprakash, K.; Parida, A.K. Antioxidative response mechanisms in halophytes: Their role in stress defence. J. Genet. 2006, 85, 237. [Google Scholar] [CrossRef]
  6. Contreras-Cornejo, H.A.; Macías-Rodríguez, L.; Alfaro-Cuevas, R.; López-Bucio, J. Trichoderma spp. improve growth of Arabidopsis seedlings under salt stress through enhanced root development, osmolite production, and Na+ elimination through root exudates. Mol. Plant-Microbe Interact. 2014, 27, 503–514. [Google Scholar] [CrossRef] [Green Version]
  7. Katori, T.; Ikeda, A.; Iuchi, S.; Kobayashi, M.; Shinozaki, K.; Maehashi, K.; Sakata, Y.; Tanaka, S.; Taji, T. Dissecting the genetic control of natural variation in salt tolerance of Arabidopsis thaliana accessions. J. Exp. Bot. 2010, 61, 1125–1138. [Google Scholar] [CrossRef] [Green Version]
  8. Kumar, M.; Tak, Y.; Potkule, J.; Choyal, P.; Tomar, M.; Meena, N.L.; Kaur, C. Phenolics as Plant Protective Companion Against Abiotic Stress. In Plant Phenolics in Sustainable Agriculture; Springer: Berlin/Heidelberg, Germany, 2020; pp. 277–308. [Google Scholar]
  9. Rahnama, A.; James, R.A.; Poustini, K.; Munns, R. Stomatal conductance as a screen for osmotic stress tolerance in durum wheat growing in saline soil. Funct. Plant Biol. 2010, 37, 255–263. [Google Scholar] [CrossRef]
  10. Gupta, B.; Huang, B. Mechanism of salinity tolerance in plants: Physiological, biochemical, and molecular characterization. Int. J. Genom. 2014, 2014, 701596. [Google Scholar] [CrossRef]
  11. Rawat, L.; Bisht, T.; Upadhayay, R.; Kukreti, A. Selection of salinity tolerant Trichoderma isolates and evaluating their performance in alleviating salinity stress in rice (Oryzae sativa L.). Int. J. Natl. Acad. Agric. Sci. 2016, 34, 1869–1875. [Google Scholar]
  12. Zhang, S.; Song, J.; Wang, H.; Feng, G. Effect of salinity on seed germination, ion content and photosynthesis of cotyledons in halophytes or xerophyte growing in Central Asia. J. Plant Ecol. 2010, 3, 259–267. [Google Scholar] [CrossRef] [Green Version]
  13. Jain, A.; Singh, A.; Singh, S.; Singh, H.B. Biological management of Sclerotinia sclerotiorum in pea using plant growth promoting microbial consortium. J. Basic Microbiol. 2015, 55, 961–972. [Google Scholar] [CrossRef] [PubMed]
  14. Singh, A.; Jain, A.; Sarma, B.K.; Upadhyay, R.S.; Singh, H.B. Beneficial compatible microbes enhance antioxidants in chickpea edible parts through synergistic interactions. LWT—Food Sci. Technol. 2014, 56, 390–397. [Google Scholar] [CrossRef]
  15. Yadav, R.S.; Singh, V.; Pal, S.; Meena, S.K.; Meena, V.S.; Sarma, B.K.; Singh, H.B.; Rakshit, A. Seed bio-priming of baby corn emerged as a viable strategy for reducing mineral fertilizer use and increasing productivity. Sci. Hortic. 2018, 241, 93–99. [Google Scholar] [CrossRef]
  16. Contreras-Cornejo, H.A.; Macías-Rodríguez, L.; Cortés-Penagos, C.; López-Bucio, J. Trichoderma virens, a plant beneficial fungus, enhances biomass production and promotes lateral root growth through an auxin-dependent mechanism in Arabidopsis. Plant Physiol. 2009, 149, 1579–1592. [Google Scholar] [CrossRef] [Green Version]
  17. Gravel, V.; Antoun, H.; Tweddell, R.J. Growth stimulation and fruit yield improvement of greenhouse tomato plants by inoculation with Pseudomonas putida or Trichoderma atroviride: Possible role of indole acetic acid (IAA). Soil Biol. Biochem. 2007, 39, 1968–1977. [Google Scholar] [CrossRef]
  18. Rawat, L.; Singh, Y.; Shukla, N.; Kumar, J. Seed biopriming with salinity tolerant isolates of Trichoderma harzmnum alleviates salt stress in rice: Growth, physiological and biochemical characteristics. J. Plant Pathol. 2012, 94, 353–365. [Google Scholar]
  19. Lee, S.; Yap, M.; Behringer, G.; Hung, R.; Bennett, J.W. Volatile organic compounds emitted by Trichoderma species mediate plant growth. Fungal Biol. Biotechnol. 2016, 3, 1–14. [Google Scholar] [CrossRef] [Green Version]
  20. Poosapati, S.; Ravulapalli, P.D.; Tippirishetty, N.; Vishwanathaswamy, D.K.; Chunduri, S. Selection of high temperature and salinity tolerant Trichoderma isolates with antagonistic activity against Sclerotium rolfsii. SpringerPlus 2014, 3, 1–11. [Google Scholar] [CrossRef] [PubMed] [Green Version]
  21. Singh, V.; Keswani, C.; Ray, S.; Upadhyay, R.S.; Singh, D.P.; Prabha, R.; Sarma, B.K.; Singh, H.B. Isolation and screening of high salinity tolerant Trichoderma spp. with plant growth property and antagonistic activity against various soilborne phytopathogens. Arch. Phytopathol. Plant Prot. 2019, 52, 667–680. [Google Scholar] [CrossRef]
  22. Kumar, K.; Manigundan, K.; Amaresan, N. Influence of salt tolerant Trichoderma spp. on growth of maize (Zea mays) under different salinity conditions. J. Basic Microbiol. 2017, 57, 141–150. [Google Scholar] [CrossRef]
  23. Martínez, R.S.; Chavera, G.S.; Mamani, W.H.; Molina, M.R. Native strains of Trichoderma from northern Chile: Adaptive tolerance in boric saline soils. Interciencia 2015, 40, 263–269. [Google Scholar]
  24. Ikram, M.; Ali, N.; Jan, G.; Iqbal, A.; Hamayun, M.; Jan, F.G.; Hussain, A.; Lee, I.-J. Trichoderma reesei improved the nutrition status of wheat crop under salt stress. J. Plant Interact. 2019, 14, 590–602. [Google Scholar] [CrossRef] [Green Version]
  25. Kashyap, P.L.; Solanki, M.K.; Kushwaha, P.; Kumar, S.; Srivastava, A.K. Biocontrol potential of salt-tolerant Trichoderma and Hypocrea isolates for the management of tomato root rot under saline environment. J. Soil Sci. Plant Nutr. 2020, 20, 160–176. [Google Scholar] [CrossRef]
  26. Zhang, F.; Wang, Y.; Liu, C.; Chen, F.; Ge, H.; Tian, F.; Yang, T.; Ma, K.; Zhang, Y. Trichoderma harzianum mitigates salt stress in cucumber via multiple responses. Ecotoxicol. Environ. Saf. 2019, 170, 436–445. [Google Scholar] [CrossRef]
  27. Abdullah, T.; Yusnawan, E. Influence of Trichoderma as a seed treatment on the growth and yield of groundnut under saline environment. J. Degrad. Min. Lands Manag. 2020, 8, 2401–2409. [Google Scholar] [CrossRef]
  28. Inayati, A.; Sulistyowati, L.; Aini, L.Q.; Yusnawan, E. Trichoderma virens-Tv4 enhances growth promoter and plant defense-related enzymes of mungbean (Vigna radiata) against soil-borne pathogen Rhizoctonia solani. Biodiversitas J. Biol. Divers. 2020, 21, 2410–2419. [Google Scholar] [CrossRef]
  29. Yusnawan, E.; Inayati, A.; Baliadii, Y. Isolation of antagonistic fungi from rhizospheres and its biocontrol activity against different isolates of soil borne fungal pathogens infected legumes. Biodiversitas J. Biol. Divers. 2019, 20, 2048–2054. [Google Scholar] [CrossRef] [Green Version]
  30. Inayati, A.; Sulistyowati, L.; Aini, L.Q.; Yusnawan, E. Antifungal Activity of Volatile Organic Compounds from Trichoderma virens. In Proceedings of the AIP Conference Proceedings, Malang, Indonesia, 13–14 March 2019; p. 080012. [Google Scholar]
  31. Lichtenthaler, H.K.; Buschmann, C. Chlorophylls and Carotenoids: Measurement and Characterization by UV-VIS Spectroscopy. Curr. Protoc. Food Anal. Chem. 2001, 1, F4. [Google Scholar] [CrossRef]
  32. Yusnawan, E.; Inayati, A. Antifungal activity of crude extracts of Ageratum conyzoides, Cyperus rotundus, and Amaranthus spinosus against rust disease. AGRIVITA J. Agric. Sci. 2018, 40, 12. [Google Scholar] [CrossRef]
  33. Karpiuk, U.V.; Al Azzam, K.M.; Abudayeh, Z.H.M.; Kislichenko, V.; Naddaf, A.; Cholak, I.; Yemelianova, O. Qualitative and quantitative content determination of macro-minor elements in Bryonia alba L. roots using flame atomic absorption spectroscopy technique. Adv. Pharm. Bull. 2016, 6, 285. [Google Scholar] [CrossRef]
  34. Ben Alaya, A.; Rabhi, F.; Hessini, K.; Djébali, N. Pyrenophora teres growth and severity of net blotch on barley under salt stress. Eur. J. Plant Pathol. 2021, 161, 709–722. [Google Scholar] [CrossRef]
  35. Kadhim, M.J.; Mohammed, G.J.; Hameed, I.H. In vitro antibacterial, antifungal and phytochemical analysis of methanolic extract of fruit Cassia fistula. Orient. J. Chem. 2016, 32, 1329. [Google Scholar] [CrossRef] [Green Version]
  36. Palmer-Young, E.C.; Veit, D.; Gershenzon, J.; Schuman, M.C. The sesquiterpenes (E)-ß-farnesene and (E)-α-bergamotene quench ozone but fail to protect the wild tobacco Nicotiana attenuata from ozone, UVB, and drought stresses. PLoS ONE 2015, 10, e0127296. [Google Scholar]
  37. Rinkel, J.; Dickschat, J.S. Mechanistic investigations on multiproduct β-himachalene synthase from Cryptosporangium arvum. Beilstein J. Org. Chem. 2019, 15, 1008–1019. [Google Scholar] [CrossRef]
  38. Yin, J.; Li, X.; Huang, F.F.; Lu, M.H.; Yang, J.; Zhu, L.Y. Chemical composition, antioxidant and anticancer activity of the essential oil from Myric rubra leaves. IOP Conf. Ser. Earth Environ. Sci. 2019, 346, 012085. [Google Scholar] [CrossRef]
  39. Del Rosario Cappellari, L.; Banchio, E. Microbial volatile organic compounds produced by Bacillus amyloliquefaciens GB03 ameliorate the effects of salt stress in Mentha piperita principally through acetoin emission. J. Plant Growth Regul. 2020, 39, 764–775. [Google Scholar] [CrossRef]
  40. Nieto-Jacobo, M.F.; Steyaert, J.M.; Salazar-Badillo, F.B.; Nguyen, D.V.; Rostás, M.; Braithwaite, M.; De Souza, J.T.; Jimenez-Bremont, J.F.; Ohkura, M.; Stewart, A. Environmental growth conditions of Trichoderma spp. affects indole acetic acid derivatives, volatile organic compounds, and plant growth promotion. Front. Plant Sci. 2017, 8, 102. [Google Scholar] [CrossRef] [PubMed] [Green Version]
  41. Santos, C.V. Regulation of chlorophyll biosynthesis and degradation by salt stress in sunflower leaves. Sci. Hortic. 2004, 103, 93–99. [Google Scholar] [CrossRef]
  42. Al Hassan, M.; Fuertes, M.M.; Sánchez, F.J.R.; Vicente, O.; Boscaiu, M. Effects of salt and water stress on plant growth and on accumulation of osmolytes and antioxidant compounds in cherry tomato. Not. Bot. Horti Agrobot. Cluj-Napoca 2015, 43, 1–11. [Google Scholar] [CrossRef]
  43. Das, K.; Roychoudhury, A. Reactive oxygen species (ROS) and response of antioxidants as ROS-scavengers during environmental stress in plants. Front. Environ. Sci. 2014, 2, 53. [Google Scholar] [CrossRef] [Green Version]
  44. Gill, S.S.; Tuteja, N. Reactive oxygen species and antioxidant machinery in abiotic stress tolerance in crop plants. Plant Physiol. Biochem. 2010, 48, 909–930. [Google Scholar] [CrossRef]
  45. Kumar, K.; Thakur, P.; Rathore, U.S.; Kumar, S.; Mishra, R.; Amaresan, N.; Pandey, S.; Mishra, M. Plant beneficial effects of Trichoderma spp. suppressing Fusarium wilt and enhancing growth in Tomato. Vegetos 2021, 3, 1–8. [Google Scholar] [CrossRef]
  46. Zhao, L.; Zhang, Y.-Q. Effects of phosphate solubilization and phytohormone production of Trichoderma asperellum Q1 on promoting cucumber growth under salt stress. J. Integr. Agric. 2015, 14, 1588–1597. [Google Scholar] [CrossRef] [Green Version]
  47. Yang, L.; Wen, K.-S.; Ruan, X.; Zhao, Y.-X.; Wei, F.; Wang, Q. Response of plant secondary metabolites to environmental factors. Molecules 2018, 23, 762. [Google Scholar] [CrossRef] [PubMed] [Green Version]
  48. Jeng, T.L.; Shih, Y.J.; Wu, M.T.; Sung, J.M. Comparisons of flavonoids and anti-oxidative activities in seed coat, embryonic axis and cotyledon of black soybeans. Food Chem. 2010, 123, 1112–1116. [Google Scholar] [CrossRef]
  49. Chen, S.; Wu, F.; Li, Y.; Qian, Y.; Pan, X.; Li, F.; Wang, Y.; Wu, Z.; Fu, C.; Lin, H.; et al. NtMYB4 and NtCHS1 are critical factors in the regulation of flavonoid biosynthesis and are involved in salinity responsiveness. Front. Plant Sci. 2019, 10, 178. [Google Scholar] [CrossRef] [PubMed]
  50. Shah, A.; Smith, D.L. Flavonoids in agriculture: Chemistry and roles in, biotic and abiotic stress responses, and microbial associations. Agronomy 2020, 10, 1209. [Google Scholar] [CrossRef]
  51. Rasool, S.; Ahmad, A.; Siddiqi, T.; Ahmad, P. Changes in growth, lipid peroxidation and some key antioxidant enzymes in chickpea genotypes under salt stress. Acta Physiol. Plant. 2013, 35, 1039–1050. [Google Scholar] [CrossRef]
  52. Fu, J.; Xiao, Y.; Wang, Y.-F.; Liu, Z.-H.; Yang, K. Saline–alkaline stress in growing maize seedlings is alleviated by Trichoderma asperellum through regulation of the soil environment. Sci. Rep. 2021, 11, 1–11. [Google Scholar] [CrossRef]
  53. Munns, R.; Passioura, J.B.; Colmer, T.D.; Byrt, C.S. Osmotic adjustment and energy limitations to plant growth in saline soil. New Phytol. 2020, 225, 1091–1096. [Google Scholar] [CrossRef] [PubMed] [Green Version]
  54. Gupta, S.; Schillaci, M.; Walker, R.; Smith, P.M.; Watt, M.; Roessner, U. Alleviation of salinity stress in plants by endophytic plant-fungal symbiosis: Current knowledge, perspectives and future directions. Plant Soil 2021, 461, 219–244. [Google Scholar] [CrossRef]
  55. Huang, X.; Chen, L.; Ran, W.; Shen, Q.; Yang, X. Trichoderma harzianum strain SQR-T37 and its bio-organic fertilizer could control Rhizoctonia solani damping-off disease in cucumber seedlings mainly by the mycoparasitism. Appl. Microbiol. Biotechnol. 2011, 91, 741–755. [Google Scholar] [CrossRef] [PubMed]
  56. Hashem, A.; Abd_Allah, E.; Alqarawi, A.; Al Huqail, A.A.; Egamberdieva, D. Alleviation of abiotic salt stress in Ochradenus baccatus (Del.) by Trichoderma hamatum (Bonord.) Bainier. J. Plant Interact. 2014, 9, 857–868. [Google Scholar] [CrossRef]
  57. Zhang, S.; Gan, Y.; Xu, B. Application of plant-growth-promoting fungi Trichoderma longibrachiatum T6 enhances tolerance of wheat to salt stress through improvement of antioxidative defense system and gene expression. Front. Plant Sci. 2016, 7, 1405. [Google Scholar] [CrossRef] [PubMed] [Green Version]
Figure 1. The growth of T. virens (T.v3 and T.v4) and T. asperellum (T.a1, T.a5, and T.a8) on PDA containing 0.25; 0.50; 0.75; and 1.0 M of sodium chloride after 4 days of incubation. Error bars represent standard deviation. For each color in the bar chart, the same letters denote no significant difference within treatments, while different letters correspond to significant differences.
Sustainability 13 13226 g001
Figure 2. The heatmap of volatile organic compounds produced by T. virens T.v3 and T. asperellum T.a8 cultured in saline and non-saline media. T.a-0 = T. asperellum grown in media without NaCl, T.a-1 = T. asperellum grown in media with 0.5 M NaCl, T.v-0 = T. virens grown in media without NaCl, T.v-1 = T. virens grown in media with 0.5 M NaCl.
Sustainability 13 13226 g002
Figure 3. Chlorophyll a (Chl a), chlorophyll b (Chl b), and carotenoid (Car) in groundnut grown in saline environment at vegetative (a) and generative (b) growth stages. T0 = without Trichoderma, T1 = T. virens T.v4, T2 = T. virens T.v3, T3 = T. asperellum T.a8, and T4 = T. asperellum T.a1. Error bars represent standard deviation. For each color in the bar chart, the same letters denote no significant difference within treatments, while different letters correspond to significant differences.
Sustainability 13 13226 g003
Figure 4. IAA synthase in groundnut plants that were grown in saline environment at vegetative (a) and generative (b) growth phases. T0 = without Trichoderma, T1 = T. virens T.v4, T2 = T. virens T.v3, T3 = T. asperellum T.a8, and T4 = T. asperellum T.a1. R = root, L = leaf, RL = roots and leaves. The error bars represent standard deviation. For each color in the bar chart, the same letter denotes no significant difference within treatments, while different letters correspond to significant differences.
Sustainability 13 13226 g004
Figure 5. The total phenolic contents in groundnut measured in the vegetative (Veg) and generative (Gen) stages. T0 = without Trichoderma, T1 = T. virens T.v4, T2 = T. virens T.v3, T3 = T. asperellum T.a8, and T4 = T. asperellum T.a1. Error bars represent standard deviation. For each color in the bar chart, the same letters denote no significant difference within treatments, while different letters correspond to significant differences.
Sustainability 13 13226 g005
Figure 6. Total flavonoid in groundnut determined in both vegetative (Veg) and generative (Gen) growth phases. T0 = without Trichoderma, T1 = T. virens T.v4, T2 = T. virens T.v3, T3 = T. asperellum T.a8, and T4 = T. asperellum T.a1. The error bars represent standard deviation. For each color in the bar chart, the same letters denote no significant difference within treatments, while different letters correspond to significant differences.
Sustainability 13 13226 g006
Figure 7. Concentrations of Na, K and Ca in groundnut plants in generative growth phase. T0 = without Trichoderma, T1 = T. virens T.v4, T2 = T. virens T.v3, T3 = T. asperellum T.a8, and T4 = T. asperellum T.a1. Error bars represent standard deviation. For each color in the bar chart, the same letters denote no significant differences within treatments, while different letters correspond to significant differences.
Sustainability 13 13226 g007
Table 1. Comparing the shoots, roots and biomasses of groundnut plants grown in saline environment, in the vegetative growth phase. Different superscripts within the column correspond to significant differences between treatments. T0 = without Trichoderma, T1 = T. virens T.v4, T2 = T. virens T.v3, T3 = T. asperellum T.a8, and T4 = T. asperellum T.a1.
TreatmentShoot Height (cm)Root Length (cm)Shoot Dry Weight (g)Root Dry Weight (g)Biomass Dry Weight (g)
T06.86 b5.16 a0.59 a,b0.034 a0.62 a,b
T19.02 a3.88 b0.52 b,c0.023 b,c0.55 b,c
T29.12 a4.52 a,b0.45 c0.020 c0.49 c
T38.81a5.06 a0.64 a0.030 a,b0.69 a
T48.87 a4.93 a0.56 b,c0.029 a,b0.55 b,c
Different letters indicate means that are significantly different at p < 0.05.
Table 2. Comparing the shoots, roots and plants’ biomass of groundnut grown in saline environment during the regenerative growth phase.
TreatmentShoot Height (cm)Root Length (cm)Shoot Dry Weight (g)Root Dry Weight (g)Biomass Dry Weight (g)
T010.80 a6.30 a3.12 b,c0.15 a,b3.27 b,c
T110.48 a6.80 a2.36 c,d0.11 b2.38 c,d
T210.64 a7.90 a2.16 d0.13 a,b1.89 d
T311.70 a3.90 b4.53 a0.18 a4.71 a
T411.80 a5.60 a,b3.81 a,b0.13 a,b3.94 a,b
Different letters indicate means that are significantly different at p < 0.05.
Publisher’s Note: MDPI stays neutral with regard to jurisdictional claims in published maps and institutional affiliations.

