Article

A Decision Framework for Solar PV Panels Supply Chain in Context of Sustainable Supplier Selection and Order Allocation

1
Department of Mechanical Engineering, Capital University of Science and Technology, Islamabad 44000, Pakistan
2
NUST Business School, National University of Science & Technology, Islamabad 44000, Pakistan
3
Department of Mechanical Engineering, Institute of Space Technology, Islamabad 44000, Pakistan
4
Higher Institution Centre of Excellence (HICoE), UM Power Energy Dedicated Advanced Centre (UMPEDAC), University of Malaya, Kuala Lumpur 59990, Malaysia
*
Author to whom correspondence should be addressed.
Sustainability 2021, 13(23), 13216; https://doi.org/10.3390/su132313216
Submission received: 1 October 2021 / Revised: 18 November 2021 / Accepted: 22 November 2021 / Published: 29 November 2021

Abstract

:
Sustainable supplier selection and order allocation (SSSOA) is paramount to sustainable supply chain management. It is a complex multi-dimensional decision-making process augmented with the triple bottom line of sustainability. This research presents a multi-phase decision framework to address a SSSOA problem for the multi-echelon renewable energy equipment (Solar PV Panels) supply chain. The framework comprises of fuzzy Multi-Criteria Decision-Making techniques augmented with fuzzy multi-objective mixed-integer non-linear programming mathematical model. The various economic, environmental, and social objectives were optimized for a multi-period, multi-modal transportation network of the supply chain. The results show that among the various sustainable criteria selected in this study, product cost, environmental management system, and health and safety rights of employees are the most important for decision-makers. The results of the mathematical model highlighted the impact of multimodal transportation on overall cost, time, and environmental impact for all periods. An analysis of results revealed that transfer cost and customer clearance cost contribute significantly towards overall cost. Furthermore, defect rate was also observed to play a critical role in supplier selection and order allocation.

1. Introduction

Supply Chain Management (SCM) comprises of operations related to the flow of merchandise from supplier to the end customer [1]. It helps in the overall planning, controlling, and implementation of the organization’s activities [2]. Over the years, organizations have shifted from conventional SCM to sustainable supply chain management (SSCM) to achieve high operational performance and business competitiveness [3]. Sustainability in SCM refers to a set of scales between economic benefits, environmental protection, and social improvements [4]. Its goal is to obtain an optimal compromise amongst the three diverging pillars (economic, environmental and social) by managing the resources, data, assets, and merchandise amongst the entities of the supply chain [5]. The concerns over ozone depletion, exhaustion of natural resources, and employees’ social rights, etc. pried the enterprises to address the concerns of environmental pollution and social structure in their supply chains [6].
There has been a growing trend among organization to adopt sustainable supply chain practices [7]. An important aspect of sustainable supply chains is devising of purchasing strategies [8]. This poses a challenge for supply chain managers in the form of sustainable purchasing and vendor selection. This also motivates them to improve their supply chain activities for sustainable development of organization. Therefore, a concept of sustainable supplier selection and order allocation (SSSOA) has been introduced. It is an important aspect of SSCM [9]. SSSOA is a complex multi-criteria decision-making (MCDM) process augmented with order allocation techniques and various tangible and intangible criteria to assess the suppliers for optimal order allocation [10].
Fundamentally, SSSOA problems consist of two phases: (1) sustainable supplier selection, (2) optimal order allocation. Sustainable supplier selection can be further divided into two parts: (1) single souring, where one supplier can fulfill the total demand of the customer, and (2) multiple sourcing, where multiple suppliers need to be selected to fulfill the customer’s demand. Generally, enterprises prefer multiple sourcing for more diverse, timely, and flexible order delivery [11,12,13]. However, due to several uncontrollable and unpredictable factors, it is challenging for decision-makers to select appropriate suppliers [14]. After the selection of the best suppliers under the triple bottom line of sustainability, another important question arises about “what amount to order?” The order allocation comprises a mathematical model consisting of single or multiple objectives that need to be optimized while ordering from suppliers and meeting customer’s demands [15]. Researchers integrated the order allocation problem with supplier selection to reduce the cost and other parameters to enhance the performance of the supply chain, see for instance ([16,17,18,19,20,21]).
The quest of sustainability has also motivated the energy sector over the globe to adopt sustainable practices in production and delivery [22]. Therefore, global energy outlook is rapidly shifting towards renewable energy sources [23]. Of various types of renewable energy sources, Solar Photovoltaic (PV) Panels dominate the energy production both at domestic and commercial level [24]. Different reports suggest that China, Canada, USA, Japan, and Germany dominate the global production of Solar PV Panels [25]. According to the international trade data, these countries are also the major exporters of Solar PV Panels to the world. Although Solar PV Panels present a sustainable mean of energy production, their supply chain is still an unexplored area for application of sustainable practices. Therefore, implementation of SSSOA problem on the supply chains of solar PV Panel would intensify the deployment of overall sustainable objectives [26].
Despite several research studies conducted to address the aspect of sustainability in the SSSOA problem for various industries, the emphasis on sustainability concerns in the solar PV panels supply chains is still at an early stage. To the best of the authors’ knowledge, no study has been conducted so far that evaluates the supply chain in the context of SSSOA of the Solar PV Panels industry. Therefore, the objective of this research is to develop a comprehensive fuzzified decision framework for solving the SSSOA problem in renewable energy supply chain networks (with emphasis on the Solar PV Panels industry). The originality of the study is to presents the novel fuzzified decision framework implemented on the solar PV panels supply chain. A numerical case study with real time data was used to examine the efficacy of the developed decision framework. The developed framework provides an insight to supply chain managers, particularly in the Solar PV Panels industry.
The remaining of this paper is organized as follows: Section 2 presents an overview of the existing literature on the SSSOA problem. Section 3 briefly describes the problem that is addressed in this study. Section 4 presents the decision framework, the development of the Fuzzy Multi-Objective Mixed Integer Non-Linear Programming (FMOMINLP) optimization model, and the solution approach used to solve FMOMINLP. Section 5 presents an application of the developed integrated approach to a case study. Section 6 presents conclusions and recommends avenues for future studies.

2. Relevant Literature

Over the years, extensive research has been carried out by the research community to address the augmentation of sustainability in supply chains. For instance, Cheraghalipour and Farsad [20] provided a decision-making tool of purchasing and ordering for the plastic industry while considering three pillars of sustainability. Zimon and Domingues [27] highlighted the potential factors that would influence the sustainable management of textile supply chains. Tseng et al. [28] developed a comprehensive mathematical model to feature the role of Big Data for minimizing uncertainties and achieving sustainable development in supply chains. With growing concerns about the sustainability in supply chains, researchers have analyzed supply chains in the context of supplier selection and order allocation (individually and integrally). MCDM techniques have been used along with multi-objective optimization to assess SSSOA problems [29,30,31,32]. The literature related to the SSSOA problem can be broadly divided into two categories, namely: Sustainable Supplier Selection (SSS) and Order Allocation (OA). The following section briefly presents an overview of some of the key studies in these two categories.

2.1. Sustainable Supplier Selection

Sustainable purchasing has a strategic relevance in SSCM [33]. It is a complex multi-variate decision-making problem that simultaneously evaluates the conflicting criteria and objectives along with uncertainties in human decision-making [34,35]. Traditionally, suppliers were assessed conflicting criteria like total cost, product quality, service level, and delivery time [36]. However, with growing awareness about sustainability, government regulations, and responsible purchasing practices, sustainable criteria are used for supplier selection [37]. For instance, Buyukzkan and Cifci [38] used five sustainable criteria for evaluating the sustainable performance of suppliers. Luthra et al. [39] argued that environmental costs and competencies, quality, and product price, occupational health, and safety systems are the main factors that influence sustainable purchasing decisions. Memari et al. [40] used 30 sustainable criteria for supplier evaluation of automotive spare parts manufacturers. Zhang et al. [41] used 15 sustainable criteria that can effectively improve enterprise supply chain performance. Once the sustainable criteria for supplier selection have been identified, the next step is evaluating the suppliers based on these criteria. Traditionally, MCDM techniques were developed to determine the optimal alternative among multiple, conflicting, and interactive criteria. However, due to the uncertain nature of human decision-making, researchers have integrated Fuzzy Set Theory (FST) with traditional MCDM techniques. FST is used along with MCDM techniques to transform crisp numeric values for more precise judgment of real-world systems [42]. A wealth of literature elucidates the importance of fuzzy logic in MCDM problems [33,40,43,44,45,46]. Table 1 presents some recent studies conducted on SSS with the help of fuzzy MCDM techniques.

2.2. Sustainable Order Allocation

Notably, optimal order allocation is paramount to SSSOA problems [51]. Extensive research has been done to allocate an order to potential customers while considering the three pillars of sustainability. Order allocation is a multi-objective process considering conflicting objectives that need to be simultaneously optimized for sustainable purchasing from potential suppliers [52,53,54]. A mathematical model containing conflicting objectives needs to be developed for optimum allocation of orders. Mohammed [55] developed a mixed-integer non-linear programming (MINLP) model containing cost, time, environmental and social impact as objectives to allocate orders to selected suppliers. The authors used a technique for multi-objective optimization of the mathematical model. Goren [56] developed the MILP model consisting of cost and value of purchasing as objectives for sustainable distribution of orders to the suppliers. Furthermore, to incorporate the aspect of uncertainty in input parameters, researchers shifted from conventional MILP/MINLP to fuzzified MILP/MINLP, see for instance, [37,57,58,59,60]. Various solution approaches have been used to solve the mathematical models developed for order allocation. Table 2 presents an overview of studies containing the type of mathematical model, objectives, and solution approaches to solve the mathematical modal.

2.3. Decision Framework for SSSOA Problems

In recent years, researchers have developed a decision framework to address the SSSOA problem. Such frameworks comprise MCDM techniques with multi-objective programming models. For instance, Liaqait et al. [9] developed a decision support framework for the air condition industry. In their study, the multi-modal MINLP model integrated with noise pollution and demand uncertainty was developed. Mohammed et al. [61] proposed a decision framework for a two-stage SSSOA problem for the food industry. In their study, the FMILP model was developed to cope with the dynamic nature of the input parameters. Sodenkamp [64] presented a multi-level group decision framework augmented with a mathematical model for dynamic monitoring of strategic and tactical purchasing decisions on different organizational layers. Vahidi et al. [65] proposed a novel bi-objective two-stage mixed possibilistic-stochastic programming decision framework to address the SSSOA problem under operational and disruption risks. Omair et al. [66] proposed a decision support framework for the selection of sustainable suppliers of gloves manufacturing firm using Fuzzy Inference System (FIS) and AHP. Table 3 presents the decision framework developed by the researchers to address the SSSOA problem. It also provides deep insight into used criteria, mathematical models, case studies, and solving techniques. Furthermore, it highlights the novel establishment of decision framework and its application on solar PV panels industry.
To summarize, the literature, the SSSOA problem is a multi-dimensional comparative analysis process. Supplier evaluation criteria are the most important factor in supplier selection problems. Therefore, researchers have conducted extensive and wide-ranged surveys with managers and decision-makers for the selection of appropriate criteria. Furthermore, various stand-alone and hybrid MCDM techniques have been used for sustainable supplier selection. Amongst these techniques, AHP augmented with TOPSIS has been reported to be most useful. Furthermore, various bi and multi-objective mathematical models have been developed for optimum order allocation. The integration of FST in MCDM techniques and mathematical models has often been used to address the vagueness and uncertainty of the decision-making process. Although several decision frameworks have been developed to solve the SSSOA problem for various industries, no study exists in the literature that has aimed to solve the SSSOA problem for the Solar PV Panels industry. Therefore, a real time case of Solar PV Panels is presented to solve the SSSOA problem.

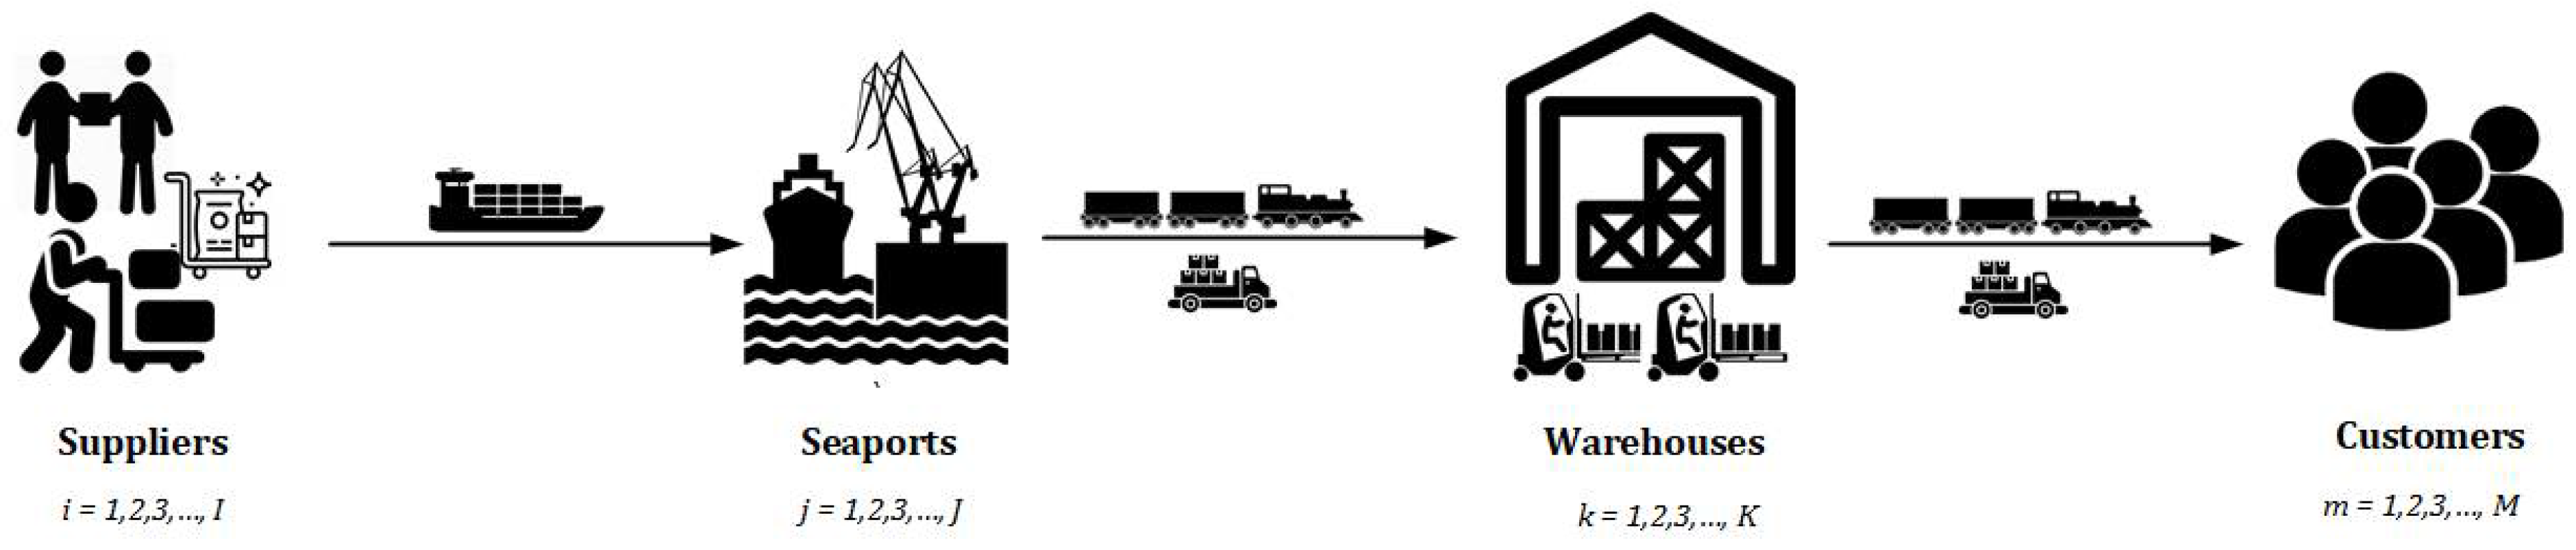
3. Problem Description

Figure 1 illustrates the multi-modal, multi-echelon supply chain network of Solar Panels examined in this study. The network consists of suppliers “i”, seaport “j”, warehouse “k”, and customer “m”. Supplier “i” ship the quantity Xijnt through port “j” to the warehouse “k” which is then transported to the customer “m” using various transportation modes “n” at time period “t”. The supply chain network is evaluated under the demand and capacity uncertainties of suppliers and warehouses. Moreover, a fuzzified MINLP mathematical model is developed to obtain an optimum quantity from the potential suppliers that are selected based on sustainable criteria to meet the customers’ demands for each time period.

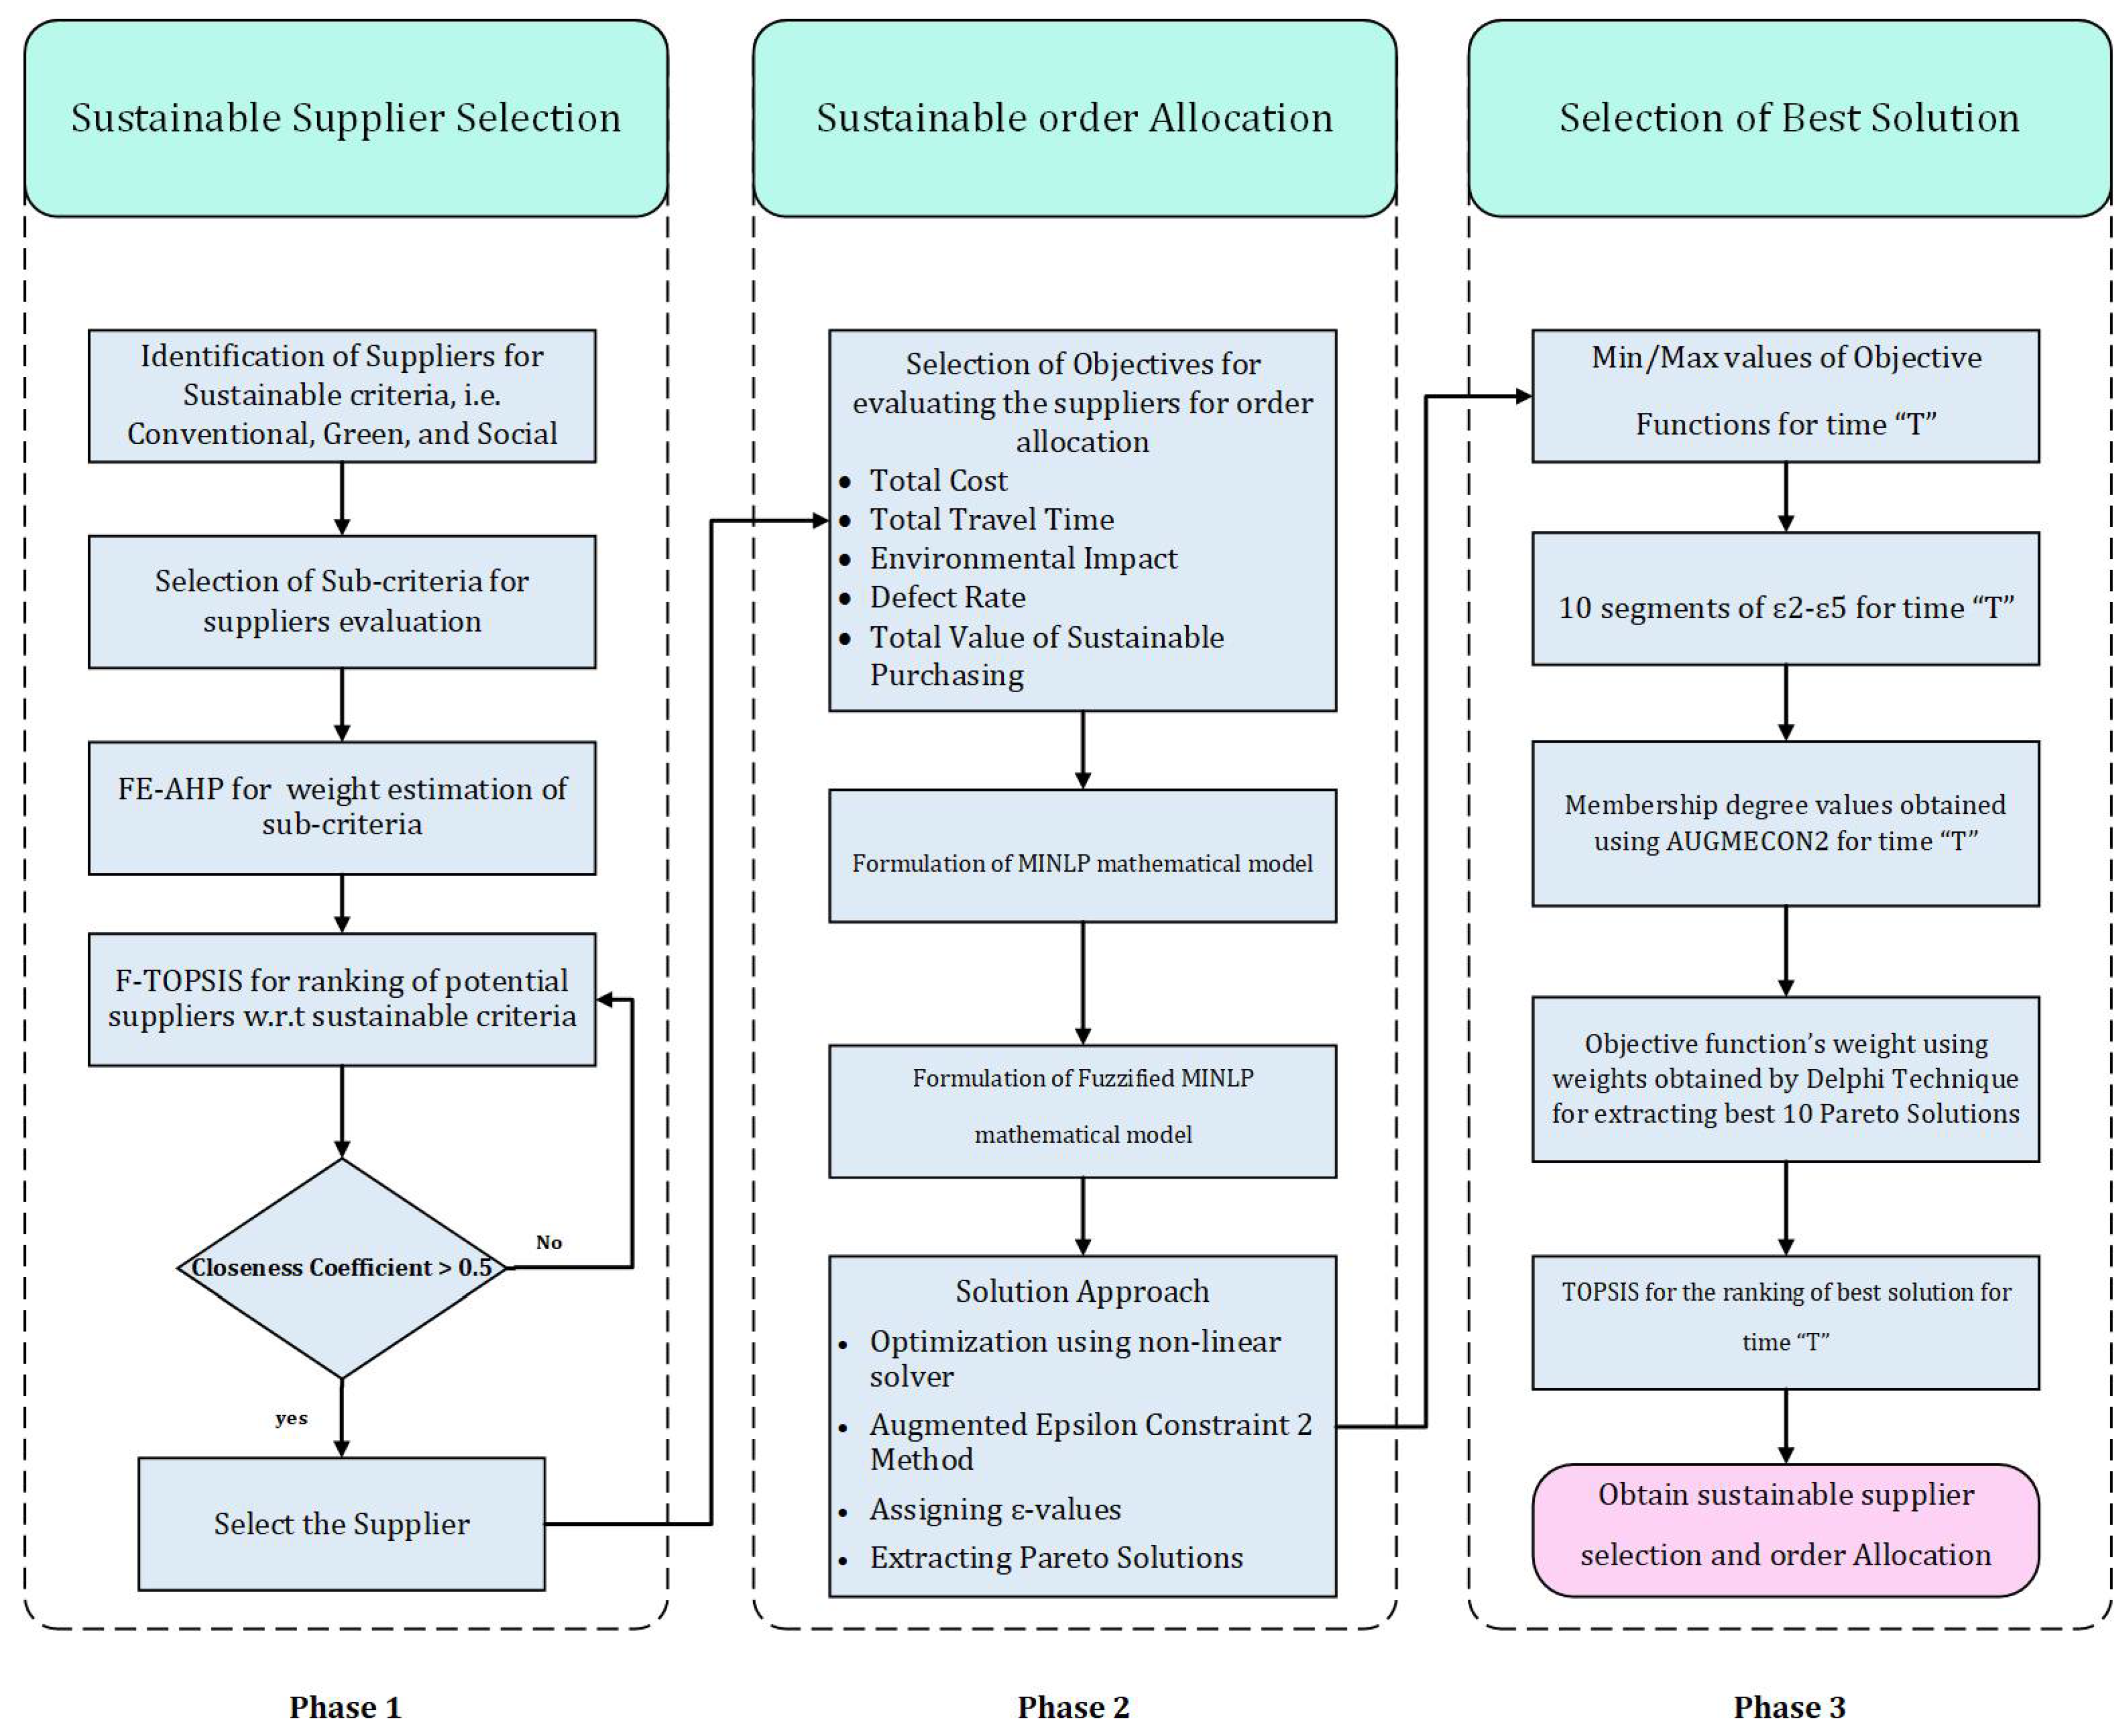
4. Sustainability Assessment Framework for the Solar PV Panels Supply Chain

A three-phase decision framework is proposed for sustainable performance evaluation of the solar panel supply chain network as shown in Figure 2. In the first phase, MCDM techniques were used to evaluate the suppliers in the context of sustainable criteria. In the second phase, FMOMINLP mathematical model was developed for sustainable order allocation and is solved using Augmented Epsilon Constraint 2 (AUGMECON2) for the optimized solutions. In the third phase, MCDM techniques were used to analyze the results of the mathematical model to obtain the final solution. A brief overview of the steps involved in each phase is presented below:

4.1. Sustainable Supplier Selection

FEAHP is applied to evaluate the relative weights of each sustainable supplier selection criterion using the methodology described by Wang et al. [73]. The sub-criteria for each major sustainable criterion are presented in Table 4. The weights of each sustainable criterion and sub-criterion are incorporated in FTOPSIS to rank the supplier using the methodology described by Mohammed et al. [61]. The linguistic variables used to estimate the criteria weights and ranking of the suppliers are presented in Table 5. In the end, the best suppliers were selected based on a defined threshold of Closeness Coefficient (CC) having a value greater than 0.5 (i.e., CC ≥ 0.50).

4.2. Sustainable Order Allocation

Firstly, FMOMINLP mathematical model is developed using fuzzified demand, supply, capacity, and resource constraints. The objective functions of models are Total Cost (TC), Total Travel Time (TTT), Environmental Impact (EI), Defect Rate (DR), and Total Value of Sustainable Purchasing (TVSP). Secondly, the exact solution for each objective is estimated using a non-linear mixed-integer programming solver. Thirdly, the AUGMECON2 algorithm is used to simultaneously minimize TC, TTT, EI, and DR while maximizing TVSP.

4.3. Selection of Best Solution

After the estimation of min/max values of objective functions, the values were divided into 10 segments corresponding to φ -levels for time “ t ”. Once the Pareto solutions were extracted for time t , TOPSIS augmented with weights assigned to each objective function using the Delphi technique was applied. 10 best optimal solutions were obtained using AUGMECON2 corresponding to φ -levels. TOPSIS was again applied to the selected Pareto solution to select the best optimal solution for t 1 t 4 .

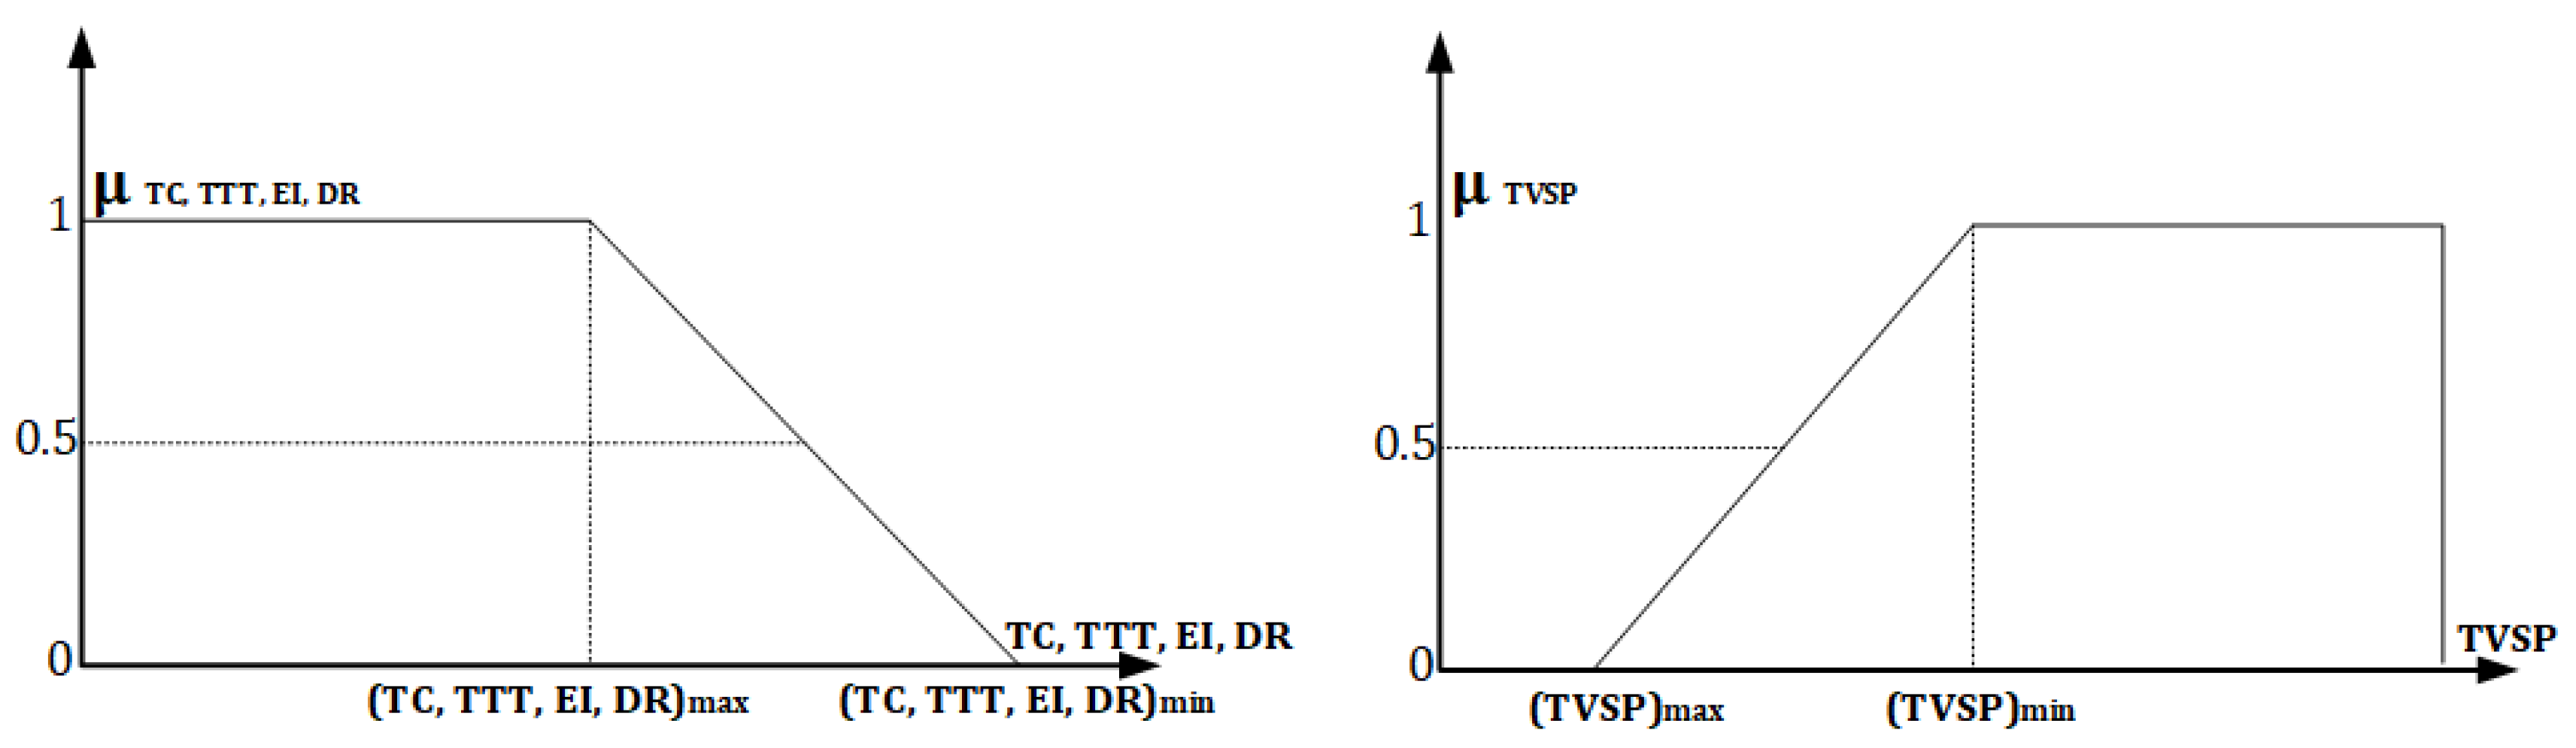
4.4. Development of Fuzzified Mathematical Model for Sustainable Order Allocation

This section presents the development of FMINLP mathematical model for Solar PV Panels supply chain. Several parameters are subject to uncertainty in the real world. Therefore, to cope with the dynamic nature of the input data in costs, capacity levels, demands, and defect rates, FST is applied in the mathematical model for more realistic scenarios. The multi-objective optimization model is presented below.
Assumptions
The assumptions of the mathematical model are as follows:
  • The model is a multi-period model.
  • The shipments are considered as less than a container load (LCL) shipment.
  • The transfer cost and transfer time can only be applied at the nodes.
  • The custom clearance cost and time can only be applied while moving through the port.
Sets
i = 1 , 2 , 3 , , I                               set   of   Suppliers   j = 1 , 2 , 3 , , J                           set   of   Port   k = 1 , 2 , 3 , , K                         set   of   Warehouses m = 1 , 2 , 3 , , M                     set   of   Customers n = 1 , 2 , 3 , , N                       s e t   o f   T r a n s p o r t a t i o n   M o d e s o = 1 , 2 , 3 , , O                         s e t   o f   T r a n s p o r t a t i o n   M o d e s   } for   interchangeable     mode   transfer   decisions t = 1 , 2 , 3 , , T                         set   of   Time   Period
Parameters
C i t p =   Purchasing   cos t   per   unit   from   supplier   i   at   time   t O i t =   Ordering   cost   incurred   by   customer   for   i th   supplier   at   time   t H o t =   Inventory   Holding   cost   per   unit   incurred   by   customer   at   time   t T C n t = Transportation   cost   per   kilometre   for   mode   n   at   time   t T r C n o t =   Transfer   cost   from   mode   n   to   mode   o   at   time   t C C i j t =   Custom   clearence   cost   while   moving   from   supplier   i   to   port   j   at   time   t T r T n o t =   Transfer   Time   from   mode   n   to   mode   o   at   time   t C C T i j t =   Custom   Clearence   Time   from   supplier   i   to   port   j   at   time   t d i j n = Distance   from   supplier   i   to   port   j   via   mode     n d j k n = Distance   from   port   j   to   warehouse   k   via   mode     n d k m n = Distance   from   warehouse   k   to   customer   m   via   mode   n w i e c o =   Weights   of   e c o n o m i c   criteria   obtained   from   FEAHP w i e =   Weights   of   e n v i r o n m e n t a l   criteria   obtained   from   FEAHP w i s =   Weights   of   s o c i a l   criteria   obtained   from   FEAHP W i e c o n o m i c =   Weights   of   supplier   i   from   FTOPSIS   w . r . t   e c o n o m i c   criteria W i e n v i r o n m e n t a l =   Weights   of   supplier   i   from   FTOPSIS   w . r . t   e n v i r o n m e n t a l   criteria W i s o c i a l =   Weights   of   supplier   i   from   FTOPSIS   w . r . t   s o c i a l   criteria C O 2 i j n =   Carbon   dioxide   emission   in   g r a m   p e r   k m   while   travelling   from   supplier   i   to   port   j   via   mode     n  
C O 2 j k n =   Carbon   dioxide   emission   in   g r a m   p e r   k m   while   travelling   from   port   j   to   warehouse   k   via   mode   n   C O 2 k l m =   Carbon   dioxide   emission   in   g r a m   p e r   k m   while   travelling   from   warehouse   k   to   cutomer   l   via   mode   m   S i t =   Maximum   capacity   of   i t h   supplier   at   time   t D m t = Demand   of   m t h   customer   at   time   t ξ i t   =   Average   Defect   Rate   of   Suppiler   i   at   time   t C A P w k t = Capacity   of   k t h   warehouse   at   time   t v n =   Velocity   of   mode     n C A P n = Capacity   of   vehicle   used   while   moving   through   mode     n  
Integer Variables
x i j n t   =   Quantity   shipped   from   supplier   i   to   port   j   via   mode   n   at   time   t x j k n t   =   Quantity   shipped   from   port   j   to   warehouse   k   via   mode   n   at   time   t x k m n t   =   Quantity   shipped   from   warehouse   k   to   to   customer   m     via   mode   n   at   time   t
Binary Variables
α i t =   { 1                 i f   supplier   i   i s   s e l e c t e d   a t   t i m e   t , 0               o t h e r w i s e                                                         β j t = { 1       i f   t r a n f e r   f r o m   mode   n   t o   o   a t   n o d e   j   a t   t i m e   t 0     o t h e r w i s e β k t = { 1       i f   t r a n f e r   f r o m   mode   n   t o   o   a t   n o d e   k   a t   t i m e   t 0     o t h e r w i s e           ϕ k t =   { 1                 i f   w a r e h o u s e   k   i s   s e l e c t e d   a t   t i m e   t , 0               o t h e r w i s e                                        
Objective Function 1: Total Cost (TC)
This objective function aims to minimize the sum of purchasing cost, ordering cost, inventory holding cost, transportation cost, transfer cost, and customs clearance cost. The equation below presents the minimization of total costs that occurred throughout the supply chain network.
M i n           TC   = i = 1 I j = 1 J n = 1 N t = 1 T ( C i t p   p e s + C i t p   m o s + C i t p   o p t 4 ) x i j n t + i = 1 I t = 1 T ( O i t p e s + O i t m o s + O i t o p t 4 ) α i t +                                                                     i = 1 I j = 1 J n = 1 N t = 1 T x i j n t 2 ( H o t p e s + H o t m o s + H o t o p t 4 ) +   ( i = 1 I j = 1 J n = 1 N t = 1 T ( T C n t p e s + T C n t m o s + T C n t o p t 4 ) d i j n x i j n t C a p n + j = 1 J k = 1 K n = 1 N t = 1 T ( T C n t p e s + T C n t m o s + T C n t o p t 4 ) d j k n x j k n t C a p n + k = 1 K m = 1 M n = 1 N t = 1 T ( T C n t p e s + T C n t m o s + T C n t o p t 4 ) d k m n x k m n t C a p n )               + ( i = 1 I j = 1 J n = 1 N o = 1 O t = 1 T T r C n o t β j t x i j n t + j = 1 J k = 1 K n = 1 N o = 1 O t = 1 T T r C n o t β k t x j k n t ) + i = 1 I j = 1 J n = 1 N t = 1 T ( C C i j t p e s + C C i j t m o s + C C i j t o p t 4 ) x i j n t α i t
Objective Function 2: Total Travel Time (TTT)
This objective function tends to minimize the total travel time from supplier to customer. It includes transportation time, transfer time, and customs clearance time. The minimization of total travel time is expressed as follows.
M i n           TTT =   ( i = 1 I j = 1 J n = 1 N t = 1 T d i j n x i j n t v n C A P n + j = 1 J k = 1 K n = 1 N t = 1 T d j k n x j k m t ϕ k t v n C A P n + k = 1 k m = 1 M n = 1 N t = 1 T d k m n x k m n t ϕ k t v n C A P n )                                                                                                               + ( j = 1 J n = 1 N o = 1 O t = 1 T T r T n o t x j k n t β j t C A P n + k = 1 K n = 1 N o = 1 O t = 1 T T r T n o t x k m n t β k t C A P n ) +   ( i = 1 I j = 1 J n = 1 N t = 1 T C C T i j t x i j n t α i t C A P n )
Objective Function 3: Environmental Impact (EI)
This objective function aims to minimize the total CO2 emissions throughout the transportation process. The equation below presents the minimization of the CO2 emissions for all the three transportation modes (i.e., ship, rail, and road).
M i n             EI = i = 1 I j = 1 J n = 1 N t = 1 T C O 2 i j n [ x i j n t C a p n ] d i j n + j = 1 J k = 1 K n = 1 N t = 1 T C O 2 j k n [ x j k n t C a p n ] d j k n   ϕ k t           + k = 1 K m = 1 M n = 1 N t = 1 T C O 2 k m n [ x k m n t C a p n ] d k m n   ϕ k t
Objective Function 4: Defect Rate (DR)
This objective function aims to minimize the average defect rate of the selected suppliers.
M i n           D R   =   i = 1 I j = 1 J n = 1 N t = 1 T ( ξ i t p e s + ξ i t m o s + ξ i t o p t 4 ) x i j n t α i t                                                                                                                      
Objective Function 5: Total Value of Sustainable Purchasing (TVSP)
This objective function aims to maximize the total value of purchased goods by maximizing the economic, social, and environmental criteria weights. The criteria weights obtained from fuzzy E-AHP are multiplied by supplier’s weights obtained from fuzzy TOPSIS and the quantity ordered from the supplier. The equation below presents the maximization of the total value of sustainable purchasing as follows.
M a x           TVSP = i = 1 I j = 1 J n = 1 N t = 1 T ( W i e n o n o m i c w i e c o + W i e n v i r o n m e n t a l w i e +   W i s o c i a l w i s ) x i j n t α i t                      
Constraints
j = 1 J n = 1 N x i j n t [ φ 2 S i t 1 + S i t 2 2 + ( 1 φ 2 ) S i t 3 + S i t 4 2 ] α i t                                       i I , t T                                                                                
m = 1 M n = 1 N x l m t =   [ φ 2 D m t 1 + D m t 2 2 + ( 1 φ 2 ) D m t 3 + D m t 4 2 ]                                   l L , t T                                              
i = 1 I n = 1 N x i j n t = k = 1 K n = 1 N x j k n t                               j J ,     t T                                                                                                                                                                                          
j = 1 J n = 1 N x j k n t = m = 1 M n = 1 N x k m n t                               k K ,     t T                                                                                                                                                                                  
k = 1 K n = 1 N x j k n t       [ φ 2 C A P w k t 1 + C A P w k t 2 2 + ( 1 φ 2 ) C A P w k t 3 + C A P w k t 4 2 ] β k t     j J ,     t T      
i = 1 I j = 1 J X i j n t C a p n t                                                     n N , t T                                                                                                                                                                          
j = 1 J m = 1 K X j k n t C a p n t                                                     n N , t T                                                                                                                                                                        
k = 1 K m = 1 M X k m n t C a p n t                                                     n N , t T                                                                                                                                                                      
x i j n t , x j k n t , x k m n t 0                                                           i , j , k , m , n , t                                                                                                            
α j t , β j t , β k t , ϕ k t   { 0 , 1 }                                           i , j , k , l , t                                                                                                                        
Based on fuzzy formulation, the constraints of the FMINLP model should be satisfied with a confidence value that is denoted as φ and is determined by decision-makers. Furthermore, mos, pes, and opt are the three prominent points (the most likely, most pessimistic, and most optimistic values), respectively. Each objective function corresponds to an equivalent linear membership function, which can be determined using Equation (16). Figure 3 further illustrates the membership functions for each objective.
μ b   =   { 1                                             i f   Z b M a x b M a x b Z b M a x b M i n b           i f   M i n b Z b M a x b 0                                           i f   Z b M i n b                                                                                                                                                    
where Z b represents the value of the b t h objective function and M a x b and M i n b represent the maximum and minimum values of b t h objective function, respectively.
The maximum and minimum values of each objective function are obtained using the above equations for the evaluation of membership degree.

4.5. Solving Algorithm: Augmented Epsilon Constraint 2 (AUGMECON2)

AUGMECON2 is an improved model of the AUGMECON generation method developed by Mavrotas and Florios [74]. It considers the complexities of discrete variables and non-convex problems by introducing the slack variable at each iteration. This technique transforms the multi-objective optimization problem into a mono objective by considering one of the objectives as the main objective function and shifting other objectives as a constraint subject to some ε values. The stepwise approach of the algorithm is presented in Figure 4 and the model is presented as follows:
m a x   ( f 1 ( x ) + e p s   ( S 2 r 2 + ( ( 10 1 ) S 3 r 3 ) + + ( 10 ( n 2 ) S n r n ) ) )                                                                                                         subject   to   f 2 ( x )   ?   S 2 = ε 2 f 3 ( x )   ?   S 3 = ε 3   f n ( x )   ?   S n = ε n  
where ε 2 , ε 3 ,…, ε n are the RHS values for each objective function, S 2 , S 3 ,…, S n are the slack variables, r 2 , r 3 ,…, r n are the ranges of n objective functions and e p s   [ 10 6   ,   10 3   ] .
The modification in the model helps to perform the lexicographic optimization (i.e., sequentially optimizing f 2 ,   f 3 ,   ,   f n ) to generate the exact Pareto sets. For Pareto solutions, the mathematical model is transformed as presented in Equation (17). In this study, the minimization of TC is considered as the main objective function and other objective functions are considered as constraints.
M i n   Z   =   M i n           TC Subject   to   Equations   ( 6 ) ( 15 )     and : M i n             T T T ε 2 [ M i n             T T T ] min ε 2 [ M i n             T T T ] max M i n           E I   ε 3 [ M i n           E I ] min ε 3 [ M i n           E I ] max M i n         D R ε 4 [ M i n           D R ] min ε 4 [ M a x           D R ] max M a x         T V S P ε 5 [ M a x         T V S P ] min ε 5 [ M a x         T V S P ] max

4.6. Selection of Best Pareto Solution

TOPSIS incorporated with the weights obtained by the decision-makers to select the top 10 Pareto solutions of AUGMECON2. Later on, the four best solutions for each φ-level were selected. TOPSIS along with weights obtained by the Delphi technique for each objective function is applied to get the best Pareto optimal solution for each time period.

5. Application and Evaluation: Case Study

This section evaluates the developed methodology using a real-time solar panel supply chain network in Pakistan as a case study. Pakistan is adversely affected by global climate change and is in desperate need of sustainable development [75]. One such avenue for sustainable development is the energy production through renewable energy sources. Past researches and surveys suggest that Pakistan has tremendous potential for solar energy [76]. According to a World Bank report [77], Pakistan’s current electricity demand can be met by utilizing just 0.071% of the country’s area for solar photovoltaic (solar PV). Furthermore, by 2025, Pakistan plans to increase its renewable resources to 8–9 gigawatts [78]. Therefore, supply chain of solar PV Panels in Pakistan presents an interesting area for application of SSSOA problem.
The parameters related to the number of suppliers, number of warehouses, the capacity of suppliers and warehouses, types of transportation modes, and quarterly demand were provided by a leading solar energy solution providing organizations in Pakistan and is presented in Supplementary data S1. The supply chain of the organization comprises of five potential suppliers, three warehouses, three transportation modes, and two customers. The MCDM techniques were implemented using the Microsoft Excel (2016) software. The FMOMINLP model is solved using Python 3.7 software on a personal computer of Intel Core i5 2.5 GHz processor with 8 GB RAM. To solve the SSSOA problem for the solar panel supply chain under study, the developed fuzzy multi-objective optimization approach was applied as illustrated in the following two sub-sections.

5.1. Sustainable Criteria Weighting

Weights of criteria and sub-criteria were evaluated using FEAHP based on the preferences set by decision-makers while simultaneously assess the consistency ratio (CR) of the decision-making process. The final weights of each criterion are presented in Table 6.
The ranking for the sustainable criteria is presented as economic > environmental > social for decision-makers assessing the suppliers. According to decision-makers, economic criteria ranked highest followed by environmental and social criteria. “Cost” is the most significant sub-criteria amongst eight sets of economic sub-criteria. Similarly, for environmental and social criteria, decision-makers considered “Environment Management System” and “Rights and Health of Employees” as significant sub-criterion for the sustainable supplier selection. These results provide clear insight for the decision-makers to take necessary actions to provide better product quality while minimizing cost and incorporating the environmental management system and rights and health of employees for sustainable performance.

5.2. Sustainable Supplier Ranking

After evaluating the weights for sustainable criteria through FEAHP, the next step was to rate the potential suppliers based on these criteria. FTOPSIS was used to determine the weights of each supplier for sustainable criteria. Three decision-makers were involved in this process to rate the potential suppliers based on specified criteria. Firstly, the relative closeness matrix for each supplier for sustainable criteria is evaluated using FTOPSIS and is presented in Table 7. The threshold of the closeness coefficient defined for the selection of the best supplier is 0.50. Therefore, supplier 1, supplier 2, and supplier 5 were selected for the allocation of optimum order.

5.3. Sustainable Order Allocation

The proposed fuzzy mathematical model was initially solved by considering each objective separately. A on-linear solver is used to estimate the ideal solution for each objective function and is presented in Table 8.
In the second phase, AUGMECON2 was used to simultaneously solve the objectives. Pareto solutions were generated for each time period to find the optimal order quantity from the potential suppliers under fuzzified input parameters. TOPSIS augmented with CRITIC weight method was used to further evaluate the Pareto solution for the final solution.

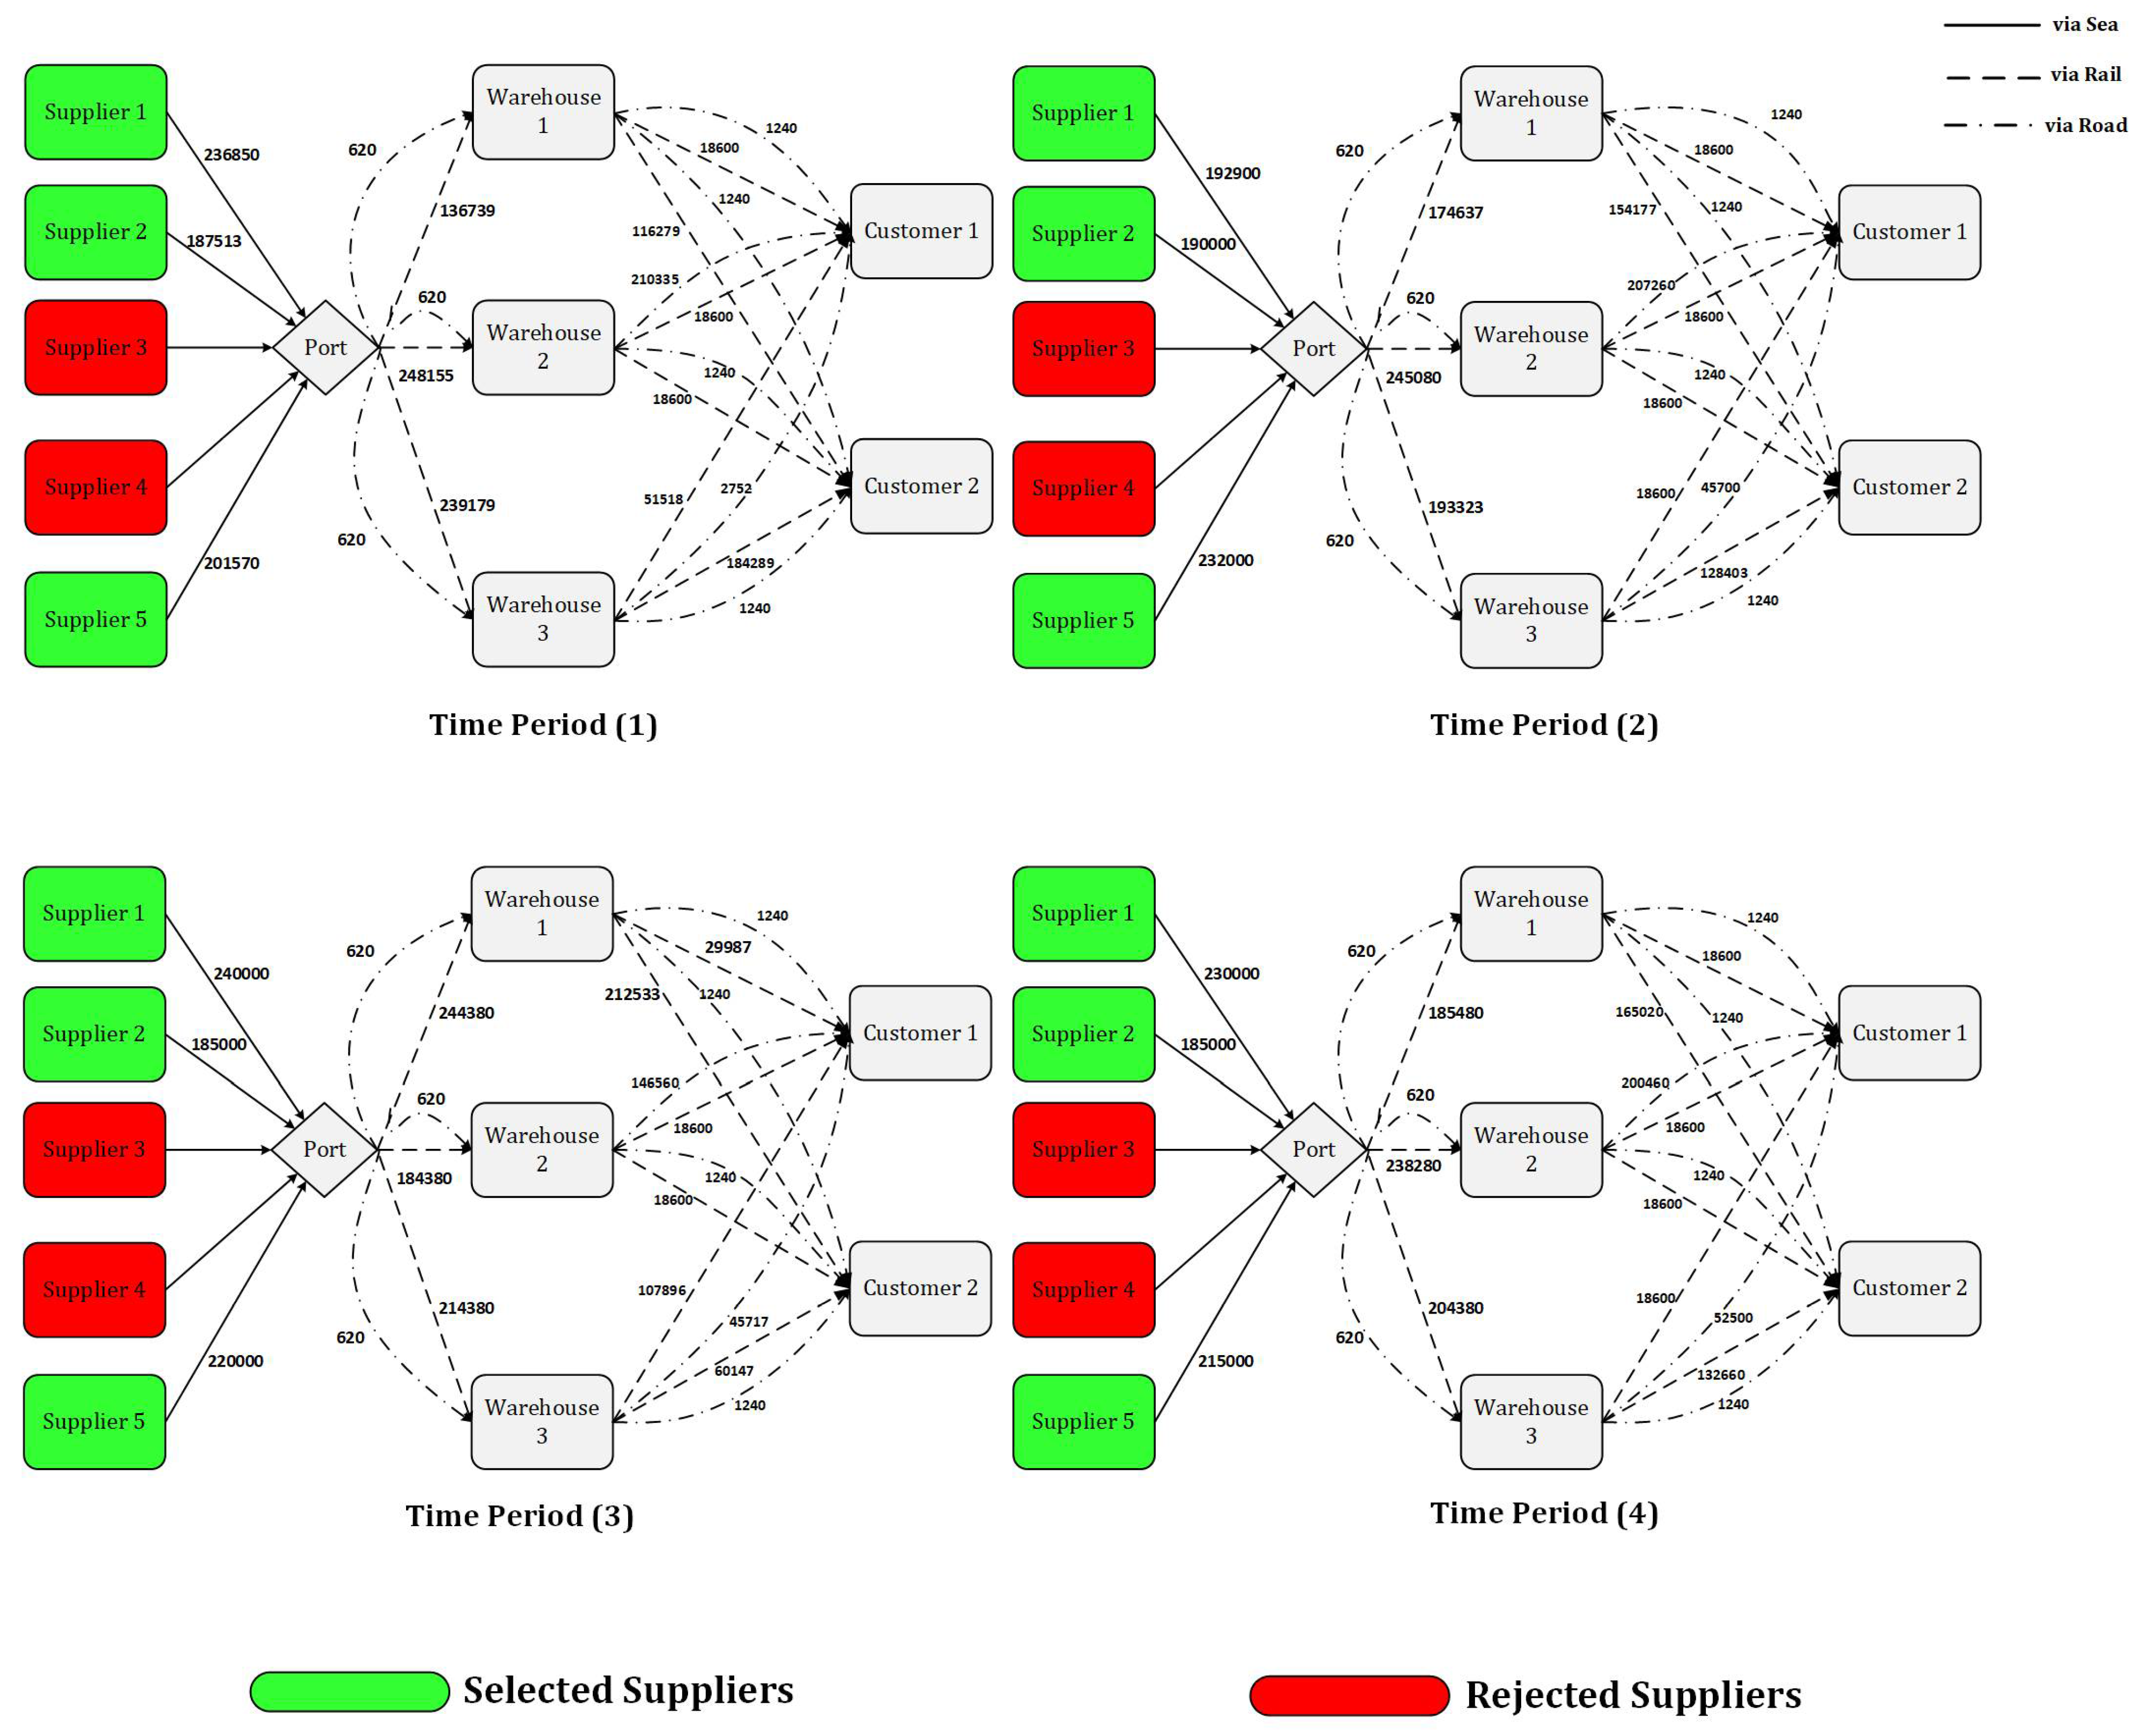
5.4. Optimal Order Using AUGMECON2

For solving FMINLP mathematical model presented in Section 4.1, a payoff for objective functions was created for time period t . The min/max values of each objective function were evaluated using Equations (1)–(15) and presented in Table 9.
Table 9. Payoff Table using AUGMECON2 for Time Period “ t ”.
Time PeriodObjective FunctionTCTTTEIDRTVSP
t 1 TC86,120,64724154,457,128220,569,451105,916
TTT86,328,15919942,306,374232,145,513105,552
EI86,328,15819942,306,373232,145,513105,552
DR86,328,16919942,306,405232,145,513105,552
TVSP86,206,13319942,306,523209,790,035106,032
t 2 TC84,570,42424074,543,832232,005,750103,943
TTT84,945,80719582,270,702232,005,750103,382
EI84,948,07619642,277,245232,005,750103,382
DR84,884,55619642,277,302232,005,750103,504
TVSP84,662,70919642,277,337179,734,575104,504
t 3 TC88,801,95827605,655,112228,278,750109,050
TTT88,908,45220882,402,851228,278,750109,000
EI88,908,45220882,402,851228,278,750109,000
DR88,908,45220882,402,851228,278,750109,000
TVSP88,883,01720882,402,855223,620,000109,100
t 4 TC86,702,90624724,643,109216,530,314106,626
TTT86,814,34220182,331,549218,961,250106,550
EI86,810,79420182,330,471218,961,250106,550
DR86,810,74820192,330,815218,961,250106,550
TVSP86,785,14520192,330,824214,302,500106,650
The {(max, min)} values of each objective function from t 1 to t 4 are presented in Table 10.
Table 10. Minimum and Maximum Value of Objective functions for t 1 t 4 .
OFs t 1 t 2 t 3 t 4
MaxMinMaxMinMaxMinMaxMin
TC86,328,16986,120,64784,948,07584,570,42488,908,45288,801,95786,814,34286,702,905
TTT24141994240619582760208724722018
EI4,457,1282,306,3734,543,8322,270,7015,655,1122,402,8504,643,1092,330,471
DR232,145,512209,790,034232,005,750179,734,575228,278,750223,620,000218,961,250214,302,500
TVSP106,032105,552104,504103,382109,100109,000106,650106,550
Once the min/max values of OFs were evaluated, the next step is the division of values into 10 segments between the minimum and maximum values. The 10 segments were assigned individually to ϵ 2 , ϵ 3 ,   ϵ 4 and ϵ 5 with the step interval of 2 using Equation (17). The combinations of ϵ -values are presented in Table 11.
Table 12 shows the values for the five objectives for each φ -level based on ε-iteration obtained in Table 11 for each time period. For instance, Solution 3 in Table 12 for t 4 shows TC of $86,703,205, TTT of 2472 h. EI of 4,643,103 g, a DR of 214,302,500, and TVSP of 106,650. The ε values corresponding to this solution are as follows: ε 1 = 2245 ,   ε 2 = 3,486,790 ,   ε 3 = 214,302,500   a n d   ε 4 = 106,650 . The iteration runs for each combination of ε -values corresponding to each φ -level to extract the Pareto optimal solution. The maximum number of iterations was set as 65,000.
It is worth mentioning that four φ-levels (0.25, 0.50, 0.75, and 1) with an incremental step of 0.25 were assigned by the decision makers for each solution. Finally, Equation (16) was used to determine the respective membership degrees ( μ b ) based on the objective values obtained through the AUGMECON2 as shown in Table 13.

5.5. Selection of Best Solution

To obtain the best result from the above Pareto solutions of AUGMECON2, TOPSIS augmented with OFs weights was applied. The weights of the functions were assigned by the DM’s using Delphi’s technique and are presented in Table 14. DMs should select one solution to allocate the order for each time period. The selection of the final solution following DM’s preferences is a challenge due to the little difference found among the values of the five objectives revealed. Therefore, after extracting the top 10 Pareto optimal solutions at 4—levels for t 1 t 4 , TOPSIS is applied to calculate the closeness coefficient (CC) matrix is presented in Table 15.
Table 16 presents the finalized results for each objective function depending upon the results obtained from Table 15.
Figure 5 presents the optimal order allocation to suppliers to meet the demand for time period t 1 to time period t 4 . Considering the aspect of sustainability in the SSSOA problem, the results obtained from AUGMECON2 yield a higher transportation cost for the enterprise. However, showed a reasonable performance by revealing Pareto solutions that were close enough to the ideal solutions. Moreover, the computational complexity of the FMOOM is linked with the time (e.g., CPUs) required to solve a problem within resources (e.g., computer specifications). Table 8 presents the run time required to reveal the solutions for the AUGMECON2 algorithm. Due to the complex and large-scale network problem, its runtime is considerably low, which shows the developed FMOOM is a tractable time-wise model.

6. Managerial Insight

The implications of the above-demonstrated results from the managerial perspective are as follows:
  • The comprehensive sustainability-based analysis has been presented using the proposed multi-phase holistic framework for solving the SSSOA problem.
  • The sustainability-based analysis of the solar panels’ supply chain has been conducted for the first time to provide an insight for the managers.
  • The comprehensive fuzzified model along with a multi-modal transportation network is developed to address the uncertainties encountered in demand, capacity, cost, and defect rate. Thus, making the decision framework more flexible for the managers.

7. Conclusions and Future Recommendations

Supplier selection and order allocation are the two main decisions in supply chain management.
In recent years, the complexity of these decisions has increased with the augmentation of sustainability in the processes. It is a multi-criteria decision-making approach that helps enterprises lead towards sustainable performance. Its core concept is to select the suppliers that meet the sustainable criteria (i.e., economic, environmental, and social) and allocate orders to enhance the overall sustainable performance of an enterprise. This study aims to explore the supply chain of Solar PV Panels in context of SSSOA problem. It is worth mentioning here that no study in literature has attempted to solve SSSOA for Solar PV Panels. Accordingly, this study presents a comprehensive three-phase decision framework for the Solar PV Panels supply chain. In the first step, criteria and sub-criteria were identified for supplier selection and solved using FEAHP and FTOPSIS. In the second phase, a fuzzy multi-objective mixed-integer non-linear programming mathematical model was developed that incorporated the uncertainties of demand, suppliers and warehouses capacity levels, and input parameters (e.g., purchasing cost, transportation cost, defect rate, etc.). The following main conclusions can be drawn from this work:
  • The result revealed that amongst the sustainable criteria, cost, environmental management system, and rights and health of employees ranked highest.
  • Out of five potential suppliers of solar panels located in various parts of the world, three of them met the decision makers’ criteria.
  • Transfer cost and custom clearance cost contributed 54% towards the overall cost of the supply chain network.
  • Transfer time and custom clearance time contributed 13% to the overall travel time of the supply chain network.
  • Of the three modes of transportation (i.e., sea, rail, road), the shipment from rail dominated the overall transportation process with a share of 53%.
  • The defect rate of the suppliers played a critical role in the selection and allocation of orders.
The integration of FST with various real-time parameters (multi-modal, multi-period, customer clearance cost/time, and transfer cost/time) exemplifies the superiority of this study over similar SSSOA methodologies. Future studies can implement the proposed framework to various industries and supply chains. The decision framework can be improved by integrating multi-product, suppliers’ resilience, and robustness by incorporating the effects of disruptions due to geographic proximity. The inclusion of more environmental and social aspects in the order allocation can further strengthen the decision framework.

Supplementary Materials

The following are available online at https://www.mdpi.com/article/10.3390/su132313216/s1.

Author Contributions

R.A.L.: Conceptualization, Methodology, Formal analysis, Investigation, Writing—Original Draft. S.S.W.: Conceptualization, Methodology, Writing—Original Draft, Supervision. T.Z.: Conceptualization, Resources. U.G.: Writing—Review & Editing. M.S.A.: Writing—Review & Editing, funding acquisition. J.S.: Project administration, reviewing, funding acquisition. All authors have read and agreed to the published version of the manuscript.

Funding

This research received no external funding.

Institutional Review Board Statement

Not Applicable.

Informed Consent Statement

Not Applicable.

Data Availability Statement

Not Applicable.

Conflicts of Interest

The authors declare no conflict of interest.

Abbreviations

AUGMECON2Augmented Epsilon Constraint 2
CRITICCriteria Importance Through Intercriteria Correlation
CCCloseness Coefficient
EIEnvironmental Impact
FMILPFuzzy Mixed-Integer Linear Programming
FEAHPFuzzy Extended Analytical Hierarchy Process
FMINLPFuzzy Mixed-Integer Non-Linear Programming
FMOMINLPFuzzy Multi-Objective Mixed-Integer Non-Linear Programming
FSTFuzzy Set Theory
FTOPSISFuzzy Technique for Order of Preference by Similarity to Ideal Solution
MCDMMulti Criteria Decision Making
MINLPMixed Integer Non-Linear Programming
MINLPMixed Integer Linear Programming
PVPhotovoltaic
SCMSupply Chain Management
SSCMSustainable Supply Chain Management
SSSSustainable Supplier Selection
SSSOASustainable Supplier Selection and Order Allocation
TCTotal Cost
TTTTotal travel Time

References

  1. Florescu, M.S.; Ceptureanu, E.G.; Cruceru, A.F.; Ceptureanu, S.I. Sustainable supply chain management strategy influence on supply chain management functions in the oil and gas distribution industry. Energies 2019, 12, 1632. [Google Scholar] [CrossRef] [Green Version]
  2. Grzybowska, K. Identification and classification of global theoretical trends and supply chain development directions. Energies 2021, 14, 4414. [Google Scholar] [CrossRef]
  3. Tsai, F.M.; Bui, T.D.; Tseng, M.L.; Ali, M.H.; Lim, M.K.; Chiu, A.S. Sustainable supply chain management trends in world regions: A data-driven analysis. Resour. Conserv. Recycl. 2021, 167, 105421. [Google Scholar] [CrossRef]
  4. Shi, X.; Zhang, X.; Dong, C.; Wen, S. Economic performance and emission reduction of supply chains in different power structures perspective of sustainable investment. Energies 2018, 11, 983. [Google Scholar] [CrossRef] [Green Version]
  5. Chkanikova, O.; Sroufe, R. Third-party sustainability certifications in food retailing: Certification design from a sustainable supply chain management perspective. J. Clean. Prod. 2021, 282, 124344. [Google Scholar] [CrossRef]
  6. Dai, J.; Xie, L.; Chu, Z. Developing sustainable supply chain management: The interplay of institutional pressures and sustainability capabilities. Sustain. Prod. Consum. 2021, 28, 254–268. [Google Scholar] [CrossRef]
  7. Khan, S.A.R.; Yu, Z.; Golpira, H.; Sharif, A.; Mardani, A. A state-of-the-art review and meta-analysis on sustainable supply chain management: Future research directions. J. Clean. Prod. 2021, 278, 123357. [Google Scholar] [CrossRef]
  8. Cui, L.; Wu, H.; Dai, J. Modelling flexible decisions about sustainable supplier selection in multitier sustainable supply chain management. Int. J. Prod. Res. 2021, 18, 1–22. [Google Scholar] [CrossRef]
  9. Liaqait, R.A.; Warsi, S.S.; Agha, M.H.; Zahid, T.; Becker, T. A multi-criteria decision framework for sustainable supplier selection and order allocation using multi-objective optimization and fuzzy approach. Eng. Optim. 2021, 31, 1–22. [Google Scholar] [CrossRef]
  10. Mattiussi, A.; Rosano, M.; Simeoni, P. A decision support system for sustainable energy supply combining multi-objective and multi-attribute analysis: An Australian case study. Decis. Support Syst. 2014, 57, 150–159. [Google Scholar] [CrossRef]
  11. Chen, C.T.; Lin, C.T.; Huang, S.F. A fuzzy approach for supplier evaluation and selection in supply chain management. Int. J. Prod. Econ. 2006, 102, 289–301. [Google Scholar] [CrossRef]
  12. Ferreira, L.; Borenstein, D. A fuzzy-Bayesian model for supplier selection. Expert Syst. Appl. 2012, 39, 7834–7844. [Google Scholar]
  13. Jolai, F.; Yazdian, S.A.; Shahanaghi, K.; Khojasteh, M.A. Integrating fuzzy TOPSIS and multi-period goal programming for purchasing multiple products from multiple suppliers. J. Purch. Supply Manag. 2011, 17, 42–53. [Google Scholar] [CrossRef]
  14. Faez, F.; Ghodsypour, S.H.; O’Brien, C. Vendor selection and order allocation using an integrated fuzzy case-based reasoning and mathematical programming model. Int. J. Prod. Econ. 2009, 121, 395–408. [Google Scholar] [CrossRef]
  15. Aouadni, S.; Aouadni, I.; Rebaï, A. A systematic review on supplier selection and order allocation problems. J. Ind. Eng. Int. 2019, 15, 267–289. [Google Scholar] [CrossRef] [Green Version]
  16. Demirtas, E.A.; Üstün, Ö. An integrated multiobjective decision making process for supplier selection and order allocation. Omega 2008, 36, 76–90. [Google Scholar] [CrossRef]
  17. Hassanzadeh, S.; Razmi, J.; Zhang, G. Supplier selection and order allocation based on fuzzy SWOT analysis and fuzzy linear programming. Expert Syst. Appl. 2011, 38, 334–342. [Google Scholar]
  18. Hamdan, S.; Cheaitou, A. Green supplier selection and order allocation using an integrated fuzzy TOPSIS, AHP and IP approach. In Proceedings of the IEOM 2015—5th International Conference on Industrial Engineering and Operations Management, Dubai, United Arab Emirates, 3–5 March 2015; pp. 1390–1399. [Google Scholar]
  19. Fan, Z.; Li, S.; Gao, Z. Multiobjective Sustainable Order Allocation Problem Optimization with Improved Genetic Algorithm Using Priority Encoding. Math. Probl. Eng. 2019, 2019, 8218709. [Google Scholar] [CrossRef]
  20. Cheraghalipour, A.; Farsad, S. A bi-objective sustainable supplier selection and order allocation considering quantity discounts under disruption risks: A case study in plastic industry. Comput. Ind. Eng. 2018, 118, 237–250. [Google Scholar] [CrossRef]
  21. Li, F.; Wu, C.H.; Zhou, L.; Xu, G.; Liu, Y.; Tsai, S.B. A model integrating environmental concerns and supply risks for dynamic sustainable supplier selection and order allocation. Soft Comput. 2021, 25, 535–549. [Google Scholar] [CrossRef]
  22. Su, W.; Zhang, D.; Zhang, C.; Streimikiene, D. Sustainability assessment of energy sector development in China and European Union. Sustain. Dev. 2020, 28, 1063–1076. [Google Scholar] [CrossRef]
  23. Li, D.; Heimeriks, G.; Alkemade, F. Knowledge flows in global renewable energy innovation systems: The role of technological and geographical distance. Technol. Anal. Strateg. Manag. 2021, 23, 1–15. [Google Scholar] [CrossRef]
  24. Sun, H.; Awan, R.U.; Nawaz, M.A.; Mohsin, M.; Rasheed, A.K.; Iqbal, N. Assessing the socio-economic viability of solar commercialization and electrification in south Asian countries. Environ. Dev. Sustain. 2021, 23, 9875–9897. [Google Scholar] [CrossRef]
  25. World Bank. Solar. 2017. Available online: https://www.worldbank.org/en/results/2017/11/29/solar (accessed on 29 September 2021).
  26. Mastrocinque, E.; Ramírez, F.J.; Honrubia-Escribano, A.; Pham, D.T. An AHP-based multi-criteria model for sustainable supply chain development in the renewable energy sector. Expert Syst. Appl. 2020, 150, 113321. [Google Scholar] [CrossRef]
  27. Zimon, D.; Domingues, P. Proposal of a concept for improving the sustainable management of supply chains in the textile industry. Fibres Text. East. Eur. 2018, 26, 8–12. [Google Scholar] [CrossRef]
  28. Tseng, M.L.; Wu, K.J.; Lim, M.K.; Wong, W.P. Data-driven sustainable supply chain management performance: A hierarchical structure assessment under uncertainties. J. Clean. Prod. 2019, 227, 760–771. [Google Scholar] [CrossRef]
  29. Vijayvargiya, A.; Dey, A.K. An analytical approach for selection of a logistics provider. Manag. Decis. 2010, 48, 403–418. [Google Scholar] [CrossRef]
  30. Ayhan, M.B.; Kilic, H.S. A two stage approach for supplier selection problem in multi-item/multi-supplier environment with quantity discounts. Comput. Ind. Eng. 2015, 85, 1–12. [Google Scholar] [CrossRef]
  31. Abdollahzadeh, H.; Atashgar, K. Optimal design of a multi-state system with uncertainty in supplier selection. Comput. Ind. Eng. 2017, 105, 411–424. [Google Scholar] [CrossRef]
  32. Wang, T.C.; Tsai, S.Y. Solar panel supplier selection for the photovoltaic system design by using fuzzy multi-criteria decision making (MCDM) approaches. Energies 2018, 11, 1989. [Google Scholar] [CrossRef] [Green Version]
  33. Awasthi, A.; Govindan, K.; Gold, S. Multi-tier sustainable global supplier selection using a fuzzy AHP-VIKOR based approach. Int. J. Prod. Econ. 2018, 195, 106–117. [Google Scholar] [CrossRef] [Green Version]
  34. Bland, A.R.; Schaefer, A. Different varieties of uncertainty in human decision-making. Front. Neurosci. 2012, 6, 85. [Google Scholar] [CrossRef] [PubMed] [Green Version]
  35. Jahan, A.; Edwards, K.L.; Bahraminasab, M. Multi-Criteria Decision Analysis for Supporting the Selection of Engineering Materials in Product Design; Elsevier: Amsterdam, The Netherlands, 2016. [Google Scholar]
  36. Govindan, K.; Rajendran, S.; Sarkis, J.; Murugesan, P. Multi criteria decision making approaches for green supplier evaluation and selection: A literature review. J. Clean. Prod. 2015, 98, 66–83. [Google Scholar] [CrossRef]
  37. Govindan, K.; Paam, P.; Abtahi, A.R. A fuzzy multi-objective optimization model for sustainable reverse logistics network design. Ecol. Indic. 2016, 67, 753–768. [Google Scholar] [CrossRef]
  38. Büyüközkan, G.; Çifçi, G. A novel fuzzy multi-criteria decision framework for sustainable supplier selection with incomplete information. Comput. Ind. 2011, 62, 164–174. [Google Scholar] [CrossRef]
  39. Luthra, S.; Govindan, K.; Kannan, D.; Mangla, S.K.; Garg, C.P. An integrated framework for sustainable supplier selection and evaluation in supply chains. J. Clean. Prod. 2017, 140, 1686–1698. [Google Scholar] [CrossRef]
  40. Memari, A.; Dargi, A.; Jokar, M.R.A.; Ahmad, R.; Rahim, A.R.A. Sustainable supplier selection: A multi-criteria intuitionistic fuzzy TOPSIS method. J. Manuf. Syst. 2019, 50, 9–24. [Google Scholar] [CrossRef]
  41. Zhang, J.; Yang, D.; Li, Q.; Lev, B.; Ma, Y. Research on sustainable supplier selection based on the rough dematel and fvikor methods. Sustainability 2021, 13, 88. [Google Scholar] [CrossRef]
  42. Zadeh, L.A. Fuzzy Sets. J. Inf. Control 1965, 8, 338–353. [Google Scholar] [CrossRef] [Green Version]
  43. Gupta, H.; Barua, M.K. A novel hybrid multi-criteria method for supplier selection among SMEs on the basis of innovation ability. Int. J. Logist. Res. Appl. 2018, 21, 201–223. [Google Scholar] [CrossRef]
  44. Gupta, P.; Govindan, K.; Mehlawat, M.K.; Kumar, S. A weighted possibilistic programming approach for sustainable vendor selection and order allocation in fuzzy environment. Int. J. Adv. Manuf. Technol. 2016, 86, 1785–1804. [Google Scholar] [CrossRef]
  45. Kahraman, C.; Onar, S.C.; Oztaysi, B. Fuzzy Multicriteria Decision-Making: A Literature Review. Int. J. Comput. Intell. Syst. 2015, 8, 637–666. [Google Scholar] [CrossRef] [Green Version]
  46. Bhuniya, S.; Pareek, S.; Sarkar, B.; Sett, B.K. A smart production process for the optimum energy consumption with maintenance policy under a supply chain management. Processes 2021, 9, 19. [Google Scholar] [CrossRef]
  47. Alavi, B.; Tavana, M.; Mina, H. A Dynamic Decision Support System for Sustainable Supplier Selection in Circular Economy. Sustain. Prod. Consum. 2021, 27, 905–920. [Google Scholar] [CrossRef]
  48. Orji, I.J.; Ojadi, F. Investigating the COVID-19 pandemic’s impact on sustainable supplier selection in the Nigerian Manufacturing Sector. Comput. Ind. Eng. 2021, 160, 107588. [Google Scholar] [CrossRef] [PubMed]
  49. Wang, R.; Li, X.; Li, C. Optimal selection of sustainable battery supplier for battery swapping station based on Triangular fuzzy entropy—MULTIMOORA method. J. Energy Storage 2021, 34, 102013. [Google Scholar] [CrossRef]
  50. Ecer, F.; Pamucar, D. Sustainable supplier selection: A novel integrated fuzzy best worst method (F-BWM) and fuzzy CoCoSo with Bonferroni (CoCoSo’B) multi-criteria model. J. Clean. Prod. 2020, 266, 121981. [Google Scholar] [CrossRef]
  51. Bektur, G. An integrated methodology for the selection of sustainable suppliers and order allocation problem with quantity discounts, lost sales and varying supplier availabilities. Sustain. Prod. Consum. 2020, 23, 111–127. [Google Scholar] [CrossRef]
  52. Ghorbani, M.; Bahrami, M.; Arabzad, S.M. An Integrated Model For Supplier Selection and Order Allocation; Using Shannon Entropy, SWOT and Linear Programming. Procedia-Soc. Behav. Sci. 2012, 41, 521–527. [Google Scholar] [CrossRef] [Green Version]
  53. Rabieh, M.; Rafsanjani, A.F.; Babaei, L.; Esmaeili, M. Sustainable supplier selection and order allocation: An integrated delphi method, fuzzy topsis, and multi-objective programming model. Sci. Iran. 2019, 26, 2524–2540. [Google Scholar] [CrossRef] [Green Version]
  54. Sadeghi, A.S.; Sadati, A.; Rabbani, M. ustainable design of a municipal solid waste management system in an integrated closed-loop supply chain network using a fuzzy approach: A case study. J. Ind. Prod. Eng. 2021, 38, 1–18. [Google Scholar]
  55. Mohammed, A. Towards a sustainable assessment of suppliers: An integrated fuzzy TOPSIS-possibilistic multi-objective approach. Ann. Oper. Res. 2020, 293, 639–668. [Google Scholar] [CrossRef]
  56. Goren, H.G. A Decision Framework for Sustainable Supplier Selection and Order Allocation with Lost Sales. J. Clean. Prod. 2018, 183, 1156–1169. [Google Scholar] [CrossRef]
  57. Kumar, D.; Rahman, Z.; Chan, F.T.S. A fuzzy AHP and fuzzy multi-objective linear programming model for order allocation in a sustainable supply chain: A case study. Int. J. Comput. Integr. Manuf. 2017, 30, 535–551. [Google Scholar] [CrossRef]
  58. Ghorabaee, M.K.; Amiri, M.; Zavadskas, E.K.; Turskis, Z.; Antucheviciene, J. A new multi-criteria model based on interval type-2 fuzzy sets and EDAS method for supplier evaluation and order allocation with environmental considerations. Comput. Ind. Eng. 2017, 112, 156–174. [Google Scholar] [CrossRef]
  59. Firouzi, F.; Jadidi, O. Multi-objective model for supplier selection and order allocation problem with fuzzy parameters. Expert Syst. Appl. 2021, 180, 115129. [Google Scholar] [CrossRef]
  60. Nazari-Shirkouhi, S.; Shakouri, H.; Javadi, B.; Keramati, A. Supplier selection and order allocation problem using a two-phase fuzzy multi-objective linear programming. Appl. Math. Model. 2013, 37, 9308–9323. [Google Scholar] [CrossRef]
  61. Mohammed, X.L.A.; Setchi, R.; Filip, M.; Harris, I. An integrated methodology for a sustainable two-stage supplier selection and order allocation problem. J. Clean. Prod. 2018, 192, 99–114. [Google Scholar] [CrossRef] [Green Version]
  62. Beiki, H.; Seyedhosseini, S.M.; Ponkratov, V.V.; Zekiy, A.O.; Ivanov, S.A. Addressing a sustainable supplier selection and order allocation problem by an integrated approach: A case of automobile manufacturing. J. Ind. Prod. Eng. 2021, 38, 239–253. [Google Scholar] [CrossRef]
  63. Nasr, A.K.; Tavana, M.; Alavi, B.; Mina, H. A novel fuzzy multi-objective circular supplier selection and order allocation model for sustainable closed-loop supply chains. J. Clean. Prod. 2021, 287, 124994. [Google Scholar] [CrossRef]
  64. Sodenkamp, M.A. A Multicriteria Multilevel Group Decision Method for Supplier Selection and Order Allocation. Int. J. Strateg. Decis. Sci. 2015, 3, 81–105. [Google Scholar] [CrossRef]
  65. Vahidi, F.; Torabi, S.A.; Ramezankhani, M.J. Sustainable supplier selection and order allocation under operational and disruption risks. J. Clean. Prod. 2018, 174, 1351–1365. [Google Scholar] [CrossRef]
  66. Omair, M.; Noor, S.; Tayyab, M.; Maqsood, S.; Ahmed, W.; Sarkar, B.; Habib, M.S. The Selection of the Sustainable Suppliers by the Development of a Decision Support Framework Based on Analytical Hierarchical Process and Fuzzy Inference System. Int. J. Fuzzy Syst. 2021, 23, 1986–2003. [Google Scholar] [CrossRef]
  67. Khoshfetrat, S.; Galankashi, M.R.; Almasi, M. Sustainable supplier selection and order allocation: A fuzzy approach. Eng. Optim. 2020, 52, 1494–1507. [Google Scholar] [CrossRef]
  68. Tayyab, M.; Sarkar, B. An interactive fuzzy programming approach for a sustainable supplier selection under textile supply chain management. Comput. Ind. Eng. 2021, 155, 107164. [Google Scholar] [CrossRef]
  69. Jia, R.; Liu, Y.; Bai, X. Sustainable supplier selection and order allocation: Distributionally robust goal programming model and tractable approximation. Comput. Ind. Eng. 2020, 140, 106267. [Google Scholar] [CrossRef]
  70. Tirkolaee, E.B.; Mardani, A.; Dashtian, Z.; Soltani, M.; Weber, G.W. A novel hybrid method using fuzzy decision making and multi-objective programming for sustainable-reliable supplier selection in two-echelon supply chain design. J. Clean. Prod. 2020, 250, 119517. [Google Scholar] [CrossRef]
  71. Mohammed, A.; Harris, I.; Soroka, A.; Nujoom, R. A hybrid MCDM-fuzzy multi-objective programming approach for a G-resilient supply chain network design. Comput. Ind. Eng. 2019, 127, 297–312. [Google Scholar] [CrossRef]
  72. Mohammed, A.; Harris, I.; Govindan, K. A hybrid MCDM-FMOO approach for sustainable supplier selection and order allocation. Int. J. Prod. Econ. 2019, 217, 171–184. [Google Scholar] [CrossRef]
  73. Wang, Y.M.; Luo, Y.; Hua, Z. On the extent analysis method for fuzzy AHP and its applications. Eur. J. Oper. Res. 2008, 186, 735–747. [Google Scholar] [CrossRef]
  74. Mavrotas, G.; Florios, K. An improved version of the augmented s-constraint method (AUGMECON2) for finding the exact pareto set in multi-objective integer programming problems. Appl. Math. Comput. 2013, 219, 9652–9669. [Google Scholar] [CrossRef]
  75. Ali, S.; Poulova, P.; Akbar, A.; Javed, H.M.U.; Danish, M. Determining the Influencing Factors in the Adoption of Solar Photovoltaic Technology in Pakistan: Model Approach sector is worldwide. Economies 2020, 8, 108. [Google Scholar] [CrossRef]
  76. Sheikh, M.A. Renewable energy resource potential in Pakistan. Renew. Sustain. Energy Rev. 2009, 13, 2696–2702. [Google Scholar] [CrossRef]
  77. World Bank. Expanding Renewable Energy in Pakistan’s Electricity Mix. 2020. Available online: https://www.worldbank.org/en/news/feature/2020/11/09/a-renewable-energy-future-for-pakistans-power-system (accessed on 24 September 2021).
  78. Jazeera, A. Pakistan Plans Renewables for a Fifth of Energy Supplies by 2025. 2019. Available online: https://www.aljazeera.com/economy/2019/7/23/pakistan-plans-renewables-for-a-fifth-of-energy-supplies-by-2025 (accessed on 24 September 2021).
Figure 1. A Multi-Echelon Supply Chain Network Under Study.
Sustainability 13 13216 g001
Figure 2. Generic Framework of Proposed Methodology.
Sustainability 13 13216 g002
Figure 3. Membership Function for TC, TTT, EI, DR, TVSP.
Sustainability 13 13216 g003
Figure 4. Steps of AUGMECON2.
Sustainability 13 13216 g004
Figure 5. Best Optimal Solution for t 1 ,   t 2 ,   t 3 , and t 4 .
Sustainability 13 13216 g005
Table 1. Relevant Studies of Criteria and Solving Techniques used for Sustainable Supplier Selection.
Study Criteria UsedFuzzy MCDM Technique
Alavi et al. [47]Costs
Quality
Responsiveness
Delivery
Risk
Technology Capability
Waste Management
Environmental Management System
Human Rights
Product Responsibility
Health and Safety Management
Ethical Issues
Information disclosure
Fuzzy Best Worst Method
Orji and Ojadi [48]Product price/cost
Financial capability
Quality
Environmental competence
Green product design
Regular environmental audits
Presence of training facilities
Work safety procedures
Compliance with regulations
Information disclosure
Social responsibility
Use of personal protective equipment
Presence of information technologies
Adherence to policy changes
Economic recovery programs
Fuzzy Analytical Hierarchy Process (FAHP)
Wang and Tsai [32]Cost
Quality
Capacity
Flexibility
Technological Capability
Environmental/Economic Management System
Social responsibility
Delay
Reputation
Customer Complaints
Defect Rate
FAHP
Data Envelopment Analysis
Wang et al. [49]Transportation Cost
Product Price
Financial Ability
Pollutant Discharge
Resource Consumption
Recycle System
Flexibility
Rights of Stakeholders
Employee right and welfare Information Disclosure
VIKOR
FAHP
Ecer and Pamucar [50]Delivery (lead) time
Transportation cost
Service
Price of product
Quality of product
Pollution control
EMS
Environmental competencies
Green management
Environmental cost
Staff training
Health and safety
Information Disclosure
The rights of stakeholders
The interests and rights of the employee
Fuzzy Best Worst Method
Bonferroni Combined Compromise Solution
VIKOR: VIseKriterijumska Optimizacija I Kompromisno Resenje.
Table 2. Classification of Studies w.r.t Mathematical Model, Objectives, and Solving Techniques for Order Allocation.
StudyType of
Mathematical Model
Objectives Solution Approach
Bektur [51]FMILPTotal Cost
Value of Purchasing
Augmented Epsilon-Constraint
Kumar et al. [57]FMILPCarbon emission
Energy use per product
Waste generated per product
% Profit to social and community welfare
Order cost
% Rejection on quality issues
% Late delivery of items
Weighted Additive Method
Mohammed et al. [61]FMILPTotal Cost
Total Time
Environmental Impact
Social Impact
Total Value of Purchasing
Epsilon-Constraint
LP Metric
Beiki [62]FMINLPTotal Cost
Total Emissions
Total purchase value
Genetic Algorithm
Nasr et al. [63]FMINLPTotal costs
Environmental effects
Employment
Lost sales
Procurement value from sustainable suppliers
Fuzzy Goal Programming Approach
Table 3. Literature Review of Established Decision Framework for SSSOA problem.
StudyDecision Framework for SSSOASustainable Supplier Selection
Criteria
Order
Allocation
InformationTime PeriodProduct TypeSolving
Techniques
Case Study
EnvironmentalEconomicSocialCertainUncertainSingleMultipleSingleMultiple
Khoshfetrat et al. [67] AHP, Linear SolverAutomotive Industry
Bektu [51] FAHP,
FPROMETHEE
AUGMECON, LP-metrics
Medical Equipment Industry
Goren [56] DEMATEL, Taguchi loss functionsConstruction Industry
Tayyab & Sarkar [68] Weighted F-Goal programmingTextile Industry
Liaqait et al. [9] FAHP,
FTOPSIS, CRITIC Augmented ɛ-constraint 2
Air Conditioning Industry
Vahidi et al. [65] SWOT-QFD, weighted Augmented ɛ-constraintN/A Benchmark Solutions
Jia et al. [69] Goal ProgrammingSteel Industry
Nasr et al. [63] Goal ProgrammingTextile Industry
Cheraghalipour & Farsad [20] Best Worst Method, Multi-Choice Goal ProgrammingPlastics Industry
Tirkolaee et al. [70] FANP, FDEMATEL, FTOPSIS, Goal programming Electronics Industry
Mohammed et al. [61] FAHP,
FTOPSIS, ɛ-constraint, LP Metric
Meat Industry
Mohammed et al. [71] FAHP,
FTOPSIS, ɛ-constraint, LP Metric
Meat Industry
Mohammed et al. [72] FAHP,
FTOPSIS, ɛ-constraint, LP Metric
Metal Industry
This Study FAHP,
FTOPSIS, Augmented ɛ-constraint 2, Delphi Technique
Solar PV Panels Industry
FPROMETHEE: Fuzzy Preference Ranking Organization Method for Enrichment Evaluation. AUGMECON: Augmented Epsilon Constraint. FDEMATEL: Fuzzy Decision-Making Trial and Evaluation Laboratory. FTOPSIS: Fuzzy Technique for Order of Preference by Similarity to Ideal Solution. CRITIC: Criteria Importance Through Intercriteria Correlation. SWOT-QFD: Strengths, Weaknesses, Opportunities, and Threats—Quality Function Deployment. FANP: Fuzzy Analytic Network Process.
Table 4. Criteria and Sub-criteria for sustainable supplier ranking.
Sustainable CriteriaSub-Criteria
Economic Cost (C1)
Volume Flexibility (C2)
Payment Terms (C3)
Use of Technology (C4)
Delivery Reliability (C5)
Vendors Market reputation (C6)
Defect Rate (C7)
Quality (C8)
EnvironmentalEnvironment Management System (C1)
Resource Consumption (C2)
Pollution Production (C3)
SocialInformation Disclosure (C1)
Rights and Health of Employees (C2)
Staff Personal and Technical Development (C3)
Table 5. Linguistic variables used of FTOPSIS and FEAHP.
Performance Ranking of Alternatives Importance of Criteria
Linguistic VariableFuzzy NumberLinguistic VariableFuzzy Number
Very low (VL) (1, 1, 3)Weakly Important (WI)(0.1, 0.1, 0.3)
Low (L) (1, 3, 5)Moderately Important (MI)(0.1, 0.3, 0.5)
Medium (M)(3, 5, 7)Important (I)(0.3, 0.5, 0.7)
High (H) (5, 7, 9)Strongly Important (SI)(0.5, 0.7, 0.9)
Very high (VH)(7, 9, 9)Extremely Important (WI)(0.7, 0.9, 0.9)
Table 6. FEAHP Weights for Sustainable Criteria and Sub-Criteria.
CriteriaGlobal WeightsSub-CriteriaLocal WeightsRanking
Economic0.37Cost0.181
Volume Flexibility0.025
Payment Terms0.016
Use of Technology0.044
Delivery Reliability0.044
Vendors Market reputation0.025
Defect Rate0.082
Quality0.063
Environmental0.34Environment Management System0.141
Resource Consumption 0.043
Pollution Production0.092
Social0.29Information Disclosure0.033
Rights and Health of Employees0.161
Staff Personal and Technical Development0.092
Table 7. Suppliers ranking using FTOPSIS.
SupplierEconomic CriteriaEnvironmental CriteriaSocial CriteriaOverall Closeness CoefficientRanking
Supplier 10.590.360.520.861
Supplier 20.420.290.470.383
Supplier 30.280.660.580.254
Supplier 40.340.640.420.225
Supplier 50.540.780.310.482
Table 8. Ideal Solutions of OFs for Time Period “t” using Non-Linear Solver.
Time PeriodObjective FunctionIdeal Solution
t 1 TC $86,010,537.27
TTT 1969.20 h.
EI 2,301,287.01 g
DR 209,713,055.23
TVSP 106,890.00
t 2 TC$84,570,031.00
TTT1947.06 h.
EI2,266,699.06 g
DR179,724,063.56
TVSP104,624.00
t 3 TC$88,714,382.25
TTT2063.38 h.
EI2,387,750.89 g
DR223,618,022.12
TVSP109,202.00
t 4 TC$86,549,371.88
TTT2011.55 h.
EI2,330,471.34 g
DR214,302,000.10
TVSP106,720.00
Table 11. ε-values of TTT, EI, DR, and TVSP.
Time Period ε -Values
ε 2 ε 3 ε 4 ε 5
1 t 1 19942,306,373209,790,035105,552
t 2 19583,407,267179,734,575104,504
t 3 20882,402,851223,620,000109,000
t 4 20184,643,109214,302,500106,550
2 t 1 19943,381,751220,967,774105,552
t 2 21823,407,267205,870,162103,943
t 3 20882,402,851223,620,000109,050
t 4 20184,643,109214,302,500106,600
3 t 1 24152,306,373209,790,035105,792
t 2 19584,543,832179,734,575104,504
t 3 20882,402,851223,620,000109,100
t 4 20182,330,471214,302,500106,650
4 t 1 24153,381,751209,790,035105,792
t 2 24074,543,832179,734,575104,504
t 3 20885,655,112223,620,000109,100
t 4 22452,330,471214,302,500106,650
5 t 1 19942,306,373220,967,774105,792
t 2 19583,407,267205,870,162103,943
t 3 20884,028,981223,620,000109,100
t 4 20183,486,790214,302,500106,650
6 t 1 19942,306,373209,790,035106,032
t 2 19584,543,832179,734,575103,943
t 3 24244,028,981223,620,000109,100
t 4 22453,486,790214,302,500106,650
7 t 1 22062,306,373209,790,035106,032
t 2 24074,543,83223,200,5750104,504
t 3 20885,655,112223,620,000109,100
t 4 20183,486,790214,302,500106,650
8 t 1 19943,381,751209,790,035106,032
t 2 19583,407,267179,734,575104,504
t 3 20884,028,981223,620,000109,100
t 4 22453,486,790214,302,500106,650
9 t 1 19943,381,751209,790,035106,032
t 2 19584,543,832232,005,750104,504
t 3 24244,028,981223,620,000109,100
t 4 20183,486,790214,302,500106,650
10 t 1 19943,381,751209,790,035106,032
t 2 24074,543,832179,734,575104,504
t 3 20885,655,112223,620,000109,100
t 4 22453,486,790214,302,500106,650
Table 12. Values of TC, TTT, EI, DR, and TVSP using AUGMECON2 at φ-levels.
Time Period φ Min TCMin TTTMin EIMin DRMax TVSPRun Time (min)
t 1 0.2586,120,63523113,976,972220,684,988105,9150.50
0.5086,120,71224164,458,428220,684,056105,9150.75
0.7586,121,59224154,457,128213,537,533105,9920.78
1.086,117,42924194,466,736209,790,035106,0310.67
t 2 0.2584,577,45224064,543,712179,734,575104,5040.34
0.5084,577,44924064,543,668179,734,5751045040.52
0.7584,579,93424064,544,632179,734,575104,5040.67
1.084,577,47024074,546,570179,734,575104,5040.55
t 3 0.2588,802,28723003,537,737225,937,262109,0750.38
0.5088,802,29823003,537,920225,937,262109,0750.41
0.7588,802,59823003,537,732223,620,000109,1000.34
1.088,802,58427605,655,121223,620,000109,1000.66
t 4 0.2586,702,93124734,643,708216,619,762106,6250.82
0.5086,702,93124734,643,708216,619,762106,6250.37
0.7586,703,20524724,643,104214,302,500106,6500.71
1.086,703,20524724,643,104214,302,500106,6500.64
Table 13. Membership Degree Values of OFs using AUGMECON2.
t 1 t 2 t 3 t 4
μ (TC)0.860.540.970.490.510.410.740.440.930.120.740.170.630.350.610.19
μ (TTT)0.740.670.450.370.880.680.250.860.420.160.710.640.180.330.540.17
μ (EI)0.360.180.330.840.640.940.380.170.370.170.540.270.180.570.170.54
μ (DR)0.570.080.280.510.090.460.940.940.810.840.690.490.240.480.880.78
μ (TVSP)0.410.740.220.760.540.490.180.040.140.460.810.370.740.540.840.37
Table 14. DM’s Assigned weights for each OF.
Objective FunctionsTCTTTEIDRTVSP
Weights0.240.190.160.210.20
Table 15. Relative Closeness Coefficient (CC) Matrix for Pareto solutions of AUGMECON2 for t1–t4.
Time Period
t 1 t 2 t 3 t 4
CC10.9910.2140.5830.475
20.3740.1340.7970.436
30.2860.9820.6140.256
40.3690.0740.5790.841
Table 16. Best optimal solution of each objective for t 1 t 4 .
CCTCTTTEIDRTVSP
t 1 0.991$86,120,63523103,976,971220,684,987105,915
t 2 0.982$84,577,44824064,543,668179,734,575104,504
t 3 0.797$88,802,59823003,537,732223,620,000109,100
t 4 0.841$86,703,20524724,643,103214,302,500106,650
Publisher’s Note: MDPI stays neutral with regard to jurisdictional claims in published maps and institutional affiliations.

