Abstract
This paper proposes a signal control method for the through and left-turn shared lanes at signalized intersections to solve traffic conflicts between left-turn vehicles and opposing through vehicles by setting left-turn waiting area (LWA). Delays and stops are weighted to form an integrated performance index (PI) in a vehicle-to-infrastructure cooperation system. The PI models pertaining to all vehicles are established based on the LWA intersection. In addition, an optimized method of signal timing parameters is constructed by minimizing the average PI. VISSIM simulation shows that the average PI decreases by 6.51% compared with the original layout and signal timing plan of the intersection, since the increased delay of the side-road left-turn vehicles is insufficient to offset the reduced delay of the side-road through vehicles after the improvement. The sensitivity analysis shows that the greater the traffic volume of the phase including the through and left-turn shared lanes, the higher the operation efficiency of the LWA intersection compared with the typical permitted phase intersection. When the left-turn vehicles of the shared lanes in each cycle are less than the stop spaces, the LWA intersection can effectively reduce the average PI of the shared lanes. Furthermore, the more the stop spaces in the LWA, the lower the average PI in the same traffic conditions.
1. Introduction
To fully utilize the space–time resources of intersections, waiting areas have been implemented to improve the traffic efficiency of signalized intersections in many cities, including left-turn waiting areas (LWAs) and through waiting areas. Among them, LWAs are the most typical form.
The emergence of LWAs has triggered significant research on new problems, e.g., operation efficiency [1,2,3], signal timing methods [4,5], and traffic conflict analysis of LWAs et al. [6,7]. For example, Sun [3] introduces a method of using micro-simulation VISSIM to study the effectiveness of the left-turn waiting area. Based on the shared-use lane control method of intersection with left-turn waiting area configuration, Zhou et al. [5] propose a comprehensive optimization model with lane allocation and signal timing optimization to obtain the optimal design of shared-use lane assignment and signal timing; Li et al. [7] build an ordered logit model to find out the factors which have significant impacts on traffic safety at intersections with LWA. Results confirm the validity of LWAs. However, the effects of increasing the number of left-turn stops on left-turning heavy vehicles [8,9], traffic safety, and energy consumption [2] are not considered. So, Dong et al. [10] present a procedure for evaluating the effects of LWAs at signalized intersections considering multiple performance measures, including traffic operations, safety, environmental effects, and fuel consumption. Despite the presence of LWAs, an independent phase design for left-turn vehicles is still required to ensure smooth traffic flows.
The concept of LWAs has been further extended. Wu et al. [11] propose the contraflow left-turn lane (CLL) and evaluate the effects of CLLs on left-turn traffic performance at signalized intersections. Results of field data analysis show that the capacity of left-turn traffic flow is improved by CLL design. Su et al. [12] present a CLL intersection design for high left-turn volume requirements, and Zhao et al. [13] further investigate the effects of using dynamic signals at CLL intersections.
For intersections where through and left-turn traffic is low or moderate and when conditions for setting the dedicated left-turn phase are not satisfied, the permitted phase for through and left-turn traffic flows is widely used. In recent years, many models have been developed to describe the microscopic characteristics of left-turn vehicles under the permitted phase, such as a log-logistic model for the following time of left-turn vehicles [14], an analytic equation for predicting the opposing volume at which the through and left-turn shared lane becomes ineffective [15], a calculation model of left-turn guidance line [16], a left-turn queuing model with uncertain second vacation to analytically evaluate the performance of left turns for different left-turn phasing [17], and an interactive decision support system for evaluating left-turn phasing alternatives by time of day [18]. Nevertheless, the traffic conflicts between left-turn and opposing through vehicles in the permitted phase are serious. To solve traffic conflicts, traffic signal control using hook turns has been implemented in urban Melbourne (Australia) since the 1950s and has provided a good solution [19]. The stop area in the hook turn intersection is similar to the LWA.
The hook turn has attracted the attention of some researchers. Extensive studies have been performed to investigate its operation process and safety impact [20], traffic operation effect [21], applicable traffic volume [19], delay model, and signal optimization timing method [22,23], which confirm its effectiveness. Furthermore, Warner et al. [24] evaluate the effectiveness of four types of engineering countermeasures—regulatory signage, intersection pavement marking, smaller curb radius, and protected intersection design—at modifying driver behaviors that are known contributing factors in crashes. Bie et al. [19,25] propose the setting and signal timing optimization methods of hook turns in the traffic system where driving is on the right. Chen et al. [26] propose a layout scheme comprising three detectors based on sense control logic to solve the problem of queue overflow and long traffic times of buses in the waiting area of hook turn intersections. Hook turns are not limited to trams and passenger cars; other modes of transport, including buses, bicycles, and motorcycles have also benefited from the hook turn implementation [27].
However, two problems occur at hook turn intersections. One is where the turning radius of left-turn vehicles in the LWA is small, which affects the capacity of left-turn vehicles. The other is where the LWA is near the stop line of the cross approach; the stops of through vehicles will increase when left-turn vehicles in the LWA and through vehicles in the cross approach are released simultaneously. In addition, the random arrival of left-turning vehicles of the through and left-turn shared lane per cycle is not considered in the signal timing method of intersections, resulting in the inaccuracy of the delay model. In the vehicle-to-infrastructure cooperation system, the arrival time, speed, and position of left-turning vehicles can be accurately obtained, which is helpful for establishing an accurate performance evaluation model of the through and left-turn shared lane.
Compared to the existing work, the novel contributions of our work are as follows:
- (1)
- A LWA design and dynamic signal optimized method for the through and left-turn shared lanes is proposed herein to solve traffic conflicts and improve the traffic efficiency at signalized intersections.
- (2)
- Both stops and delays are weighted to form an integrated performance index (PI) due to increasing stops for left-turn vehicles at LWA intersection, and the PI models pertaining to all vehicles are established to calculate the delay and stops in accuracy.
The remainder of this paper is organized as follows. Section 2 proposes the left-turn traffic release method for the through and left-turn shared lanes. The signal control parameter optimized model is established in Section 3. The traffic simulation and empirical studies are conducted in Section 4 and Section 5. Finally, some conclusions and future research are discussed in Section 6.
2. Method
2.1. Design of LWA
Depending on whether the side road has central separators, Figure 1a,b shows the LWA design of the through and left-turn shared lanes with or without central separators, and the intersection is called the LWA intersection. The intersection with the central separators of the side road is favorable for establishing LWAs, and the operating streamline of through traffic flows in the intersection is less affected. To avoid the effect of left-turn stops on the through traffic flow at the intersection without side-road central separators, the diversion line of the through traffic should bypass the waiting area along the outer space, and the stop line in the direction of the side road needs to be stayed back, such that the operating track of through vehicles in the intersection is smoother. For the sake of avoiding the deadlock of left-turn vehicles in the waiting area when the through phase of the main road is opened, the connected lane entering the waiting area in the intersection is prohibited from stopping. Furthermore, to ensure that at least one vehicle can stop in each lane of the LWAs, the LWA length shall not be less than 5 m, and the included angle between the center line of the LWAs and that of the main road should be 30–45 degrees to make the motion smoother.
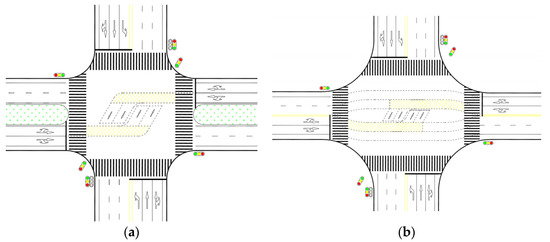
Figure 1.
LWA design of the through and left-turn shared lanes. (a) Intersection with central strip, (b) Intersection without central strip.
2.2. Release Design
For the LWA intersection, three phases are designed to release all traffic flow, i.e., north-south left-turn phase, north-south through phase, and east-west phase. As shown in Figure 2a, when the through and left-turn shared lane of side road opens, the left-turn traffic flow enters the LWAs to stop and the through traffic flow leaves the intersection directly. The left-turn traffic flow is strictly forbidden to pass through the intersection in the meantime. After the end of this phase, the through phase of the main road is selected to operate. At this time, the left-turn traffic flow of side road and the through traffic flow of main road are released simultaneously, seen in Figure 2b. Because left-turn vehicles in the East-West direction enter the waiting area in advance and the distances from the start of the LWA to the stop line of the North-South approaches are longer, an additional green time for left-turn vehicles is not required to prevent the through vehicles from being stopped once again. Next, the north-south left-turn phase is selected for execution.
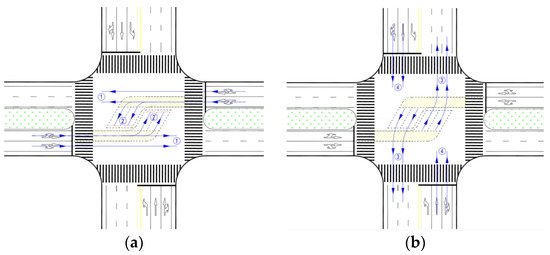
Figure 2.
Release method of the left-turn vehicles of the through and left-turn shared lanes. (a) Drive into LWA, (b) Drive out of LWA.
3. Optimization Models
3.1. Optimization Objective Function
The LWA intersection will increase the stops for left-turn vehicles. To fully reproduce the effects of signal timing parameters on the LWA intersection, both stops and delay are weighted to form an integrated PI. The objective function is shown as follows:
where pi is the average PI of all vehicles, i is the phase number, with i = 1, 2, 3 representing east-west permissive phase, north-south through phase, and north-south left phase, respectively. The total PI and traffic volume of the kth cycle of phase i are given by PIi,k and qi,k, respectively.
3.1.1. General Constraint Conditions
See below
where g1,k, g2,k and g3,k are the green times of the kth cycle of north-south left-turn phase (s), north-south through phase (s), and east-west phase (s), respectively. The time length of the kth cycle (s) and green time interval of phase i are given by ck (s) and Ii (s), respectively. Equation (2) is the constraint of signal cycle, and constraint (3) limits the green time range of each phase.
3.1.2. PI Models of LWA Intersection
Let the start time of the kth cycle be Tk, then the opening time of green light of phase i of the kth cycle is
- (1)
- The PI model of North-South left-turn phase
Let the retained traffic volume in the direction r of phase i of the k-1th cycle be (pcu), the number of lanes in the direction r of phase i be , and the time at which the jth vehicle in direction r of the left-turn phase of the kth cycle enters the road segment be (s). The starting wave transmission speed of queued vehicles, length of the road segment and average speed in the direction r of left-turn phase are represented by (s/pcu), (m), and (m/s), respectively. In the vehicle-to-infrastructure cooperation system, the queued vehicles () when the jth vehicle in the direction r of left-turn phase of the kth cycle arrives at the intersection and PI of the jth vehicle () can be calculated as follows:
The number of queued vehicles depends on whether the jth vehicle arrives at the intersection in red time or not, or whether the queue in front has dissipated or not when the vehicle arrives in green time, corresponding to cases 1 and 2 in Equation (5), respectively. In Equation (6), the first item is the delay equivalent, the second item is the stop equivalent. The delay is calculated by subtracting the time of leaving the stop-line from the time of entering the road segment, and then subtracting the normal travel time in the road segment. A stop or not depends on whether the vehicle needs to wait for the red light when the jth vehicle arrives at the intersection, or whether the vehicle can be released or not in green time g3,k, corresponding to cases 1, 2 and 3 in Equation (6), respectively. The weights of delay and stop are given by w1 and w2. According to the results of the literature [28], w1 = 1 and w2 = 4. PI3,k is the total PI of left-turn phase of the kth cycle.
- (2)
- The PI model of North-South through phase
Let the time at which the jth vehicle in direction r of the through phase of the kth cycle enters the road segment be . When the jth vehicle is a through vehicle, the queued vehicles of through lane () and through-right lane () and PI of the jth vehicle () can be calculated as follows:
When the jth vehicle is a right-turn vehicle, then
where PI2,k is the total PI of through phase of the kth cycle.
- (3)
- The PI model of East-West phase
The East-West phase includes the shared lane of through and left-turn vehicles and that of through and right-turn vehicles; therefore, the PIs of these lanes must be calculated separately. According to the release design in Figure 2, all left-turn vehicles must stop at the LWA and are prohibited from leaving the intersection during the green time in the East-West phase. Therefore, each left-turn vehicle passes through an additional stop and additional waiting time compared with the conventional permitted phase. However, beyond that, whether the through vehicles can leave the intersection smoothly at each cycle depends on whether the number of left-turn vehicles () is larger than the stop spaces in the LWA ().
Let the time at which the jth vehicle in direction r in the East-West phase of the kth cycle enters the road segment be . When the jth vehicle is a left-turn vehicle, the queued vehicles of through-left lane () and through-right lane () and PI of the jth vehicle () are expressed as follows:
When the jth vehicle is a through vehicle, then
When the jth vehicle is a right-turn vehicle, then
where PI1,k is the total PI of through and left-turn shared lane of the kth cycle.
3.2. Solution Algorithm
In this paper, the decision variables are the green time per phase, and the objective function is used to minimize the average pi of all vehicles. The optimization models in Formula (1) are a nonlinear optimization problem, which can be solved by the genetic algorithm. However, the genetic algorithm has the defects of being a large-scale calculation and time consuming.
Learning from the optimization methods of adaptive signal control [29,30], the optimal timing plans per cycle can be decomposed by calculating the optimal green time of each phase, respectively. When the green time of the phase i is optimized, the green times of other phases are temporarily replaced by the green times of the corresponding phases of the previous cycle. As gi,k is typically an integer in the time interval [gi,min, gi,max], a finite exhaustive can be used to solve the optimization problem of Formula (1) quickly. The solution procedure is shown in Figure 3.
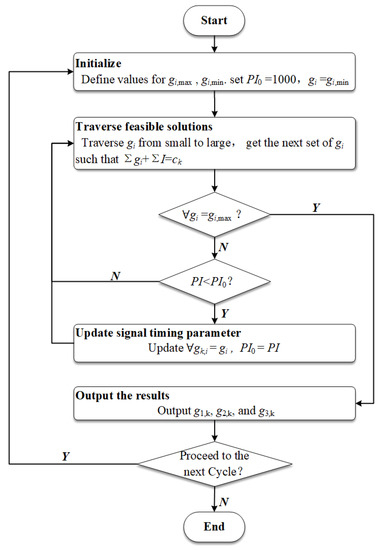
Figure 3.
Solution procedure.
4. Case Study
4.1. Basic Conditions
The intersection of Jinjiang road and the 7th Qunli Avenue in Harbin, China is used as an example to perform a comparative analysis. The current layout and peak hour signal timing scheme of the intersection are shown in Figure 4, and the left-turn, through, and right-turn traffic volumes at each approach of the intersection during peak hour are shown in Table 1. According to a survey, the average speeds in the North-South and East-West directions of the intersection are 45 and 40 km/h, and the width of all approach lanes is 3.5 m.
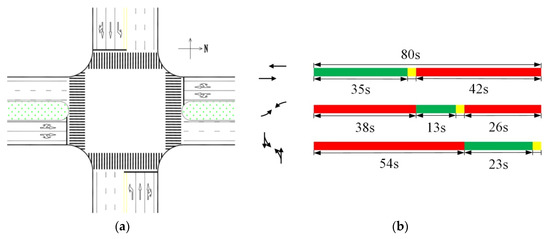
Figure 4.
Current traffic organization of intersection. (a) Layout of intersection, (b) Current signal timing scheme.

Table 1.
Traffic volumes at the intersection of Jinjiang Road and the 7th Qunli Avenue (pcu/h).
4.2. Simulation Design
VISSIM is used for simulation verification in this paper. The VISSIM parameters, such as the lane saturation flow rate, car-following model, minimum spacing, and acceleration (deceleration), etc., are corrected by a small-step adjustment until the mean error is less than 1% between the simulation results and the actual investigation results. The calibration results show that the saturation flow rates of left-turn lane, through lane, through and left-turn shared lane, and through and right-turn shared lane are 1300, 1450, 1350, and 1320 pcu/h, respectively; the minimum spacing is 1 m; the maximum acceleration (deceleration) is 5 m/s2; the expected acceleration (deceleration) is 3 m/s2; the average stop spacing is 1.5 m; the minimum stop spacing is 0.9 m; the number of observable vehicles in front is two; the observable distance is 200 m; the additive part of the safety distance is 2.65; and the product part of the expected safety distance is 3.65.
According to the waiting area design method proposed herein, the improved layout of the intersection is shown in Figure 5a; the LWA in each direction has two stop spaces. Two types of intersection layouts and three signal control schemes are built in VISSIM for a comparative analysis. Scheme 1 is the current layout and current signal timing plan of the intersection; Scheme 2 is the improved layout and improved fixed signal timing plan of the intersection, as shown in Figure 5b; Scheme 3 is the improved layout and dynamic signal timing plan of the intersection.
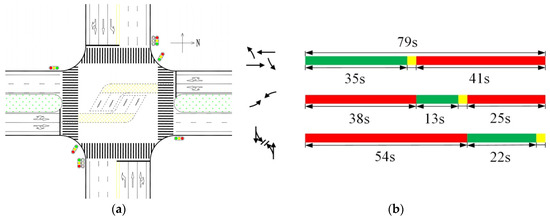
Figure 5.
Improvement layout of intersection. (a) Improved layout of intersection; (b) Improved fixed signal timing scheme.
Because the new rule is adopted for the left-turn vehicles in the through and left-turn shared lane, traffic lights are set for the left-turn vehicles in the waiting area in VISSIM, and their signal timing schemes in Schemes 2 and 3 are the same as those in the through phase in the cross direction.
We have developed an algorithm using the component object model (COM) interface of VISSIM to measure the mobility performance and connect the customized signal control method with the VISSIM traffic light controller. The arrival time of each vehicle and dynamic traffic volume of arrivals and departures are collected by setting traffic flow detectors on the lanes. The state of each detector is verified every 0.5 s. Before each phase is turned on, the signal timing is optimized according to the collected traffic volume of each approach and Formula (1). To reproduce the simulation results, the vehicle generator of each approach in VISSIM is adjusted per 10 s based on the investigated traffic volume.
5. Results and Discussion
Each scheme is simulated for 60 min, and the results are shown in Table 2, Table 3 and Table 4, where the average PI, delay, and stop rate are used for performance evaluation. The figures in brackets denote the change under the dynamic signal scheme compared with the current signal control plan.
Table 2.
The average PI of vehicles before and after improvement.
Table 3.
The delay before and after improvement.
Table 4.
Stop rate before and after improvement.
5.1. Result Analysis
(1) According to the simulation results in Table 3, the delay of left-turn and through vehicles in the North and South approaches is down. The setting of the LWA eliminates the traffic conflict between the through and left-turn vehicles in the North-South direction, which improves the saturation flow rate of the through and left-turn shared lane. In the optimized signal timing scheme, the required green time of the North-South phase reduces, and the green time of other phases remains unchanged. Hence, the delay is reduced.
As shown in Table 3 and Table 4, the delay and stop rate of left-turn vehicles in the South and North approaches increase, and those of through vehicles decrease. This occurs because the left-turn vehicles in the North-South direction must stop and wait in the LWA and cannot leave the intersection in this phase. So, the delay and stop rate of the left-turn vehicles increase significantly after the improvement. The stops caused by the left-turn vehicles are eliminated, and the through vehicles pass through the intersection smoothly. Therefore, the delay and stop rate of through vehicles decrease.
(2) As shown in Table 2, the average PI of vehicles in all approaches of the intersection decreases. Because the through vehicles constitute a large proportion of the traffic volume in the North-South direction, the increased delay of the left-turn vehicles is insufficient to offset the reduced delay of the through vehicles after the improvement. Therefore, the average PI decreases.
(3) It is discovered from Table 2, Table 3 and Table 4 that the delay, stop rate, and PI of Scheme 3 decrease compared with those of Schemes 1 and 2. Since the dynamic signal timing scheme can handle the changing traffic flow more effectively.
It is observed that the LWA with dynamic signal control in the North-South phase not only eliminates the traffic conflict between the left-turn and through vehicles, but also reduces the average delay, stop rate, and PI of the intersection, indicating the feasibility and effectiveness of the proposed method.
5.2. Sensitivity Analysis
Taking Figure 2a as an example, this section analyses the influences of different arrival numbers of left-turn vehicles, left-turn ratios, and stop spaces in the East-West direction on the PI of East-West phase.
5.2.1. Effects of Different Arrival Numbers of Left-Turn Vehicles on PI of East-West Phase
When the arrival numbers of left-turn vehicles in each cycle are one, two, three, and four, the vehicle arrival rate per lane in the through and left-turn shared lane varied from 0.030 to 0.080 pcu/s in intervals of 0.005 pcu/s. Figure 6 shows the changes in average PI of East-West phase before and after the improvement.
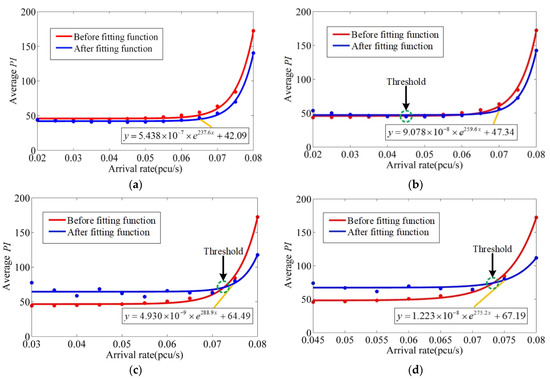
Figure 6.
Average PI under different arrival rates. (a) One left-turn vehicle, (b) Two left-turn vehicles, (c) Three left-turn vehicles, (d) Four left-turn vehicles.
Regardless of the LWA setting, the average PI increases slowly with the vehicle arrival rate when the East-West phase is not saturated. Subsequently, it increases significantly when the East-West phase is close to saturated or oversaturated, as shown in Figure 6. Since all vehicles can leave the intersection in the green time when the East-West phase is not saturated, and the secondary stop and increased delay caused by the stop are limited. When the East-West phase is close to saturated or oversaturated, the delay and stops caused by interrupting the through vehicles increase significantly, resulting in an increase in PI.
When the left-turn vehicles do not exceed the stop spaces in the LWA, the condition with low vehicle arrival rate in the East-West phase is unfavorable to the LWA intersection. Because sufficient traversable gaps are available for the left-turn vehicles to cross, and the left-turn vehicles can leave the intersection without waiting or after waiting for a short time, the effect of left-turn vehicle crossing on the through vehicles is almost negligible. When the LWA is set, the waiting time of the left-turn vehicles increases, resulting in an increase in delays and stops. Only when the vehicle arrival rate exceeds a certain threshold, the effect of left-turn vehicles crossing on the through traffic flow gradually appears, resulting in the need to decelerate or interrupt the through vehicles such that the cumulative PI exceeds the total PI after the LWA is set.
When the left-turn vehicles exceed the stop spaces in the LWA, the condition with unsaturated traffic is unfavorable to the LWA intersection. Although the left-turn or through vehicles have to stop, they can still leave the intersection completely during the green time, and the accumulated increased PI is small. After the LWA is set, not only the waiting time and stops of the left-turn vehicles increase, but also some left-turn vehicles have to queue in the through and left-turn shared lane. Because the left-turn vehicles exceed the stop spaces in the LWA, which disables the subsequent through vehicles from leaving the intersection in this phase and increases the accumulated PI. Therefore, the difference between the PIs before and after the setting of the LWA varies increasingly with the left-turn vehicles. Only when the East-West phase is close to saturated or oversaturated, the effect of the left-turn vehicles in the East-West phase on the through vehicles becomes more prominent, which results in frequent interruptions in the through traffic flow, a significant decline in the capacity of East-West phase, and a rapid increase in the accumulated PI. At this time, the advantage of the LWA is demonstrated again. It does not interrupt the through vehicles that have entered the intersection, thereby ensuring that the capacity of East-West phase is maintained at a reasonable level. Hence, the PI is superior.
As shown in Figure 6, when only one left-turn vehicle exists in each cycle and the vehicle arrival rate exceeds 0.030 pcu/s, the LWA can effectively reduce the average PI of East-West phase. When two left-turn vehicles exist in a cycle and the vehicle arrival rate exceeds 0.045 pcu/s, the LWA can also effectively reduce the average PI of East-West phase. However, when the arrival number of each cycle reaches three or four left-turn vehicles, the arrival rate of vehicles ensuring an average PI descent increases to beyond 0.070 and 0.075 pcu/s. More left-turn vehicles arriving in one cycle result in an increase in the threshold to convert the advantages of two methods by which the LWA is set. The reason is that more left-turn vehicles imply more delays and stops accumulated after the LWA is set, and hence a larger PI. For the typical permitted phase intersection, the traffic conflict between left-turn and through vehicles can be intensified only when the vehicle arrival rate increases to a certain extent, and the increased PI is insufficient to offset that after the LWA is set. Subsequently, the threshold of the vehicle arrival rate increases constantly.
More left-turn vehicles arriving in one cycle result in an increase in the PIs of the two methods by which the LWA is set. When the East-West phase is not saturated, the increase in the LWA intersection is faster, and the advantage is clear after the East-West phase is saturated. However, the opposite scenario occurs for the typical permitted phase intersection. Because the East-West phase is not saturated, although the effect of the left-turn vehicles on the through vehicles becomes more prominent with the vehicle arrival rate, the interruption frequency of the through vehicles is still low, and the cumulative increase in the PI is small. However, the LWA interrupts all left-turn vehicles, and the more left-turn vehicles arrive, the greater PI in the East-West phase is. After the East-West phase is saturated, the LWA only interrupts the left-turn vehicles and part of the through vehicles, and does not interrupt the through vehicles that have entered the intersection. The typical permitted phase intersection will not only interrupt the left-turn vehicles, but also interrupt the through vehicles into the intersection, which can cause an intersection deadlock.
More left-turn vehicles arriving in one cycle result in more stops and delay of left-turn vehicles, according to the release rules of LWA intersections. Although the saturated flow rate of East-West phase at the LWA intersection increases, a sufficient vehicle arrival rate must be available to ensure that the average PI decreases. This shows that the greater the traffic volume in the East-West phase, the higher the operation efficiency of the LWA intersection compared with that of the typical permitted phase intersection.
5.2.2. Effects of Different Left-Turn Ratios on PI of East-West Phase
Let the vehicle arrival rate per lane in the East-West direction be varied from 0.030 to 0.080 pcu/s in the interval of 0.005 pcu/s, and the ratio of left-turn vehicles be varied from 0.05 to 0.30 in the interval of 0.01. To demonstrate the relationship between the average PI of East-West phase and the ratio of left-turn vehicles, the simulation results corresponding to the vehicle arrival rates of 0.07 and 0.08 pcu/s are selected, as shown in Figure 7.
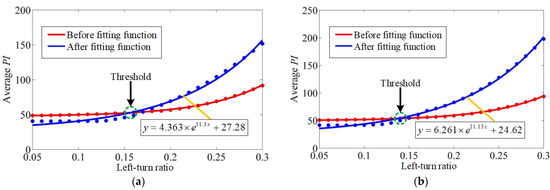
Figure 7.
Average PI under different left-turn ratios. (a) Arrival rate is 0.07 pcu/s, (b) Arrival rate is 0.08 pcu/s.
As shown in Figure 6, with the increase in the left-turn ratio, the average PI of East-West phase increases faster at the LWA intersection. When the left-turn ratio is more than a critical value, the average PI of East-West phase can no longer be compared with the typical permitted phase intersection. The LWA intersection is only valid for a certain range of the left-turn vehicles. To summarize, when two stop spaces exist in the LWA in each direction and the left-turn ratio multiplied by the arrival traffic volume of East-West phase in each cycle is not greater than the stop spaces, the LWA intersection can effectively reduce the average PI of East-West phase.
At a constant vehicle arrival rate, the PIs of the two methods by which the LWA is set increase with the left-turn ratio. However, the effect on the proposed method is more significant. Because the left-turn ratio is higher, the number of left-turn vehicles arriving in one cycle increases, and that of through vehicles decreases correspondingly. When the left-turn ratio exceeds a certain limit, causing the number of left-turn vehicles to exceed the stop spaces in the LWA, the LWA does not only increase the stops and delay of the left-turn vehicles, but also interrupts part of the through vehicles, causing the PI to increase rapidly, which is not ideal for the proposed method. Therefore, the applicable condition of the proposed method is related to the stop spaces in the LWA, the vehicle arrival rate, and the left-turn ratio. As shown in Figure 7, when the stop spaces in the LWA are fixed, the upper limit of the critical left-turn ratio of the proposed method decreases with the gradual increase in vehicle arrival rate.
Also shown in Figure 7, with the constant left-turn ratio, the PI increases faster with the increase in the vehicle arrival rate. Due to the increase in vehicle arrival rate, more left-turn and through vehicles appear, causing traffic conflict to be aggravated at the typical permitted phase intersection and impassable through vehicles to be added at the LWA intersection. Therefore, the PI increases faster. Similarly, under the same left-turn ratio and different arrival rates, the difference in PI between the two types of intersections becomes more obvious with the increase in vehicle arrival rate.
5.2.3. Effects of Different Stop Spaces on PI of East-West Phase
Let the vehicle arrival rates per lane in the East-West phase be 0.07 and 0.08 pcu/s, and the left-turn ratio varied from 0.10 to 0.40 in an interval of 0.05. The stop spaces in the LWA in each direction are one, two, and three, correspondingly. Figure 7 shows the relationship between the average PI of East-West phase and the stop spaces in the LWA under different arrival left-turn vehicles in each cycle.
As shown in Figure 8, when one left-turn vehicle arrives in each cycle, the delays of vehicles with one, two, and three stop spaces are the same. When two left-turn vehicles arrive in each cycle, the delays of vehicles with two or three stop spaces are the same and lower than that with one stop space. When three left-turn vehicles arrive in each cycle, the delay of vehicles with three stop spaces is lower than that with one or two stop spaces. It is shown that under the same traffic conditions, the larger the stop spaces in the LWA, the smaller the PI, and the higher the applicable hourly left-turn traffic volume.
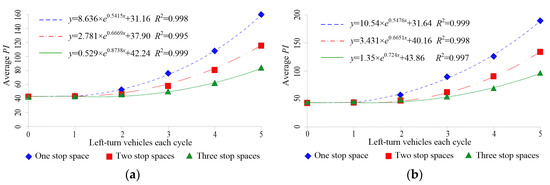
Figure 8.
Average PI under different stop spaces. (a) Arrival rate of 0.07 pcu/s; (b) Arrival rate of 0.08 pcu/s.
When the left-turn vehicles exceed the stop spaces in each cycle, the larger the stop spaces in the LWA, the slower the rising trend of the PI. The reason is that the larger the stop spaces in the LWA, the fewer the number of through vehicles that cannot pass the intersection. Therefore, the increase in PI will be reduced. If the stop spaces in the LWA are larger, the proposed method is more favorable.
As shown in Figure 8, the more stop spaces in the LWA, the lower the average PI in the same traffic conditions. When the space in the intersection is sufficiently large and the LWA can store more left-turn vehicles, the operation performance of the LWA intersection in this study may be better than that of the four-leg signalized intersection with a left-turn dedicated lane and a left-turn phase, because it reduces one phase and shortens the cycle. Once the arrival number of left-turn vehicles in each cycle exceeds the stop spaces in the LWA, the average PI will increase rapidly, mainly due to the queuing of left-turn vehicles and the failure of through and left-turn shared lane.
6. Conclusions
- (1)
- A method to design a LWA for the through and left-turn shared lane is proposed herein, and a signal phase scheme is established to solve traffic conflicts between through and left-turn vehicles and improve the traffic efficiency at intersections.
- (2)
- Delay and stops are weighted to form an integrated PI in a real-time vehicle-to-infrastructure communication environment. The PI models, pertaining to all vehicles in the through, left-turn, and through and left-turn shared lanes are established based on the LWA intersection, and an optimized model of signal timing parameters is constructed based on minimizing the average PI per vehicle. Based on VISSIM simulation, the operational performance of the optimized model is validated using data collected at an intersection in Harbin, China.
- (3)
- Although the average PI decreases by 6.51% compared with the original layout and signal timing plan of the intersection, the delay and stop rate of the side-road left-turn vehicles increase significantly after the improvement, the resulting changes in fuel consumption and exhaust pollution are worthy of further study. Once the arrival left-turn vehicles in each cycle exceeds the stop spaces in the LWA, the through vehicle is faced with a dilemma. In this case, the issue of safety must be further investigated. In addition, the adaptability of drivers to the new traffic flow release mode needs further analysis and evaluation in application.
Author Contributions
Conceptualization, X.J. and L.Y.; methodology, X.J. and L.Y.; software, Y.J. and R.W.; validation, Y.J. and R.W.; formal analysis, X.J. and L.Y.; investigation, L.Y., Y.J. and R.W.; resources, X.J.; data curation, X.J.; writing—original draft preparation, X.J. and L.Y.; writing—review and editing, X.J. and L.Y.; visualization, L.Y.; supervision, X.J.; project administration, X.J.; funding acquisition, X.J. All authors have read and agreed to the published version of the manuscript.
Funding
This research received no external funding.
Institutional Review Board Statement
Not applicable.
Informed Consent Statement
Not applicable.
Data Availability Statement
Not applicable.
Conflicts of Interest
The authors declare no conflict of interest.
References
- Yang, Z.; Liu, P.; Tian, Z.Z.; Wang, W. Evaluating the Operational Impact of Left-Turn Waiting Areas at Signalized Intersections in China. Transp. Res. Rec. J. Transp. Res. Board 2012, 2286, 12–20. [Google Scholar] [CrossRef]
- Ma, W.; Liu, Y.; Zhao, J.; Wu, N. Increasing the capacity of signalized intersections with left-turn waiting areas. Transp. Res. Part A Policy Pract. 2017, 105, 181–196. [Google Scholar] [CrossRef]
- Sun, D.Z. Using Micro-Simulation VISSIM to Study the Effectiveness of Left-Turn Waiting Area Implementation. Appl. Mech. Mater. 2018, 876, 187–191. [Google Scholar] [CrossRef]
- Yanxi, H.; Xiaoguang, Y. Research on the Delay in Signalized Intersection with Left-turn Special Phase. Procedia-Soc. Behav. Sci. 2013, 96, 2211–2218. [Google Scholar] [CrossRef][Green Version]
- Zhou, Y.; Zhou, Q.; Zhuang, H.; Zheng, J.; Zhang, Y. Shared-use lane assignment and signal timing optimization at intersections with wait-ing area. J. Univ. Sci. Technol. China 2020, 50, 220–235. [Google Scholar]
- Jiang, X.; Zhang, G.; Bai, W.; Fan, W. Safety evaluation of signalized intersections with left-turn waiting area in China. Accid. Anal. Prev. 2016, 95, 461–469. [Google Scholar] [CrossRef] [PubMed]
- Li, M.; Cheng, L.; Xu, G.; Zhang, G. Safety Impact Factor Analysis at Intersections with Left-Turn Waiting Areas Based on Ordered Logit Model. In CICTP 2017: Transportation Reform and Change—Equity, Inclusiveness, Sharing, and Innovation; American Society of Civil Engineers: Reston, VA, USA, 2018; pp. 4640–4649. [Google Scholar] [CrossRef]
- Yang, Z.; Liu, P.; Chen, Y.; Yu, H. Can Left-turn Waiting Areas Improve the Capacity of Left-turn Lanes at Signalized Intersections? Procedia-Soc. Behav. Sci. 2012, 43, 192–200. [Google Scholar] [CrossRef][Green Version]
- Yang, Z.; Liu, P.; Tian, Z.Z.; Wang, W. Effects of Left-Turn Waiting Areas on Capacity and Level of Service of Signalized Intersections. J. Transp. Eng. 2013, 139, 1076–1085. [Google Scholar] [CrossRef]
- Dong, S.; Yang, Z.; Xu, C.; Tian, Z.Z.; Liu, P. Multiobjective Evaluation of Left-Turn Waiting Areas at Signalized Intersections in China. Transp. Res. Rec. J. Transp. Res. Board 2016, 2553, 138–149. [Google Scholar] [CrossRef]
- Wu, J.; Liu, P.; Tian, Z.Z.; Xu, C. Operational analysis of the contraflow left-turn lane design at signalized intersections in China. Transp. Res. Part C Emerg. Technol. 2016, 69, 228–241. [Google Scholar] [CrossRef]
- Su, P.; Krause, C.; Hale, D.K.; Bared, J.; Huang, Z. Operational Advantages of Contraflow Left-turn Pockets at Signalized Inter-sections. ITE J.-Inst. Transp. Eng. 2016, 86, 44–49. [Google Scholar]
- Zhao, Y.; James, R.M.; Xiao, L.; Bared, J. A Capacity Estimation Model for a Contraflow Left-Turn Pocket Lane at Signalized Intersections. Transp. Res. Rec. J. Transp. Res. Board 2018, 2672, 22–34. [Google Scholar] [CrossRef]
- Bai, Q.-W.; Chen, Y.-H.; Qu, Z.-W.; Tao, P.-F.; Cao, N.-B.; Shen, Y. Nonstrict Priority Left-Turning Maneuvers with a Permitted Phase at Signalized Intersections: Empirical Study in China. J. Transp. Eng. Part A Syst. 2017, 143, 04016009. [Google Scholar] [CrossRef]
- Rathod, J.; Rumpsa, K.; Qureshi, M. A Volume Warrant for the Permitted Phase of Protected-permitted Phasing. In Proceedings of the ITE 2007 Annual Meeting and Exhibit, Pittsburgh, PA, USA, 5–8 August 2007. [Google Scholar]
- Qu, Z.W.; Bai, Q.W.; Chen, Y.H.; Cao, N.B.; Kang, M.; Wei, F.L. Model of left-turn guide line at right-angled intersection with permitted left-turning phase. J. Jilin Univ. (Eng. Tech. Ed.) 2017, 47, 414–419. [Google Scholar]
- Yang, Q.; Shi, Z.; Yu, S.; Zhou, J. Analytical evaluation of the use of left-turn phasing for single left-turn lane only. Transp. Res. Part B Methodol. 2018, 111, 266–303. [Google Scholar] [CrossRef]
- Abou-Senna, H.; Radwan, E.; Harb, R.C.; Navarro, A.; Chalise, S. Interactive Decision Support System for Predicting Flashing Yellow Arrow Left-Turn Mode by Time of Day. Transp. Res. Rec. J. Transp. Res. Board 2014, 2463, 16–25. [Google Scholar] [CrossRef]
- Bie, Y.; Liu, Z. Evaluation of a Signalized Intersection with Hook Turns under Traffic Actuated Control Circumstance. J. Transp. Eng. 2015, 141, 04014093. [Google Scholar] [CrossRef]
- Currie, G.; Reynolds, J. Managing Trams and Traffic at Intersections with Hook Turns. Transp. Res. Rec. J. Transp. Res. Board 2011, 2219, 10–19. [Google Scholar] [CrossRef]
- Hounsell, N.B.; Yap, Y.H. Hook Turns as a Solution to the Right-Turning Traffic Problem. Transp. Sci. 2015, 49, 1–162. [Google Scholar] [CrossRef]
- Cheng, W.; Bie, Y.; Liu, Z. Signal control scheme optimization method for intersection with Hook-turn based on motor vehi-cle delay. Zhongguo Gonglu Xuebao/China J. Highw. Transp. 2015, 28, 94–101. [Google Scholar]
- Bie, Y.; Liu, Z.; Lu, L.; Cao, Y. A Signal Coordination Algorithm for Adjacent Hook-turn Intersections. In Proceedings of the Transportation Research Board Annual Meeting, Washington, DC, USA, 11–15 November 2015. [Google Scholar]
- Warner, J.; Hurwitz, D.S.; Monsere, C.M.; Fleskes, K. A simulator-based analysis of engineering treatments for right-hook bicycle crashes at signalized intersections. Accid. Anal. Prev. 2017, 104, 46–57. [Google Scholar] [CrossRef]
- Bie, Y.; Cheng, S.; Liu, Z. Optimization of Signal-Timing Parameters for The Intersection With Hook Turns. Transport 2017, 32, 233–241. [Google Scholar] [CrossRef]
- Chen, S.; Li, X.S.; Ren, Y.Y. Adaptive signal control method for intersection with hook-turn buses. J. Jilin Univ. (Eng. Tech. Ed.) 2018, 48, 423–429. [Google Scholar]
- Moridpour, S.; Falamarzi, A. Hook Turns: Implementation, Benefits, and Limitations. Int. Encycl. Transp. 2021, 203–212. [Google Scholar] [CrossRef]
- Jiang, X.; Gao, S. Signal control method and performance evaluation of an improved displaced left-turn intersection design in unsaturated traffic conditions. Transp. B Transp. Dyn. 2020, 8, 264–289. [Google Scholar] [CrossRef]
- Cai, C.; Wong, C.; Heydecker, B.G. Adaptive traffic signal control using approximate dynamic programming. Transp. Res. Part C Emerg. Technol. 2009, 17, 456–474. [Google Scholar] [CrossRef]
- Zhu, S.; Guo, K.; Guo, Y.; Tao, H.; Shi, Q. An Adaptive Signal Control Method with Optimal Detector Locations. Sustainability 2019, 11, 727. [Google Scholar] [CrossRef]


Publisher’s Note: MDPI stays neutral with regard to jurisdictional claims in published maps and institutional affiliations. |
© 2021 by the authors. Licensee MDPI, Basel, Switzerland. This article is an open access article distributed under the terms and conditions of the Creative Commons Attribution (CC BY) license (https://creativecommons.org/licenses/by/4.0/).