
Parametric Definition of Slow Tourism Itineraries for Experiencing Seasonal Landscapes. Application of Sentinel-2 Imagery to the Rural Paddy-Rice Landscape in Northern Italy


Abstract
:1. Introduction
2. Theoretical Background
2.1. Seasonal Landscapes and Tourism
2.2. Mapping Seasonal Landscape Changes through RS
3. Materials and Method
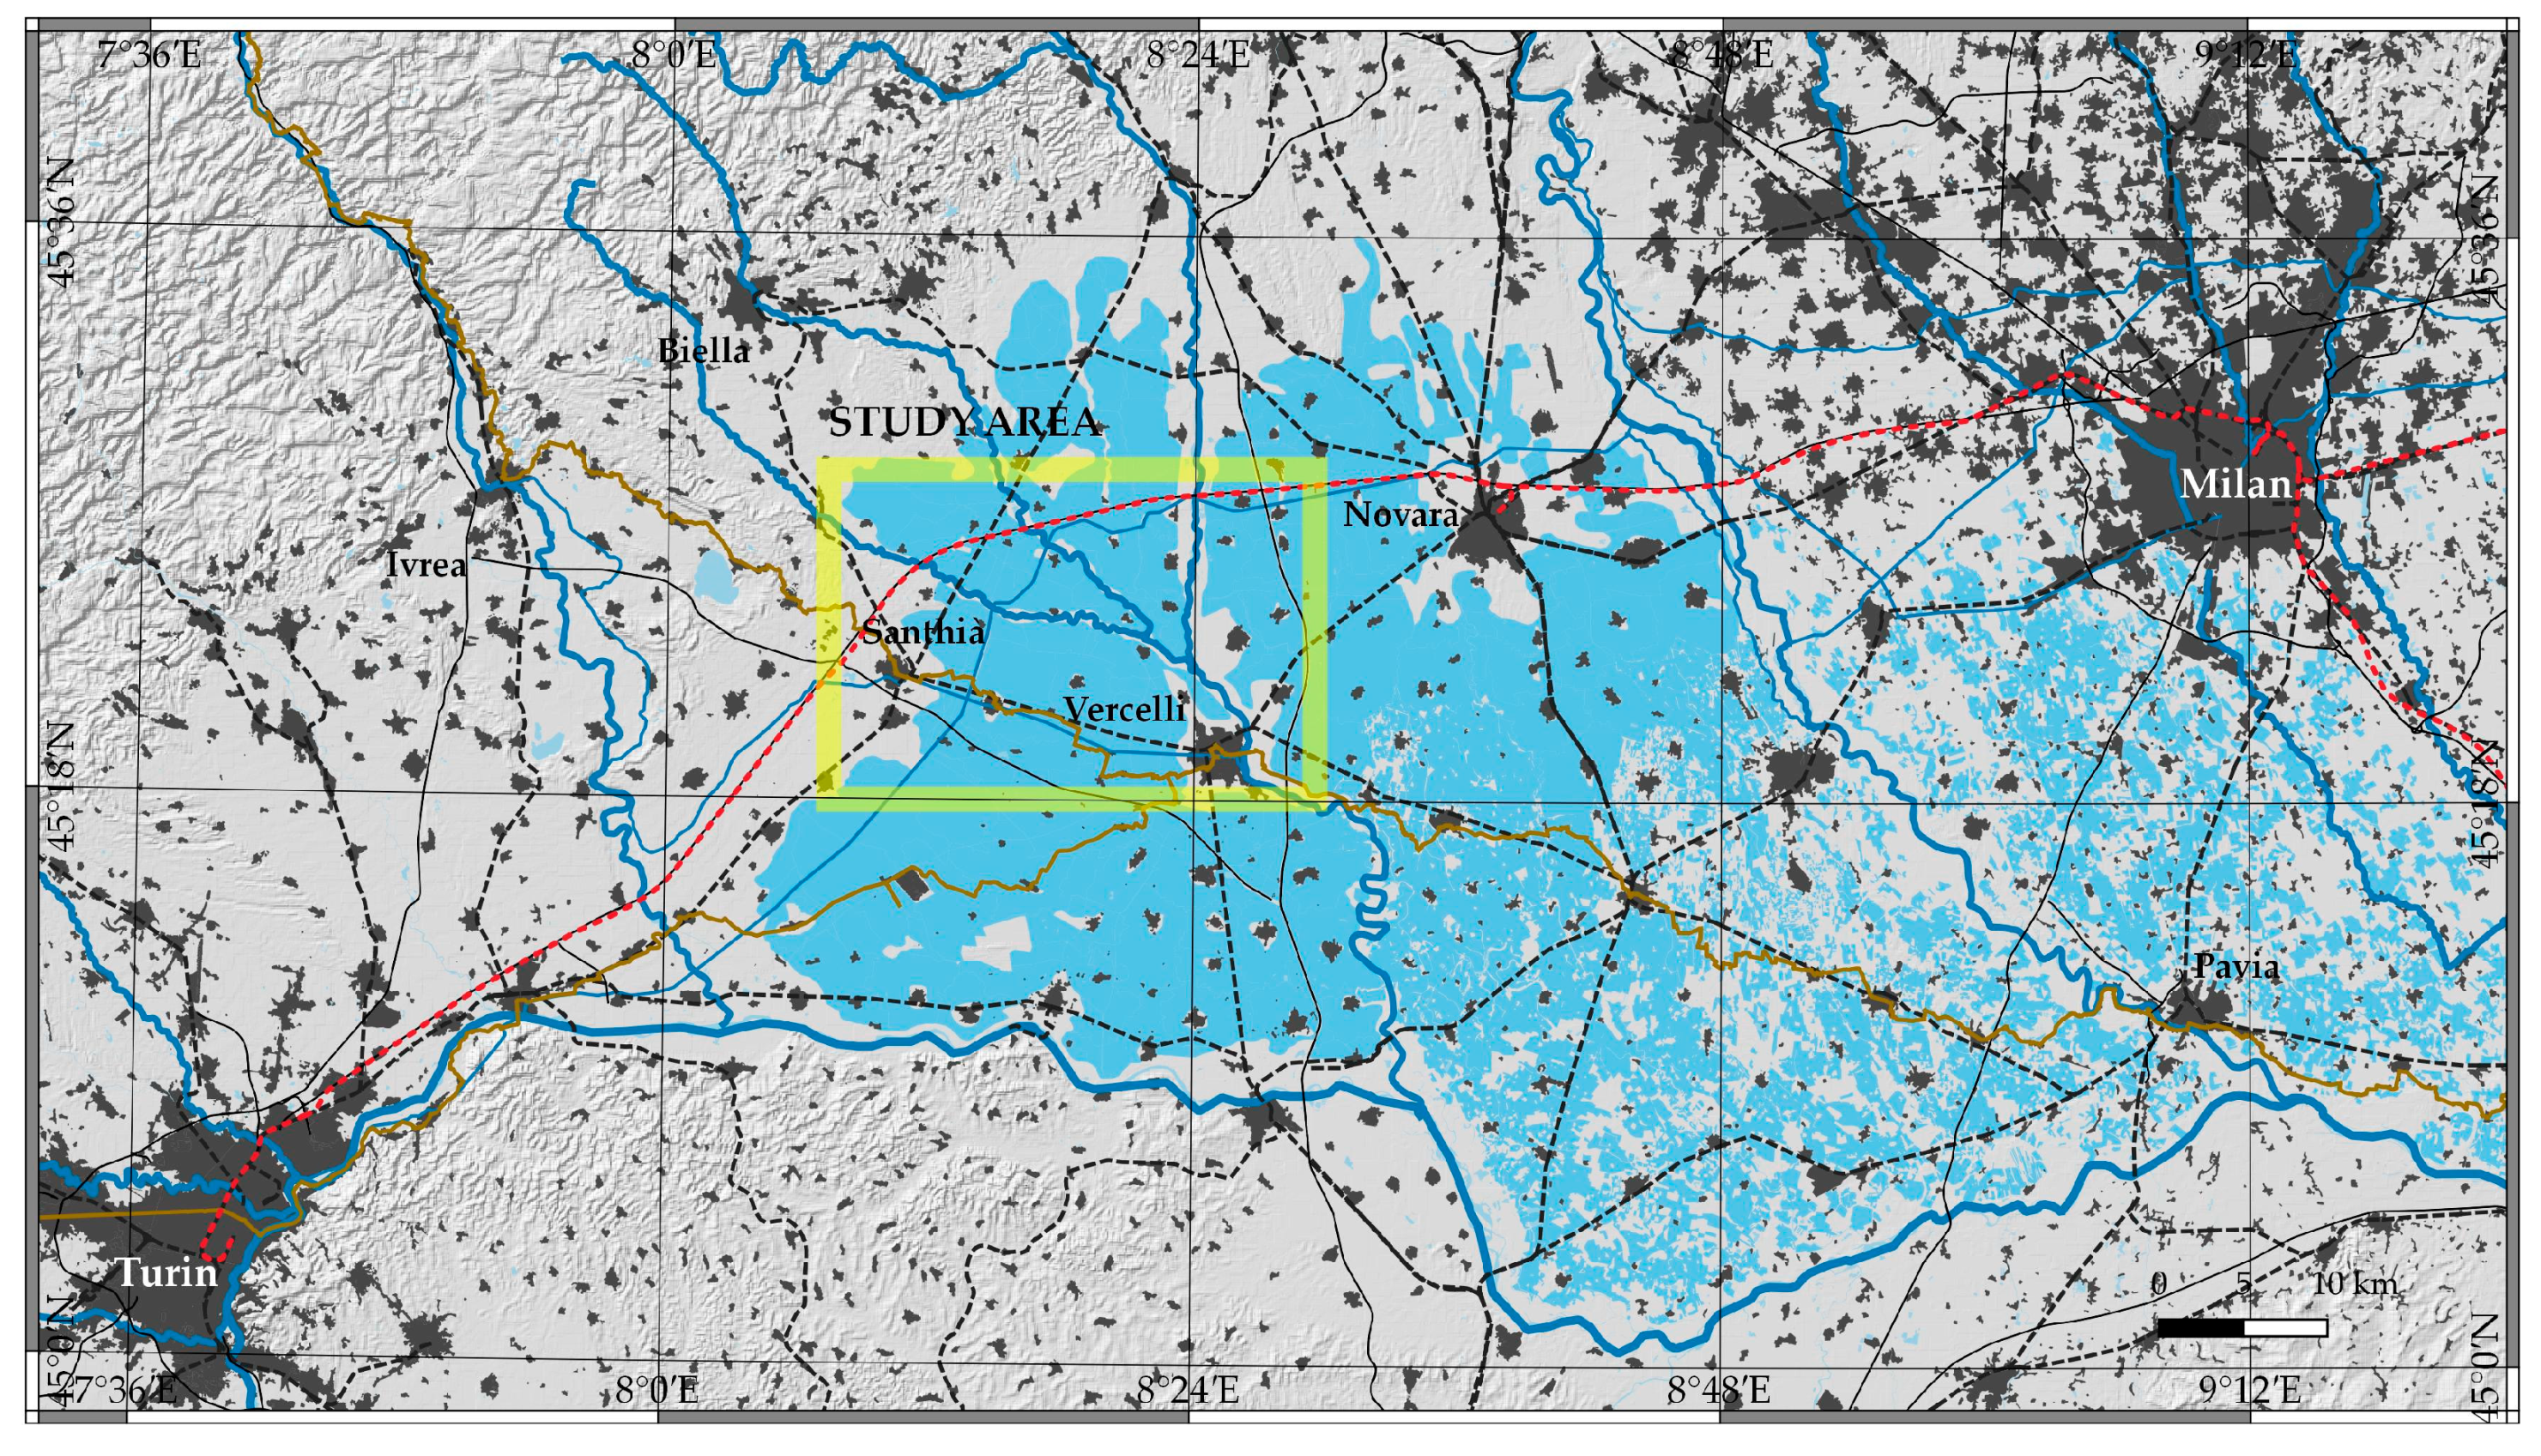
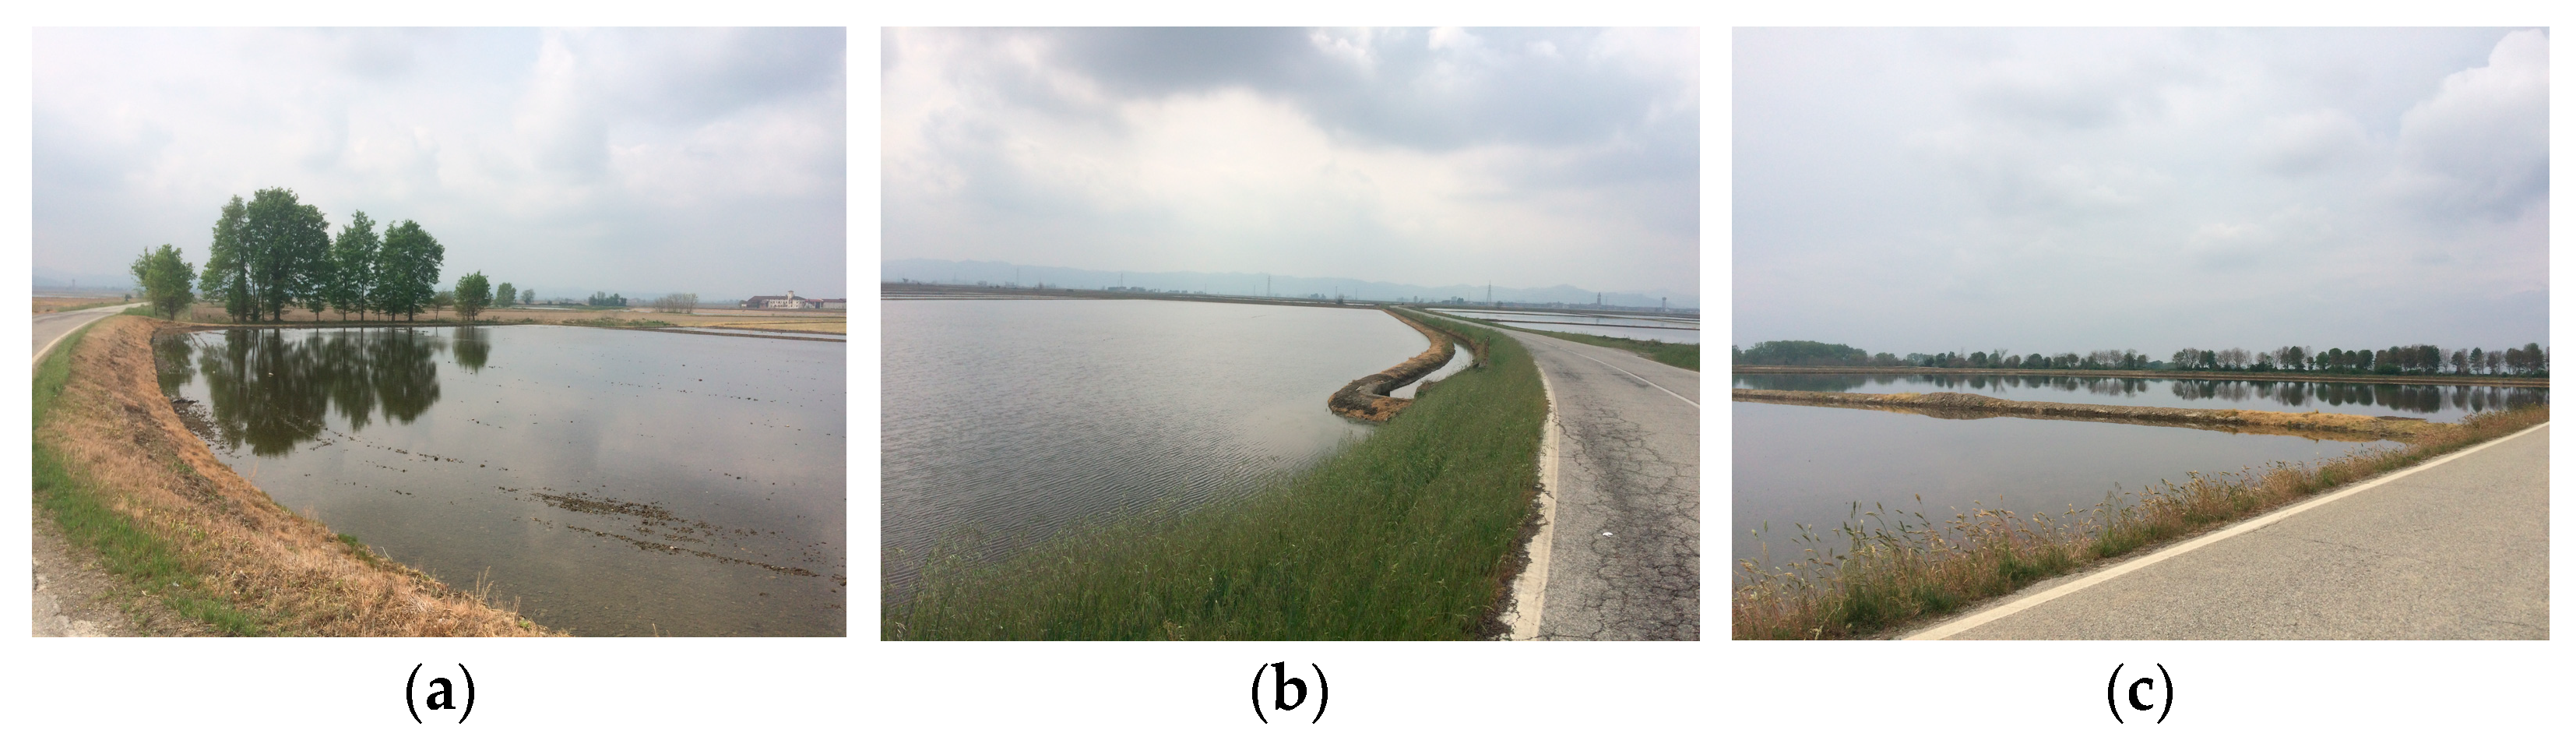
3.1. Study Area
3.2. Materials
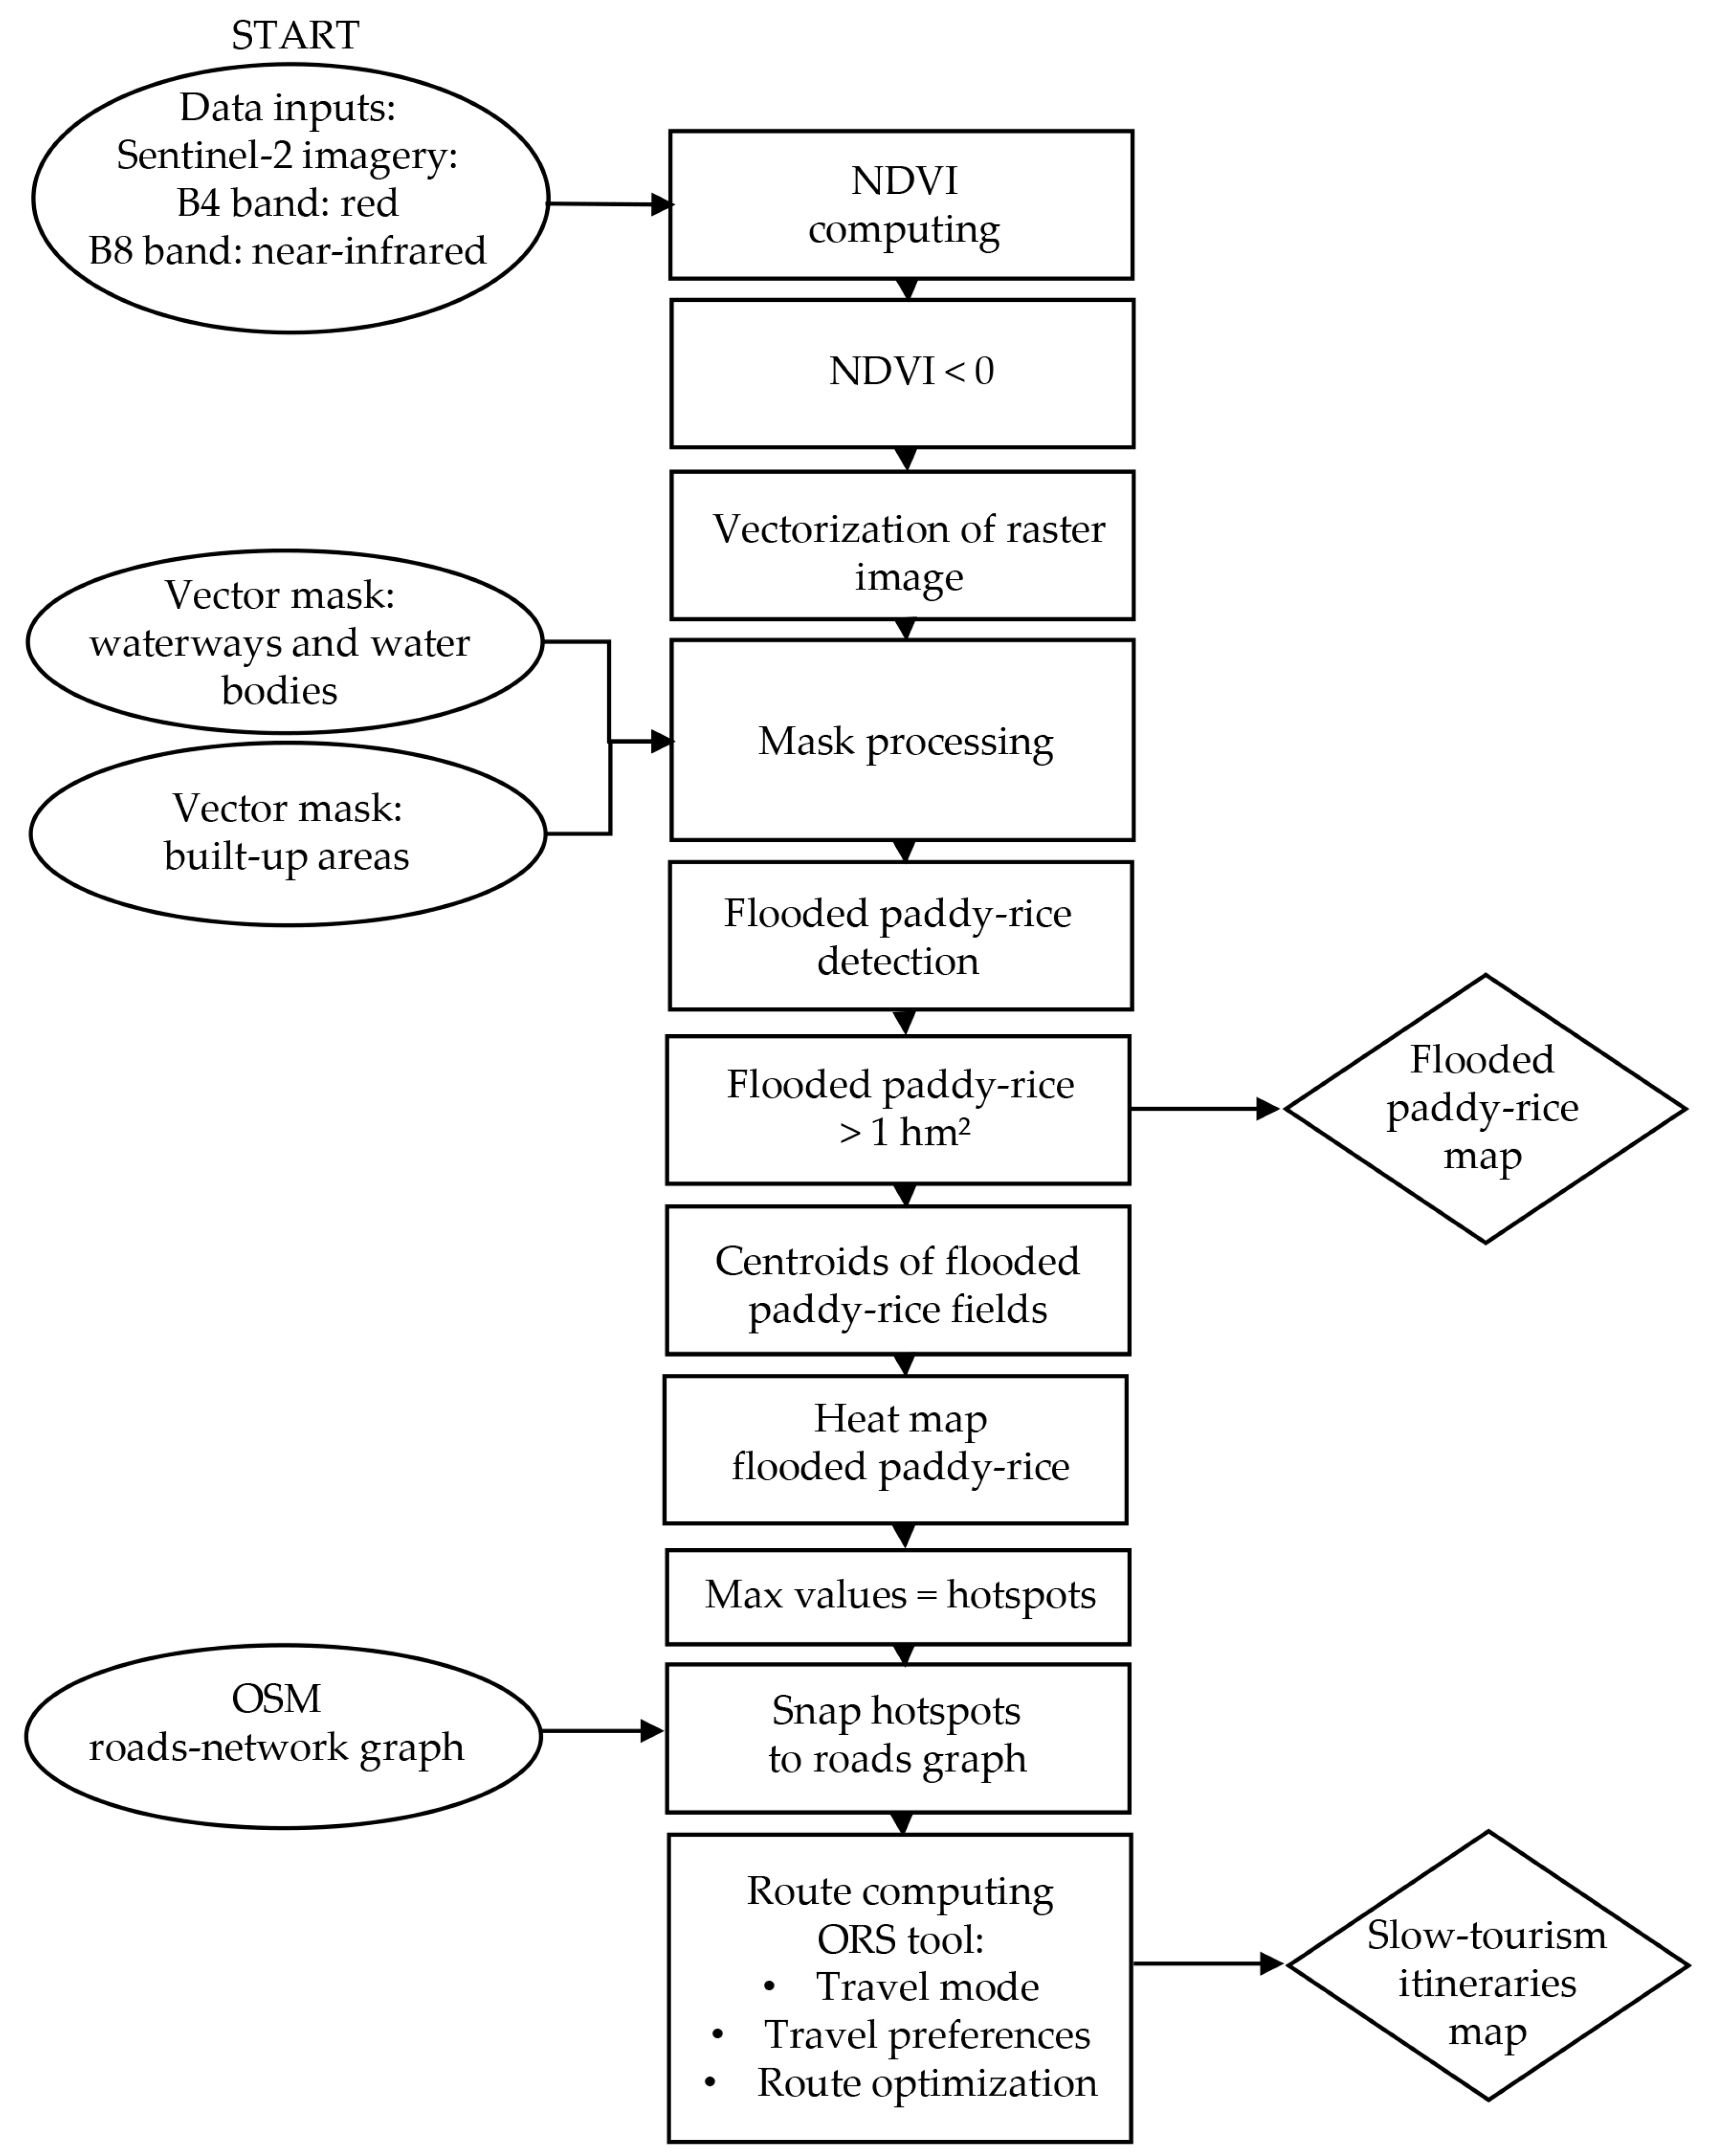
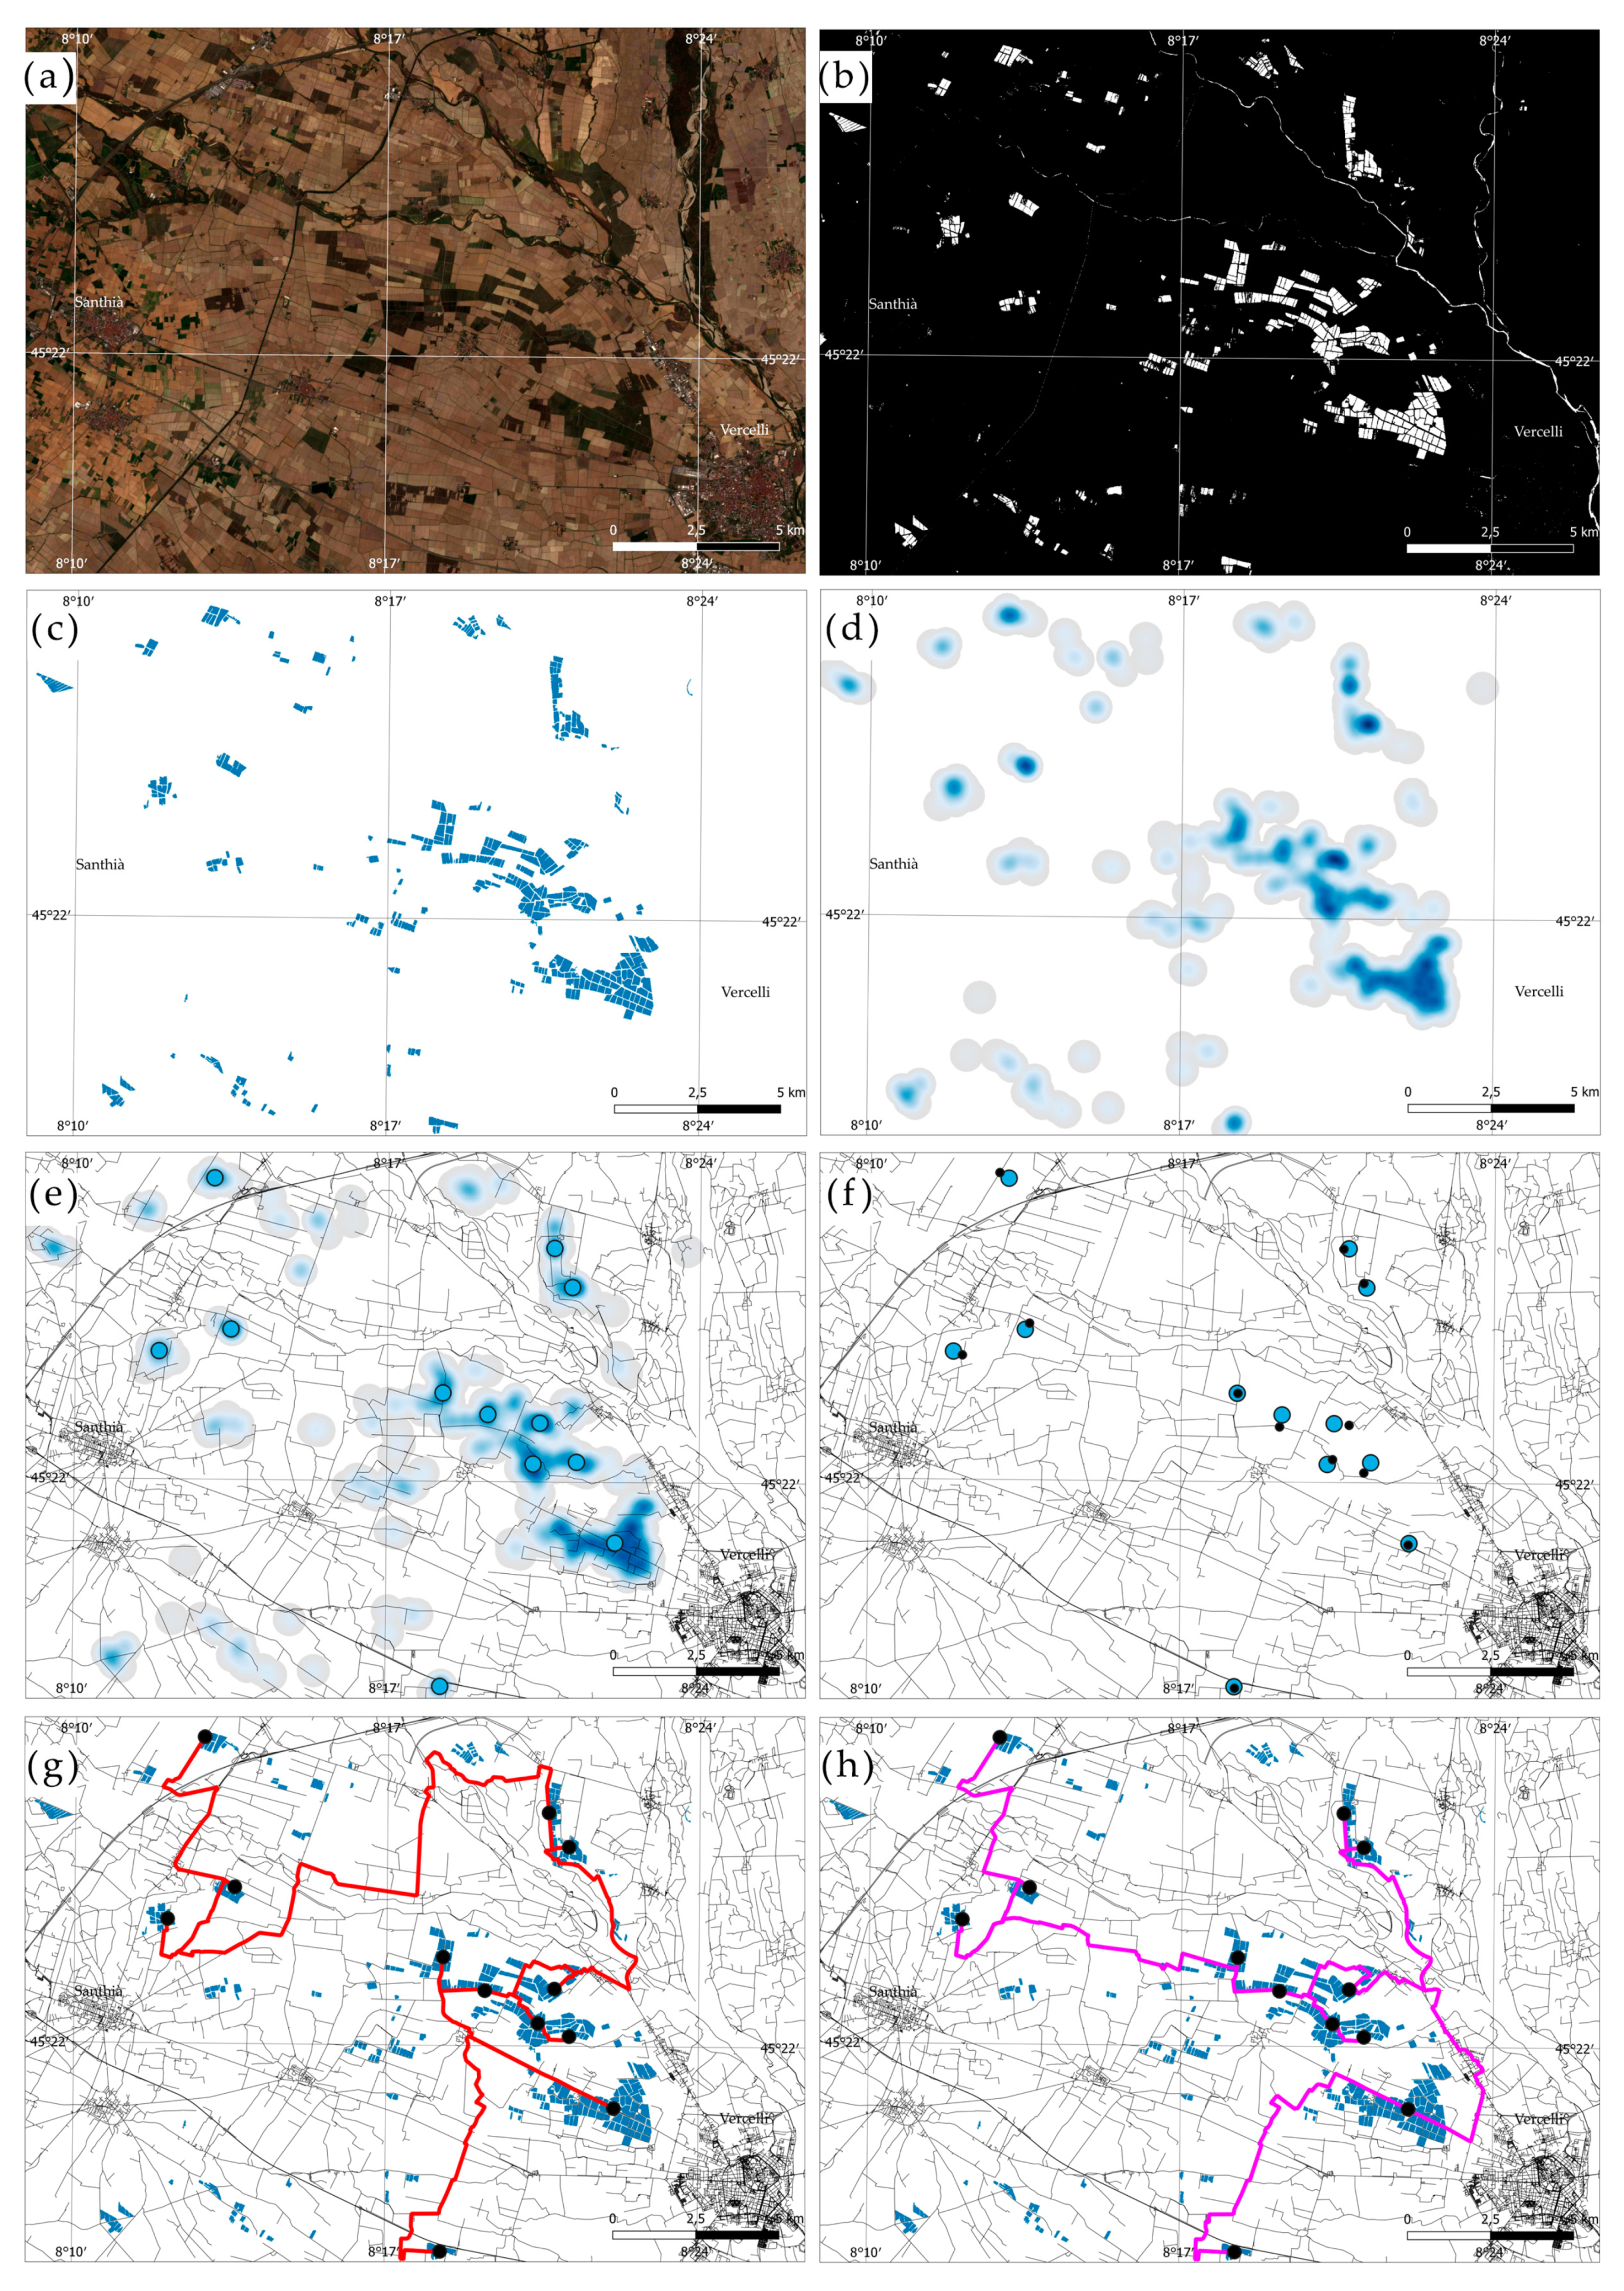
3.3. Method
4. Results
5. Discussion
Funding
Institutional Review Board Statement
Informed Consent Statement
Data Availability Statement
Acknowledgments
Conflicts of Interest
References
- ISNART; UNIONCAMERE; LEGAMBIENTE. Caratteristiche ed economia del cicloturismo in Italia 2° Rapporto Isnart-Legambiente Bike Summit 2020. Available online: https://www.legambiente.it/wp-content/uploads/2020/11/BikeSummit_2020.pdf (accessed on 22 November 2021).
- Izzo, F.; Ferraretto, A.; Bonetti, E.; Masiello, B. Bicicletta e Turismo in Italia. Un processo co-evolutivo. In XXIV Rapporto sul Turismo Italiano; CNR edizioni: Rome, Italy, 2020; pp. 421–436. ISBN 978-88-8080-442-0. [Google Scholar]
- Cultural Routes of the Council of Europe Programme. Available online: https://www.coe.int/en/web/cultural-routes/about (accessed on 16 November 2021).
- European Parliament. The European Cycle Route Network EuroVelo; European Union: Brussels, Belgium, 2012. [Google Scholar]
- Dickinson, J.; Lumsdon, L. Slow Travel and Tourism; Routledge: London, UK, 2011; ISBN 978-1-84977-649-3. [Google Scholar]
- Dickinson, J.E.; Lumsdon, L.M.; Robbins, D. Slow Travel: Issues for Tourism and Climate Change. J. Sustain. Tour. 2011, 19, 281–300. [Google Scholar] [CrossRef]
- Scott, N.; Laws, E.; Boksberger, P. Marketing of Tourism Experiences; Routledge: London, UK, 2013; ISBN 978-1-317-98727-7. [Google Scholar]
- Özdemir, G.; Çelebi, D. Exploring Dimensions of Slow Tourism Motivation. Anatolia 2018, 29, 540–552. [Google Scholar] [CrossRef]
- Gazzola, P.; Pavione, E.; Grechi, D.; Ossola, P. Cycle Tourism as a Driver for the Sustainable Development of Little-Known or Remote Territories: The Experience of the Apennine Regions of Northern Italy. Sustainability 2018, 10, 1863. [Google Scholar] [CrossRef] [Green Version]
- Pine, J.; Gilmore, J.H. Harvard Business Review; Harvard Business Publishing: Brighton, MA, USA, 1998. [Google Scholar]
- Palang, H.; Printsmann, A.; Sooväli, H. Seasonality and Landscapes. In Seasonal Landscapes; Palang, H., Sooväli, H., Printsmann, A., Eds.; Landscape Series; Springer: Dordrecht, The Netherlands, 2007; pp. 1–16. ISBN 978-1-4020-4990-3. [Google Scholar]
- Bender, O.; Schumacher, K.P.; Stein, D. Landscape, Seasonality, and Tourism: A Survey with Examples from Central Europe. In Seasonal Landscapes; Palang, H., Sooväli, H., Printsmann, A., Eds.; Landscape Series; Springer: Dordrecht, The Netherlands, 2007; pp. 181–213. ISBN 978-1-4020-4990-3. [Google Scholar]
- Jiménez-García, M.; Ruiz-Chico, J.; Peña-Sánchez, A.R. Landscape and Tourism: Evolution of Research Topics. Land 2020, 9, 488. [Google Scholar] [CrossRef]
- Gardner, N. A Manifesto for Slow Travel. Available online: https://www.hiddeneurope.eu/a-manifesto-for-slow-travel (accessed on 22 November 2021).
- Oremusová, D.; Nemčíková, M.; Krogmann, A. Transformation of the Landscape in the Conditions of the Slovak Republic for Tourism. Land 2021, 10, 464. [Google Scholar] [CrossRef]
- Terkenli, T.S.; Skowronek, E.; Georgoula, V. Landscape and Tourism: European Expert Views on an Intricate Relationship. Land 2021, 10, 327. [Google Scholar] [CrossRef]
- Daniel, T.C.; Vining, J. Methodological Issues in the Assessment of Landscape Quality. In Behavior and the Natural Environment; Altman, I., Wohlwill, J.F., Eds.; Human Behavior and Environment; Springer: Boston, MA, USA, 1983; pp. 39–84. ISBN 978-1-4613-3539-9. [Google Scholar]
- Council of Europe. European Treaty Series—No. 176. European Landscape Convention. Available online: https://rm.coe.int/1680080621 (accessed on 9 November 2021).
- Cassatella, C. Scenic and perceptual landscape challenging planning regulation. ATTI E RASSEGNA Tec. 2018, 72, 74–79. [Google Scholar]
- Dramstad, W.E.; Tveit, M.S.; Fjellstad, W.J.; Fry, G.L.A. Relationships between Visual Landscape Preferences and Map-Based Indicators of Landscape Structure. Landsc. Urban Plan. 2006, 78, 465–474. [Google Scholar] [CrossRef]
- Clay, G.R.; Daniel, T.C. Scenic Landscape Assessment: The Effects of Land Management Jurisdiction on Public Perception of Scenic Beauty. Landsc. Urban Plan. 2000, 49, 1–13. [Google Scholar] [CrossRef]
- Atik, M.; Işikli, R.C.; Ortaçeşme, V.; Yildirim, E. Definition of Landscape Character Areas and Types in Side Region, Antalya-Turkey with Regard to Land Use Planning. Land Use Policy 2015, 44, 90–100. [Google Scholar] [CrossRef]
- Palang, H.; Fry, G.; Jauhiainen, J.S.; Jones, M.; Sooväli, H. Editorial: Landscape and Seasonality—Seasonal Landscapes. Landsc. Res. 2005, 30, 165–172. [Google Scholar] [CrossRef]
- Stobbelaar, D.J.; Hendriks, K. Seasonality of Agricultural Landscapes: Reading Time and Place by Colours and Shapes. In Seasonal Landscapes; Palang, H., Sooväli, H., Printsmann, A., Eds.; Landscape Series; Springer: Dordrecht, The Netherlands, 2007; pp. 103–126. ISBN 978-1-4020-4990-3. [Google Scholar]
- Wang, L.; Ning, Z.; Wang, H.; Ge, Q. Impact of Climate Variability on Flowering Phenology and Its Implications for the Schedule of Blossom Festivals. Sustainability 2017, 9, 1127. [Google Scholar] [CrossRef] [Green Version]
- Spencer, D.M.; Holecek, D.F. A Profile of the Fall Foliage Tourism Market. J. Vacat. Mark. 2007, 13, 339–358. [Google Scholar] [CrossRef]
- Spotts, D.M.; Mahoney, E.M. Understanding the Fall Tourism Market. J. Travel Res. 1993, 32, 3–15. [Google Scholar] [CrossRef]
- Ge, Q.; Dai, J.; Liu, J.; Zhong, S.; Liu, H. The Effect of Climate Change on the Fall Foliage Vacation in China. Tour. Manag. 2013, 38, 80–84. [Google Scholar] [CrossRef]
- Hall, C.M.; Scott, D.; Gössling, S. Forests, Climate Change and Tourism. J. Herit. Tour. 2011, 6, 353–363. [Google Scholar] [CrossRef]
- Chen, B.; Qiu, Z.; Nakamura, K. Tourist Preferences for Agricultural Landscapes: A Case Study of Terraced Paddy Fields in Noto Peninsula, Japan. J. Mt. Sci. 2016, 13, 1880–1892. [Google Scholar] [CrossRef]
- Ritchie, B.W.; Hall, C.M. Bicycle Tourism and Regional Development: A New Zealand Case Study. Anatolia 1999, 10, 89–112. [Google Scholar] [CrossRef]
- Dipartimento per lo Sviluppo e la Coesione Economica. Strategia Nazionale per le Aree Interne: Definizione, Obiettivi, Strumenti e Governance. 2013. Available online: https://www.miur.gov.it/documents/20182/890263/strategia_nazionale_aree_interne.pdf/d10fc111-65c0-4acd-b253-63efae626b19 (accessed on 9 November 2021).
- Andreoli, A.; Silvestri, F. Tourism as a Driver of Development in the Inner Areas. Ital. J. Plan. Pract. 2017, 7, 80–99. [Google Scholar]
- Fall Prediction Map. 2021. Available online: https://smokymountains.com/fall-foliage-map/ (accessed on 22 November 2021).
- Maine Fall Foliage—When and Where to Visit—Maine DACF. Available online: https://www.maine.gov/dacf/mfs/projects/fall_foliage/whenandwhere/index.html (accessed on 22 November 2021).
- Peak Fall Foliage Map. Available online: https://newengland.com/seasons/fall/foliage/peak-fall-foliage-map/ (accessed on 22 November 2021).
- Fall Colours at Ontario Parks. Available online: https://www.ontarioparks.com/fallcolour (accessed on 22 November 2021).
- Fu, W.; Ma, J.; Chen, P.; Chen, F. Remote Sensing Satellites for Digital Earth. In Manual of Digital Earth; Guo, H., Goodchild, M.F., Annoni, A., Eds.; Springer: Singapore, 2020; pp. 55–123. ISBN 978-981-329-915-3. [Google Scholar]
- Liu, Z.; Foresman, T.; van Genderen, J.; Wang, L. Understanding digital Earth. In Manual of Digital Earth; Springer: Singapore, 2020; pp. 1–21. [Google Scholar] [CrossRef] [Green Version]
- Cleland, E.E.; Chuine, I.; Menzel, A.; Mooney, H.A.; Schwartz, M.D. Shifting Plant Phenology in Response to Global Change. Trends Ecol. Evol. 2007, 22, 357–365. [Google Scholar] [CrossRef] [PubMed]
- Tucker, C.J. Red and Photographic Infrared Linear Combinations for Monitoring Vegetation. Remote Sens. Environ. 1979, 8, 127–150. [Google Scholar] [CrossRef] [Green Version]
- Glenn, E.P.; Huete, A.R.; Nagler, P.L.; Nelson, S.G. Relationship Between Remotely-Sensed Vegetation Indices, Canopy Attributes and Plant Physiological Processes: What Vegetation Indices Can and Cannot Tell Us About the Landscape. Sensors 2008, 8, 2136–2160. [Google Scholar] [CrossRef] [PubMed] [Green Version]
- Motohka, T.; Nasahara, K.N.; Oguma, H.; Tsuchida, S. Applicability of Green-Red Vegetation Index for Remote Sensing of Vegetation Phenology. Remote Sens. 2010, 2, 2369–2387. [Google Scholar] [CrossRef] [Green Version]
- Bastiaanssen, W.G.M.; Molden, D.J.; Makin, I.W. Remote Sensing for Irrigated Agriculture: Examples from Research and Possible Applications. Agric. Water Manag. 2000, 46, 137–155. [Google Scholar] [CrossRef]
- Xiao, X.; Boles, S.; Frolking, S.; Salas, W.; Moore, B.; Li, C.; He, L.; Zhao, R. Observation of Flooding and Rice Transplanting of Paddy Rice Fields at the Site to Landscape Scales in China Using VEGETATION Sensor Data. Int. J. Remote Sens. 2002, 23, 3009–3022. [Google Scholar] [CrossRef]
- Xiao, X.; Boles, S.; Frolking, S.; Li, C.; Babu, J.Y.; Salas, W.; Moore, B. Mapping Paddy Rice Agriculture in South and Southeast Asia Using Multi-Temporal MODIS Images. Remote Sens. Environ. 2006, 100, 95–113. [Google Scholar] [CrossRef]
- Dong, J.; Xiao, X. Evolution of Regional to Global Paddy Rice Mapping Methods: A Review. ISPRS J. Photogramm. Remote Sens. 2016, 119, 214–227. [Google Scholar] [CrossRef] [Green Version]
- Pham, L.H.; Pham, L.T.H.; Dang, T.D.; Tran, D.D.; Dinh, T.Q. Application of Sentinel-1 Data in Mapping Land-Use and Land Cover in a Complex Seasonal Landscape: A Case Study in Coastal Area of Vietnamese Mekong Delta. Geocarto Int. 2021. [Google Scholar] [CrossRef]
- Rozenstein, O.; Adamowski, J. Linking Spaceborne and Ground Observations of Autumn Foliage Senescence in Southern Québec, Canada. Remote Sens. 2017, 9, 630. [Google Scholar] [CrossRef] [Green Version]
- Feyisa, G.L.; Meilby, H.; Fensholt, R.; Proud, S.R. Automated Water Extraction Index: A New Technique for Surface Water Mapping Using Landsat Imagery. Remote Sens. Environ. 2014, 140, 23–35. [Google Scholar] [CrossRef]
- Kaplan, G.; Avdan, U. Object-Based Water Body Extraction Model Using Sentinel-2 Satellite Imagery. Eur. J. Remote Sens. 2017, 50, 137–143. [Google Scholar] [CrossRef] [Green Version]
- Jiang, W.; Ni, Y.; Pang, Z.; Li, X.; Ju, H.; He, G.; Lv, J.; Yang, K.; Fu, J.; Qin, X. An Effective Water Body Extraction Method with New Water Index for Sentinel-2 Imagery. Water 2021, 13, 1647. [Google Scholar] [CrossRef]
- Ente Nazionale Risi. Superfici Coltivate. Available online: http://www.enterisi.it/servizi/seriestoriche/superfici_fase01.aspx (accessed on 15 October 2021).
- Segre, L. Agricoltura e Costruzione Di Un Sistema Idraulico Nella Pianura Piemontese: 1800–1880; Studi e Ricerche Di Storia Economica Italiana Nell’età Del Risorgimento; Banca Commerciale Italiana: Milano, Italy, 1983. [Google Scholar]
- Gavinelli, D.; Gilardi, T. Dalla Pianura Lombardo-Piemontese Alle Falde Dell’himalaya. Colture e Culture Risicole A Confront; LCM Collana Ser; Università degli Studi di Milano: Milano, Italy, 2017; pp. 419–434. ISBN 9788879168182. [Google Scholar] [CrossRef]
- Rolando, A.; Scandiffio, A. Historical Agricultural Landscapes: Mapping Seasonal Conditions For Sustainable Tourism. In Proceedings of the 28th CIPA Symposium “Great Learning & Digital Emotion”, Beijing, China, 28 August–1 September 2021; Copernicus GmbH: Gottingen, Germany; Volume XLVI-M-1–2021, pp. 641–646. [Google Scholar]
- European Commission Copernicus. Europe’s Eyes on Earth. Available online: https://www.copernicus.eu/sites/default/files/documents/Brochure/Copernicus_Brochure_EN_WEB.pdf (accessed on 15 October 2021).
- Marconcini, M.; Esch, T.; Bachofer, F.; Metz-Marcncini, A. Digital Earth in Europe. In Manual of Digital Earth; Guo, H., Goodchild, M.F., Annoni, A., Eds.; Springer: Singapore, 2020; pp. 647–681. ISBN 978-981-329-915-3. [Google Scholar]
- Sentinel-2—Missions—Sentinel Online—Sentinel Online. Available online: https://sentinels.copernicus.eu/web/sentinel/missions/sentinel-2 (accessed on 22 October 2021).
- MSI Instrument—Sentinel-2 MSI Technical Guide—Sentinel Online—Sentinel Online. Available online: https://sentinel.esa.int/web/sentinel/technical-guides/sentinel-2-msi/msi-instrument (accessed on 22 October 2021).
- Homepage|Copernicus. Available online: https://www.copernicus.eu/en (accessed on 22 October 2021).
- Baret, F.; Guyot, G. Potentials and Limits of Vegetation Indices for LAI and APAR Assessment. Remote Sens. Environ. 1991, 35, 161–173. [Google Scholar] [CrossRef]
- Pettorelli, N.; Vik, J.O.; Mysterud, A.; Gaillard, J.-M.; Tucker, C.J.; Stenseth, N.C. Using the Satellite-Derived NDVI to Assess Ecological Responses to Environmental Change. Trends Ecol. Evol. 2005, 20, 503–510. [Google Scholar] [CrossRef] [PubMed]
- Openrouteservice. Available online: https://openrouteservice.org/ (accessed on 22 October 2021).
- Scandiffio, A. Mapping Flooded Paddy-Rice Fields in the Landscape between Turin and Milan: A GIS-Based Method for Detecting Scenic Routes for Experiential Tourism. GI_Forum 2021, 1, 169–178. [Google Scholar] [CrossRef]


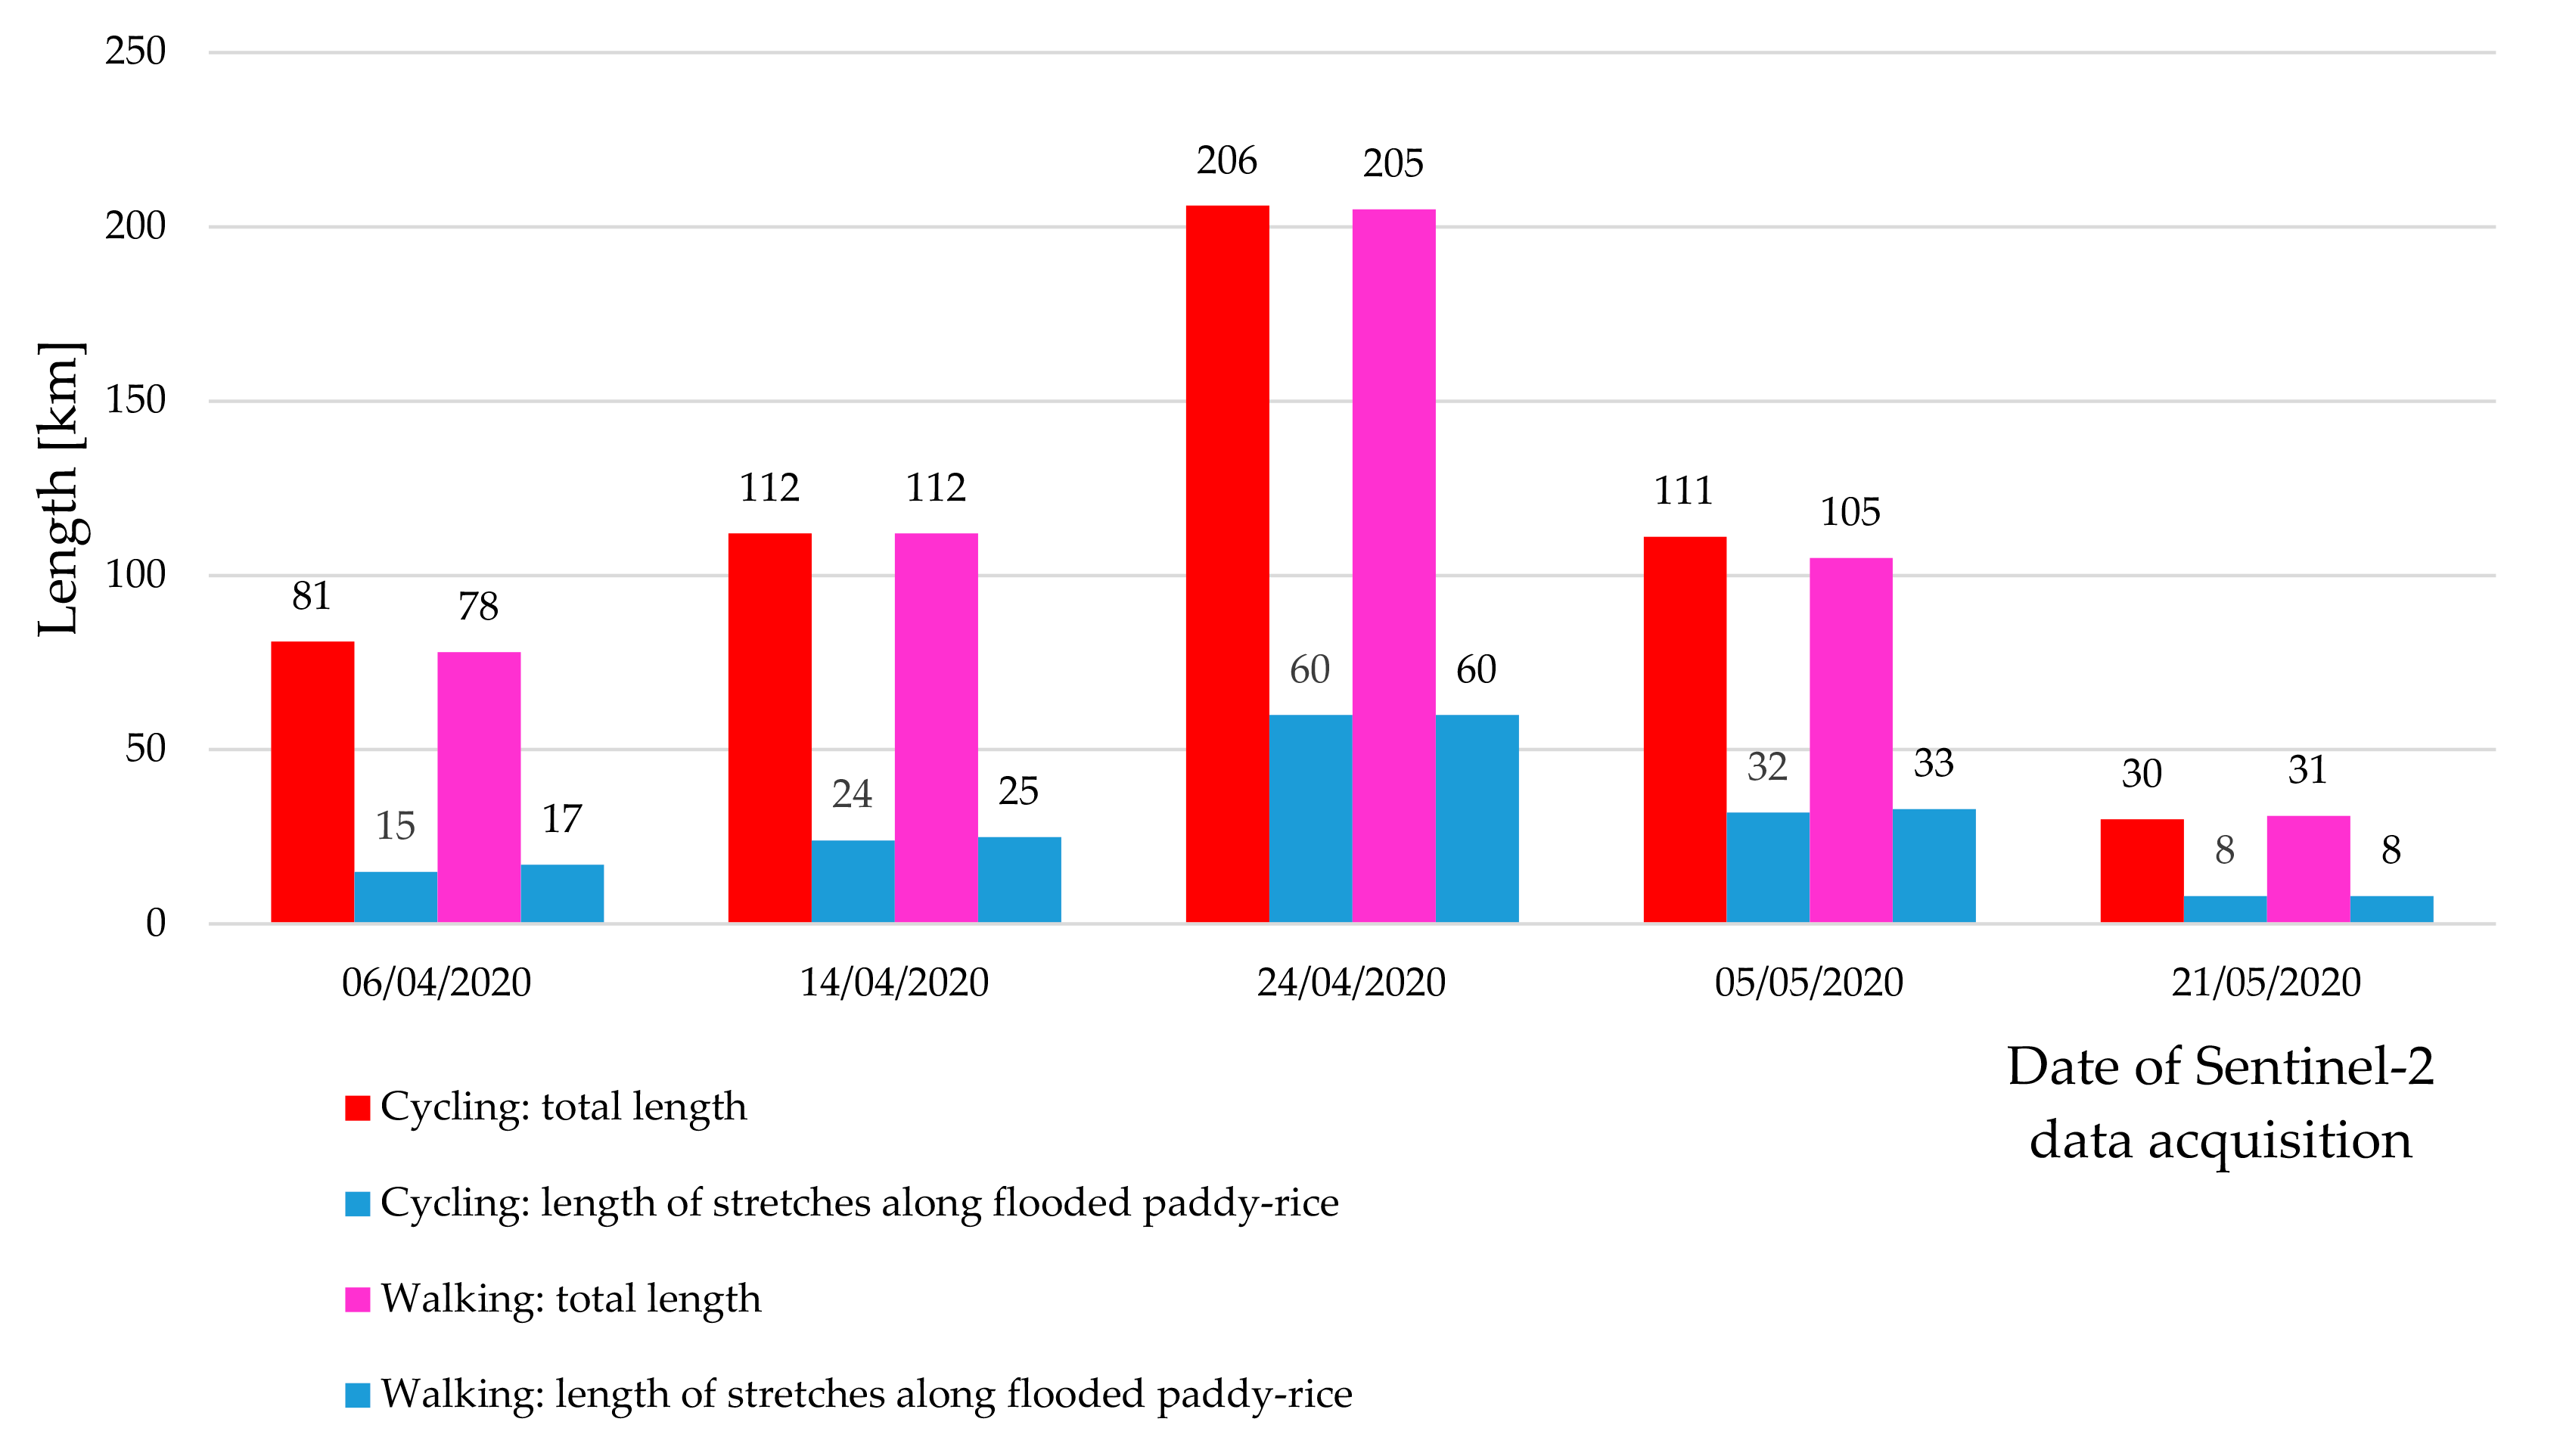
| Date of Sentinel-2 Data Acquisition | Cycling | Foot Walking | ||||
|---|---|---|---|---|---|---|
| Total length (km) | Length of stretches along flooded paddy-rice fields (km) | Route percentage along flooded paddy-rice fields (%) | Total length (km) | Length of stretches along flooded paddy-rice fields (km) | Route Percentage along flooded paddy-rice fields (%) | |
| 6 April 2020 | 81 | 15 | 19 | 78 | 17 | 22 |
| 14 April 2020 | 112 | 24 | 21 | 112 | 25 | 25 |
| 24 April 2020 | 206 | 60 | 29 | 205 | 60 | 29 |
| 5 May 2020 | 111 | 32 | 29 | 105 | 33 | 31 |
| 21 May 2020 | 30 | 8 | 27 | 31 | 8 | 26 |
Publisher’s Note: MDPI stays neutral with regard to jurisdictional claims in published maps and institutional affiliations. |
© 2021 by the author. Licensee MDPI, Basel, Switzerland. This article is an open access article distributed under the terms and conditions of the Creative Commons Attribution (CC BY) license (https://creativecommons.org/licenses/by/4.0/).
Share and Cite
Scandiffio, A. Parametric Definition of Slow Tourism Itineraries for Experiencing Seasonal Landscapes. Application of Sentinel-2 Imagery to the Rural Paddy-Rice Landscape in Northern Italy. Sustainability 2021, 13, 13155. https://doi.org/10.3390/su132313155
Scandiffio A. Parametric Definition of Slow Tourism Itineraries for Experiencing Seasonal Landscapes. Application of Sentinel-2 Imagery to the Rural Paddy-Rice Landscape in Northern Italy. Sustainability. 2021; 13(23):13155. https://doi.org/10.3390/su132313155
Chicago/Turabian StyleScandiffio, Alessandro. 2021. "Parametric Definition of Slow Tourism Itineraries for Experiencing Seasonal Landscapes. Application of Sentinel-2 Imagery to the Rural Paddy-Rice Landscape in Northern Italy" Sustainability 13, no. 23: 13155. https://doi.org/10.3390/su132313155
APA StyleScandiffio, A. (2021). Parametric Definition of Slow Tourism Itineraries for Experiencing Seasonal Landscapes. Application of Sentinel-2 Imagery to the Rural Paddy-Rice Landscape in Northern Italy. Sustainability, 13(23), 13155. https://doi.org/10.3390/su132313155