
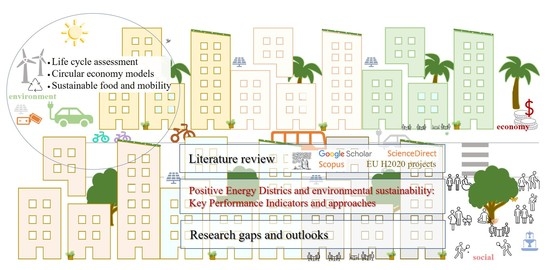
Environmental Sustainability Approaches and Positive Energy Districts: A Literature Review


Abstract
:
1. Introduction
- Energy security and stability, obtainable through energy efficiency and active demand management strategies (for load shifting and energy peak reduction).
- Sustainability in all its forms to ensure high quality of life for the occupants and safeguard the environment by achieving the objectives of the COP-21.
1.1. Positive Energy Districts: Fundamentals and Definitions
- “couples the built environment with sustainable energy production, consumption, and mobility (e.g., EV charging) to create added value and incentives for the consumers and the society;
- makes optimal use of advanced materials, local RES, and other low carbon solutions (i.e., local storage, smart energy grids, demand-response, cutting-edge energy management systems, user interaction, and ICT):
- offers affordable living, improved indoor environment, and well-being for the inhabitants.”
- Geographical boundaries: boundaries of the PED identified by spatial limits of the district which include the urban agglomeration.
- Functional boundaries: limits of the PED derived from energy networks, which can also extend over a larger area than the district.
- Virtual boundaries: borders not dictated by graphical limits of the PED but by contractual ties as energy infrastructure of the PED located outside the urban agglomeration (e.g., an offshore wind power plant).
- Autonomous PED: positive annual energy balance within the geographical boundaries and possible connection with the outside to provide energy and flexibility.
- Dynamic PED: positive annual energy balance within the geographical boundaries with bi-directional exchange of energy with the hinterland, as with other PEDs or with energy networks (import in moments of production deficit or export of energy).
- Virtual PED: positive annual energy balance within the virtual boundaries of the PED with dynamic energy exchanges with the hinterland.
1.2. Objective of the Study
- Analysis of the methods and approaches of environmental sustainability in PEDs and in sustainable districts from which lessons learned could be transposed to the PEDs.
- Analysis of the Key Performance Indicators relating to the assessment of the environmental sustainability of innovative sustainable districts.
- Identification of research gaps, hot spots and barriers towards PED development.
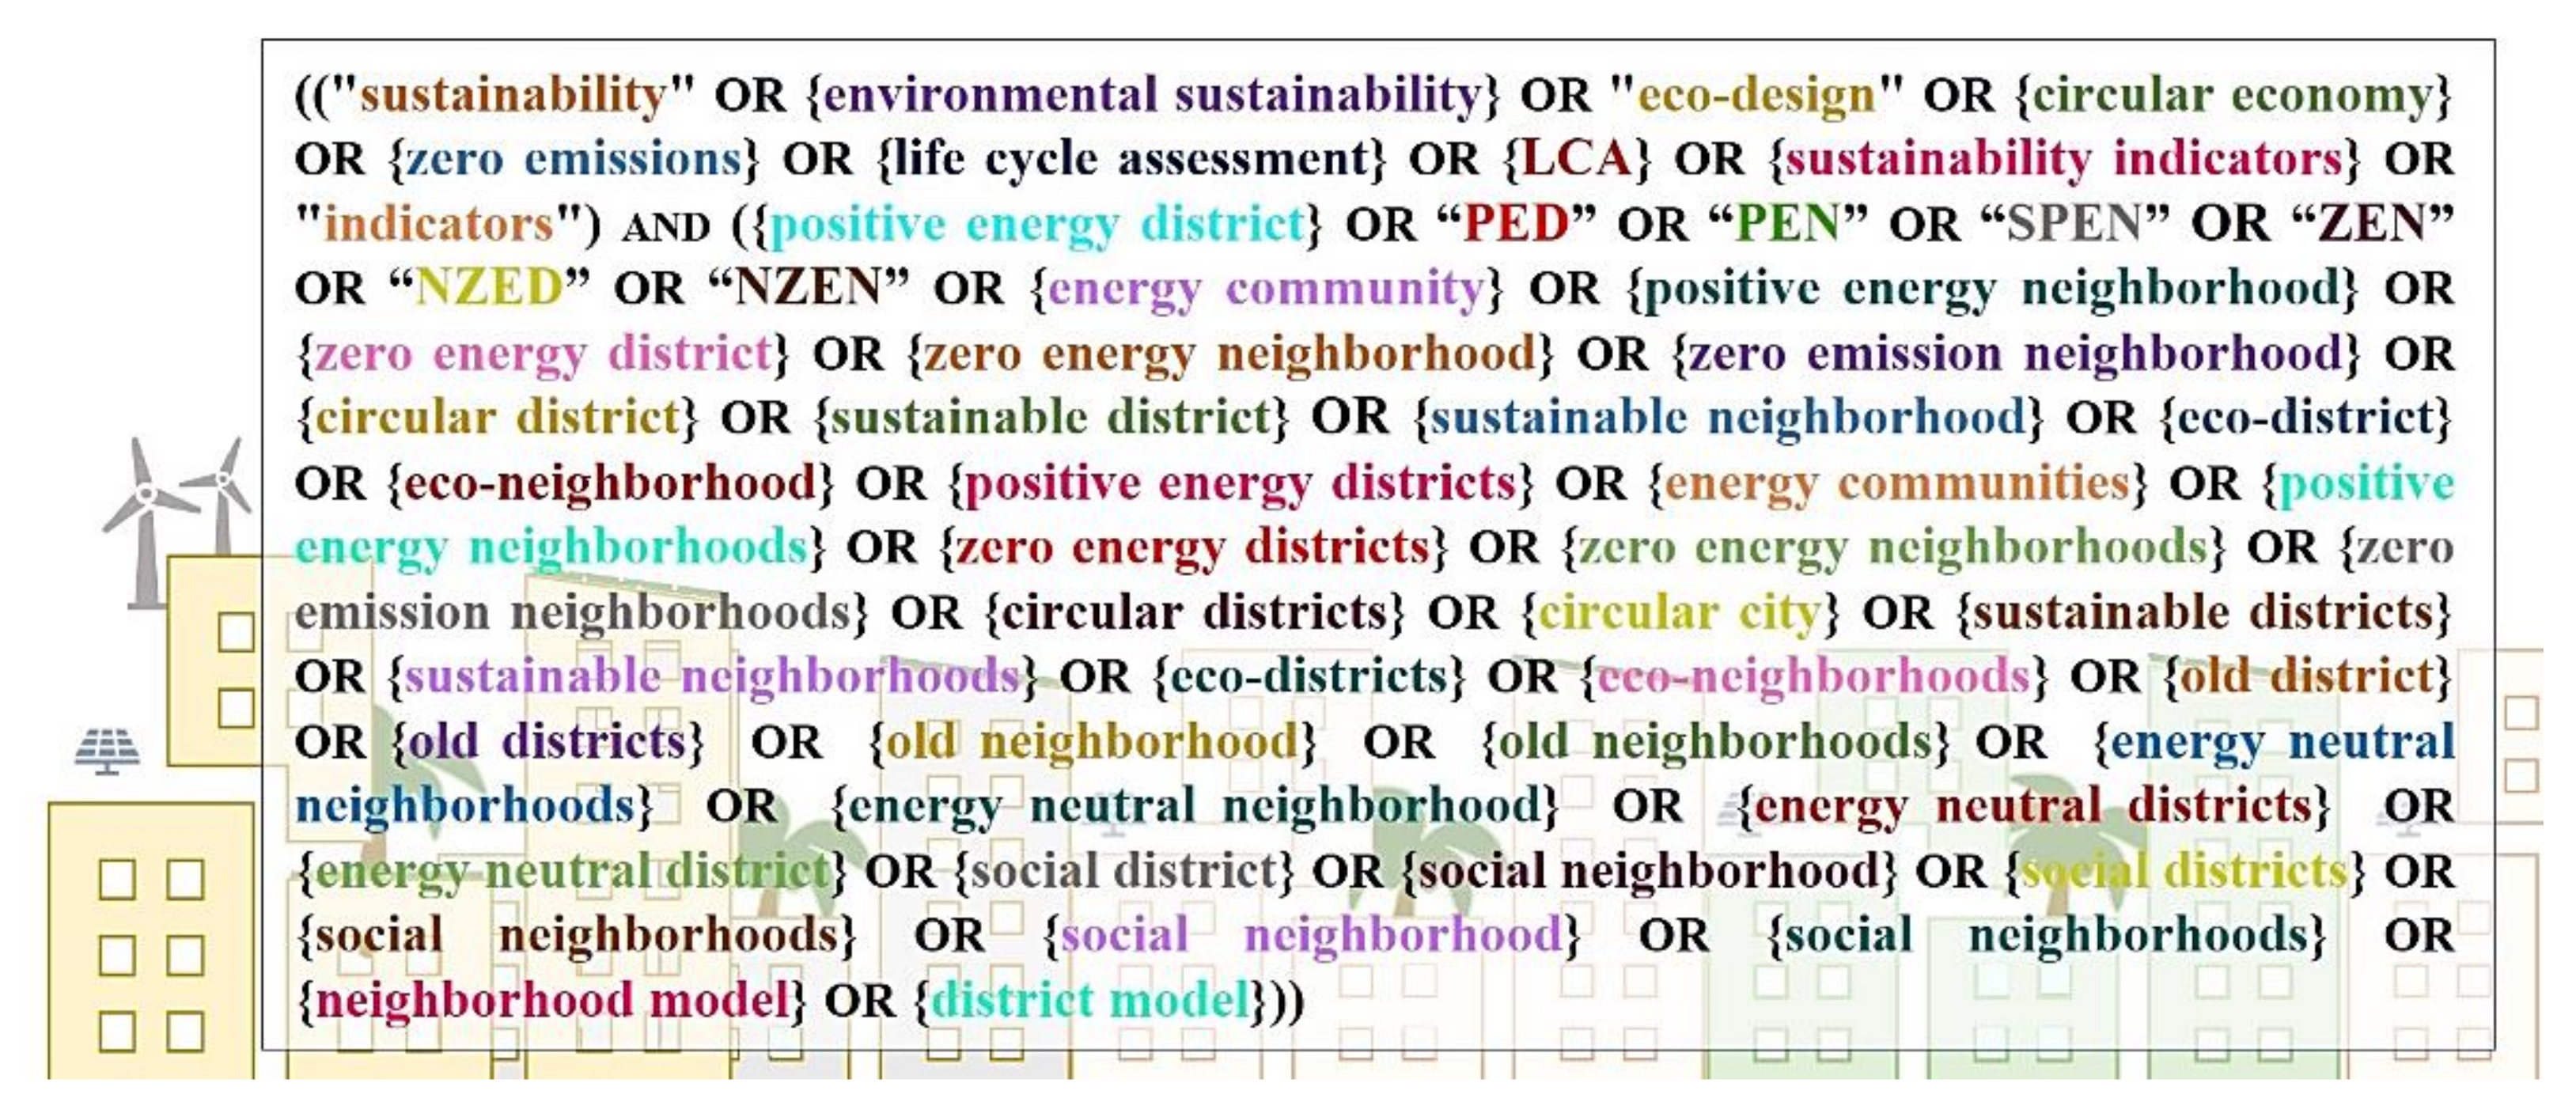
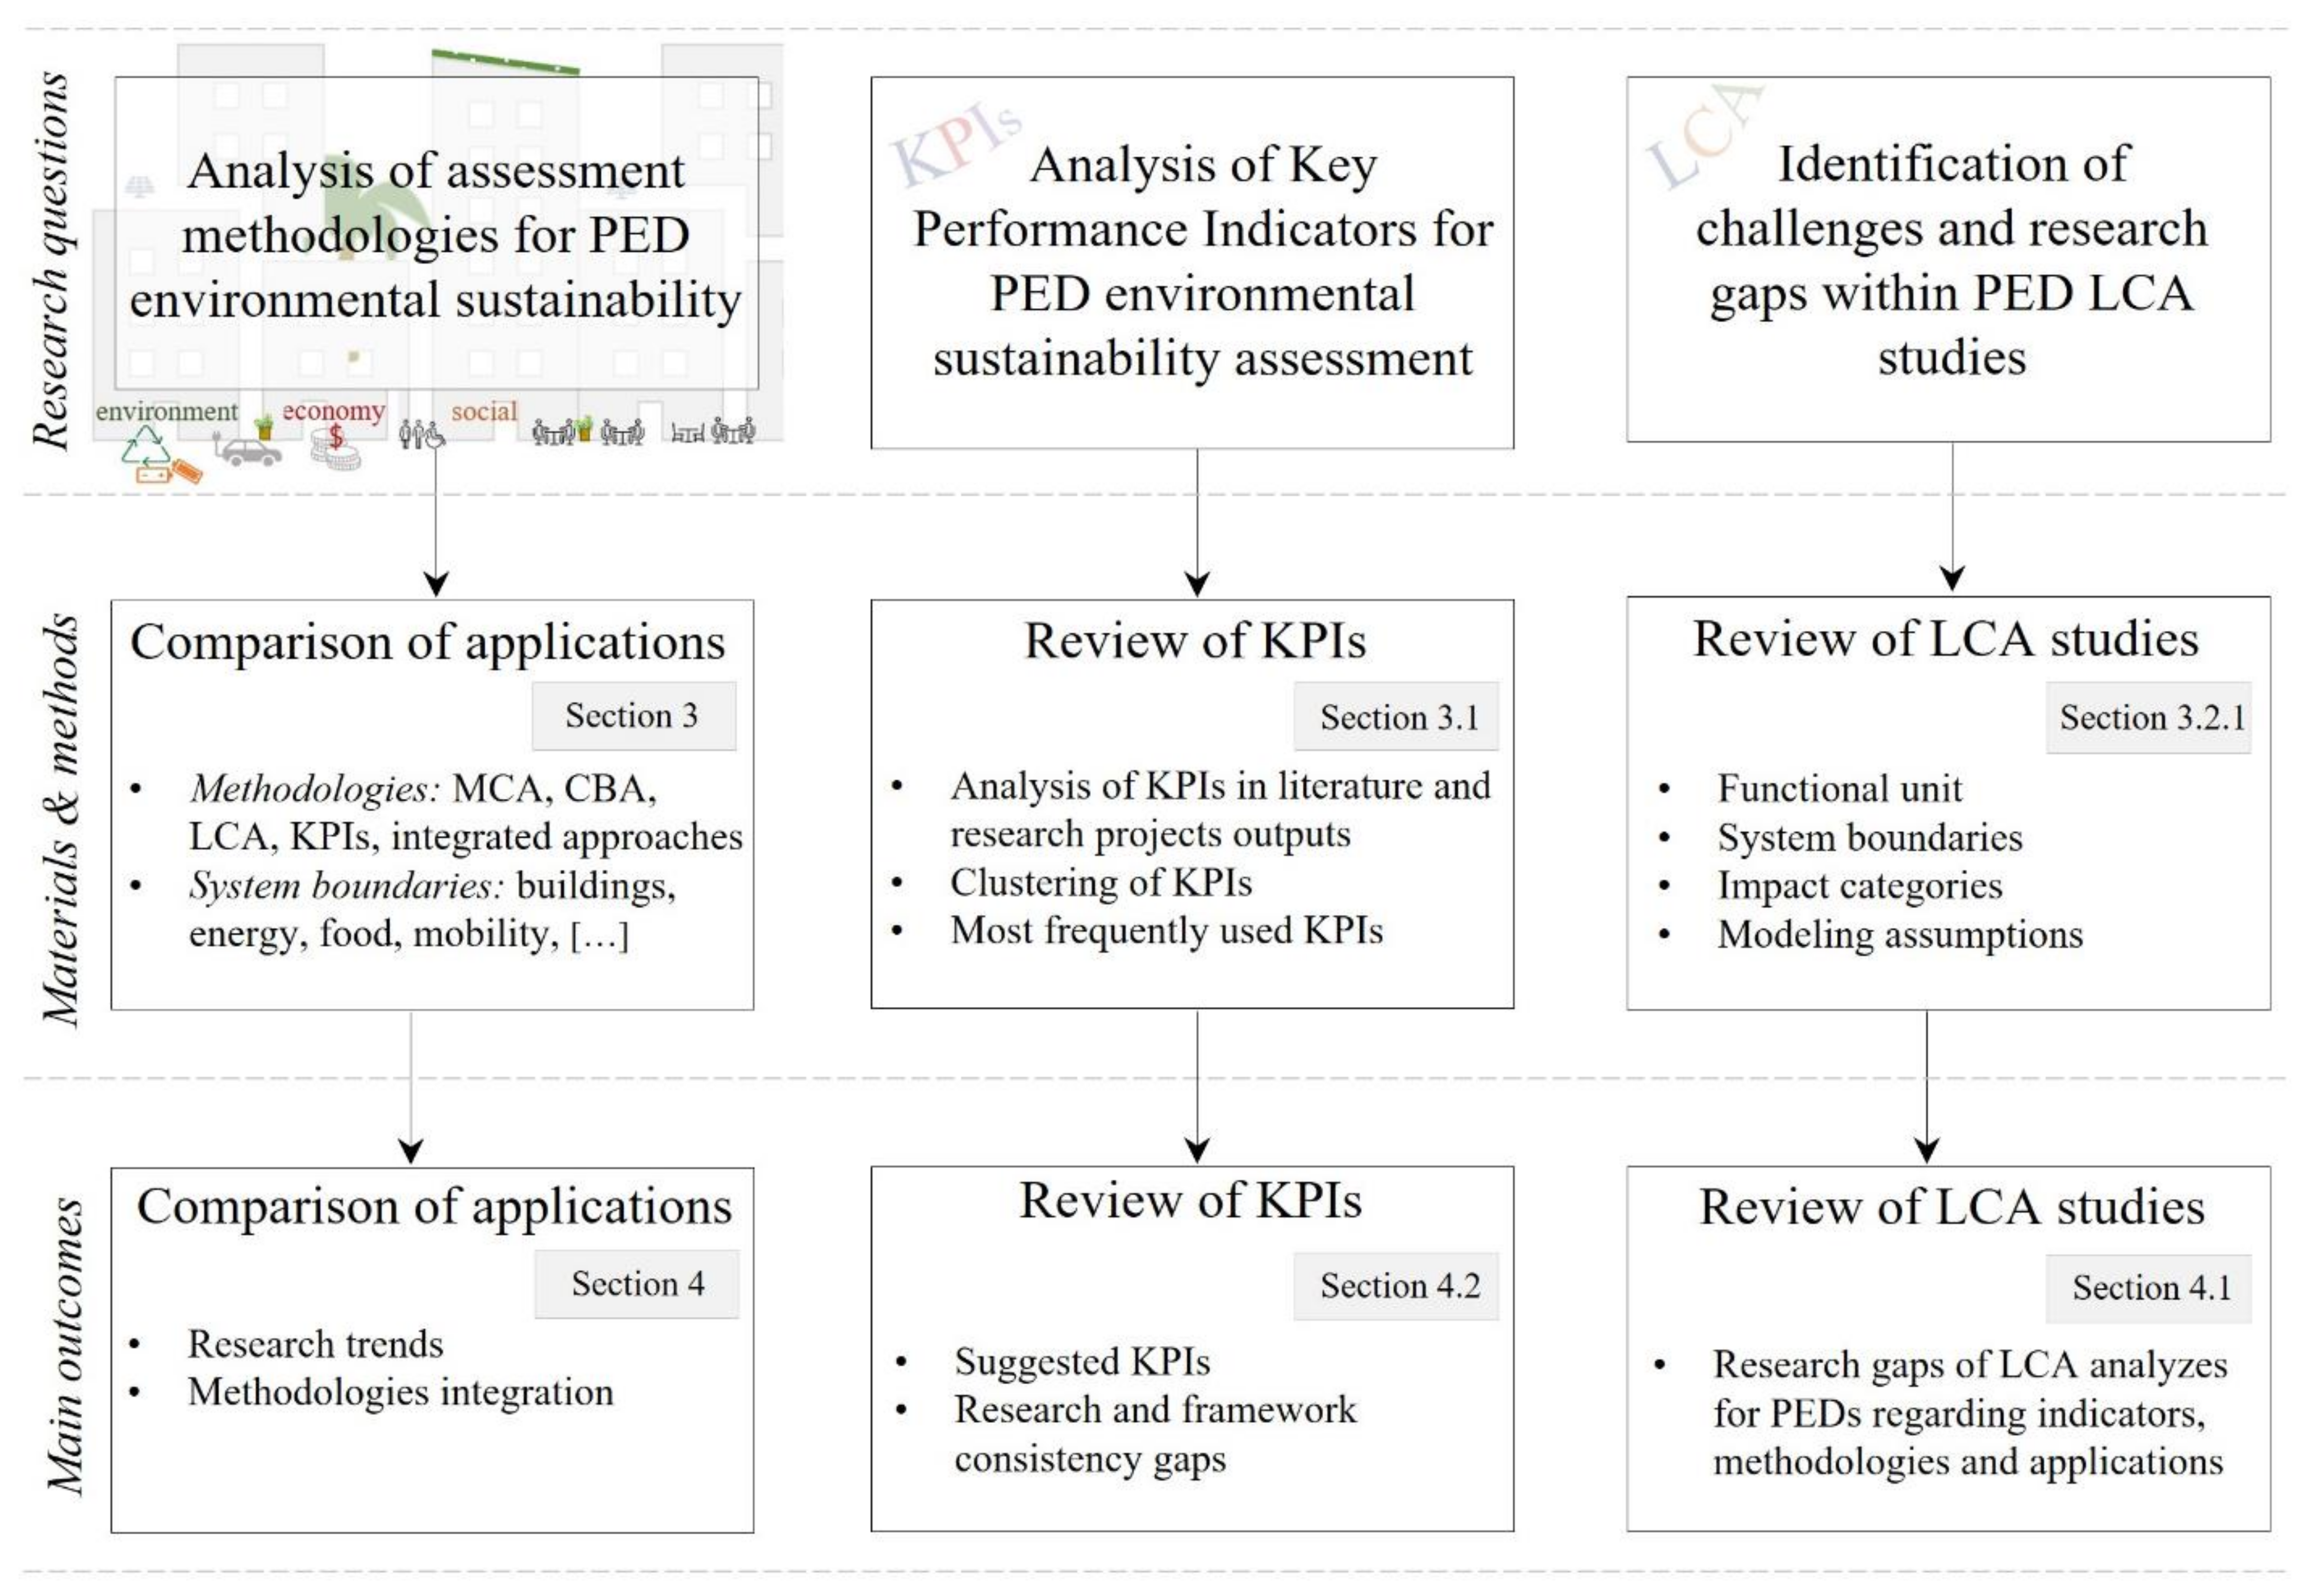
2. Materials and Methods
- What are the trends for urban environmental sustainability, and given the interconnected and multifaceted nature of sustainability, have integrated sustainability approaches been sought?
- Which KPIs are used and what others could integrate the evaluation framework?
- What are the main challenges that should be addressed in the Life Cycle Assessment (LCA) of PEDs?
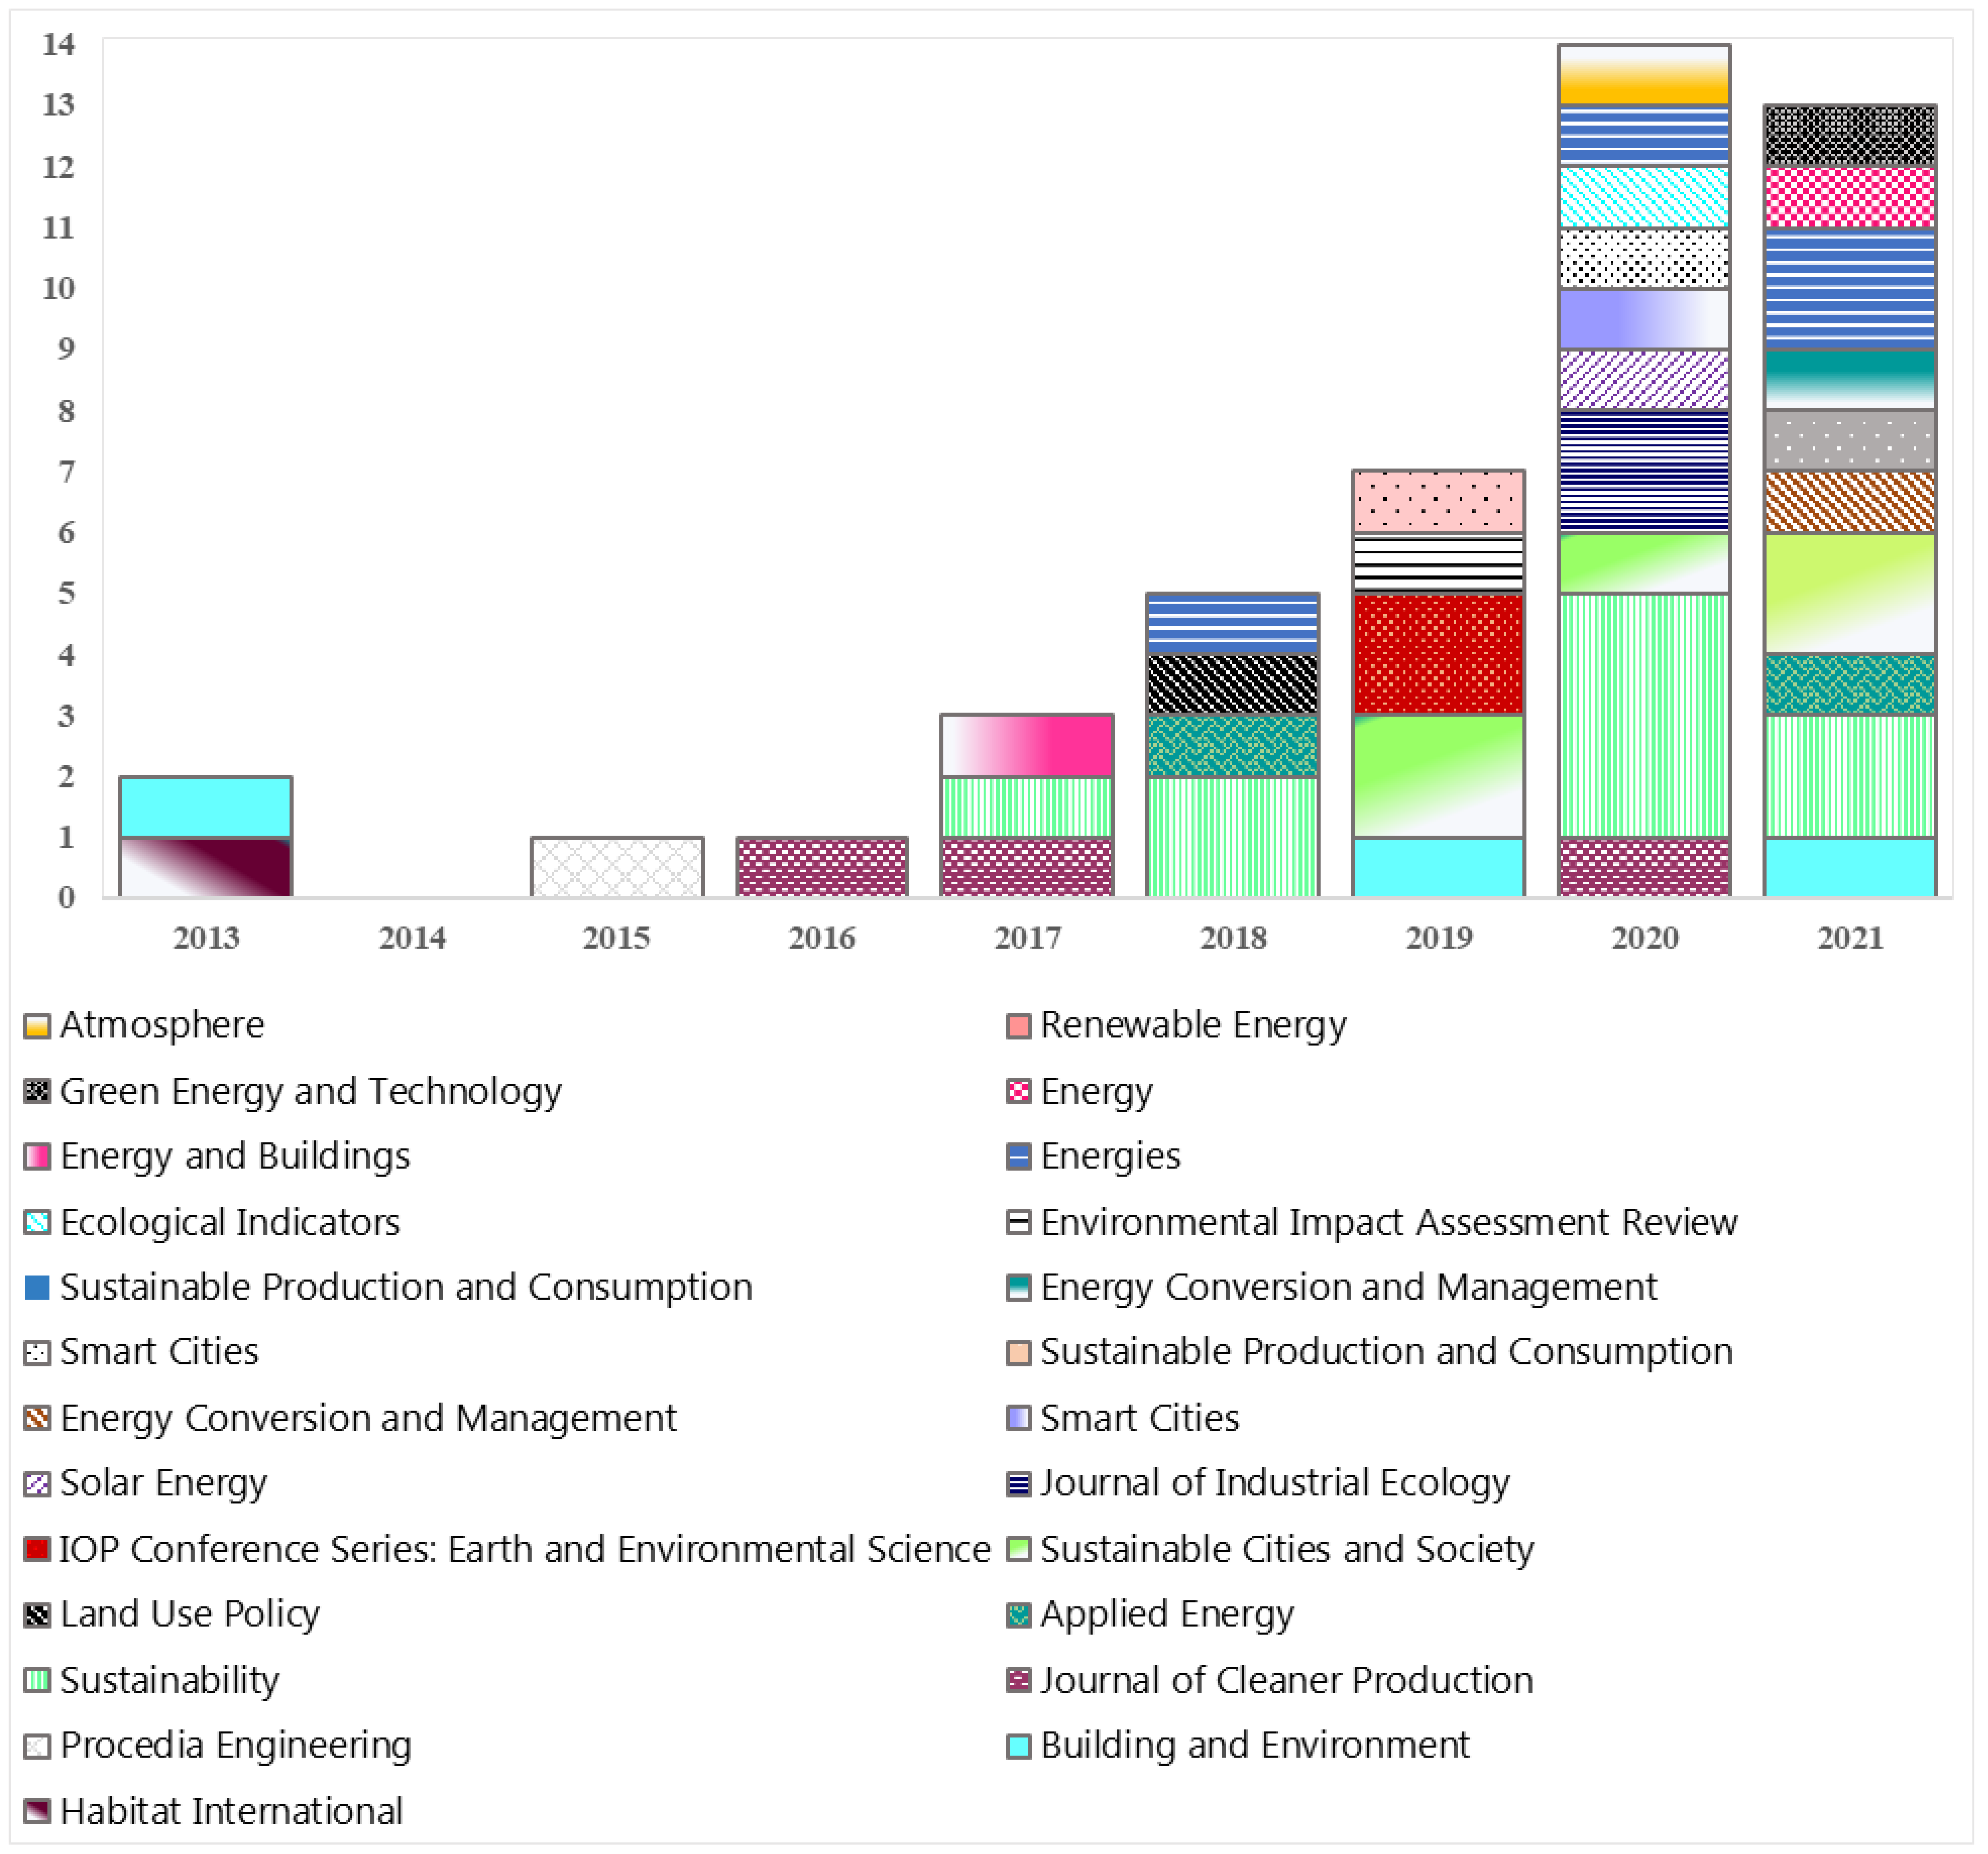
3. Literature Review Results
- Applications based on Key Performance Indicators (KPIs) and supported by the optimization/Multi Criteria Analysis (MCA)/Cost Benefit Analysis (CBA), etc.
- Applications based on Life Cycle Thinking (LCT), more specifically on Life Cycle Assessment (LCA).
- Mixed methods that combine LCT techniques with other KPI-based methods.
- Threat of the operational feasibility of the technologies;
- Technical maturity of the energy technologies;
- System reliability;
- Resource feasibility;
- Acceptance of people;
- Institutional/technical/finance/political and regulatory barriers;
- Technical/finance/energy market/environmental/political and regulatory barriers.
3.1. Key Performance Indicators for Sustainable Urbanization
- Sustainable mobility KPIs relating to the planning and design of the transport network and infrastructures, such as: no. of electric vehicles (EV) and low-carbon emission vehicles deployed in the area and availability rate of e-buses, Vehicle-To-Grid (V2G) parking places, no. of EV charging stations and solar powered V2G charging stations deployed in the area.
- Mobility performance KPIs aimed at monitoring and assessing the effectiveness of the mobility model during the year and also aimed at identifying potential problems and corrective actions: percentage of time that the solar roads are functioning properly to produce electricity, share of V2G to the total energy system performance, no. of biogas and EV recharges per year and sessions, annual energy delivered by EV charging points, no. of e-vehicles that operate in the platform and in the community car sharing concept and utilization, no. of annual passengers using the new vehicles and/or infrastructure, yearly km of shared vehicles.
- KPIs for sustainable resource management: municipal solid waste, recycling rate of solid waste, percentage of the wastewater receiving treatment, sewage systems management, thermal energy provided by the heating recovery systems, use of waste heat.
- Number of households involved in food production ÷ total no. of households;
- Number of community functional food production projects ÷ no. of community functional food production projects in all neighborhoods.
- Number of urban food gardens;
- Synergy with local farmers (percentage of people involved in the local food cooperative);
- Number, variety and size of local food cooperatives;
- Initiatives to prevent commercial food chains in the neighborhood.
- Innovative concepts to reduce resources depletion (biogas from compost, vacuum toilets, per capita material recycling rate, etc.);
- Reduction in water consumption by managing black, grey and rainwater (per capita water consumption, rainwater capture rate);
- Initiatives to reduce solid waste (per capita rubbish production);
- Mandatory energy standards for the retrofit of wasteful buildings;
- Use of ecological building materials (percentage of neighborhood buildings built with natural materials);
- Percentage of energy-efficient buildings (characteristics: energy-positive, smartness, adequate ventilation and insulation, sustainable use of water, recycled materials, passive solar energy utilization, acoustic comfort).
- Rainwater collection;
- Improvement in waste collection;
- Smart garden irrigation system and vertical hydroponic garden.
- Affordability of housing (syn.ikia);
- Average price for buying an apartment per square meter (MAtchUP);
- Housing cost overburden rate: percentage of the population for which the cost of housing represents more than 40% of disposable income (MAtchUP, MAKING-CITY).
3.2. Environemntal Sustainability Actions and Findings
- The use of high-temperature industrial waste, from steel industries, in textile and printing industries with lower temperature heat demand and in buildings as a source of district heating and domestic hot water in a perspective of industrial symbiosis;
- The potential of transport electrification, in an energy scenario of high electrical penetration of RES, to decarbonize the sector and contribute to the electricity grid balance;
- The contribution to the circularity of the economy of the reuse of electric car batteries as Battery Energy Storage Systems (BESS) in buildings (although over time the performance becomes inadequate for transportation, it is still suitable for use in more stationary applications).
3.2.1. In-Depth Analysis of LCA Methods
- Development of detailed inventories of building materials.
- Simulation over a broad time horizon of the evolution of the building stock in relation to construction, renovation and demolition works. The analytical model, implemented in MATLAB, calculates the annual building stock as that of the previous year to the one considered plus any new constructions and less demolitions during the year.
- Data input in Python environment and calculation of material flows.
4. Discussion
- Socio-economic aspects, i.e., human health and well-being, citizens and stakeholder involvement and empowerment;
- Environmental co-impacts, i.e., green gentrification, creations of green jobs;
- Additional environmental sustainability actions, such as circular economy strategies and business models, also considering that the circular vision requires significant changes at the industrial and city level as the economic chain must rearrange itself on new production balances, while citizenship should shape its behavior in relation to the management of resources and waste.
- The evolution of the long-term impacts should be monitored through dynamic analyses, still little used;
- The expected effectiveness of the planned sustainability actions with respect to the achievement of the SDGs should be studied in detail;
- The boundaries of the system subject to the sustainability assessment (buildings, energy systems, infrastructures, food, mobility, public lighting, etc.) should be standardized in order to harmonize the approaches and make the results comparable.
4.1. Life Cycle Thinking Applications
- The need for greater transparency in the dissemination of LCA studies and for the definition of harmonization approaches for the application of the methodology in the complex field of sustainable urban districts. On the other hand, a modeling harmonization is required in order to standardize the system boundaries, the time period, the functional unit, the assumptions, the cut-off rules to be selected in the LCA study of a PED. This point is essential for LCA to be widely used in sustainable districts from an eco-design perspective, ensuring comparability between studies.
- A hot-spot that requires further research progress is the modeling of the end-of-life of the PED elements included in the analysis; in particular, of innovative technologies and infrastructures and systems for flexible control. Indeed, due to the lack of uncertainty of data, the results show that in most cases, the final phase of the life cycle is not studied.
- The need for reliability, achievable through a wider use of sensitivity and dominance analysis. These analyses allow the identification of significant impact factors, in accordance with the completeness, sensitivity and consistency checks to which the LCA study should be subjected and facilitate the choices of stakeholders in planning priority interventions.
- Although there are examples of LCA modeling under different scenarios of progress in the decarbonization of the economy and climate change, in most cases, the study is not iterated for different future scenarios, and the resulting uncertainty (variation in energy consumption for the air conditioning of buildings, variations in the carbon intensity of the regional and national energy mix that will also induce changes in the eco-profiles of industrial products) is not adequately addressed. In this context, there is also a need for modeling tools for these robust and reliable future predictions which should be integrated with the LCA. In addition, due to the long life of buildings and infrastructures, further uncertainty relates to the allocation of impacts over time, to technological progress, to the efficiency and modernization of industrial protocols and production chains which will certainly take place in the long-time horizon. Thus, approaches of dynamic LCA could lead to a greater reliability of the results and to the reduction in uncertainty related to the long-term developments of materials and technologies.
- Although there is growing interest in the LCA of the agri-food chain, the scientific literature including the study of local food production in green areas, within the sustainable urban district, is limited. Inter alia, at the district scale, the circularity actions in districts mainly concerned the electrification of mobility combined with the use of RES for the production of electricity, the use of second-life energy storage batteries and the industrial symbiosis for heat recovery. Food is one of the strategic sectors for the development of a circular pattern of production and consumption, as also underlined by the establishment of the “Circular Economy for Food” [206]. Despite this, only in a few cases and not in PEDs, the food chain is the object of research and experimentation of innovative circularity strategies. This is a research gap towards which future research should be oriented, since it would contribute to the achievement of the objectives set out in the SDG Agenda on the one hand and to the creation of a healthy, stimulating and mixed-use urban fabric on the other.
4.2. Key Performance Indicators
- In most of the LCA applications, only the “climate change” impact category is assessed. However, for a more complete assessment, it is recommended to include other impact categories related to other environmental issues (such as pollution, eutrophication, land use, ozone depletion, etc.) as well as categories that take into account the impact on human health in order to avoid moving impacts from one impact category to another or neglecting potentially significant impacts.
- With regards to circularity, specific indicators for quantifying the percentage of reuse of products and energy recovered from waste should be included in the whole KPI set. In this regard, some useful examples are as follows:
- Percentage of electrical and thermal energy produced from wastewater treatment (ISO 37122: 2019);
- Solid waste, other liquid waste treatment and other waste heat resources as a share of the energy mix per year (ISO 37122: 2019);
- Electrical and thermal energy produced from solid waste or other liquid waste treatment per capita per year (ISO 37122: 2019);
- Percentage of biosolids that are reused (dry matter mass) (ISO 37122: 2019);
- Energy derived from wastewater as a percentage of total energy consumption (ISO 37122: 2019);
- Reduction in water consumption through the management of black, gray and rain water (Medved [153]);
- Per capita waste production (Medved [153]);
- Percentage of biogas from compost and vacuum toilets (Medved [153]).
- Reduction in embodied energy of products and services used in the project (CITYkeys);
- Share of recycled input materials (CITYkeys);
- Share of renewable materials (CITYkeys),
- Share of materials recyclable (CITYkeys);
- Lifetime extension (CITYkeys);
- Material footprint (SDG Agenda);
- Domestic material consumption (SDG Agenda);
- Use of ecological building materials (Medved [153]);
- Percentage of buildings with passive energy measures and built with recycled materials (Medved [153]).
- The overall environmental framework could be further integrated to take into account other environmental aspects. In this context and as highlighted in the Sustainable Development Agenda, the environmental impact mitigation plan of urban districts should also include models of integration between the natural landscape and the built environment; protection of natural habitats and rare species of plants and animals; and, as discussed within CITYkeys, the conservation of cultural heritage. In addition, given the correlations with energy consumption in buildings, climate change, human health and productivity [207,208,209,210] and the growing interest in air quality monitoring [211], more attention should be paid to indoor and outdoor air quality in sustainable districts. In this regard, targeted ventilation measures, air quality control and specific KPIs, such as the no. of real-time remote air quality monitoring stations per square kilometer and percentage of public buildings equipped for monitoring indoor air quality (ISO 37122: 2019), could be helpful.
- An important environmental issue not sufficiently mentioned within the scientific literature and the revised EU pilot projects is that relating to the phenomenon of heat islands. As heat islands worsen urban environmental performance and also impact social well-being, recent research is focusing on urban cooling strategies based on appropriate material albedo coefficients and green infrastructure [16,212,213]. Along this line, the innovative design of urban settlements should take this issue into consideration and include tailor-made actions to stem it. In this context, the KPI: urban heat island-maximum difference in air temperature within the city compared to the countryside during the summer months (CITYkeys) and specific modeling tools could be useful.
- Finally, specific KPIs related to sustainable food should complement the overall set of indicators. Some examples are:
- Annual total collected municipal food waste sent to a processing facility for composting per capita (ISO 37122:2019);
- Global food loss index (SDG Agenda);
- Proportion of agricultural area under productive and sustainable agriculture (SDG Agenda);
- Local food production (CITYkeys);
- Self-sufficiency food (CITYkeys);
- Increase in the share of local food production due to the project (CITYkeys).
5. Conclusions and Future Outlooks
- The harmonization of assessment methodologies in the peds with reference to modeling assumptions and methodological choices in order to guarantee comparable results;
- The development of dynamic environmental analyses taking into account long-term uncertainties and energy flexible control;
- The enrichment of the existing PED framework including SDG-based indicators, integrated KPIs referring to also economics and social sustainability and integrated evaluation approaches;
- The analysis of the expected effectiveness of the planned sustainability actions with respect to the achievement of the SDGs;
- The analysis of sustainability of peds in the early design stage through an extensive use of trade-off analysis between design scenarios.
Author Contributions
Funding
Institutional Review Board Statement
Informed Consent Statement
Data Availability Statement
Acknowledgments
Conflicts of Interest
Abbreviations
| BESS | Battery Energy Storage Systems |
| DHW | Domestic Hot Water |
| DSM | Demand-Side Management |
| CBA | Cost Benefit Analysis |
| CHP | Combined Heat and Power |
| EU | European Union |
| EU H2020 | European Union Horizon 2020 |
| EV | Electric Vehicles |
| G2V | Grid-to-Vehicle |
| ICT | Information and Vommunications Technology |
| IEA | International Energy Agency |
| JPI | Joint Programming Initiative |
| KPI | Key Performance Indicator |
| GHG | Greenhouse Gas |
| LCA | Life Cycle Assessment |
| LCC | Life Cycle Costing |
| MCA | Multi-Criteria Analysis |
| MCDA | Multi-Criteria Decision Analysis |
| MFA | Material Flow Analysis |
| MPC | Model Predictive Control |
| NZED | Net Zero Energy District |
| PCM | Phase Change Materials |
| PED | Positive Energy District |
| PEB | Positive Energy Building |
| PEN | Positive Energy Neighbourhood |
| PV | Photovoltaic System |
| RBC | Rule-Based Control |
| RCP | Representative Concentration Pathways |
| REC | Renewable Energy Community |
| RES | Renewable Energy Sources |
| SDG | Sustainable Development Goal |
| SET | Strategic Energy Technology |
| SD | Sustainable District |
| SH | Space Heating |
| S-LCA | Social-Life Cycle Assessment |
| SPEN | Sustainable Plus Energy Neighborhood |
| TES | Thermal Energy Storage |
| UM | Urban Metabolism |
| UN | United Nations |
| V2G | Vehicle-to-Grid |
| ZEB | Net Zero Energy Building |
| ZEN | Zero Emission Neighborhood |
| Indices | |
| nren | Non-Renewable Primary Energy |
References
- United Nations. The Sustainable Development Goals Report 2020; United Nations Publications: New York, NY, USA, 2020. [Google Scholar]
- United Nations. Work of the Statistical Commission Pertaining to the 2030 Agenda for Sustainable Development (A/RES/71/313); United Nations Publications: New York, NY, USA, 2017. [Google Scholar]
- EPIC. Climate Change 2014: Synthesis Report. Contribution of Working Groups I, II and III to the Fifth Assessment Report of the Intergovernmental Panel on Climate Change. Available online: https://epic.awi.de/id/eprint/37530/ (accessed on 9 December 2019).
- Adoption of the Paris Agreement. Proposal by the President; United Nations: Geneva, Switzerland, 2015.
- Roy, J.; Tschakert, P.; Waisman, H.; Halim, S.A.; Antwi-Agyei, P.; Dasgupta, P.; Hayward, B.; Kanninen, M.; Liverman, D.; Okereke, C.; et al. Sustainable Development, Poverty Eradication and Reducing Inequalities. In Global Warming of 1.5 °C; IPCC: Geneva, Switzerland, 2018; pp. 445–538. Available online: https://www.ipcc.ch/site/assets/uploads/sites/2/2018/11/SR15_Chapter5_Low_Res-1.pdf (accessed on 9 December 2019).
- European Commission. A European Green Deal. Available online: https://ec.europa.eu/info/strategy/priorities-2019-2024/european-green-deal_it (accessed on 28 February 2021).
- Directive (EU) 2018/844 of the European Parliament and of the Council of 30 May 2018 Amending Directive 2010/31/EU on the Energy Performance of Buildings and Directive 2012/27/EU on Energy Efficiency. 2018. Available online: https://eur-lex.europa.eu/legal-content/EN/TXT/?uri=uriserv%3AOJ.L_.2018.156.01.0075.01.ENG (accessed on 20 March 2021).
- Gobin, C. Eco-Conception—Marqueur d’un Reengineering de la Construction: Nouveau Cahier des Charges | Techniques de l’Ingénieur. Available online: https://www.techniques-ingenieur.fr/base-documentaire/construction-et-travaux-publics-th3/l-environnement-societal-de-la-construction-42236210/eco-conception-c3020/nouveau-cahier-des-charges-c3020niv10001.html (accessed on 4 January 2021).
- Peuportier, B.; Thiers, S.; Guiavarch, A. Eco-design of buildings using thermal simulation and life cycle assessment. J. Clean. Prod. 2013, 39, 73–78. [Google Scholar] [CrossRef] [Green Version]
- Kirchherr, J.; Reike, D.; Hekkert, M. Conceptualizing the circular economy: An analysis of 114 definitions. Resour. Conserv. Recycl. 2017, 127, 221–232. [Google Scholar] [CrossRef]
- World Demographics Profile. 2019. Available online: https://www.indexmundi.com/world/demographics_profile.html (accessed on 9 December 2019).
- International Energy Agency, United Nations-Environment Programme. 2019 Global Status Report for Buildings and Construction: Towards a Zero-Emission, Efficient and Resilient Buildings and Construction Sector. 2019. Available online: https://webstore.iea.org/download/direct/2930?filename=2019_global_status_report_for_buildings_and_construction.pdf (accessed on 20 March 2021).
- Emissions Gap Report 2019; UN Environment Programme: Nairobi, Kenia, 2019.
- International Energy Agency. GlobalABC Roadmap for Buildings and Construction; UN Environment Programme: Nairobi, Kenia, 2020. [Google Scholar]
- Cellura, M.; Guarino, F.; Longo, S.; Tumminia, G. Climate change and the building sector: Modelling and energy implications to an office building in southern Europe. Energy Sustain. Dev. 2018, 45, 46–65. [Google Scholar] [CrossRef]
- Gonzalez-Trevizo, M.; Martinez-Torres, K.; Armendariz-Lopez, J.; Santamouris, M.; Bojorquez-Morales, G.; Luna-Leon, A. Research trends on environmental, energy and vulnerability impacts of Urban Heat Islands: An overview. Energy Build. 2021, 246, 111051. [Google Scholar] [CrossRef]
- International Energy Agency. The Critical Role of Buildings. Perspectives for the Clean Energy Transition; International Energy Agency: Paris, France, 2019. [Google Scholar]
- International Energy Agency. World Energy Outlook 2019. OECD. 2019. Available online: https://www.iea.org/reports/world-energy-outlook-2019 (accessed on 20 March 2021).
- Global Energy & CO2 Status Report 2018—Analysis—IEA. 2018. Available online: https://www.iea.org/reports/global-energy-co2-status-report-2018 (accessed on 9 December 2019).
- European Comission. Strategic Energy Technology Plan. Energy. Available online: https://ec.europa.eu/energy/topics/technology-and-innovation/strategic-energy-technology-plan_en (accessed on 17 March 2021).
- European Union. SET-Plan Working Group, SET-Plan Action No 3.2 Implementation Plan-Europe to Become a Global Role Model in Integrated, Innovative Solutions for the Planning, Deployment, and Replication of Positive Energy Districts. 2018. Available online: https://setis.ec.europa.eu/system/files/setplan_smartcities_implementationplan.pdf (accessed on 20 March 2021).
- Ala-Juusela, M.; Crosbie, T.; Hukkalainen, M. Defining and operationalising the concept of an energy positive neighbourhood. Energy Convers. Manag. 2016, 125, 133–140. [Google Scholar] [CrossRef] [Green Version]
- Hachem, C. Impact of neighborhood design on energy performance and GHG emissions. Appl. Energy 2016, 177, 422–434. [Google Scholar] [CrossRef]
- Shnapp, S.; Paci, D.; Bertoldi, P. Enabling Positive Energy Districts across Europe: Energy Efficiency Couples Renewable Energy; EUR 30325 EN; Publications Office of the European Union: Luxembourg, 2020. [Google Scholar]
- European Union. Directive (EU) 2019/944 of the European Parliament and of the Council of 5 June 2019 on Common Rules for the Internal Market for Electricity and Amending Directive 2012/27/EU (Recast). 2019. Available online: https://eur-lex.europa.eu/legal-content/EN/TXT/PDF/?uri=CELEX:32019L0944 (accessed on 20 March 2021).
- European Union. Directive (EU) 2018/2001 of the European Parliament and of the Council of 11 December 2018 on the Promotion of the Use of Energy from Renewable Sources (Recast). 2018. Available online: https://eur-lex.europa.eu/legal-content/EN/TXT/?uri=uriserv:OJ.L_.2018.328.01.0082.01.ENG (accessed on 20 March 2021).
- Hedman, A.; Rehman, H.; Gabaldón, A.; Bisello, A.; Albert-Seifried, V.; Zhang, X.; Guarino, F.; Grynning, S.; Eicker, U.; Neumann, H.-M.; et al. IEA EBC Annex83 Positive Energy Districts. Buildings 2021, 11, 130. [Google Scholar] [CrossRef]
- Hearn, A.X.; Sohre, A.; Burger, P. Innovative but unjust? Analysing the opportunities and justice issues within positive energy districts in Europe. Energy Res. Soc. Sci. 2021, 78, 102127. [Google Scholar] [CrossRef]
- Shen, L.; Huang, Z.; Wong, I.S.; Liao, S.; Lou, Y. A holistic evaluation of smart city performance in the context of China. J. Clean. Prod. 2018, 200, 667–679. [Google Scholar] [CrossRef]
- Salom, J.; Tamm, M. WP3 Technology Integration in Smart Managed Plus Energy Buildings and Neighbourhoods. D3.1 Methodology Framework for Plus Energy Buildings and Neighbourhoods. 2020. Available online: https://www.synikia.eu/wp-content/uploads/2020/12/D3.1_Methodology-framework-for-Plus-Energy-Buildings-and-Neighbourhoods.pdf (accessed on 20 April 2021).
- Marszal, A.J.; Heiselberg, P.; Bourrelle, J.S.; Musall, E.; Voss, K.; Sartori, I.; Napolitano, A. Zero Energy Building—A review of definitions and calculation methodologies. Energy Build. 2011, 43, 971–979. [Google Scholar] [CrossRef]
- Monti, A.; Pesch, D.; Ellis, K.A.; Mancarella, P. Energy Positive Neighborhoods and Smart Energy Districts: Methods, Tools, and Experiences from the Field; Elsevier: Amsterdam, The Netherlands, 2016. [Google Scholar]
- Marique, A.-F.; Reiter, S. A simplified framework to assess the feasibility of zero-energy at the neighbourhood/community scale. Energy Build. 2014, 82, 114–122. [Google Scholar] [CrossRef] [Green Version]
- Pesch, D.; Ellis, K.; Kouramas, K.; Assef, Y. COOPERATE. Deliverable D1.1: Report on Requirements and Use Cases Specification. 2013. Available online: http://www.ectp.org/fileadmin/user_upload/documents/E2B/COOPERaTE/COOPERATE_D11.pdf (accessed on 11 February 2021).
- Thiers, S.; Peuportier, B. Energy and environmental assessment of two high energy performance residential buildings. Build. Environ. 2012, 51, 276–284. [Google Scholar] [CrossRef]
- Cellura, M.; Guarino, F.; Longo, S.; Mistretta, M. Energy life-cycle approach in Net zero energy buildings balance: Operation and embodied energy of an Italian case study. Energy Build. 2014, 72, 371–381. [Google Scholar] [CrossRef]
- Urban Europe (UE). White Paper on PED Reference Framework for Positive Energy Districts and Neighbourhoods. 2020. Available online: https://jpi-urbaneurope.eu/ped/ (accessed on 30 August 2021).
- Urban Europe. Positive Energy Districts (PED). 2020. Available online: https://jpi-urbaneurope.eu/ped/ (accessed on 11 November 2021).
- Moreno, A.G.; Vélez, F.; Alpagut, B.; Hernández, P.; Montalvillo, C.S. How to Achieve Positive Energy Districts for Sustainable Cities: A Proposed Calculation Methodology. Sustainability 2021, 13, 710. [Google Scholar] [CrossRef]
- EU Project Making-City. Homepage—Making City, Energy Efficient Pathway for the City Transformation. Available online: https://makingcity.eu/ (accessed on 23 July 2021).
- Wyckmans, A.; Karatzoudi, K.; Brigg, D. +CityxChange. D9.5: Report on Attendance at Events Held by Other SCC-01 Co-Ordinators 2. 2018. Available online: https://cityxchange.eu/wp-content/uploads/2019/11/D9.5_Report-on-Attendance-at-events-held-by-other-SCC-01-co-ordinators2.pdf (accessed on 11 February 2021).
- Lindholm, O.; Rehman, H.U.; Reda, F. Positioning Positive Energy Districts in European Cities. Buildings 2021, 11, 19. [Google Scholar] [CrossRef]
- SBC (Sustainable Buildings and Cities). Available online: https://sustainable-buildings-and-cities.netlify.app/ (accessed on 21 October 2021).
- Moher, D.; Liberati, A.; Tetzlaff, J.; Altman, D.G.; The PRISMA Group. Preferred reporting items for systematic reviews and meta-analyses: The PRISMA statement. Int. J. Surg. 2010, 8, 336–341. [Google Scholar] [CrossRef] [Green Version]
- Brozovsky, J.; Gustavsen, A.; Gaitani, N. Zero emission neighbourhoods and positive energy districts—A state-of-the-art review. Sustain. Cities Soc. 2021, 72, 103013. [Google Scholar] [CrossRef]
- Derkenbaeva, E.; Heinz, H.; Lopez, D.; Maria, L.; Mihailova, D.; Galanakis, K.; Stathopoulou, E. Smart-BEEjS: Business Models and Consumers’ Value Proposition for PEDs. 2020. Available online: http://irep.ntu.ac.uk/id/eprint/41990/1/1397856_Galanakis.pdf (accessed on 11 February 2021).
- EU Project mySMARTLife. Homepage—mySMARTLife. Available online: https://www.mysmartlife.eu/mysmartlife/ (accessed on 23 July 2021).
- WP 5 Task 5.1, MySMARTLife. D5.1 Integrated Evaluation Procedure. 2019. Available online: www.mysmartlife.eu (accessed on 10 May 2021).
- WP6 Task 6.3, MySMARTLife. D6.12 Social Acceptance Campaign at Local and District Level. 2020. Available online: www.mysmartlife.eu (accessed on 23 May 2021).
- EU Project syn.ikia. Homepage—syn.ikia. Available online: https://www.synikia.eu/ (accessed on 23 July 2021).
- Salom, J.; Tamm, M.; Andresen, I.; Cali, D.; Magyari, A.; Bukovszki, V.; Balázs, R.; Dorizas, P.; Toth, Z.; Mafé, C.; et al. An Evaluation Framework for Sustainable Plus Energy Neighbourhoods: Moving Beyond the Traditional Building Energy Assessment. Energies 2021, 14, 4314. [Google Scholar] [CrossRef]
- EU Project ATELIER, Homepage—ATELIER, Positive Energy Districts. Available online: https://smartcity-atelier.eu/ (accessed on 23 July 2021).
- CPH 2025 Climate Plan Roadmap 2021–2025; The Climate Secretariat Technical and Environmental Administration: Copenhagen, Denmark, 2021.
- Olivadese, R.; Alpagut, B.; Revilla, B.P.; Brouwer, J.; Georgiadou, V.; Woestenburg, A.; van Wees, M. Towards Energy Citizenship for a Just and Inclusive Transition: Lessons Learned on Collaborative Approach of Positive Energy Districts from the EU Horizon2020 Smart Cities and Communities Projects. Proceedings 2021, 65, 20. [Google Scholar] [CrossRef]
- WP9 Task 9.1 Atelier Monitoring and Evaluation Framework. Deliverable 9.1: Repository of Definitions of Terms, Key Characteristics Archetypes, and a Set of KPIs. 2020. Available online: https://smartcity-atelier.eu/app/uploads/ATELIER_D9.1-Repository-of-definitions-of-terms._DRAFT.pdf (accessed on 23 July 2021).
- EU Project SmartEnCity. Homepage—SmartEnCity. Available online: http://smartencitynetwork.eu/ (accessed on 23 July 2021).
- EU Project MatchUp. Homepage—MatchUp. Available online: https://www.matchup-project.eu/ (accessed on 23 July 2021).
- Branchini, B.; Folco, G.; Aapo, H.; Kuusisto, J.; Arnhold, L.; Erdem, A. MAtchUP. WP 5, T 5.3 D5.3: Social Evaluation Framework. 2020. Available online: https://www.matchup-project.eu/wp-content/uploads/2020/11/D5.3-Social-evaluation-framework_FINAL.pdf (accessed on 23 July 2021).
- Branchini, B.; Azorín, F.; Vallina, B.; Meneghello, V.; Perales, J. MAtchUP. WP 2, T 2.7.2 D2.27: New Citizens’ Engagement Strategies in Valencia. 2020. Available online: https://www.matchup-project.eu/wp-content/uploads/2021/10/MAtchUP_D2.27-New-citizens-engagement-strategies_Final.pdf (accessed on 23 July 2021).
- Branchini, B.; Azorín, F.; Vallina, B.; González, I.; Matamoros, A.; Meneghello, V.; Fuentes, J.; Perales, J. MAtchUP. WP 2, T 2.7.2 D2.26: New citizens’ Engagement Strategies in Valencia. 2020. Available online: https://www.matchup-project.eu/wp-content/uploads/2020/11/MAtchUP_D2.26-New-citizens-engagement-strategies-in-Valencia_2nd_final.pdf (accessed on 23 July 2021).
- Meneghello, V.; Schmid, E. MAtchUP. WP 4, T 4.7.2 D4.12: New Citizens’ Engagement Strategies in Antalya. 2020. Available online: https://www.matchup-project.eu/wp-content/uploads/2019/03/D4.12-New-citizens-engagement-strategies_2018_09_30_FINAL.pdf (accessed on 23 July 2021).
- Anz, M.; Wolter, S.; Arnhold, L.; Stelzlè, B. MAtchUP. WP 3, Task 3.7.2 Deliverable 3.12: New Citizens’ Engagement Strategies in Dresden. 2020. Available online: https://www.matchup-project.eu/wp-content/uploads/2019/03/D3.12-Dresden_new_citizen_engagement_strategies_FINAL.pdf (accessed on 23 July 2021).
- Mabe, L.; Vallejo, E.; Hernández, P.; Quijano, A.; De Torre, C. MatchUP. D1.1: Indicators Tools and Methods for Advanced City Modelling and Diagnosis. 2018. Available online: https://www.matchup-project.eu/wp-content/uploads/2019/03/D1.1.-Indicators-tools-and-methods-for-advanced-city-modelling-and-diagnosis_Final.pdf (accessed on 23 July 2021).
- Regeneration Model for Accelerating the Smart URBAN Transformation. Available online: http://www.remourban.eu/ (accessed on 7 April 2020).
- Antolín, J.; De Torre, C.; García, M.Á.; Gómez, J.; Martín, J.; Cubuillo, J.; Criado, C.; Irigoyen, A.; Cui, M.; Angus, P.; et al. REMO URBAN. WP4, Task 4.9 D4.14: Report of the Specific Evaluation Procedures Deployment. Analysis of Performance. 2020. Available online: http://www.remourban.eu/technical-insights/deliverables/urban-regeneration-model.kl (accessed on 7 April 2020).
- Vallejo, E.; Massa, G.; Ángel García, M.; de Torre, C.; Aksu, M.; Yenilmez, B.; Luisa Mirantes, M.; Tomé, I.; Pérez, A.; Bonilla, J.; et al. REMO URBAN. WP1, Task 1.5 D1.19: Urban Regeneration Model. 2017. Available online: http://www.remourban.eu/technical-insights/deliverables/urban-regeneration-model.kl (accessed on 7 April 2020).
- Stacey, A.; Sawyer, J.; Aksu, M.; Yenilmez, B.; Santamaria, E.H.; Demir, E.; Kuban, B.; Degard, C.; Nagy, I. REMO URBAN. WP1, Task 1.2 D1.15: Methodological Guide on the Development of Urban Integrated Plans. 2016. Available online: http://www.remourban.eu/technical-insights/deliverables/urban-regeneration-model.kl (accessed on 7 April 2020).
- Folco, G.; Bardellini, M.; Schmid, E. REMO URBAN. WP4, Sub-task 4.9.4 D4.17: Report of Social Acceptance Evaluation. 2019. Available online: http://www.remourban.eu/technical-insights/deliverables/urban-regeneration-model.kl (accessed on 7 April 2020).
- Antolín, J.; De Torre, C.; Harvey, O.; Aksu, M.; Demir, E.; Mirantes, M.L.; Hoyos, E.; Rivada, A.; López, F.; Rivas, P.; et al. REMO URBAN. WP2, Task 2.3 D2.7: Evaluation of Sustainability and Smartness in Demo Cities. 2020. Available online: http://www.remourban.eu/technical-insights/deliverables/urban-regeneration-model.kl (accessed on 7 April 2020).
- De Torre, C.; Antolín, J.; García-Fuentes, M.Á.; Gómez-Tribiño, J.; Cubillo, J.; Mirantes, M.L.; Tome, I. REMOURBAN: Evaluation Results After the Implementation of Actions for Improving the Energy Efficiency in a District in Valladolid (Spain). In Communications in Computer and Information Science; Springer: Cham, Switzerland, 2021; pp. 30–41. [Google Scholar]
- Antolín, J.; De Torre, C.; García-Fuentes, M.; Pérez, A.; Tomé, I.; Mirantes, M.L.; Hoyos, E. Development of an Evaluation Framework for Smartness and Sustainability in Cities. Sustainability 2020, 12, 5193. [Google Scholar] [CrossRef]
- Quijano, A.; Vicente, J.; Paya, G.; Azcona, G.U.; Hernández, P.; Albaina, A.; Tamm, J.; Kikas, M.; Kamenjuk, P.; Sørensen, S.S.; et al. smartENCity. WP7, Task 7.1 Deliverable 7.4: City Impact Evaluation Procedure. 2017. Available online: https://smartencity.eu/media/smartencity_d7.4_city_impact_procedure_v1.0_1.pdf (accessed on 20 April 2020).
- Gallego, M.A.; Vicente, J.; Grisaleña, D.; Albaina, A.; Tamm, J.; Nielsen, I.; Saez de Viteri, P. smartENCity. WP7, Task 7.2 Deliverable 7.7: Mobility Action Monitoring Program. 2018. Available online: https://smartencity.eu/media/del7.7.pdf (accessed on 20 April 2020).
- Barrenetxea, E.; Gorritxategi, X.; Iturbe, E.; Kamenjuk, P.; Ahas, R.; Rathje, P.; Bielefeldt, H.; Hernández, P.; Eelma, T.; Cepeda, M.; et al. smartENCity. WP2, Task 2.1 Deliverable 2.6 Citizen Engagement Strategy and Deployment Plan. 2016. Available online: https://ec.europa.eu/research/participants/documents/downloadPublic?documentIds=080166e5afe918ad&appId=PPGMS (accessed on 20 April 2020).
- Quijano, A.; Vasallo, A.; Gallego, M.; Moral, A.; Egusquiza, A. smartENCity. WP7, Task 7.1 Deliverable 7.2: KPIs Definition. 2016. Available online: https://ec.europa.eu/research/participants/documents/downloadPublic?documentIds=080166e5abaaa070&appId=PPGMS (accessed on 20 April 2020).
- Hernández, L.J.; Vicente, J.; Hernández, P.; Larrinaga, F.; Nielsen, I.; Kikas, M. Saareoks, smartENCity. WP7, Task 7.2 Deliverable 7.6: District Retrofitting Monitoring Program. 2017. Available online: https://smartencity.eu/media/smartencity_d7.6_district_retrofitting_monitoring_program_v1.0.pdf (accessed on 20 April 2020).
- EU Project SPARCS. Homepage—Sparcs. Available online: https://www.sparcs.info/ (accessed on 23 July 2021).
- Cerna, V. D8.4 Interaction Plan with Stakeholders, EIP SCC, SCIS, H2020, EERA. 2019. Available online: https://www.sparcs.info/sites/default/files/2020-03/SPARCS_D8.4_Interaction_plan_with_stakeholders.pdf (accessed on 23 July 2021).
- VTT; ESP; LPZ; SUITE5; SPI; NEW; FHG; VERD. D1.8 Strategy for Developing Interoperability and Ecosystems for Positive Energy Districts. 2021. Available online: https://www.sparcs.info/sites/default/files/2021-03/SPARCS_D1.8.pdf (accessed on 23 July 2021).
- Giordano, A.; Cassisi, A.; Bolzicco, M. D7.1. Business Models and Financing Mechanisms for Wide Uptake of Smart City solutions. Available online: https://www.sparcs.info/about/deliverables/d701-business-models-and-financing-mechanisms-wide-uptake-smart-city-solutions (accessed on 23 July 2021).
- Ntafalias, A.; Papadopoulos, P.; Tsakanikas, S.; Menyktas, K.; Kentzoglanakis, K.; Kyriakopoulos, G.; Courouclis, I.; Papadopoulos, G.; Kousouris, S.; Tsitsanis, A. D2.1 Definition of SPARCS Holistic Impact Assessment Methodology and Key Performance Indicators. Available online: https://www.sparcs.info/about/deliverables/d201-definition-sparcs-holistic-impact-assessment-methodology-and-key (accessed on 23 July 2021).
- Sparcs. About. Available online: https://www.sparcs.info/ (accessed on 26 April 2021).
- EU Project REPLICATE, Homepage—Renaissance of Places with Innovative Citizenship and Technology. Available online: https://replicate-project.eu/ (accessed on 23 July 2021).
- Timeus, K.; Vinaixa, J.; Pardo-Bosch, F. Creating business models for smart cities: A practical framework. Public Manag. Rev. 2020, 22, 726–745. [Google Scholar] [CrossRef] [Green Version]
- R. PROJECT, REPLICATE. D10.1 Report on Indicators for Monitoring at Project Level. 2017. Available online: https://www.researchgate.net/profile/Krista_Timeus/publication/318233609_Smart_and_sustainable_New_business_models_for_smart_city_services/links/595e3f210f7e9b8194b71144/Smart-and-sustainable-New-business-models-for-smart-city-services.pdf (accessed on 23 July 2021).
- EU Project +CityxChange, Homepage—+CityxChange. Available online: https://cityxchange.eu/ (accessed on 23 July 2021).
- Bertelsen, S.; Livik, K.; Myrstad, M. +CityxChange. D2.1 Report on Enabling Regulatory Mechanism to Trial Innovation in Cities. 2019. Available online: https://cityxchange.eu/knowledge-base/report-on-enabling-regulatory-mechanism-to-trial-innovation-in-cities/ (accessed on 23 July 2021).
- Ahlers, D.; Driscoll, P.; Wibe, H.; Wyckmans, A. Co-Creation of Positive Energy Blocks. IOP Conf. Ser. Earth Environ. Sci. 2019, 352, 012060. [Google Scholar] [CrossRef]
- EU Project POCITYF, Homepage—POCITYF. Available online: https://pocityf.eu/ (accessed on 23 July 2021).
- Angelakoglou, K.; Kourtzanidis, K.; Giourka, P.; Apostolopoulos, V.; Nikolopoulos, N.; Kantorovitch, J. From a Comprehensive Pool to a Project-Specific List of Key Performance Indicators for Monitoring the Positive Energy Transition of Smart Cities—An Experience-Based Approach. Smart Cities 2020, 3, 36. [Google Scholar] [CrossRef]
- Kourtzanidis, K.; Angelakoglou, K.; Giourka, P.; Tsarchopoulos, P.; Nikolopoulos, N.; Kantorovich, J. POCITYF. D2.1 EET-centric KPIs Definition, with All Evaluation Metrics and Formulas Derived. 2020. Available online: https://pocityf.eu/wp-content/uploads/2020/09/POCITYF-864400_D2.1_EET-centric-KPIs-definition-with-all-evaluation-metrics-and-formulas-derived_compressed.pdf (accessed on 3 May 2021).
- Rönty, J.; Känsälä, K.; Rinne, S.; Tonen, J.; Sanz-Montalvillo, C.; de Torre, C.; Rodríguez, C.; Nauta, J.; Dourlens-Quaranta, S. MAKING-CITY G.A. D5.1-City Level Indicators. 2019. Available online: www.makingcity.eu/ (accessed on 3 May 2021).
- EU Project COOPERATE, Homepage—Control and Optimisation for Energy Positive Neighbourhoods (COOPERATE). Available online: https://cordis.europa.eu/project/id/600063 (accessed on 23 July 2021).
- Good, N.; Ceseña, E.A.M.; Mancarella, P.; Monti, A.; Pesch, D.; Ellis, K.A. Barriers, Challenges, and Recommendations Related to Development of Energy Positive Neighborhoods and Smart Energy Districts. In Energy Positive Neighborhoods and Smart Energy Districts; Elsevier: Amsterdam, The Netherlands, 2017; pp. 251–274. [Google Scholar] [CrossRef]
- Goergen, M.; Al-Hawamdeh, A.; Chiu, I.; Mallin, C.; Mitleton-Kelly, E. Corporate Governance and Complexity Theory; Edward Elgar Publishing Ltd.: Cheltenham, UK, 2010; ISBN 9781849801041. [Google Scholar]
- Pérez, M.G.R.; Rey, E. A multi-criteria approach to compare urban renewal scenarios for an existing neighborhood. Case study in Lausanne (Switzerland). Build. Environ. 2013, 65, 58–70. [Google Scholar] [CrossRef]
- Burton, E.; Jenks, M.; Williams, K. Achieving Sustainable Urban Form; Routledge: London, UK, 2013; ISBN 0-419-24450-6-. [Google Scholar]
- Urban Patterns for a Green Economy: Optimizing Infrastructure; United Nations Human Settlements Programme: Nairobi, Kenia, 2012; ISBN 978-92-1-132461-7.
- Moroke, T.; Schoeman, C.; Schoeman, I. Developing a neighbourhood sustainability assessment model: An approach to sustainable urban development. Sustain. Cities Soc. 2019, 48. [Google Scholar] [CrossRef]
- Bambara, J.; Athienitis, A.K.; Eicker, U. Residential Densification for Positive Energy Districts. Front. Sustain. Cities 2021, 3, 630973. [Google Scholar] [CrossRef]
- Bottero, M. A multi-methodological approach for assessing sustainability of urban projects. Manag. Environ. Qual. Int. J. 2015, 26, 138–154. [Google Scholar] [CrossRef]
- FEDORCZAK-CISAK, M.; Kotowicz, A.; Radziszewska-Zielina, E.; Sroka, B.; Tatara, T.; Barnaś, K. Multi-Criteria Optimisation of an Experimental Complex of Single-Family Nearly Zero-Energy Buildings. Energies 2020, 13, 1541. [Google Scholar] [CrossRef] [Green Version]
- Velasquez, M.; Hester, P.T. An Analysis of Multi-Criteria Decision Making Methods. Int. J. Oper. Res. 2013, 10, 56–66. [Google Scholar]
- Becchio, C.; Bottero, M.C.; Corgnati, S.P.; Dell’Anna, F. Decision making for sustainable urban energy planning: An integrated evaluation framework of alternative solutions for a NZED (Net Zero-Energy District) in Turin. Land Use Policy 2018, 78, 803–817. [Google Scholar] [CrossRef]
- Bisello, A. Assessing Multiple Benefits of Housing Regeneration and Smart City Development: The European Project SINFONIA. Sustainability 2020, 12, 8038. [Google Scholar] [CrossRef]
- Lode, M.; Boveldt, G.T.; Macharis, C.; Coosemans, T. Application of Multi-Actor Multi-Criteria Analysis for Transition Management in Energy Communities. Sustainability 2021, 13, 1783. [Google Scholar] [CrossRef]
- Cerreta, M.; Di Girasole, E.G.; Poli, G.; Regalbuto, S. Operationalizing the Circular City Model for Naples’ City-Port: A Hybrid Development Strategy. Sustainability 2020, 12, 2927. [Google Scholar] [CrossRef]
- Lombardi, P.; Abastante, F.; Toniolo, J.; Moghadam, S.T. Multicriteria Spatial Decision Support Systems for Future Urban Energy Retrofitting Scenarios. Sustainability 2017, 9, 1252. [Google Scholar] [CrossRef] [Green Version]
- Pearce, D.W. Cost-Benefit Analysis. 2016. Available online: https://books.google.it/books?hl=en&lr=&id=BkFdDwAAQBAJ&oi=fnd&pg=PP9&dq=cost+benefit+analysis&ots=0KxPILPsAD&sig=Qf-tbrGcKKpH7m7_2bLslOovV24&redir_esc=y#v=onepage&q=costbenefitanalysis&f=false (accessed on 10 April 2021).
- Mishan, E.J.; Quah, E. Cost-Benefit Analysis. 2020. Available online: https://books.google.it/books?hl=en&lr=&id=IGoPEAAAQBAJ&oi=fnd&pg=PP1&dq=cost+benefit+analysis&ots=Quf5SQvcz0&sig=rtyPKwDDOe60obKwL4Ziy3htr3o&redir_esc=y#v=onepage&q=costbenefitanalysis&f=false (accessed on 10 April 2021).
- European Commission. Guide to Cost-Benefit Analysis of Investment Projects; European Union: Luxembourg, 2015. [Google Scholar]
- Gabay, H.; Meir, I.A.; Schwartz, M.; Werzberger, E. Cost-benefit analysis of green buildings: An Israeli office buildings case study. Energy Build. 2014, 76, 558–564. [Google Scholar] [CrossRef]
- Liu, Y.; Liu, T.; Ye, S.; Liu, Y. Cost-benefit analysis for Energy Efficiency Retrofit of existing buildings: A case study in China. J. Clean. Prod. 2017, 177, 493–506. [Google Scholar] [CrossRef]
- Becchio, C.; Bottero, M.C.; Corgnati, S.P.; Anna, F.D.; Pederiva, G.; Vergerio, G. Proposal for an Integrated Approach to Support Urban Sustainability: The COSIMA Method Applied to Eco-Districts. In Green Energy and Technology; Springer International Publishing: Cham, Switzerland, 2021; pp. 37–47. [Google Scholar] [CrossRef]
- UNEP–SETAC. Life Cycle Initiative. What is Life Cycle Thinking? 2017. Available online: https://www.lifecycleinitiative.org/starting-life-cycle-thinking/what-is-life-cycle-thinking/ (accessed on 17 February 2021).
- Korpi, E.; Ala-Risku, T. Life cycle costing: A review of published case studies. Manag. Audit. J. 2008, 23, 240–261. [Google Scholar] [CrossRef] [Green Version]
- ISO. ISO 15686-5:2017. Buildings and Constructed Assets—Service Life Planning—Part 5: Life-Cycle Costing. 2017. Available online: https://www.iso.org/standard/61148.html (accessed on 17 February 2021).
- UNEP-SETAC. Life Cycle Initiative. Guidelines for Social Life Cycle Assessment of Products. 2009. Available online: http://www.unep.fr/shared/publications/pdf/dtix1164xpa-guidelines_slca.pdf (accessed on 23 February 2021).
- ISO 14040:2006. Environmental Management–Life Cycle Assessment—Principles and Framework; European Committee for Standardization: Brussels, Belgium, 2006.
- De Larriva, R.A.; Rodríguez, G.C.; López, J.M.C.; Raugei, M.; Fullana-I-Palmer, P. A decision-making LCA for energy refurbishment of buildings: Conditions of comfort. Energy Build. 2014, 70, 333–342. [Google Scholar] [CrossRef]
- Blengini, G.A.; Di Carlo, T. The changing role of life cycle phases, subsystems and materials in the LCA of low energy buildings. Energy Build. 2010, 42, 869–880. [Google Scholar] [CrossRef]
- Gustavsson, L.; Joelsson, A. Life cycle primary energy analysis of residential buildings. Energy Build. 2010, 42, 210–220. [Google Scholar] [CrossRef]
- Sabnis, G. Green Building with Concrete: Sustainable Design and Construction. 2015. Available online: https://books.google.com/books?hl=it&lr=&id=vOv5CQAAQBAJ&oi=fnd&pg=PP1&dq=%5B16%5D+Sabnis,+Gajanan+M.+Green+Building+with+Concrete:+Sustainable+Design+and+Construction,+2nd+ed.+Boca+Raton:+CRC+Press,+2015.&ots=L31ht8dGvu&sig=ia1fqon3gUh3ZhLsKL2U4KS7MJo (accessed on 5 January 2021).
- Wiik, M.K.; Fufa, S.M.; Kristjansdottir, T.; Andresen, I. Lessons learnt from embodied GHG emission calculations in zero emission buildings (ZEBs) from the Norwegian ZEB research centre. Energy Build. 2018, 165, 25–34. [Google Scholar] [CrossRef]
- Khasreen, M.M.; Banfill, P.F.G.; Menzies, G.F. Life-Cycle Assessment and the Environmental Impact of Buildings: A Review. Sustainability 2009, 1, 674–701. [Google Scholar] [CrossRef]
- Cabeza, L.F.; Rincón, L.; Vilariño, V.; Pérez, G.; Castell, A. Life cycle assessment (LCA) and life cycle energy analysis (LCEA) of buildings and the building sector: A review. Renew. Sustain. Energy Rev. 2014, 29, 394–416. [Google Scholar] [CrossRef]
- Lotteau, M.; Loubet, P.; Pousse, M.; Dufrasnes, E.; Sonnemann, G. Critical review of life cycle assessment (LCA) for the built environment at the neighborhood scale. Build. Environ. 2015, 93, 165–178. [Google Scholar] [CrossRef]
- Lausselet, C.; Ellingsen, L.A.; Strømman, A.H.; Brattebø, H. A life-cycle assessment model for zero emission neighborhoods. J. Ind. Ecol. 2020, 24, 500–516. [Google Scholar] [CrossRef]
- Olinzock, M.A.; Landis, A.E.; Saunders, C.L.; Collinge, W.O.; Jones, A.K.; Schaefer, L.A.; Bilec, M.M. Life cycle assessment use in the North American building community: Summary of findings from a 2011/2012 survey. Int. J. Life Cycle Assess. 2015, 20, 318–331. [Google Scholar] [CrossRef]
- Invidiata, A.; Lavagna, M.; Ghisi, E. Selecting design strategies using multi-criteria decision making to improve the sustainability of buildings. Build. Environ. 2018, 139, 58–68. [Google Scholar] [CrossRef]
- Pombo, O.; Allacker, K.; Rivela, B.; Neila, J. Sustainability assessment of energy saving measures: A multi-criteria approach for residential buildings retrofitting—A case study of the Spanish housing stock. Energy Build. 2016, 116, 384–394. [Google Scholar] [CrossRef] [Green Version]
- Boix, A.P.; Llorach-Massana, P.; Sanjuan-Delmás, D.; Sierra-Pérez, J.; Vinyes, E.; Gabarrell, X.; Rieradevall, J.; Sanyé-Mengual, E. Application of life cycle thinking towards sustainable cities: A review. J. Clean. Prod. 2017, 166, 939–951. [Google Scholar] [CrossRef] [Green Version]
- Lausselet, C.; Borgnes, V.; Brattebø, H. LCA modelling for Zero Emission Neighbourhoods in early stage planning. Build. Environ. 2018, 149, 379–389. [Google Scholar] [CrossRef]
- Walker, S.; Labeodan, T.; Boxem, G.; Maassen, W.; Zeiler, W. An assessment methodology of sustainable energy transition scenarios for realizing energy neutral neighborhoods. Appl. Energy 2018, 228, 2346–2360. [Google Scholar] [CrossRef]
- Palma, I.C.; Sanyé-Mengual, E.; Oliver-Solà, J.; Montero, J.-I.; Ponce-Caballero, C.; Rieradevall, J. Towards a green sustainable strategy for social neighbourhoods in Latin America: Case from social housing in Merida, Yucatan, Mexico. Habitat Int. 2013, 38, 47–56. [Google Scholar] [CrossRef]
- Nematchoua, M.K.; Orosa, J.A.; Reiter, S. Life cycle assessment of two sustainable and old neighbourhoods affected by climate change in one city in Belgium: A review. Environ. Impact Assess. Rev. 2019, 78, 106282. [Google Scholar] [CrossRef]
- Guarino, F.; Longo, S.; Vermette, C.H.; Cellura, M.; La Rocca, V. Life cycle assessment of solar communities. Sol. Energy 2020, 207, 209–217. [Google Scholar] [CrossRef]
- Nematchoua, M.K.; Asadi, S.; Reiter, S. A study of life cycle assessment in two old neighbourhoods in Belgium. Sustain. Cities Soc. 2019, 52, 101744. [Google Scholar] [CrossRef]
- Nematchoua, M.K.; Sadeghi, M.; Reiter, S. Strategies and scenarios to reduce energy consumption and CO2 emission in the urban, rural and sustainable neighbourhoods. Sustain. Cities Soc. 2021, 72, 103053. [Google Scholar] [CrossRef]
- Nematchoua, M.K.; Reiter, S. Analysis, reduction and comparison of the life cycle environmental costs of an eco-neighborhood in Belgium. Sustain. Cities Soc. 2019, 48, 101558. [Google Scholar] [CrossRef]
- Nematchoua, M.K.; Sevin, M.; Reiter, S. Towards Sustainable Neighborhoods in Europe: Mitigating 12 Environmental Impacts by Successively Applying 8 Scenarios. Atmosphere 2020, 11, 603. [Google Scholar] [CrossRef]
- Lausselet, C.; Urrego, J.P.F.; Resch, E.; Brattebø, H. Temporal analysis of the material flows and embodied greenhouse gas emissions of a neighborhood building stock. J. Ind. Ecol. 2020, 25, 419–434. [Google Scholar] [CrossRef]
- Lausselet, C.; Lund, K.; Brattebø, H. LCA and scenario analysis of a Norwegian net-zero GHG emission neighbourhood: The importance of mobility and surplus energy from PV technologies. Build. Environ. 2020, 189, 107528. [Google Scholar] [CrossRef]
- Lund, K.M.; Lausselet, C.; Brattebø, H. LCA of the Zero Emission Neighbourhood Ydalir. IOP Conf. Ser. Earth Environ. Sci. 2019, 352, 012009. [Google Scholar] [CrossRef]
- Lotteau, M.; Yepez-Salmon, G.; Salmon, N. Environmental Assessment of Sustainable Neighborhood Projects through NEST, a Decision Support Tool for Early Stage Urban Planning. Procedia Eng. 2015, 115, 69–76. [Google Scholar] [CrossRef] [Green Version]
- Palumbo, E.; Traverso, M.; Antonini, E.; Boeri, A. Towards a sustainable district: A streamlined Life cycle assessment applied to an Italian urban district. IOP Conf. Ser. Earth Environ. Sci. 2019, 323, 012095. [Google Scholar] [CrossRef]
- Hafner, A.; Slabik, S.; Storck, M. Urban Site Development as Temporal Carbon Storage—A Case Study in Germany. Sustainability 2020, 12, 5827. [Google Scholar] [CrossRef]
- Rossi, F.; Heleno, M.; Basosi, R.; Sinicropi, A. LCA driven solar compensation mechanism for Renewable Energy Communities: The Italian case. Energy 2021, 235, 121374. [Google Scholar] [CrossRef]
- Trigaux, D.; Oosterbosch, B.; De Troyer, F.; Allacker, K. A design tool to assess the heating energy demand and the associated financial and environmental impact in neighbourhoods. Energy Build. 2017, 152, 516–523. [Google Scholar] [CrossRef]
- Bakhtavar, E.; Prabatha, T.; Karunathilake, H.; Sadiq, R.; Hewage, K. Assessment of renewable energy-based strategies for net-zero energy communities: A planning model using multi-objective goal programming. J. Clean. Prod. 2020, 272, 122886. [Google Scholar] [CrossRef]
- Karunathilake, H.; Hewage, K.; Mérida, W.; Sadiq, R. Renewable energy selection for net-zero energy communities: Life cycle based decision making under uncertainty. Renew. Energy 2019, 130, 558–573. [Google Scholar] [CrossRef]
- Maranghi, S.; Parisi, M.L.; Facchini, A.; Rubino, A.; Kordas, O.; Basosi, R. Integrating urban metabolism and life cycle assessment to analyse urban sustainability. Ecol. Indic. 2020, 112, 106074. [Google Scholar] [CrossRef]
- Medved, P. A contribution to the structural model of autonomous sustainable neighbourhoods: New socio-economical basis for sustainable urban planning. J. Clean. Prod. 2016, 120, 21–30. [Google Scholar] [CrossRef]
- García-Fuentes, M.; García-Pajares, R.; Sanz, C.; Meiss, A. Novel Design Support Methodology Based on a Multi-Criteria Decision Analysis Approach for Energy Efficient District Retrofitting Projects. Energies 2018, 11, 2368. [Google Scholar] [CrossRef] [Green Version]
- Bianco, G.; Bonvini, B.; Bracco, S.; Delfino, F.; Laiolo, P.; Piazza, G. Key Performance Indicators for an Energy Community Based on Sustainable Technologies. Sustainability 2021, 13, 8789. [Google Scholar] [CrossRef]
- Sougkakis, V.; Lymperopoulos, K.; Nikolopoulos, N.; Margaritis, N.; Giourka, P.; Angelakoglou, K. An Investigation on the Feasibility of Near-Zero and Positive Energy Communities in the Greek Context. Smart Cities 2020, 3, 19. [Google Scholar] [CrossRef]
- Bracco, S.; Delfino, F.; Laiolo, P.; Morini, A. Planning & Open-Air Demonstrating Smart City Sustainable Districts. Sustainability 2018, 10, 4636. [Google Scholar] [CrossRef] [Green Version]
- Paiho, S.; Wessberg, N.; Pippuri-Mäkeläinen, J.; Mäki, E.; Sokka, L.; Parviainen, T.; Nikinmaa, M.; Siikavirta, H.; Paavola, M.; Antikainen, M.; et al. Creating a Circular City–An analysis of potential transportation, energy and food solutions in a case district. Sustain. Cities Soc. 2020, 64, 102529. [Google Scholar] [CrossRef]
- Alvarado, I.A.O.; Sutcliffe, T.E.; Berker, T.; Pettersen, I.N. Emerging circular economies: Discourse coalitions in a Norwegian case. Sustain. Prod. Consum. 2020, 26, 360–372. [Google Scholar] [CrossRef]
- Su, C.; Urban, F. Circular economy for clean energy transitions: A new opportunity under the COVID-19 pandemic. Appl. Energy 2021, 289, 116666. [Google Scholar] [CrossRef]
- Holmstedt, L.; Brandt, N.; Robèrt, K.-H. Can Stockholm Royal Seaport be part of the puzzle towards global sustainability? From local to global sustainability using the same set of criteria. J. Clean. Prod. 2017, 140, 72–80. [Google Scholar] [CrossRef]
- Shahrokni, H.; Årman, L.; Lazarevic, D.; Nilsson, A.; Brandt, N. Implementing Smart Urban Metabolism in the Stockholm Royal Seaport: Smart City SRS. J. Ind. Ecol. 2015, 19, 917–929. [Google Scholar] [CrossRef]
- Brezet, H.; Belmane, N.; Tijsma, S. The Innovation Program’s Perspective for the New Governance of Islands Strategies for Creative Local & Regional Innovation Policies Aimed at Organizing “Probing and Learning” Projects and Programs for the Future Pathways of Islands; Tipping Guide; Tool for Facilitators; ProfB Publishers: Rotterdam, The Netherlands, 2019; ISBN 9789081780810. [Google Scholar]
- Dameri, R.P. Smart City Definition, Goals and Performance; Springer: Cham, Switzerland, 2017; pp. 1–22. ISBN 9783319457666. [Google Scholar] [CrossRef]
- Bosch, P.; Jongeneel, S.; Rovers, V.; Neumann, H.-M.; Airaksinen, M.; Huovila, A. CITYkeys Indicators for Smart City Projects and Smart Cities. 2017. Available online: https://nws.eurocities.eu/MediaShell/media/CITYkeysD14Indicatorsforsmartcityprojectsandsmartcities.pdf (accessed on 27 May 2021).
- Angelakoglou, K.; Nikolopoulos, N.; Giourka, P.; Svensson, I.-L.; Tsarchopoulos, P.; Tryferidis, A.; Tzovaras, D. A Methodological Framework for the Selection of Key Performance Indicators to Assess Smart City Solutions. Smart Cities 2019, 2, 18. [Google Scholar] [CrossRef] [Green Version]
- SCIS—CEPS. Available online: https://www.ceps.eu/ceps-projects/eu-smart-cities-information-system-scis/ (accessed on 27 May 2021).
- The Project. Available online: http://www.citykeys-project.eu/citykeys/project (accessed on 27 May 2021).
- The CONCERTO Initiative. Available online: http://www.ecocity-project.eu/TheConcertoInitiative.html (accessed on 7 May 2021).
- Sweeney, J.; Rood, D.; Hynes, W. +CityxChange. Reporting to the SCIS System. 2019. Available online: https://cityxchange.eu/wp-content/uploads/2019/11/D7.6_Reporting-to-the-SCIS-System-2.pdf (accessed on 7 May 2021).
- Stengel, J. CONCERTO Premium: Indicator Guide. 2012. Available online: https://smart-cities-marketplace.ec.europa.eu/insights/publications/concerto-indicator-guide (accessed on 7 May 2021).
- SCIS. Monitoring KPI Guide D23.1, (2018) 43. Available online: https://smart-cities-marketplace.ec.europa.eu/sites/default/files/2021-02/scis-monitoring_kpi_guide-november_2018.pdf (accessed on 7 May 2021).
- Pearson, A. Key performance indicators for nursing. Int. J. Nurs. Pract. 2003, 9, 337. [Google Scholar] [CrossRef]
- Yazar, M.; Hestad, D.; Mangalagiu, D.; Saysel, A.K.; Ma, Y.; Thornton, T.F. From urban sustainability transformations to green gentrification: Urban renewal in Gaziosmanpaşa, Istanbul. Clim. Chang. 2019, 160, 637–653. [Google Scholar] [CrossRef]
- Gould, K.; Lewis, T. Green Gentrification. Urban Sustainability and the Struggle for Environmental Justice; Routledge: London, UK, 2016. [Google Scholar] [CrossRef]
- Dooling, S. Ecological Gentrification: A Research Agenda Exploring Justice in the City. Int. J. Urban Reg. Res. 2009, 33, 621–639. [Google Scholar] [CrossRef]
- Ferreira, M.; Almeida, M. Benefits from Energy Related Building Renovation Beyond Costs, Energy and Emissions. Energy Procedia 2015, 78, 2397–2402. [Google Scholar] [CrossRef] [Green Version]
- Bisello, A.; Grilli, G.; Balest, J.; Stellin, G.; Ciolli, M. Co-benefits of Smart and Sustainable Energy District Projects: An Overview of Economic Assessment Methodologies. In Green Energy and Technology; Springer: Cham, Switzerland, 2016. [Google Scholar] [CrossRef]
- Piazza, G.; Bracco, S.; Delfino, F.; Siri, S. Optimal design of electric mobility services for a Local Energy Community. Sustain. Energy Grids Netw. 2021, 26, 100440. [Google Scholar] [CrossRef]
- Lamé, G.; Leroy, Y.; Yannou, B. Ecodesign tools in the construction sector: Analyzing usage inadequacies with designers’ needs. J. Clean. Prod. 2017, 148, 60–72. [Google Scholar] [CrossRef]
- Shafique, M.; Azam, A.; Rafiq, M.; Ateeq, M.; Luo, X. An overview of life cycle assessment of green roofs. J. Clean. Prod. 2019, 250, 119471. [Google Scholar] [CrossRef]
- Bruce-Hyrkäs, T.; Pasanen, P.; Castro, R. Overview of Whole Building Life-Cycle Assessment for Green Building Certification and Ecodesign through Industry Surveys and Interviews. Procedia CIRP 2018, 69, 178–183. [Google Scholar] [CrossRef]
- Sierra-Pérez, J.; Boschmonart-Rives, J.; Gabarrell, X. Environmental assessment of façade-building systems and thermal insulation materials for different climatic conditions. J. Clean. Prod. 2016, 113, 102–113. [Google Scholar] [CrossRef] [Green Version]
- Tumminia, G.; Guarino, F.; Longo, S.; Ferraro, M.; Cellura, M.; Antonucci, V. Life cycle energy performances and environmental impacts of a prefabricated building module. Renew. Sustain. Energy Rev. 2018, 92, 272–283. [Google Scholar] [CrossRef]
- De Gracia, A.; Rincón, L.; Castell, A.; Jimenez, M.; Boer, D.; Medrano, M.; Cabeza, L.F. Life Cycle Assessment of the inclusion of phase change materials (PCM) in experimental buildings. Energy Build. 2010, 42, 1517–1523. [Google Scholar] [CrossRef]
- Eberhardt, L.C.M.; Rønholt, J.; Birkved, M.; Birgisdottir, H. Circular Economy potential within the building stock—Mapping the embodied greenhouse gas emissions of four Danish examples. J. Build. Eng. 2020, 33, 101845. [Google Scholar] [CrossRef]
- Antikainen, M.; Valkokari, K. A Framework for Sustainable Circular Business Model Innovation. Technol. Innov. Manag. Rev. 2016, 6, 5–12. [Google Scholar] [CrossRef]
- Zhou, Y.; Wu, J.; Long, C.; Ming, W. State-of-the-Art Analysis and Perspectives for Peer-to-Peer Energy Trading. Engineering 2020, 6, 739–753. [Google Scholar] [CrossRef]
- Zhang, X.; Shen, J.; Saini, P.K.; Lovati, M.; Han, M.; Huang, P.; Huang, Z. Digital Twin for Accelerating Sustainability in Positive Energy District: A Review of Simulation Tools and Applications. Front. Sustain. Cities 2021, 3, 35. [Google Scholar] [CrossRef]
- Martikka, M.; Salo, S.; Siilin, K.; Ruohomaki, T.; Tuomaala, P.; Nykanen, E. Smart City Resilience with Active Citizen Engagement in Helsinki. In Proceedings of the 9th International Conference on Intelligent Systems, Funchal, Portugal, 25–27 September 2018; pp. 162–167. [Google Scholar]
- Yoo, H.K.; Nguyen, M.-T.; Lamonaca, L.; Galanakis, K.; Ackrill, R. Smart-BEEjS: Socio-Economic Factors & Citizens’ Practices, Enabling Positive Energy Districts-Challenging ‘silo thinking’ for Promoting PEDs. 2020. Available online: http://irep.ntu.ac.uk/id/eprint/41989/1/1397843_Galanakis.pdf (accessed on 23 July 2021).
- Müller, B.; Liu, J.; Cai, J.; Schiappacasse, P.; Neumann, H.-M.; Yang, B. Towards Socially Integrative Cities. Perspectives on Urban Sustainability in Europe and China; MDPI: Basel, Switzerland, 2021; ISBN 9788578110796. [Google Scholar]
- Woods, R.; Berker, T. Living labs in a zero emission neighbourhood context. IOP Conf. Ser. Earth Environ. Sci. 2019, 352, 012004. [Google Scholar] [CrossRef]
- Engez, A.; Leminen, S.; Aarikka-Stenroos, L. Urban Living Lab as a Circular Economy Ecosystem: Advancing Environmental Sustainability through Economic Value, Material, and Knowledge Flows. Sustainability 2021, 13, 2811. [Google Scholar] [CrossRef]
- Petersen, S.A.; Petersen, I.; Ahcin, P. Smiling Earth—Raising Awareness among Citizens. Energies 2020, 13, 5932. [Google Scholar] [CrossRef]
- Quijano, A.; Vicente, J.; Gallego, M.; Moral, A.; Luis, J.H.; Macía, A.; Eguskiza, A.; Gomis, I.; Hernández, P.; Albaina, A.; et al. SmartEnCity. WP7, Task 7.1, Deliverable 7.3: Evaluation protocols. 2017. Available online: https://smartencity.eu/media/smartencity_d7.3_smartencity_evaluation_protocols_v1.0.pdf (accessed on 23 May 2021).
- Péan, T.; Costa-Castelló, R.; Salom, J. Price and carbon-based energy flexibility of residential heating and cooling loads using model predictive control. Sustain. Cities Soc. 2019, 50, 101579. [Google Scholar] [CrossRef]
- Péan, T.; Salom, J.; Ortiz, J. Environmental and Economic Impact of Demand Response Strategies for Energy Flexible Buildings. In Proceedings of the 4th Building Simulation and Optimization Conference, Cambridge, UK, 11–12 September 2018; pp. 277–283. [Google Scholar]
- Marotta, I.; Guarino, F.; Cellura, M.; Longo, S. Investigation of design strategies and quantification of energy flexibility in buildings: A case-study in southern Italy. J. Build. Eng. 2021, 41, 102392. [Google Scholar] [CrossRef]
- Majdalani, N.; Aelenei, D.; Lopes, R.A.; Silva, C.A.S. The potential of energy flexibility of space heating and cooling in Portugal. Util. Policy 2020, 66, 101086. [Google Scholar] [CrossRef]
- Tang, H.; Wang, S.; Li, H. Flexibility categorization, sources, capabilities and technologies for energy-flexible and grid-responsive buildings: State-of-the-art and future perspective. Energy 2020, 219, 119598. [Google Scholar] [CrossRef]
- International Energy Agency. IEA EBC Annex 67 Energy Flexible Buildings. 2019. Available online: http://www.annex67.org/about-annex-67/ (accessed on 19 November 2021).
- Li, H.; Wang, Z.; Hong, T.; Piette, M.A. Energy flexibility of residential buildings: A systematic review of characterization and quantification methods and applications. Adv. Appl. Energy 2021, 3, 100054. [Google Scholar] [CrossRef]
- IEA EBC. ANNEX 82: Energy Flexible Buildings towards Resilient Low Carbon Energy Systems. 2020. Available online: www.iea-ebc.org (accessed on 10 August 2021).
- Erba, S.; Pagliano, L. Combining Sufficiency, Efficiency and Flexibility to Achieve Positive Energy Districts Targets. Energies 2021, 14, 4697. [Google Scholar] [CrossRef]
- Fassio, F.; Tecco, N. Circular Economy for Food: A Systemic Interpretation of 40 Case Histories in the Food System in Their Relationships with SDGs. Systems 2019, 7, 43. [Google Scholar] [CrossRef] [Green Version]
- Mutahi, A.; Borgese, L.; Marchesi, C.; Gatari, M.; Depero, L. Indoor and Outdoor Air Quality for Sustainable Life: A Case Study of Rural and Urban Settlements in Poor Neighbourhoods in Kenya. Sustainability 2021, 13, 2417. [Google Scholar] [CrossRef]
- Roumi, S.; Stewart, R.A.; Zhang, F.; Santamouris, M. Unravelling the relationship between energy and indoor environmental quality in Australian office buildings. Sol. Energy 2021, 227, 190–202. [Google Scholar] [CrossRef]
- Mukherjee, A.; Agrawal, M. World air particulate matter: Sources, distribution and health effects. Environ. Chem. Lett. 2017, 15, 283–309. [Google Scholar] [CrossRef]
- Haddad, S.; Synnefa, A.; Marcos, M.P.; Paolini, R.; Delrue, S.; Prasad, D.; Santamouris, M. On the potential of demand-controlled ventilation system to enhance indoor air quality and thermal condition in Australian school classrooms. Energy Build. 2021, 238, 110838. [Google Scholar] [CrossRef]
- Connolly, R.E.; Yu, Q.; Wang, Z.; Chen, Y.-H.; Liu, J.Z.; Collier-Oxandale, A.; Papapostolou, V.; Polidori, A.; Zhu, Y. Long-term evaluation of a low-cost air sensor network for monitoring indoor and outdoor air quality at the community scale. Sci. Total. Environ. 2021, 807, 150797. [Google Scholar] [CrossRef]
- Mohammed, A.; Khan, A.; Santamouris, M. On the mitigation potential and climatic impact of modified urban albedo on a subtropical desert city. Build. Environ. 2021, 206, 108276. [Google Scholar] [CrossRef]
- Bartesaghi-Koc, C.; Haddad, S.; Pignatta, G.; Paolini, R.; Prasad, D.; Santamouris, M. Can urban heat be mitigated in a single urban street? Monitoring, strategies, and performance results from a real scale redevelopment project. Sol. Energy 2021, 216, 564–588. [Google Scholar] [CrossRef]


| Project Name and Website | Doc. Ref. | Project Overview | Lighthouse City Location |
|---|---|---|---|
| MySMARTLife [47] Transition of EU cities towards a new concept of Smart Life and Economy | [48,49] | Project aimed at the clean energy transition and reduction in CO2 emissions in 3 lighthouse cities, with an eye towards socio-economic aspects. | Finland, France, Germany. |
| syn.ikia [50] Sustainable Plus Energy Neighbourhoods | [30,51] | Project aimed at creating SPENs, in 4 different climatic locations by developing a highly sustainable design approach in order to combat climate change and social exclusion. | Austria, Netherlands, Norway, Spain. |
| ATELIER [52] AmsTErdam BiLbao cItizen drivEn smaRt cities | [53,54,55] | Smart city project focused on the implementation of inclusive and sustainable PEDs, where residents are also co-deciders and co-implementers. | Netherlands, Spain. |
| Smart-BEEjS [56] Smart Value Generation by Building Efficiency and Energy Justice for Sustainable Living | [46] | International consortium of universities and research centers aimed at the promotion and development of PEDs, tackling energy poverty through human-centric sustainability practices. | (-) |
| MAtchUP [57] Maximizing the Upscaling and replication potential of high-level urban transformation strategies | [58,59,60,61,62,63] | Project aimed at designing sustainable and clean energy smart cities by means of social, economic and environmental models. | Germany, Spain, Turkey. |
| REMO URBAN [64] REgeneration MOdel for accelerating the smart URBAN transformation | [65,66,67,68,69,70,71] | Project aimed at demonstrating a holistic approach to urban regeneration, based on citizen involvement and energy efficiency measures, in 3 lighthouse cities. | Great Britain, Spain, Turkey. |
| SmartEnCity [56] Towards Smart Zero CO2 Cities across Europe | [72,73,74,75,76] | Project aimed at converting 3 lighthouse cities into Smart Zero Carbon Cities, centered on the concept of sustainability and prosumerism. | Denmark, Estonia, Spain. |
| SPARCS [77] Sustainable energy Positive and zero cARbon Communities | [78,79,80,81,82] | Project aimed at creating carbon free and PEDs in 2 lighthouse cities with a focus on energy flexibility and sustainability. | Germany, Finland. |
| REPLICATE [83] Renaissance of Places with Innovative Citizenship and Technologies | [84,85] | Project aimed at demonstrating innovative and sustainable smart city solutions with a view to climate change and well-being and co-participation of citizens. | Great Britain, Italy, Spain. |
| +CityxChange [86] Positive City ExChange | [87,88] | Project aimed at the transition towards the PED paradigm of 2 lighthouse cities through an open innovation and zero emissions urban path focused on RES. | Ireland, Norway. |
| POCITYF [89] Leading the smart evolution of historical cities | [54,90,91] | Smart city project aimed at implementing the PED paradigm in 2 historic lighthouse cities, through an eco-model compatible with the cultural value of districts. | Netherlands, Portugal. |
| MAKING-CITY [40] Energy efficient pathway for the city transformation | [54,92] | Project oriented towards low-carbon city planning focused on energy flexibility and sustainability through the experimentation of PEDs in 2 lighthouse cities. | Finland, Netherlands. |
| COOPERaTE [93] Control and Optimization for Energy-Positive Neighborhoods | [32,34,94] | Project aimed at achieving PEN status in 2 campuses by demonstrating energy efficiency, RES optimization and sustainability solutions. | France, Ireland. |
| References | Analysis Details | Sustainability Dimension | |||||||
|---|---|---|---|---|---|---|---|---|---|
| Authors | Ref. | Project | Type | Type of RES Systems | Analyzed Elements | Method | Environmental | Economic | Social |
| Lausselet et al. | [133] | ZEN | Mixed use | PV panels | Buildings, mobility, open spaces, energy systems | LCA | √ | (-) | (-) |
| Lausselet et al. | [128] | ZEN | Residential | PV panels, thermal solar collectors | Buildings, mobility, energy systems | LCA | √ | (-) | (-) |
| Walker et al. | [134] | NZED | Residential + commercial | PV panels | Energy systems | LCT, MCA | √ | √ | (-) |
| Cerón-Palma et al. | [135] | SD | Residential | (n/s) | Energy systems, technology, green spaces, food | LCA, Social surveys | √ | (-) | √ |
| Nematchoua et al. | [136] | NZED (1st, 2nd) | Residential (1st), residential + commercial (2nd) | (n/s) | Buildings, mobility, open spaces, energy systems | LCA, Climate change model | √ | (-) | (-) |
| Guarino et al. | [137] | NZED | Residential + commercial + institutional | PV panels, thermal solar collectors (heat storage) | Energy systems | LCA | √ | (-) | (-) |
| Nematchoua et al. | [138] | NZED (1st, 2nd) | Residential (1st), residential + commercial (2nd) | (n/s) | Buildings, mobility, open spaces, energy systems | LCA | √ | (-) | (-) |
| Nematchoua et al. | [139] | SD | Mixed use | PV panels | Buildings, mobility, energy systems | LCA | √ | (-) | (-) |
| Nematchoua et al. | [140] | SD | Residential | (n/s) | Land use (buildings redensification), water management | LCA | √ | (-) | (-) |
| Nematchoua et al. | [141] | SD | Residential | PV panels | Buildings, land use (buildings redensification), mobility, water, on site energy systems | LCA | √ | (-) | (-) |
| Lausselet et al. | [142] | ZEN | Residential + schools | PV panels, thermal solar collectors | Buildings | LCA, Material Flow Analysis (MFA) | √ | (-) | (-) |
| Lausselet et al. | [143] | ZEN | Residential + schools | PV panels, CHP systems powered by wood chips and district heating | Buildings, mobility, infrastructure, networks, on-site energy systems | LCA | √ | (-) | (-) |
| Lund et al. | [144] | ZEN | Residential + schools | PV panels, CHP systems powered by wood chips (with district heating) | Buildings, mobility, infrastructure, networks, on-site energy systems | LCA | √ | (-) | (-) |
| Lotteau et al. | [145] | SD | Mixed use | PV panels, thermal solar collectors | Buildings, open spaces, mobility | LCA | √ | √ | √ |
| Palumbo et al. | [146] | SD | Mixed use | (n/s) | Buildings, energy systems, water, waste | LCA | √ | (-) | (-) |
| Hafner et al. | [147] | SD | Mixed use | (n/s) | Buildings | LCA | √ | (-) | (-) |
| Rossi et al. | [148] | REC | (n/s) | PV panels | Energy systems | LCA, Optimization | √ | √ | (-) |
| Trigaux et al. | [149] | SD | Residential | (n/s) | Buildings | LCA, LCC | √ | √ | (-) |
| Bakhtavar et al. | [150] | NZED | (n/s) | PV panels, biomass, geothermal heat pump | Energy systems | LCA, LCC, Optimization | √ | √ | (-) |
| Karunathilake et al. | [151] | NZED | Mixed use | Hydro, biomass, onshore wind | Energy systems | LCA, LCC, MCA | √ | √ | √ |
| Maranghi et al. | [152] | SD | Mixed use | (n/s) | Buildings, mobility, energy systems, green spaces, food, waste, quality of life (…) | LCA, Urban Metabolism (UM) | √ | (-) | (-) |
| Medved et al. | [153] | N.5 SDs | (n/s) | (n/s) | Buildings, mobility, open spaces, energy systems, green spaces, food, recycle, quality of life (…) | KPI-basedstructural model | √ | √ | √ |
| Moroke at al. | [99] | N.5 SDs | (n/s) | (n/s) | Land use, economy, mobility, open spaces, green spaces, food, recycle, quality of life (…) | MCA | √ | √ | √ |
| Pérez et al. | [96] | SD | Mixed use | (n/s) | Land use, buildings, quality of life, mobility | MCA | √ | √ | √ |
| Lombardi et al. | [108] | NZED | (n/s) | (n/s) | Buildings, energy systems | MCA | √ | √ | √ |
| García-Fuentes et al. | [154] | NZED | Residential | PV panels, thermal solar collectors | Buildings, energy systems | MCA | √ | √ | √ |
| Lode et al. | [106] | REC | (n/s) | (n/s) | Energy infrastructure and platforms | MCA | √ | √ | √ |
| Biianco et al. | [155] | PED | Mixed use | PV panels, thermal solar collectors, onshore wind, hydrogen CHP systems | Energy systems | KPI optimization | √ | (-) | (-) |
| Becchio et al. | [104] | NZED | Mixed use | Biomass | Buildings, energy systems | CBA | √ | √ | √ |
| Sougkakis et al. | [156] | PED (1st), NZED (2nd) | PV panels, geothermal heat pump | Buildings, energy systems | KPI optimization | √ | √ | (-) | |
| Cerreta et al. | [107] | SD | Commercial | (n/s) | Land use, waste | MCA, circular economy model | √ | √ | √ |
| Bracco et al. | [157] | ZEN | University campus | PV panels, thermal solar collectors, geothermal heat pump | Energy systems and ICT, waste, mobility | KPIs, circular economy model | √ | (-) | √ |
| Paiho et al. | [158] | SD | Mixed use | Solar energy, biogas, (n/s) | Mobility, energy systems, food | KPIs, circular economy model | √ | (-) | (-) |
| Alvarado et al. | [159] | SD | Mixed use | (n/s) | Waste, sharing economy, resource consumption | KPIs, circular economy model | √ | √ | √ |
| Su et al. | [160] | SD | Mixed use | (n/s) | Mobility, industrial excess heat, second life energy storage devices | KPIs, circular economy models | √ | (-) | (-) |
| Project | Number of KPIs | Categories |
|---|---|---|
| MySMARTLife | 151 | Urban infrastructures, energy and environment, mobility and transport, citizens, economy and governance |
| syn.ikia | 44 | Energy and environmental performance, indoor environmental quality, economic performance, social performance, smartness and flexibility |
| ATELIER | 40 | Energy and environment, mobility, social and economy |
| MAtchUP | 188 | Efficiency in buildings, urban platforms and ICT, mobility, citizens and society |
| REMO URBAN | 60 | Urban organization, environment and resources, citizens and society |
| SmartEnCity | 149 | Technical, environmental, economic and social |
| SPARCS | 29 | Energy, technological, economic and social |
| REPLICATE | 56 | Energy and environment, governance, mobility, infrastructure, social and economy |
| +CityxChange | 33 | Energy efficiency, economic, social and regulatory |
| POCITYF | 91 | Economy, environment and society−culture |
| MAKING-CITY | 20 | Energy and environment, mobility, governance and society−citizens |
| COOPERaTE | 8 | Energy |
| Key Performance Indicator | Project | Standard/Initiative |
|---|---|---|
| Clean energy | ||
| Value and/or reduction in the final/primary thermal/electrical energy consumption per year (total and per sector) | POCITYF, REPLICATE, MAtchUP, mySMARTlife, SmartEnCity, ATELIER, SPARCS, REMO URBAN, COOPERaTE | SCIS, CITYkeys, SDG indicators, ISO 37120:2018 |
| Degree of final/primary energy self-supply by RES | POCITYF, REPLICATE, MAtchUP, mySMARTlife, +CityxChange, SmartEnCity, ATELIER, syn.ikia, SPARCS, REMO URBAN, COOPERaTE | SCIS, CITYkeys, SDG indicators, ISO 37120:2018 |
| Self-sufficiency/generation/consumption ratio | POCITYF, +CityxChange, syn.ikia, SPARCS | - |
| Energy savings | POCITYF, mySMARTlife, ATELIER, SPARCS, COOPERaTE | SCIS, CITYkeys |
| Increase in installed RES storage capacity | +CityxChange | - |
| Increase in new RES system integration | +CityxChange | - |
| Increase in local renewable energy production | MAtchUP, mySMARTlife, +CityxChange, SPARCS | SCIS, CITYkeys, |
| Heat recovery ratio (thermal energy provided by the heating recovery system ÷ thermal energy consumption) | POCITYF, mySMARTlife | - |
| Renewable thermal and electrical (certified green) energy generated divided by consumed total energy | SPARCS | - |
| Charging capacity managed (no. and power of charging points for electric vehicles subjected to an energy demand management) | mySMARTlife | - |
| No. of organizations with new sustainable energy approaches | +CityxChange | - |
| Use of waste heat | SPARCS | - |
| Comfort | ||
| Indoor air temperature | SmartEnCity, ATELIER, syn.ikia | - |
| Internal relative humidity | SmartEnCity, ATELIER, syn.ikia | - |
| Internal air speed and distribution | SmartEnCity | - |
| Thermal comfort | SmartEnCity, REMO URBAN | - |
| Indoor air quality | REMO URBAN | - |
| Outdoor air temperature | ATELIER | - |
| Predicted Mean Vote (PMV) | syn.ikia | - |
| Predicted Percentage Dissatisfied (PPD) | syn.ikia | - |
| Noise pollution | POCITYF, REPLICATE, MAtchUP, ATELIER, syn.ikia, REMO URBAN | CITYkeys, ISO 37120:2018 |
| Illuminance/daylight factor inside and/or outside the buildings | syn.ikia | - |
| Climate change and pollution | ||
| Total value and/or reduction in greenhouse (CO2) gas emissions | POCITYF, REPLICATE, MAtchUP, mySMARTlife, +CityxChange, ATELIER, syn.ikia, SPARCS, REMO URBAN | SCIS, CITYkeys |
| Carbon dioxide emission reduction | POCITYF, REPLICATE, mySMARTlife, +CityxChange, SmartEnCity, syn.ikia, SPARCS | SCIS, CITYkeys |
| Total value and/or reduction in NOx/tHC/PMe-2.5 air pollution | +CityxChange, ATELIER, SPARCS, REMO URBAN | CITYkeys, SDG indicators, ISO 37120:2018 |
| Air quality index | POCITYF, MAtchUP, +CityxChange | CITYkeys |
| Climate resilience strategy | POCITYF, REMO URBAN | CITYkeys, SDG indicators |
| Waste and water management | ||
| Municipal solid waste | POCITYF, REPLICATE, REMO URBAN | CITYkeys, ISO 37120:2018 |
| Recycling rate of solid waste | POCITYF, REPLICATE, REMO URBAN, MAKING-CITY | CITYkeys, ISO 37120:2018 |
| Total water consumption | ATELIER, REMO URBAN | CITYkeys, ISO 37120:2018 |
| Percentage of population with water and potable water supply service | REMO URBAN | SDG indicators, ISO 37120:2018 |
| Percentage of the wastewater receiving treatment | REMO URBAN | CITYkeys, SDG indicators |
| Percentage of households with smart water meters | REMO URBAN | ISO 37122:2019 |
| Percentage of households with drainage system management | REMO URBAN | - |
| City water monitoring | REMO URBAN | - |
| Sewage systems management | REMO URBAN | - |
| Sanitation services | REMO URBAN | - |
| Sustainable mobility infrastructure | ||
| No. of electric vehicles (EVs) and low-carbon emission vehicles deployed in the area | POCITYF, REPLICATE, MAtchUP, REMO URBAN | SCIS, ISO 37122:2019 |
| No. of electric vehicles (EVs) per capita | REPLICATE, MAtchUP | - |
| Percentage of electric vehicles (EVs) per private/public/commercial sector | MAtchUP, SPARCS, REMO URBAN | - |
| Availability rate of e-buses (percentage of days in which the e-buses are available to provide transportation service) | mySMARTlife | - |
| Vehicle-To-Grid (V2G) parking places (car and bicycle) | SPARCS | - |
| No. of electric vehicle (EV) charging stations | SPARCS, REMO URBAN | SCIS |
| No. of solar-powered Vehicle-To-Grid (V2G) charging stations deployed in the area | POCITYF, REPLICATE, MAtchUP, mySMARTlife | SCIS |
| Share of electric vehicle (EV) demand covered by local RES | ATELIER | - |
| Access to vehicle-sharing solutions (no. of vehicle for sharing ÷ total population) | MAtchUP | CITYkeys |
| Access to bike-sharing solutions (no. of bikes for sharing ÷ total population) | MAtchUP | - |
| Public infrastructure promoting low-carbon mobility | MAKING-CITY | - |
| Sustainable mobility performance and use | ||
| Availability rate of the solar roads (percentage of time that the solar roads are functioning properly to produce electricity) | mySMARTlife | - |
| No. of recharges per year (biogas and electric vehicles) | mySMARTlife, SmartEnCity | - |
| No. of recharge sessions per year (biogas and electric vehicles) | mySMARTlife | - |
| Annual energy delivered by electric vehicle (EV) charging points | POCITYF, MAtchUP, mySMARTlife, ATELIER, SPARCS, REMO URBAN | - |
| Annual energy delivered by electric vehicles (EVs) and biogas charging points | SmartEnCity | - |
| Shared electric vehicles penetration rate (no. of electric vehicles that operate in the platform and in community car-sharing concept) | POCITYF, mySMARTlife, SPARCS | - |
| Clean mobility utilization | POCITYF, +CityxChange | SCIS |
| Modal spit (shares of different modes of transportation) and improvement towards non pollutant mobility habits | ATELIER, SPARCS, MAKING-CITY | SCIS |
| Percentage modal shift from fossil-fuel vehicles to electric vehicles (vehicles/bikes) | +CityxChange | - |
| Yearly kilometers of shared vehicles | POCITYF | - |
| No., percentage and duration of deliveries operated with clean vehicles | mySMARTlife | - |
| No. of annual passengers of electric buses | mySMARTlife | - |
| Average no. of electric buses passengers per working day | mySMARTlife | - |
| Targeted share of bicycle and pedestrian mobility mode | SPARCS | - |
| Environmental sustainability and society | ||
| Residents’ energy awareness | SmartEnCity, syn.ikia, SPARCS | - |
| Economic incentives to promote sustainable actions | REMO URBAN | - |
| Progress towards energy citizenship | ATELIER | - |
| Active/pro-active behavior of citizens (e.g., willingness to invest in energy savings measures or pay more for RES or service) | mySMARTlife | SCIS |
| No. of innovation labs | +CityxChange | - |
| Citizen engagement in climate-conscious actions | MAKING-CITY | CITYkeys |
| Environmental awareness | SmartEnCity | - |
| Urban compactness | REMO URBAN | - |
| Green areas | REMO URBAN | ISO 37120:2018 |
| References | Computational Details | Systems Boundaries | |||||
|---|---|---|---|---|---|---|---|
| Authors. | Ref. | Functional Unit | Indicators | Analysis Elements | Production | Use | End-of-Life |
| ATELIER | [55] | (n/s) | GHG emissions, life cycle non-renewable primary, energy demand, life cycle environmental | Buildings | √ | √ | √ |
| footprint | Transport | √ | √ | √ | |||
| On-site energy systems | √ | √ | √ | ||||
| SmartEnCity | [75,196] | 1 m2/y per building type | GHG emissions, life cycle environmental footprint, cumulative primary energy demand (use of renewable and non-renewable primary energy resources used as raw material and use of renewable primary energy excluding energy resources used as raw material), hazardous and non-hazardous wastes disposed, exported energy | Buildings | √ | √ | √ |
| Lausselet et al. | [133] | (n/s) | GHG emissions | Buildings | √ | √ | (-) |
| Transport | √ | √ | (-) | ||||
| Open spaces | √ | √ | (-) | ||||
| On-site energy systems | √ | √ | (-) | ||||
| Energy networks | √ | (-) | (-) | ||||
| Lausselet et al. | [128] | “to build and refurbish 20 single-family houses of passive standards (constituting the neighborhood) over a 60 years period, deliver energy for heating and electric appliances and provide mobility by passengers cars for all the inhabitants” | GHG emissions | Buildings | √ | √ | (-) |
| Transport | √ | √ | (-) | ||||
| Energy systems | √ | √ | (-) | ||||
| Walker et al. | [134] | (n/s) | Life cycle energy performance | Energy systems | √ | √ | √ |
| Cerón-Palma et al. | [135] | (n/s) | GHG emissions, life cycle energy demand | Buildings | (n/s) | √ | (n/s) |
| Energy systems | (n/s) | √ | (n/s) | ||||
| Green spaces | √ | √ | (n/s) | ||||
| Food | √ | √ | (n/s) | ||||
| Nematchoua et al. | [136,138] | (n/s), Two functional units: one per occupant and | GHG emissions, acidification potential, energy consumption, water consumption, waste | Buildings | √ | √ | √ |
| one per m2 | production, abiotic ozone depletion, eutrophication potential, ozone depletion potential, | Energy systems | √ | √ | √ | ||
| radioactive waste production, damage to biodiversity, damage to health, odors | Open spaces | √ | √ | √ | |||
| Green spaces | √ | √ | √ | ||||
| Guarino et al. | [137] | “to satisfy the heating and cooling requirements of the district” | GHG emissions, ozone depletion, human toxicity, non-cancer effects, cancer effects, particulate matter, ionizing radiation, photochemical ozone formation, acidification, terrestrial eutrophication, freshwater eutrophication, marine eutrophication, freshwater ecotoxicity, land use, mineral−fossil resource depletion | Energy systems | √ | √ | (-) |
| Lausselet et al. | [142] | “to fulfill the housing demand in terms of residential buildings for the 2500 inhabitants of Ydalir, including a school and a kindergarten, for a timeframe of 60 years starting in 2019” | GHG emissions | Buildings | √ | √ | √ |
| Lausselet et al. | [143] | “to fulfill the housing, school, kindergarten and | GHG emissions | Buildings | √ | √ | (-) |
| mobility needs of the 2500 inhabitants of Ydalir | Transport | √ | √ | (-) | |||
| over a 60 year time period” | Infrastructure | √ | √ | (-) | |||
| Networks | √ | √ | (-) | ||||
| On-site energy systems | √ | √ | (-) | ||||
| Lotteau et al. | [145] | (n/s) | GHG emissions, primary energy consumption | Buildings | √ | √ | (-) |
| Open spaces (green spaces, roads, parking) | √ | √ | (-) | ||||
| Transport | √ | √ | (-) | ||||
| Nematchoua et al. | [139] | (n/s) | GHG emissions, life cycle energy demand | Buildings | (n/s) | √ | (n/s) |
| Transport Energy systems | (n/s) (n/s) | √ √ | (n/s) (n/s) | ||||
| Nematchoua et al. | [140] | “Residential eco-district of 3.5 ha comprising 1 ha of roads, driveways and parking lots, 17,800 m² of the green space, 19,740 m² of the floor space, housing around 220 people, studied on a life cycle of 80 years and located in Liege in Belgium” | GHG emissions, acidification potential, energy consumption, water consumption, waste production, abiotic ozone depletion, eutrophication potential, ozone depletion potential, radioactive waste production, damage to biodiversity, damage to health, odors | Buildings | √ | √ | √ |
| Nematchoua et al. | [141] | “One square meter per living area” | GHG emissions, acidification potential, energy consumption, water consumption, waste | Buildings | √ | √ | (n/s) |
| production, abiotic ozone depletion, eutrophication potential, ozone depletion potential, | Transport | (n/s) | √ | (n/s) | |||
| radioactive waste production, damage to biodiversity, damage to health, odors | On-site energy systems | √ | √ | (n/s) | |||
| Palumbo et al. | [146] | “8910 m2 of open area, about 190 housing units with 10,879 m2 of living spaces and 475 inhabitants” | GHG emissions | Buildings Open spaces (heat island effect) Waste | √ √ √ | √ √ √ | (-) (-) (-) |
| Hafner et al. | [147] | “One square meter of the gross floor area” | GHG emissions, primary energy consumption | Buildings | √ | √ | √ |
| Rossi et al. | [148] | 1 kWh of energy generated | GHG emissions | Energy systems | √ | √ | √ |
| Bakhtavar et al. | [150] | (n/s) | GHG emissions, human health impact, eco-system damage, resource depletion | Energy systems | √ | √ | √ |
| Karunathilake et al. | [151] | 1 MWh of energy generated | GHG emissions, ionizing radiation, ozone depletion, human toxicity, particulate matter, ionizing radiation, photochemical oxidant formation, acidification, freshwater eutrophication, marine eutrophication, freshwater ecotoxicity, terrestrial ecotoxicity, marine ecotoxicity, urban land occupation, natural land transformation, water−mineral−fossil resource depletion | Energy systems | √ | √ | √ |
Publisher’s Note: MDPI stays neutral with regard to jurisdictional claims in published maps and institutional affiliations. |
© 2021 by the authors. Licensee MDPI, Basel, Switzerland. This article is an open access article distributed under the terms and conditions of the Creative Commons Attribution (CC BY) license (https://creativecommons.org/licenses/by/4.0/).
Share and Cite
Marotta, I.; Guarino, F.; Longo, S.; Cellura, M. Environmental Sustainability Approaches and Positive Energy Districts: A Literature Review. Sustainability 2021, 13, 13063. https://doi.org/10.3390/su132313063
Marotta I, Guarino F, Longo S, Cellura M. Environmental Sustainability Approaches and Positive Energy Districts: A Literature Review. Sustainability. 2021; 13(23):13063. https://doi.org/10.3390/su132313063
Chicago/Turabian StyleMarotta, Ilaria, Francesco Guarino, Sonia Longo, and Maurizio Cellura. 2021. "Environmental Sustainability Approaches and Positive Energy Districts: A Literature Review" Sustainability 13, no. 23: 13063. https://doi.org/10.3390/su132313063
APA StyleMarotta, I., Guarino, F., Longo, S., & Cellura, M. (2021). Environmental Sustainability Approaches and Positive Energy Districts: A Literature Review. Sustainability, 13(23), 13063. https://doi.org/10.3390/su132313063