Article

Rural Landscape Changes in the Piedmont Region (Italy). A Method for the Interpretation of Possible Effects of CAP

Interuniversity Department of Regional and Urban Studies and Planning (DIST), Politecnico di Torino, 10125 Torino, Italy
Sustainability 2021, 13(23), 13062; https://doi.org/10.3390/su132313062
Submission received: 9 September 2021 / Revised: 18 November 2021 / Accepted: 22 November 2021 / Published: 25 November 2021
(This article belongs to the Special Issue Sustainable Rural Landscape: Study, Planning, and Design)

Abstract

:
As a result of various regulatory reforms, the Common Agricultural Policy (CAP) has gradually achieved value and environmental awareness. However, the most recent studies carried out in the fields of environmental assessment and spatial planning seem to indicate that agricultural policies have not been very effective in achieving landscape aims. Understanding how the CAP affects the landscape can help us to improve its effectiveness and foster a more efficient territorial and targeted approach. This paper aims to show a replicable method for evaluating rural landscape changes and understanding the possible role of CAP as one of the main driving forces. The analysis was conducted in the Piedmont Region (Italy) at the supra-local and local scales by observing land use changes and landscape changes. The main results show that the CAP seems quite effective in maintaining the territorial presence on rural landscapes and in preventing the spread of forests. However, it seems less effective in limiting urban and peri-urban sprawl. The research also shows that in areas with high CAP support, factors that produce negative effects on landscape have increased. In conclusion, the author shows a possible way for the CAP to achieve the landscape purposes.

1. Introduction

As a part of the natural and cultural environment, the rural landscape is crucial not only for the conservation of natural resources, but also for its economic implications and global competitiveness of rural regions [1,2]. Despite the environmental progress achieved and the most recent strengthening of the ecological dimension [3], the role of the Common Agricultural Policy (CAP) in the protection and enhancement of the rural landscape could be improved. The most recent studies carried out in the field of agri-environmental policy assessment seem to indicate that CAP has not been very effective in achieving environmental and landscape priorities [3,4,5,6,7,8,9]. Currently, the CAP consists of two pillars: the first one includes income support (direct payments) and market measures, while the second includes rural development measures (both national and regional). The CAP originated from the need to overcome food self-sufficiency and the instability of the agricultural market, and aimed to provide a productive and social purpose. Since the end of the 1990s, the CAP has profoundly changed and has gradually included many environmental and landscape objectives. The numerous reforms have introduced some support tools with environmental purposes, such as a cross-compliance system (the good agricultural and environmental condition), the “greening” component of direct payments and agri-environmental measures. Furthermore, for the next CAP 2023–2027, a new green architecture will be introduced that includes an “enhanced conditionality” and the “ecoscheme”, which are annual payments for agricultural practices (organic farming, agro-ecology, agro-forestry, high nature value farming, etc.), in order to reach the EU Green Deal targets on environment, biodiversity and climate [10]. Despite numerous legislative reforms, the CAP approach still seems oriented to maximize agricultural production and support farmer incomes, especially in some regions. In addition, the CAP does not seem to be well equipped to respond to the new environmental and climate challenges. According to some studies [9,11,12,13,14], a more efficient territorial and targeted approach could improve its landscape effectiveness. However, the evaluation of the effects of CAP on the landscape is an open question within European investment and structural funds. Identifying a cause and effect relationship is very difficult, especially in the field of landscape studies. Most of the landscape–environmental actions promoted by these policies do not produce tangible effects in the implementation period. In addition, many other factors can influence environmental processes, such as landscape characteristics and heterogeneity of the environmental system [4,15].
The environmental effects of agricultural policies have been widely debated in the literature, especially through quantitative studies and the application of spatial and land-use indicators. However, few studies on the assessment of landscape services provided to the agricultural system have been published.
In the context of agricultural policies, landscape evaluation mainly involves the assessment of agro-ecosystem services. Some scholars have examined this field both in terms of the supply of principal services or the negative environmental effects of agriculture as well as ecosystem disservices, particularly in the literature of agronomic sciences [16,17,18]. In the European project “Supporting the role of the Common agricultural policy in Landscape valorisation” (CLAIM), Ungaro et al. [19] included the mapping and examination of the services provided by different landscapes on the basis of geo-statistical models. Ungaro et al. [20] also subsequently developed a methodology to map the demand for cultural services through a visual experiment aimed at estimating the contribution of different landscape elements in terms of landscape preferences. Other scholars have instead operated through mainly quantitative tools and using indicators [21]. Rega et al. [22] developed the “Input intensity” indicator, calculated on the basis of land cover and the energy required in the production phase. Recently, other scholars [8,23] have worked on indicators for the assessment of agricultural landscape fragmentation and heterogeneity. Many scholars have used spatially explicit models and development scenarios. Rega et al. [24] evaluated the potential of the landscape in terms of natural pest control, while Rega et al. [25] verified the hypothesis of a new food production model without further compromising biodiversity. Other authors, such as Kay et al. [26], have underlined the contribution of agroforestry practices in terms of reducing environmental pressures, particularly in the agricultural areas of the European Union. Recently, Mouchet et al. [27] have demonstrated the importance of evaluating ecosystem services in the ex ante phase, especially in the context of policies with significant environmental effects.
This paper presents a method and tools for evaluating the rural landscape changes and better understanding the possible role of the CAP as one of the main driving forces of these changes. The method also attempts to overcome the current lack of methodological and technical evaluation of the CAP and will add to the knowledge about the possible effect of the CAP on landscape. Although this method has been applied to some of the most important agricultural areas in the Piedmont Region (Italy) in terms of share of the regional production, it was developed in order to be transferable to other European contexts.
In the second section, the author presents the method to evaluate the rural landscape changes and to define some hypotheses about the possible effects of the CAP at different territorial scales. The criteria for the selection of the study area, the analysis of land use change at the supra-local level and the landscape change analysis at the local scale will be illustrated. In the third section, some results of the application in the Piedmont case study and some hypotheses about the possible role of the CAP in landscape change will be described. The findings will be interpreted in the discussion, along with the possible positive effects and trade-off and the strengths and weakness of the method. Possible fields of application will also be highlighted. In the last section, the author will discuss some open questions and research perspectives regarding the landscape approach in next CAP 2023–2027 and in the context of the Green Deal and the Sustainable Development Goals.

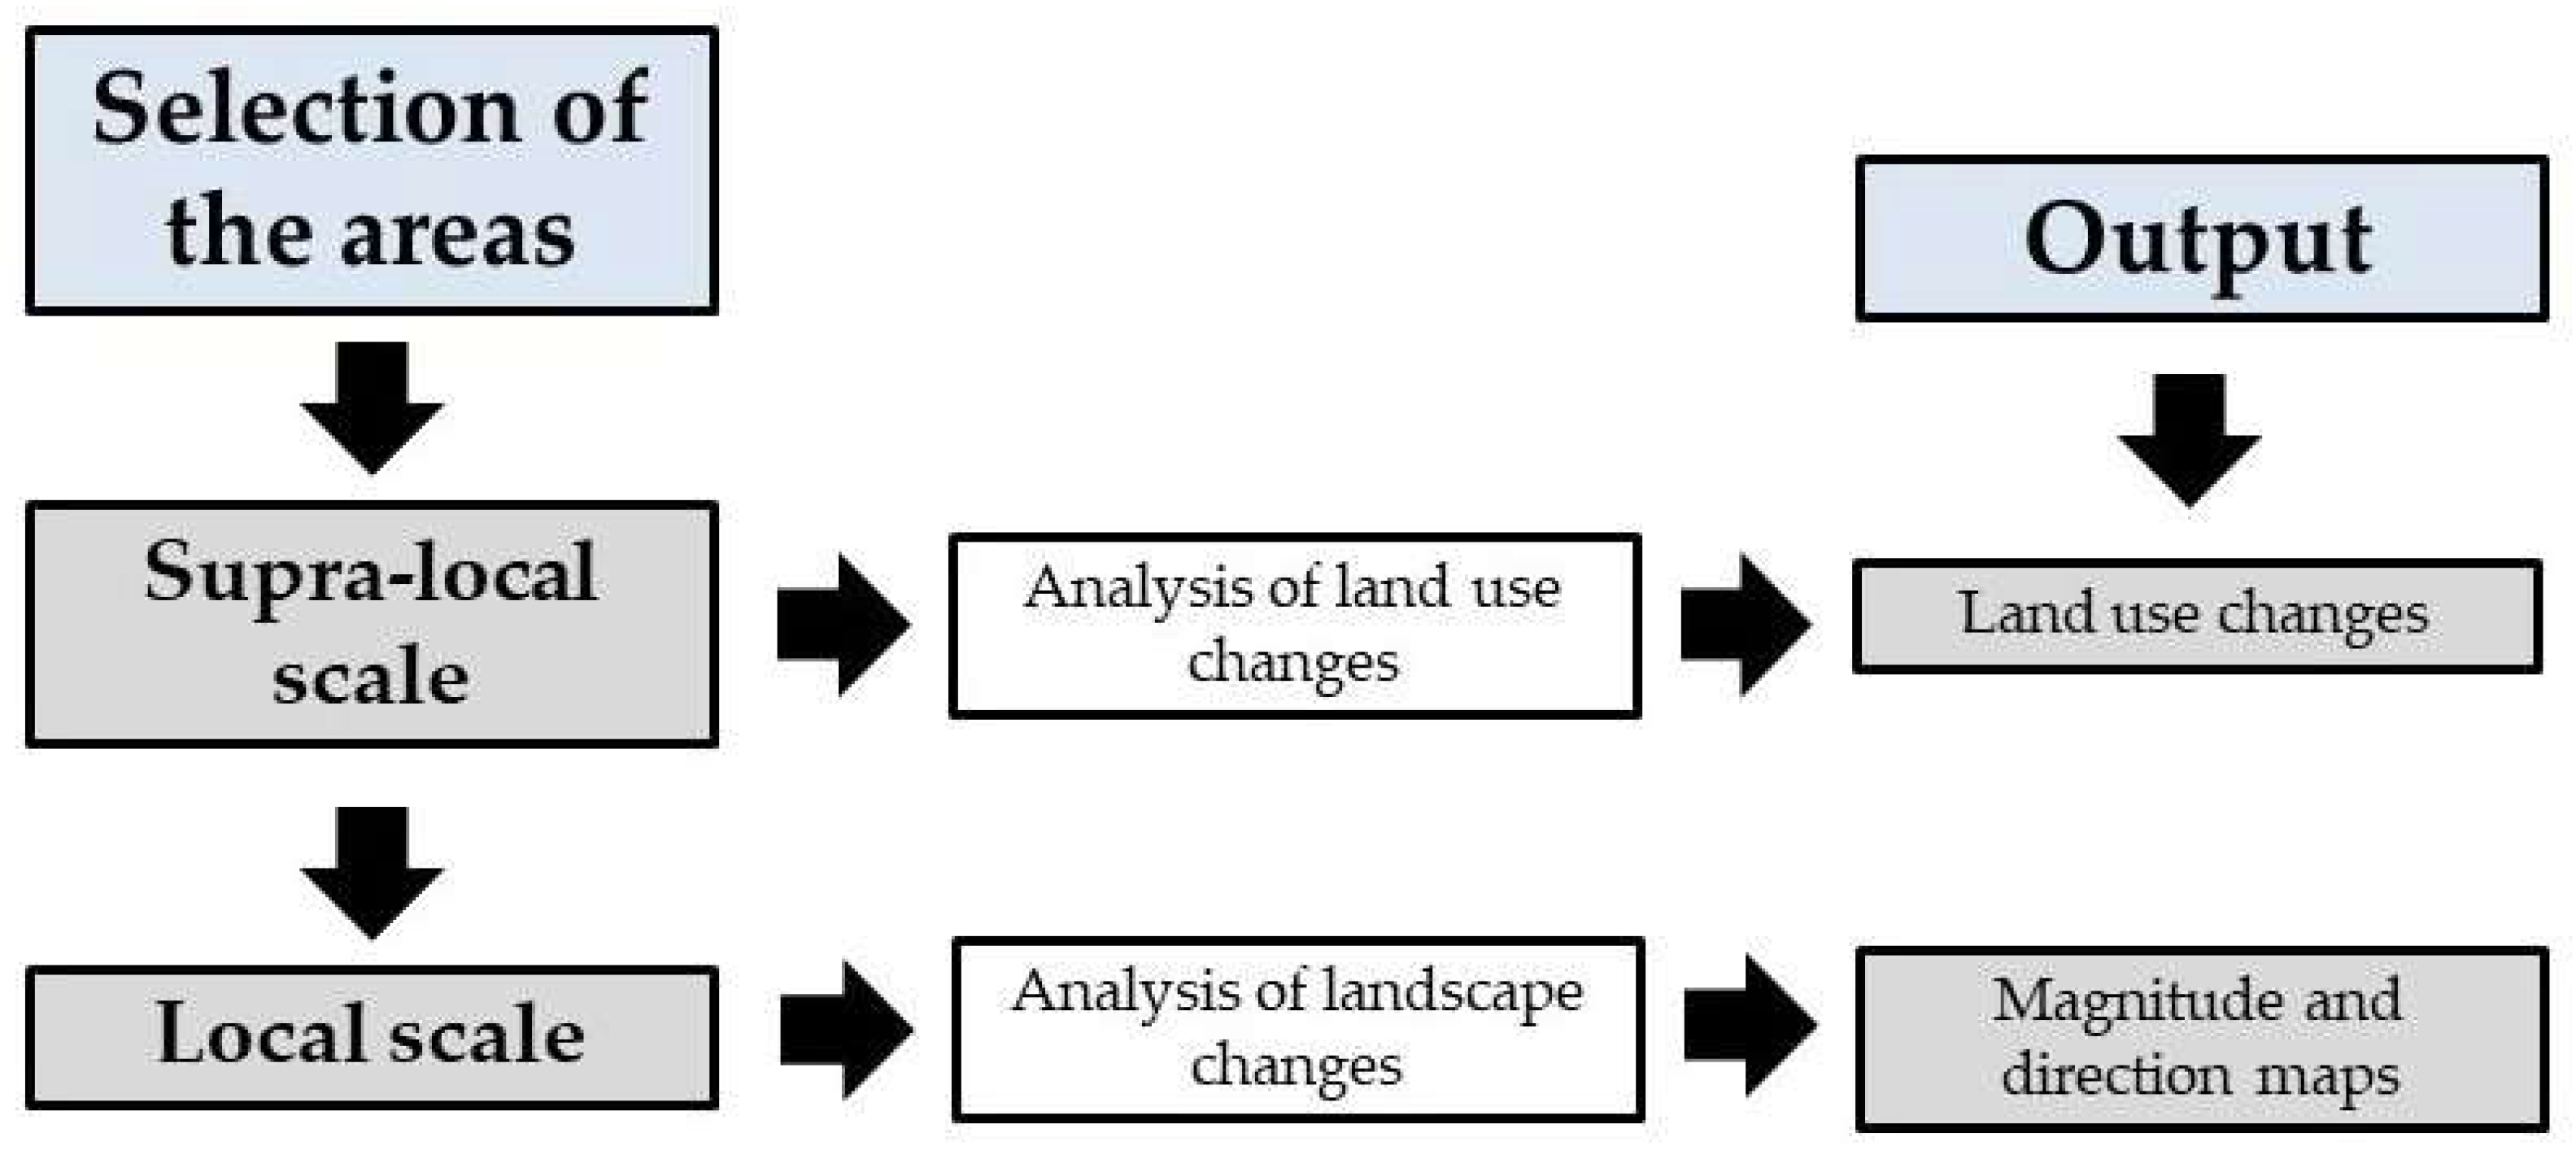
2. Materials and Methods

The method is based on the hypothesis that the CAP is one of the main drivers of landscape changes. For this reason, it was applied on selected areas (covered and not covered by the CAP support) and carried out at different territorial scales: at the meso level (supra-local scale), through the analysis of land use change, and at the local scale, by analysis of the change in landscape features and metrics [28,29] (Figure 1).

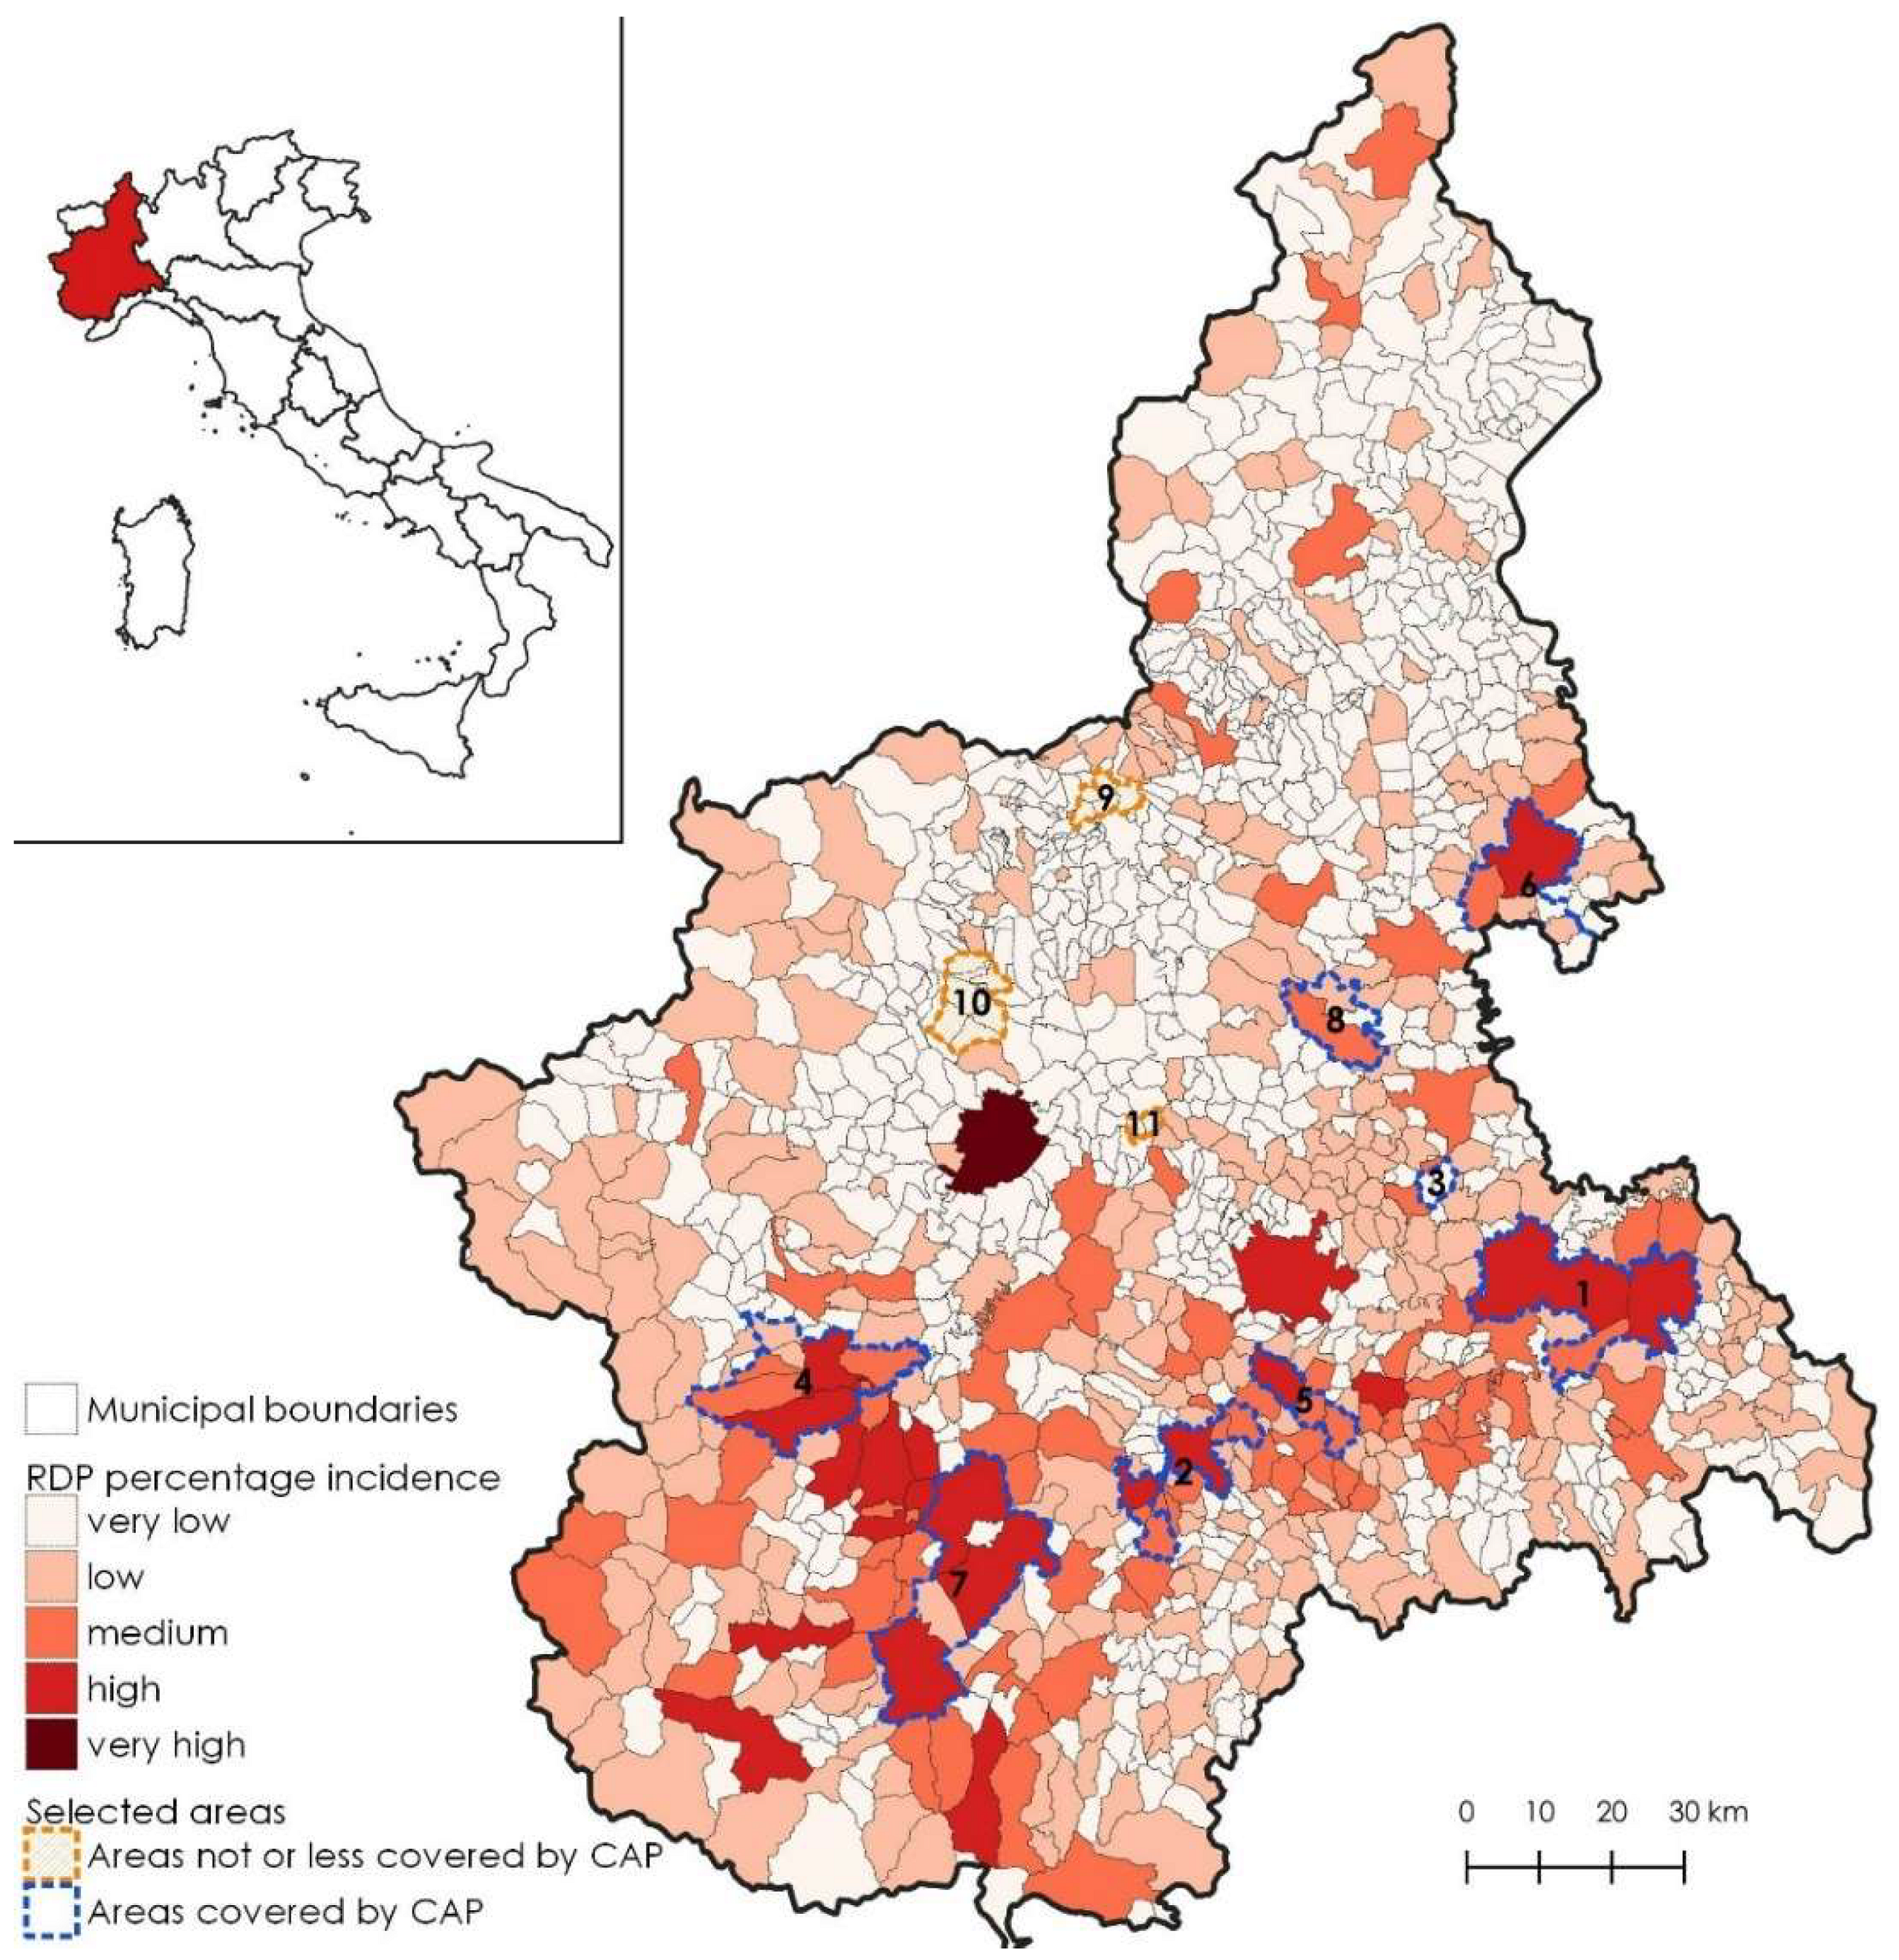
2.1. Selection of the Areas

This phase includes not only the identification of areas where public support is minor or considerable, but also areas with similar physical, landscape and structural characteristics. The selected areas take into account the environmental features and the structural characteristics of the districts and farms, the public expenditure of the RDP, and, more generally, of the CAP (II pillar and direct payment per hectare of single payment schemes), as well as the Utilized Agricultural Area (UAA) or Total Agricultural Area (TAA) invested by agri-environmental support. The study areas were identified through the spatial analysis of the most important RDP measures, especially from an environmental point of view, and by combining a number of municipalities with similar characteristics. They were then divided into two categories: the areas not involved or scarcely affected by the support of the CAP, particularly the RDP, and the areas most affected by public support during the 2007–2013 cycle.

2.2. Analysis of Land Use Change at Supra-Local Scale

The first step at the supra-local scale (aggregation of municipalities) is to analyze the land use change before and after the implementation of 2007–2013 CAP. This step can be addressed through the analysis of European datasets (such as Corine Land Cover, Urban Atlas, etc.), regional or local databases, and the combination or integration of these sources. For the case study, some variables were selected and observed, such as the variation of utilized agricultural area, land consumption, arable land, permanent meadows, permanent crops, forest and arboriculture. This selection phase includes a preliminary step that consists of the pre-processing, collection and systematization of the main data of these areas. This information was collected from regional and local producers as well as numerical and spatial regional databases as listed in Table 1.

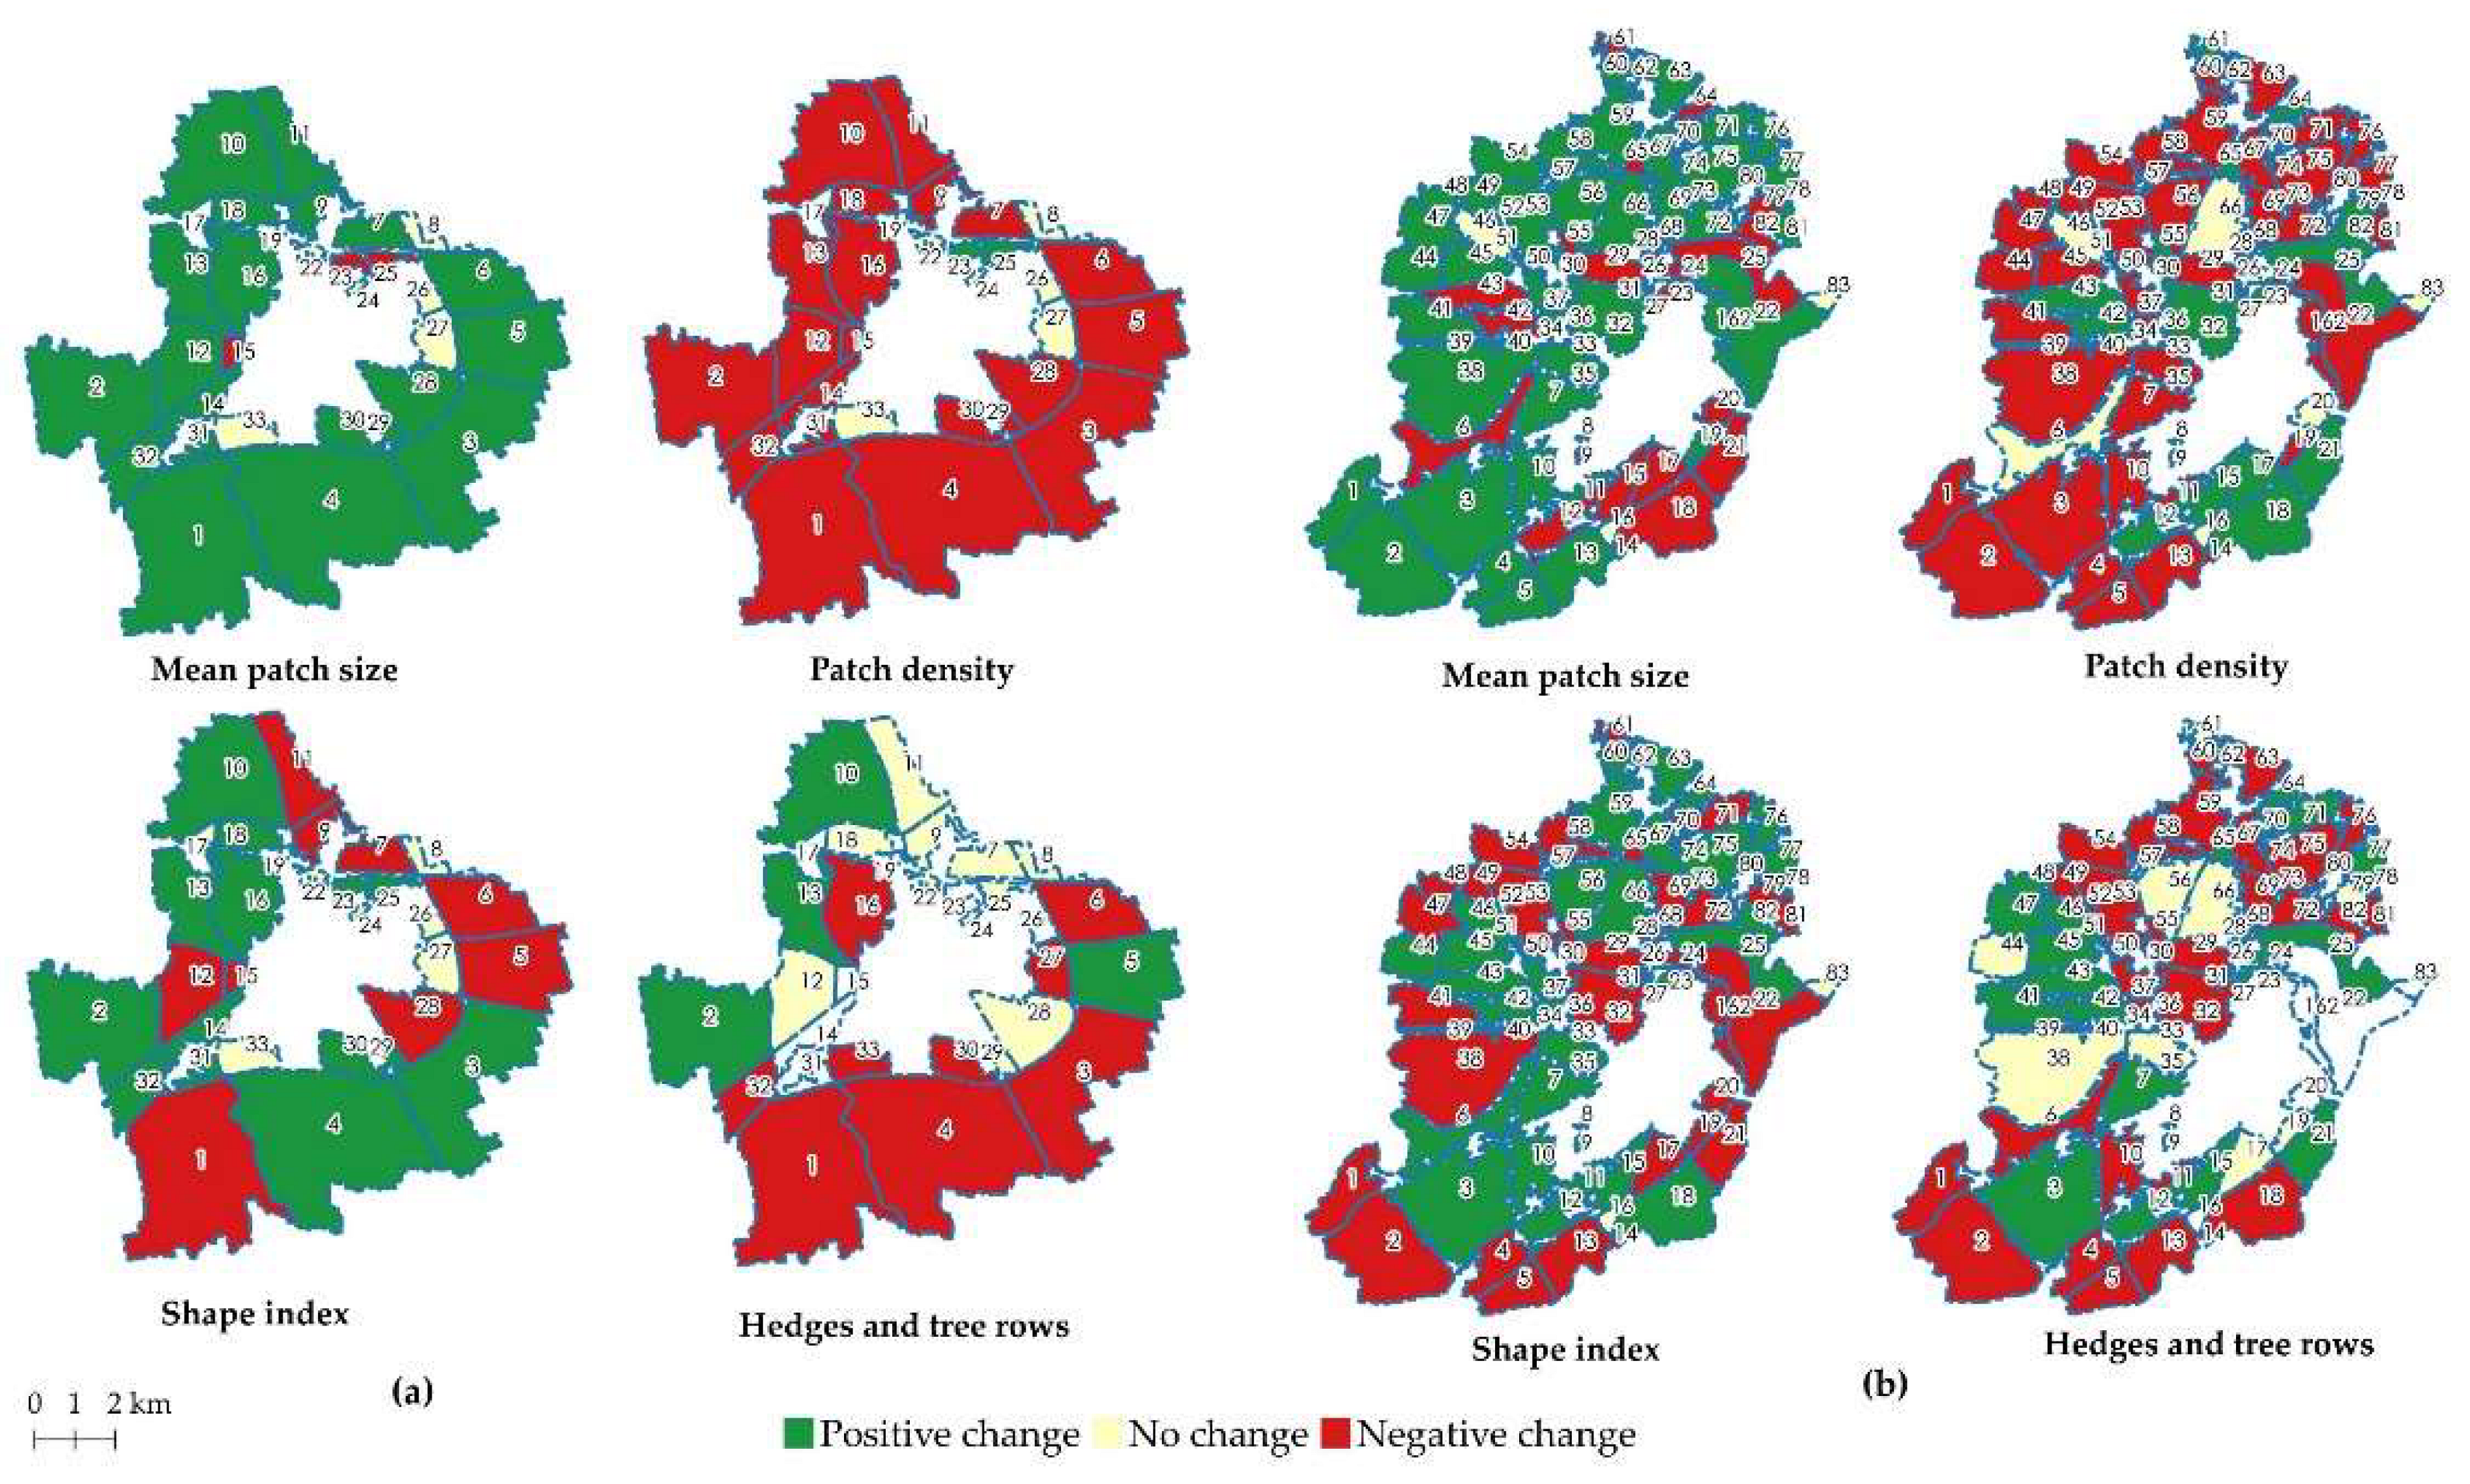
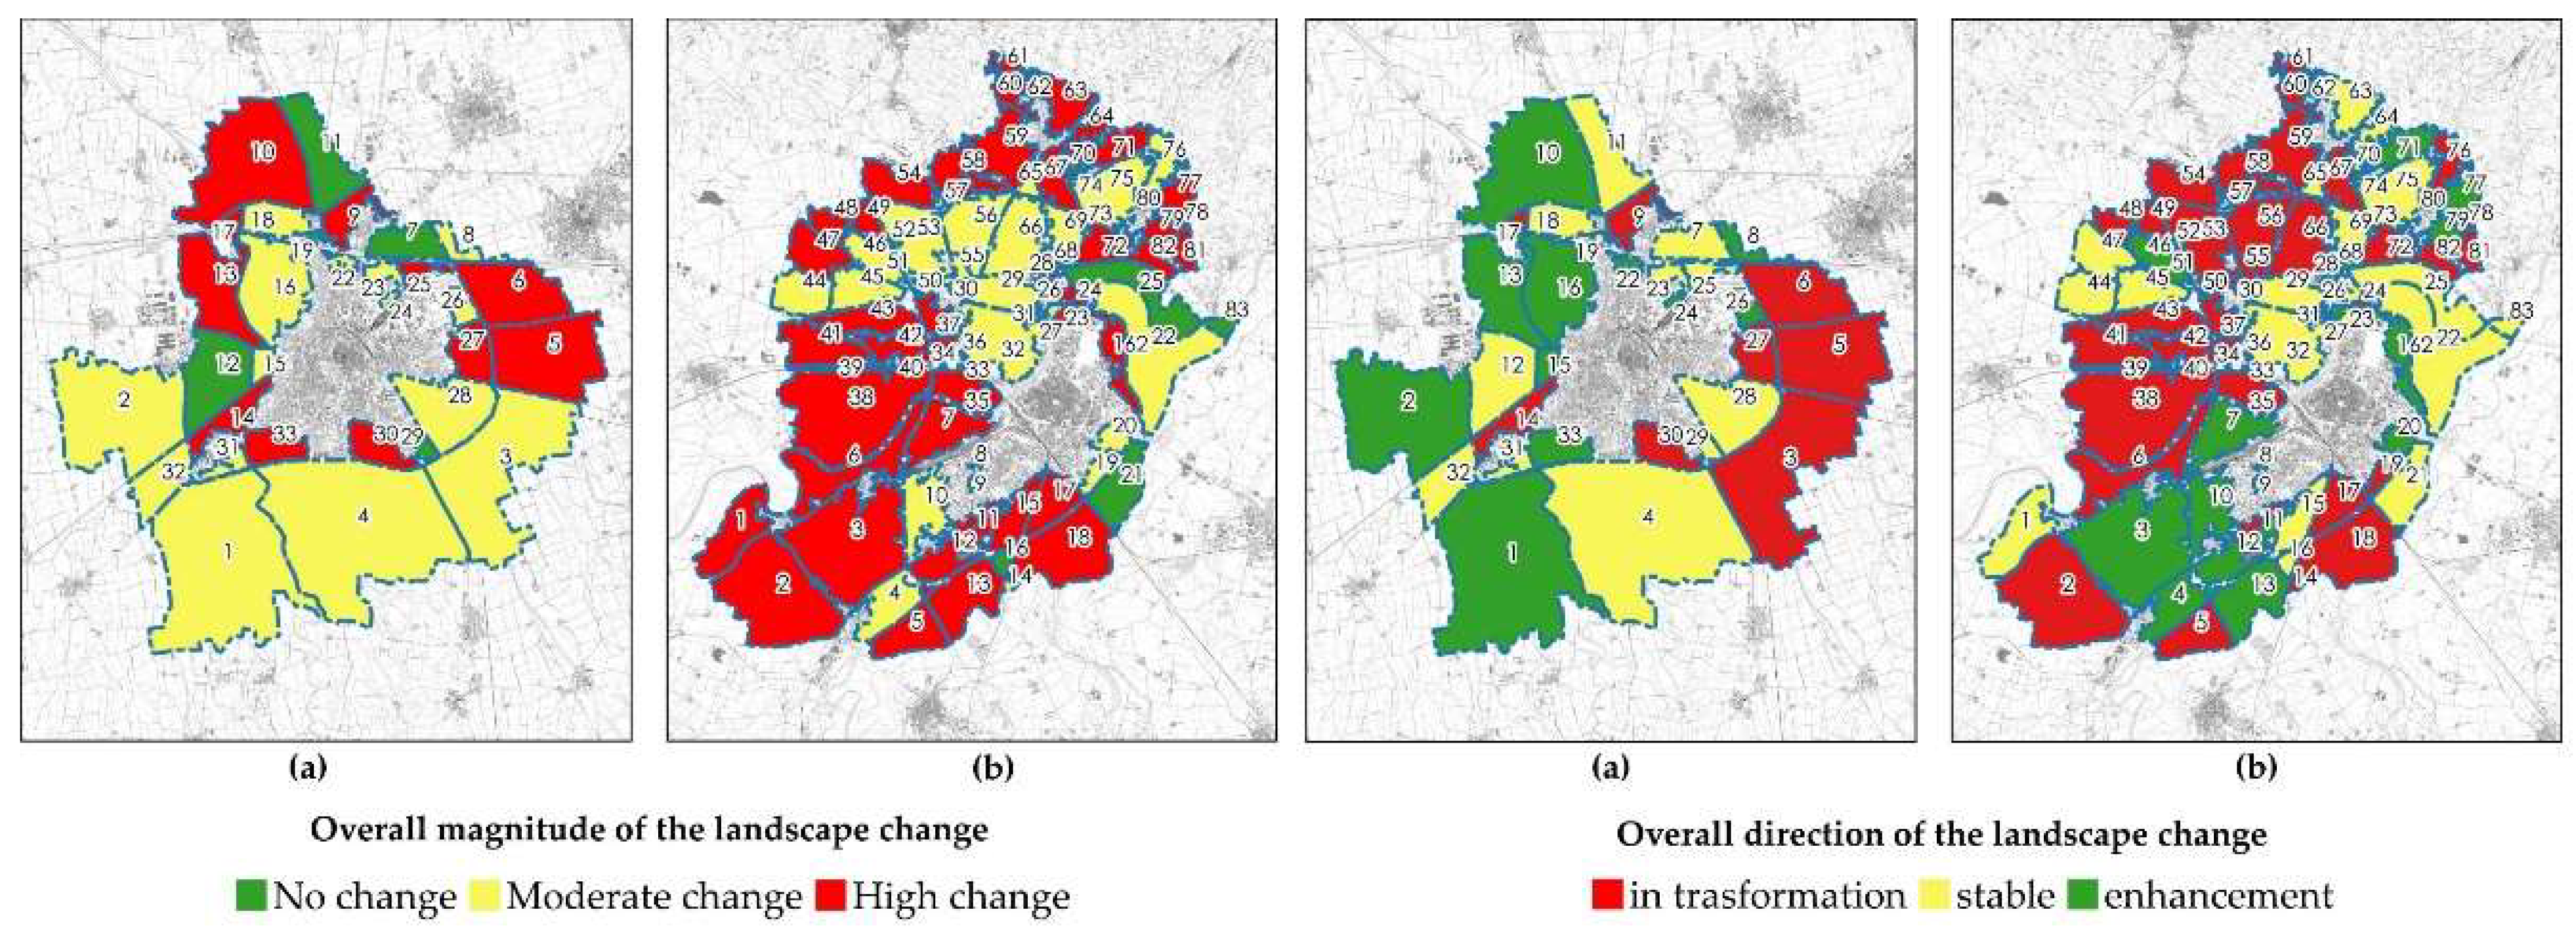
2.3. Landscape Change Analysis at Local Scale

The first step at the local scale (sub-municipal level) was to define the land use base by the photointerpretation of satellite images and the integration of different land use/cover datasets, before and after the implementation of the 2007–2013 CAP. This step was only applied to areas covered by the 2007–2013 CAP and with high 2007–2013 RDP public spending. These areas were selected from those identified in the previous phase. Subsequently, they were divided into landscape units through the morphology and the presence or absence of physical barriers, such as infrastructures, hydrographic networks and buildings [30]. Urban centers and densely built-up areas were excluded from the analysis, except large agricultural interstitial spaces. The photointerpretation allowed the analysis of the agricultural mosaic and landscape metrics, the identification and representation of the linear elements (hedges and rows) and the patches that characterized the rural landscape, as well as the observation landscape structure and pattern changes. The rural landscape metrics concern the extension of the tree and hedge network, the number of patches at the landscape unit, the mean patch size and the patch density [31,32,33,34]. In addition, the shape factor and the visual variety were calculated, using the algorithms indicated in Table 2. The change assessment was conducted according to the Landscape Character Assessment approach promoted by Natural England [29] and reworking the method developed by Haines-Young [28] within the English Countryside Quality Counts. This method considers the magnitude of the change and the direction of each element or theme that determines the character of the landscape. First of all, only the landscape units and some of the variables concerning the mosaic structure (network hedge, shape, number, average size and density of patches) were considered, excluding land cover. The second step determined the magnitude and direction of land use and land cover change at the scale of the landscape unit. Finally, the overall assessment on total area was made taking into account both factors that can determine the change, such as structure and land use. The evaluation of the magnitude is the average of the variation of each structural component and category of land use at the landscape unit. The direction of the change also includes the factors that can determine benefits and disadvantages of the variation of each component. For example, the increase in the tree and hedge network, the density and shape of patches, as well as the increase in renaturalized areas and permanent meadows are criteria that determine positive effects on the rural landscape, not only in the scenic dimension but also in the ecological and cultural spheres. The growth of factors such as the average patch size, land consumption, some permanent crops, invasive wood species and uncultivated areas are factors that produce negative effects, attributable to the intensification of agriculture and urban sprawl. The overall assessment of the change also includes criteria that can determine heterogeneity, such as the number of land use classes and visual variety.

3. Results

3.1. The Selected Areas in Piedmont (Italy)

This assessment method was developed and tested in some areas of Piedmont, a region in the north-west of Italy, between 2007 and 2013. The CAP, and in particular, the 2007–2013 RDP of Piedmont, aimed to protect the soil and the landscape (axis 2), partly through the enhancement and restoration of the agricultural landscape. As a part of the RDP evaluation activities of this region, in order to define a method to evaluate possible landscape effects in the next periods, some quite different areas of study were chosen: the areas covered and not covered by the CAP 2007–2013. The areas not covered by CAP 2007–2013 represent the areas less involved by the CAP and the RDP support. They were also the areas with an average surface covered by agri-environmental support that is almost insignificant and well below the average regional (about 20%). The other areas, in the east and south of Piedmont, are heavily involved in the support of the two pillars of the CAP or with a rate of TAA covered by agri-environmental support higher than the average value (Table 3, Figure 2). The main socio-economic indicators of the study areas (see Table 4) show nearly all areas are in a phase of demographic growth (except Casalese and Eporediese). The areas covered by the CAP are heavily populated and tend to have a younger population. Both areas have a strong agricultural vocation, although in those less involved with CAP, the UUA covers less than 50% of the total area. The number of agricultural farms decreased in both areas. The largest number of farms are located in the large production districts, such as those producing fruit (Cavourese), rice (Novarese and Vercellese), other cereals (Alessandrino), wine (Basse Langhe) and cattle breeding (Piana cuneese). The total CAP support (the public spending of first and second pillar) in 2007–2013 period exceeded EUR 25,000 per farm, except in the Eporediese, Colline del Po and Monferrato Astigiano areas.
According to the AAU regional database (2015), both study areas are mainly occupied by arable land (Figure 3 and Figure 4). Permanent crops, including orchards and vineyards, and permanent meadows are particularly large, especially in areas covered by the CAP, as well as in the Basso Canavese. On the other hand, arboriculture and permanent meadows are a small part of the agricultural surfaces of the areas not affected by the CAP, where forests are more extensive than in other areas. The forest surface, especially the forest characterized by particularly invasive species, as well as the urbanized areas, are growing rapidly and have reached significant values in recent years in both areas.
Regarding the evaluation at the local scale, two study areas were selected from those identified in the previous section, within the municipal boundary of Novara and Alessandria (Figure 5). These are two particularly representative areas of the agriculture of the region. The agricultural area exceeds 60% of the municipal area, and the contributions of the RDP, and more generally of the CAP, are among the highest in the region. In particular, Alessandria and Novara are municipalities with an incidence of RDP above the average in 2007–2013. At the same time, these are areas heavily involved in the support of the first pillar, approximately EUR 58 million (Alessandria) and EUR 25 million (Novara).

3.2. Results of the Piedmont Case Study

At the supra-local scale, the analysis of land use change (Table 5) shows that in the areas covered by the CAP support, the UAA decreases, but less than in the others. A possible interpretation of this result could be that the CAP contribution, and particularly of the RDP, is significant in terms of maintaining agricultural activity and the protection of rural areas. Interestingly, many of these are agricultural areas of regional importance in terms of production, and for this reason, they are more established and resilient than the others. In the areas covered by the CAP, the amount of urbanized land increases, which could mean that the role of the CAP is marginal in relation to the containment of urban expansion. In fact, this seems to show that the CAP is not equipped to oppose urban expansion and does not influence decision-making in land use policies and designation. However, another possible interpretation is that these are areas that include the main urban settlements of the region such as Alessandria, Novara, Cuneo and Vercelli. Proximity to urban and peri-urban areas is another driving forces to take in account when interpreting this change. In addition, the amount of arable land is decreasing, although less significantly than areas with low public support. Therefore, the economic productive weight of monoculture seems to prevail over crop diversification. This could favor the simplification and visual standardization of rural landscapes. In areas intercepted by the CAP support, permanent crops (orchards, vineyards, etc.) increase more than others. These effects could be considered mainly negative due to the phenomenon of crop intensification. On the other hand, permanent meadows are increasing compared to areas not affected by the public support of the CAP. This aspect is significant in landscape terms due to the socio-ecological and historical/cultural importance of this traditional crop. In the areas affected by the CAP payments, forests increase, although less than in the other areas. This phenomenon could be explained by better management and control of the forest, especially with regard to invasive species. In addition, the presence of numerous specialized farms and permanent crops could have contributed to the maintenance of these agricultural areas. Finally, wood arboriculture is showing a sharp decrease in the areas covered by the CAP, while it is increasing in the others. The contribution of agricultural policies seems positive considering the ecological footprint of these crops (for example water consumption). However, it is necessary to clarify that they are almost specialized agricultural areas where arboriculture is not very widespread, except in the lowlands such as the areas near Cuneo and Alessandria.
At the local scale (sub-municipal level), the analysis of the variation in land cover and use in both areas in the period 2006–2015 shows the significant growth of the invasion forest. It often corresponds to a decrease in the woods of particular ecological value and identity/cultural interest, such as the oak hornbeam (especially in Novara). There is also a substantial increase in uncultivated and abandoned crops, as well as a sharp decrease in wood arboriculture. In the landscape units of Novara, urbanized areas grow less than in Alessandria, where urban spawl and ground photovoltaic systems have taken over about 140 hectares of agricultural land. By contrast, the arable land areas are substantially stable in Novara, where they are mainly dedicated to rice cultivation, while they decrease in Alessandria (Table 6).
The identification of the landscape components through the interpretation of regional aerial imagery (Figure 6) is the starting point for the analysis of the variation of the landscape metrics (Figure 7). This analysis has highlighted a strong decrease (more than 3%) in the hedge network in both of the selected study areas, as well as a significant reduction in the number and density of the patches. This trend is particularly evident in the Alessandria area (−5% and −4% respectively), while it is less significant in the Novara area (about −2%). The reduction in the patch density is also widespread in almost all the landscape units examined, particularly in the Novara area. The form factor remains substantially unchanged in both areas, except in some units located in the north-east quadrant of Novara, and in the south-west and north-west of Alessandria. In these areas, there is a slightly more heterogeneous configuration of cultivated fields. The most significant change concerns visual variety and the number of land uses. The landscape units of Alessandria seem to benefit from a more heterogeneous landscape (Table 7).
The evaluation of the magnitude and the direction of change of landscape structure in the study areas has also highlighted different issues. The landscape structure is overall unchanged and stable in the Novara area. Conversely, in the Alessandria area, the variation is relevant, especially in the south-west quadrant. In this case, the change seems to be oriented towards transformation and intensification, while in the Novara area, elements aimed at the strengthening of the character of the rice landscape prevail. On the other hand, land use and cover have strongly changed in both areas. This phenomenon affects the entire Alessandria area and the south-east quadrant of Novara. The changes observed regard enhancement in the south-west quadrants of both areas, and strong transformation in the east of Novara and north-west of Alessandria (Figure 8).
Finally, the overall assessment (Figure 9) shows that the most relevant variations mainly concern Alessandria, especially north and south of the urbanized area where the phenomenon of agricultural intensification is more evident. The elements that enhance the landscape components are mostly located in the south of Alessandria and in the Novara area, although the change is more moderate in the latter area. In general, in both areas, the overall change is significant, even if more marked in the Alessandria area, especially in terms of land use variation. In the Alessandria area, a change prevails that has modified the character of the landscape and cancelled its traditional components in favor of a landscape aimed at maximizing production.

4. Discussion

This research is based on the hypothesis that the CAP is the main driver of landscape changes, and that the differences observed between 2006 and 2015 are due to the 2007–2013 CAP and not the consequences of different drivers or the difference between the 2000–2006 CAP and the 2014–2020 CAP. In the year 2015, it is reasonably possible to observe the previous CAP implementation, considering that the 2014–2020 CAP impacts are not yet observable. However, it is necessary to take into account not only the possible impact of public policies, but also other possible environmental and socio-economic driving forces of landscape changes: climate change, the global market and food security, technological advances, farmers’ and consumers’ behavior, the competition and conflicts between different land uses, the urbanization processes, land abandonment and the renaturalization of rural areas, as well as demographic shrinkage [35,36,37,38,39]. In general, the CAP has strengthened its environmental role and tools more than the previous periods in Piedmont, particularly through the improvement of the agro-environmental measures of the RDP and the increase in the environmental constraints of the first pillar. However, it has not been possible to determine the net effects of the CAP on the landscape, nor to isolate external factors such as the global market, farm business models and environmental conditions. In addition, sometimes it is not possible to distinguish whether the CAP is the cause or an effect. The aim of this study was not to assess the net effects of the CAP on the rural landscape, but to define criteria and the keys to interpreting the possible role of CAP in rural landscape changes.
Generally speaking, it can be argued that this method is effective in reaching the overall landscape assessment objectives. The choice to study this phenomena at different scales (meso and local level) make it possible to confirm or disconfirm the assessment direction, as well as to understand the transformation processes. In this direction, the case study has revealed some issues at the application level that include:
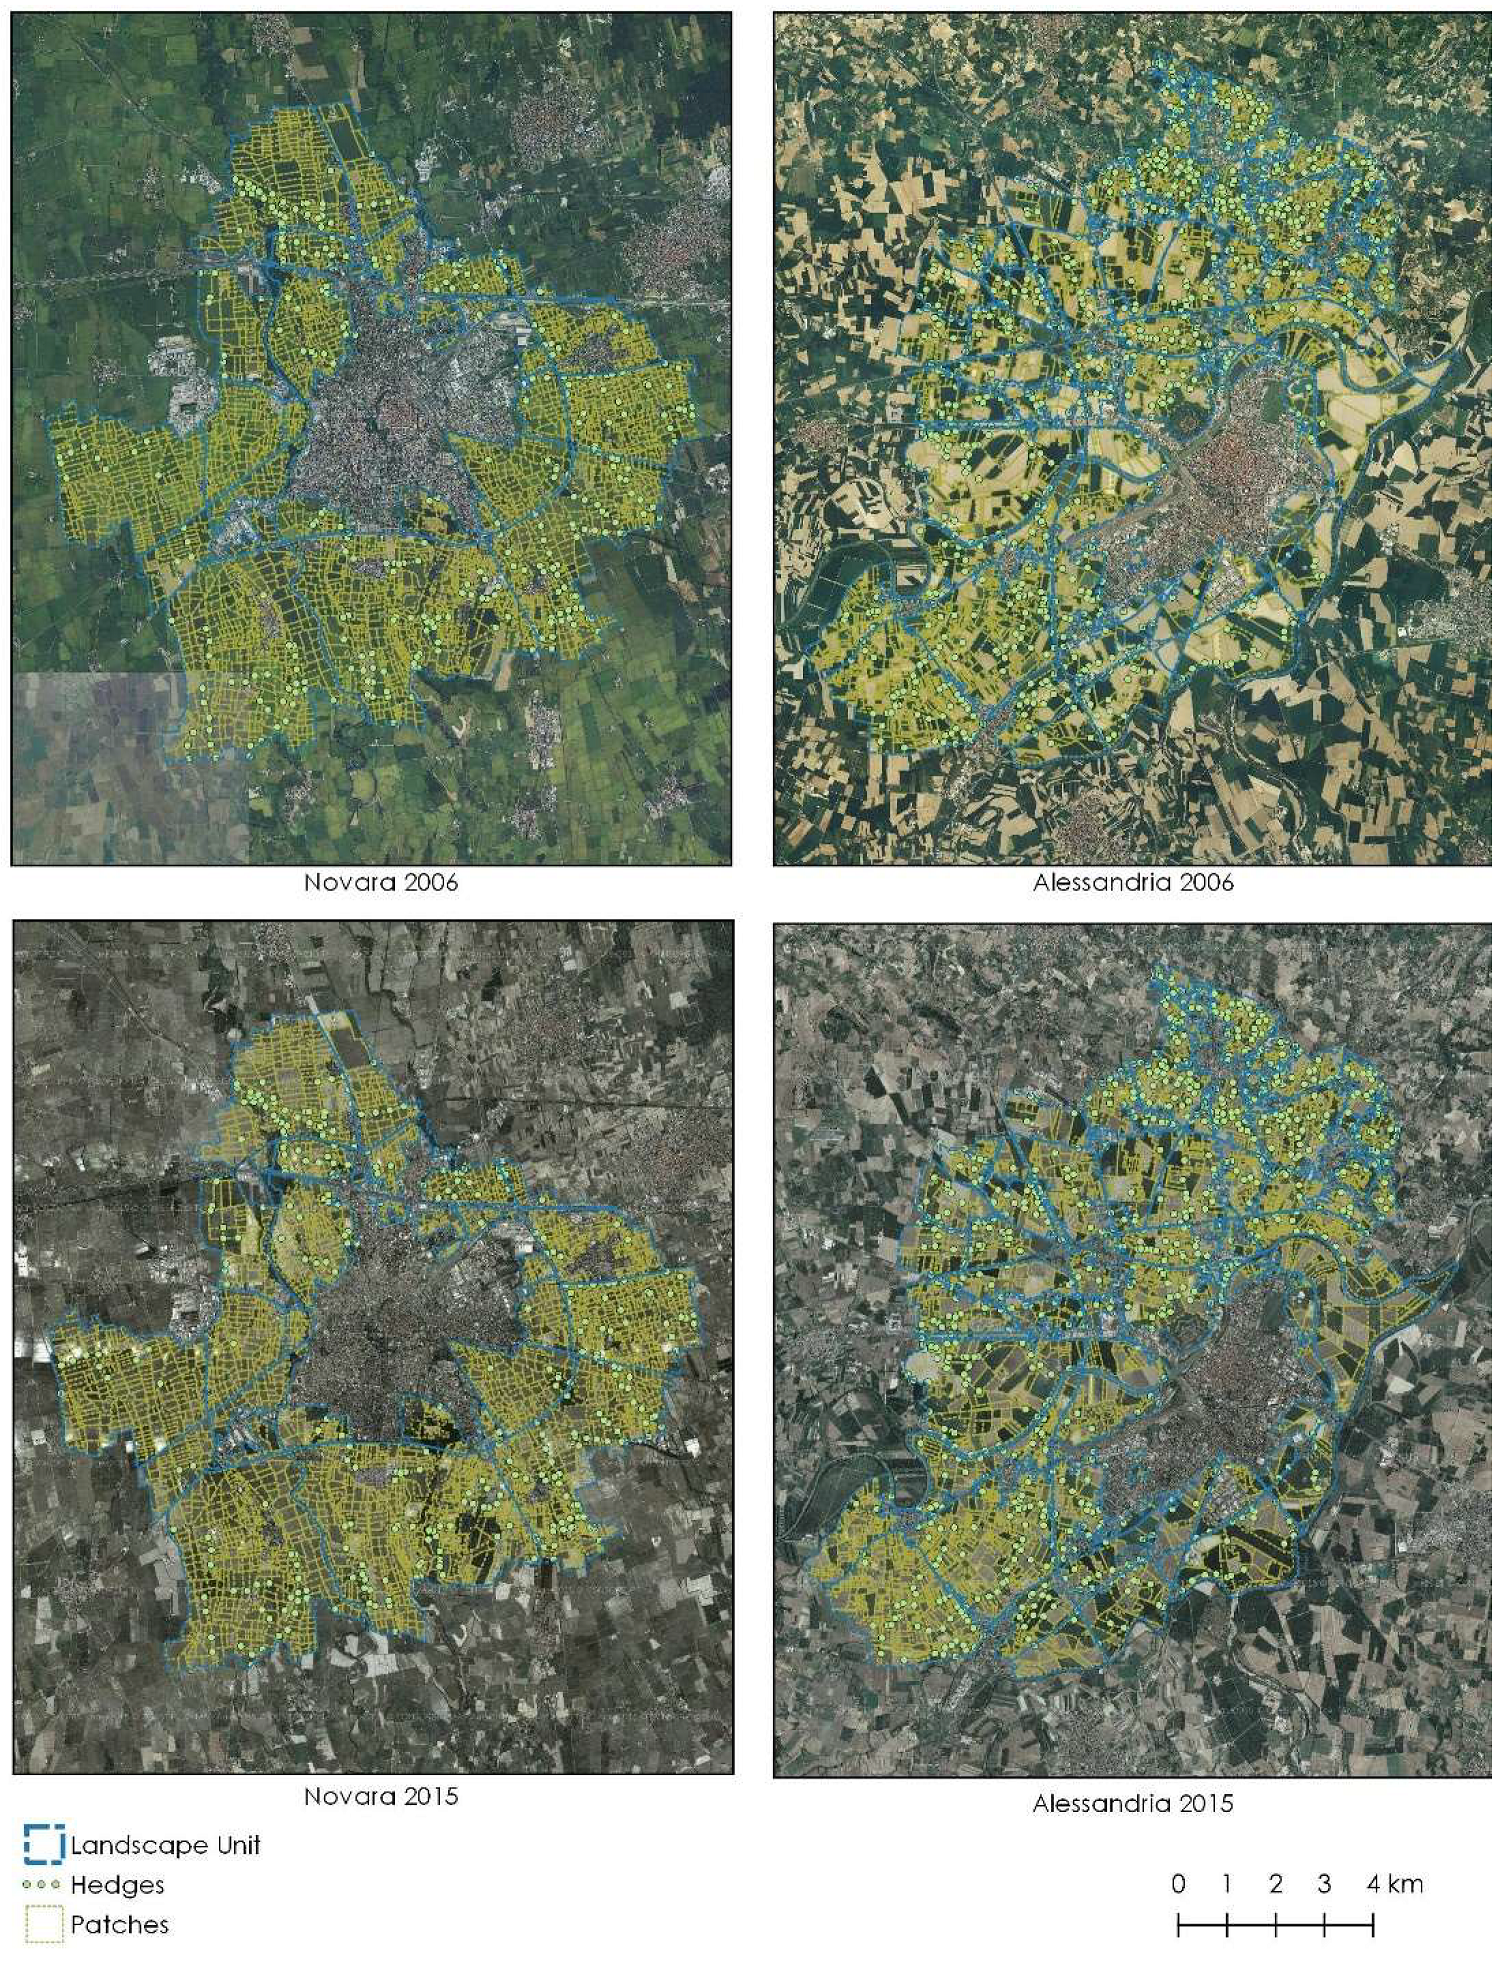
  • Possible positive effects and trade-off: according to the assessment results at the supra-local scale, the CAP has contributed positively to the maintenance of agricultural activity and the protection of rural areas, although it is not sufficiently equipped to oppose land consumption and urban sprawl. The presence of farmers also shows positive results of the management of invasive wood species. At the same time, the evaluation at the local scale shows that intensive agriculture can profoundly alter the structure of the landscape and erase the traditional landscape signs (shape, variety, number of components, etc.). The study has also highlighted that the maintenance of traditional crops and practices, such as rice crops in Novara, facilitates the conservation and enhancement of the structure of the landscape mosaic. On the one hand, the CAP seems to favor the protection of the soil. On the other hand, it strengthens some intensive forms of agriculture aimed at maximizing productivity that contribute to the reduction in components and variety of the rural landscape.
  • Strengths and weaknesses of the method: the absence of some spatial data and the lack of updating could be relevant issues for the application of this method, particularly regarding land use and cover. In addition, it is not always possible to match these data with the beginning and the end of the programming cycles in order to conduct a pre-post evaluation. Sometimes, the results are obtained on years that are before the implementation of the 2007–2013 CAP (i.e., under the 2000–2006 CAP) and after this period (under the 2014–2020 CAP), mainly due to data availability. At the same time, the identification of areas to be examined should take into account their intrinsic conditions and landscape character, as well as consider similar areas from an agronomic and environmental point of view. Among the limiting aspects, it is also necessary to consider that the proposed method requires high technical skills and significant processing times, especially at the locale scale. For these reasons, it was not possible to test the method at the local scale in other areas. However, future directions of research might apply the landscape change method and evaluate landscapes metrics on some less-CAP-covered areas in order to have a case control and verify some hypothesis as well as cause and effect relationships.
  • Application field: the method proposed was developed in order to support the CAP evaluation at regional and locale scales, in the different phases. It could be applied to the next ex-post evaluation and even to all phases of the CAP 2023–2027 evaluation. It can be used in the ex-post evaluation to answer the common evaluation questions in the RDP (Q8 and Q26) and describe how the RDP and the CAP in general have contributed to landscape protection and enhancement. In the CAP 2023–2027 evaluation, the method could be useful to assess the contribution of the CAP to “protection of biodiversity, enhance ecosystem services and preserve habitats and landscapes” (objective 6). It could be used as a proxy for the next CAP strategic plans, to set up target indicators and for the evaluation of impact and context indicators such as “Enhanced provision of ecosystem services: share of UAA covered with landscape features (I20)” [40].

5. Conclusions

The 2023–2027 CAP has strengthened the tools for the enhancement of landscape features, as well as some obligations of the system of conditionality. For example, in the first pillar of the CAP, the eco-schemes could be a new tool to support agro-ecology, to preserve connectivity and landscape diversity. However, the deterritorialized CAP approach, especially the second pillar, limits its territorial efficiency and the effectiveness of its policy tools. Understanding the CAP effects on landscape can help policy makers not only to improve its effectiveness and efficiency, but also to address new ambitious targets of the Long-Term Vision for the EU’s Rural Areas [41], the Green Deal and the Agenda 2030 for Sustainable Development. The first target aims to “enhance the share of landscape elements”. The “EU Nature Restoration Plan” has introduced some environmental commitments that should be met by 2030, such as “at least 10% of agricultural area under high-diversity landscape features”. These areas include components such as buffer strips, hedges and terrace walls. The CAP instruments and CAP Strategic Plans will meet this demand. The question is how to accommodate these requests. How should high-diversity areas be distinguished from others? On the evaluation level, how should these areas be measured, and how should they be defined at the national or regional level? How should progress towards these targets be measured? Future research directions should highlight how and with what tools to achieve these goals.

Funding

This research was funded by IRES Piemonte and Piedmont Region Authority within the context of the evaluation of the RDP 2014–2020.

Data Availability Statement

Some publicly available datasets were analyzed in this study (see Table 1). The new data were created in this study are not publicly available due to restrictions. They are available from the corresponding author with the permission of Piedmont Region Authority.

Acknowledgments

The author would like to thank Piedmont Region Authority and IRES Piemonte for the valuable support.

Conflicts of Interest

The author declares no conflict of interest. The funders had no role in the design of the study; in the collection, analyses and interpretation of data, in the writing of the manuscript or in the decision to publish the results.

References

  1. Wiggins, S.; Proctor, S. How Special Are Rural Areas? The Economic Implications of Location for Rural Development. Dev. Policy Rev. 2001, 19, 427–436. [Google Scholar] [CrossRef]
  2. Roman, M.; Roman, M.; Prus, P.; Szczepanek, M. Tourism Competitiveness of Rural Areas: Evidence from a Region in Poland. Agriculture 2020, 10, 569. [Google Scholar] [CrossRef]
  3. Simoncini, R.; Ring, I.; Sandström, C.; Albert, C.; Kasymov, U.; Arlettaz, R. Constraints and Opportunities for Mainstreaming Biodiversity and Ecosystem Services in the EU’s Common Agricultural Policy: Insights from the IPBES Assessment for Europe and Central Asia. Land Use Policy 2019, 88, 104099. [Google Scholar] [CrossRef]
  4. Alliance Environnement. Evaluation of the Impact of the CAP on Habitats, Landscapes, Biodiversity: Final Report; Publications Office of the European Union: Luxembourg, 2020. [Google Scholar]
  5. Concepción, E.D.; Díaz, M.; Baquero, R.A. Effects of Landscape Complexity on the Ecological Effectiveness of Agri-Environment Schemes. Landsc. Ecol 2008, 23, 135–148. [Google Scholar] [CrossRef]
  6. Delattre, L.; Debolini, M.; Paoli, J.C.; Napoleone, C.; Moulery, M.; Leonelli, L.; Santucci, P. Understanding the Relationships between Extensive Livestock Systems, Land-Cover Changes, and Cap Support in Less-Favored Mediterranean Areas. Land 2020, 9, 518. [Google Scholar] [CrossRef]
  7. Pardo, A.; Rolo, V.; Concepción, E.D.; Díaz, M.; Kazakova, Y.; Stefanova, V.; Marsden, K.; Brandt, K.; Jay, M.; Piskol, P.; et al. To What Extent Does the European Common Agricultural Policy Affect Key Landscape Determinants of Biodiversity? Environ. Sci. Policy 2020, 114, 595–605. [Google Scholar] [CrossRef]
  8. Penko Seidl, N.; Golobič, M. The Effects of EU Policies on Preserving Cultural Landscape in the Alps. Landsc. Res. 2018, 43, 1085–1096. [Google Scholar] [CrossRef]
  9. Hart, K.; Bas-Defossez, F. CAP 2021–27: Proposals for Increasing Its Environmental and Climate Ambition, Report for NABU by IEEP; Institute for European Environmental Policy: Brussels, Belgium, 2018. [Google Scholar]
  10. European Commission (EC). Proposal for a Regulation of the European Parliament and of the Council Establishing Rules on Support for Strategic Plans to Be Drawn Up by Member States under the Common Agricultural Policy (CAP Strategic Plans) and Financed by the European Agricultural Guarantee Fund (EAGF) and by the European Agricultural Fund for Rural Development (EAFRD) and Repealing Regulation (EU) n. 1305/2013 of the European Parliament and of the Council and Regulation (EU) n. 1307/2013 of the European Parliament and of the Council; COM/2018/392 Final—2018/0216 (COD); European Commission (EC): Brussels, Belgium, 2018; Available online: https://eur-lex.europa.eu/resource.html?uri=cellar:aa85fa9a-65a0-11e8-ab9c-01aa75ed71a1.0003.02/DOC_1&format=PDF (accessed on 21 November 2021).
  11. Tyllianakis, E.; Martin-Ortega, J. Agri-Environmental Schemes for Biodiversity and Environmental Protection: How We Are Not Yet “Hitting the Right Keys”. Land Use Policy 2021, 109, 105620. [Google Scholar] [CrossRef]
  12. Directorate-General for Agriculture and Rural Development (European Commission); ECORYS; Institute for European Environmental Policy; Wageningen University and Research. Mapping and Analysis of the Implementation of the CAP: Final Report; Publications Office of the European Union: Luxembourg, 2016. [Google Scholar]
  13. European Court of Auditors (ECA). Is Agri-Environment Support Well Designed and Managed? Special Report n. 7/2011; Publications Office of The European Union: Luxembourg, 2011. [Google Scholar]
  14. Piorr, A.; Ungaro, F.; Ciancaglini, A.; Happe, K.; Sahrbacher, A.; Sattler, C.; Uthes, S.; Zander, P. Integrated Assessment of Future CAP Policies: Land Use Changes, Spatial Patterns and Targeting. Environ. Sci. Policy 2009, 12, 1112–1136. [Google Scholar] [CrossRef]
  15. European Commission (EC); Directorate-General for Agriculture and Rural Development—Unit C.4. Guidelines: Assessing RDP Achievements and Impacts in 2019; European Commission: Brussels, Belgium, 2018. [Google Scholar]
  16. Schmidt, M.; Weißhuhn, P.; Augustin, J.; Funk, R.; Häfner, K.; König, H.; Loft, L.; Merz, C.; Meyer, C.; Piorr, A.; et al. Evaluation of the Ecosystem Ser-Vices Approach in Agricultural Literature. One Ecosyst. 2017, 2, E11613. [Google Scholar] [CrossRef] [Green Version]
  17. Swinton, S.M.; Lupi, F.; Robertson, G.P.; Hamilton, S.K. Ecosystem Services and Agriculture: Cultivating Agricultural Ecosystems for Diverse Benefits. Ecol. Econ. 2007, 64, 245–252. [Google Scholar] [CrossRef]
  18. Van Zanten, B.T.; Verburg, P.; Espinosa, M.; Gomez-Y-Paloma, S.; Galimberti, G.; Kantelhardt, J.; Kapfer, M.; Lefebvre, M.; Manrique, R.; Piorr, A.; et al. European Agricultural Landscapes, Common Agricultural Policy and Ecosystem Services: A Review. Agron. Sustain. Dev. 2014, 34, 309–325. [Google Scholar] [CrossRef] [Green Version]
  19. Ungaro, F.; Zasada, I.; Piorr, A. Mapping Landscape Services, Spatial Synergies and Trade-Offs. A Case Study Using Variogram Models and Geostatistical Simulations in an Agrarian Landscape in North-East Germany. Ecol. Indic. 2014, 46, 367–378. [Google Scholar] [CrossRef]
  20. Ungaro, F.; Häfner, K.; Zasada, I.; Piorr, A. Mapping Cultural Ecosystem Services: Connecting Visual Landscape Quality to Cost Estimations for Enhanced Services Provision. Land Use Policy 2016, 54, 399–412. [Google Scholar] [CrossRef]
  21. Medeiros, A.; Fernandes, C.; Gonçalves, J.F.; Farinha-Marques, P. Research Trends on Integrative Landscape Assessment Using Indicators—A Systematic Review. Ecol. Indic. 2021, 129, 107815. [Google Scholar] [CrossRef]
  22. Rega, C.; Short, C.; Pérez-Soba, M.; Paracchini, M.L. A Classification of European Agricultural Land Using an Energy-Based Intensity Indicator and Detailed Crop Description. Landsc. Urban Plan. 2020, 198, 103793. [Google Scholar] [CrossRef]
  23. Plaza Tabasco, J.; Martínez Sánchez-Mateos, H.S. Integration Versus Fragmentation, the Role of Minor Rural Networks in Rural Cultural Landscapes. A Study-Case in Spain. Sustainability 2021, 13, 4765. [Google Scholar] [CrossRef]
  24. Rega, C.; Bartual, A.; Bocci, G.; Sutter, L.; Albrecht, M.; Moonen, A.; Jeanneret, P.; Van Der Werf, W.; Pfister, S.C.; Holland, J.M.; et al. A Pan-European Model of Landscape Potential to Support Natural Pest Control Services. Ecol. Indic. 2018, 90, 653–664. [Google Scholar] [CrossRef]
  25. Rega, C.; Helming, J.; Paracchini, M.L. Environmentalism and Localism in Agricultural and Land-Use Policies Can Maintain Food Production While Supporting Biodiversity. Findings from Simulations of Contrasting Scenarios in the EU. Land Use Policy 2019, 87, 103986. [Google Scholar] [CrossRef]
  26. Kay, S.; Rega, C.; Moreno, G.; Herder, M.; Palma, J.H.N.; Borek, R.; Crous-Duran, J.; Freese, D.; Giannitsopoulos, N.; Graves, A.; et al. Agroforestry Creates Carbon Sinks Whilst Enhancing the Environment in Agricultural Landscapes in Europe. Land Use Policy 2019, 83, 581–593. [Google Scholar] [CrossRef]
  27. Mouchet, M.A.; Rega, C.; Lasseur, R.; Georges, D.; Paracchini, M.L.; Renaud, J.; Stürck, J.; Schulp, C.J.E.; Verburg, P.H.; Verkerk, P.J.; et al. Ecosystem Service Supply by European Landscapes under Alternative Land-Use and Environmental Policies. Int. J. Biodivers. Sci. Ecosyst. Serv. Manag. 2017, 13, 342–354. [Google Scholar] [CrossRef]
  28. Haines-Young, R.H. Tracking Change in the Character of English Landscape, 1999–2003; Catalogue Number NE42; Natural England: York, UK, 2007.
  29. Tudor, C. An Approach to Landscape Character Assessment; Natural England: York, UK, 2014.
  30. Cassatella, C. L’interpretazione Strutturale Del Paesaggio E Il Piano Come Risorsa Conoscitiva [The Interpretation of Landscape Structure And The Plan as a Knowledge Resource]. Atti E Rass. Tec. Della Soc. Degli Ing. E Degli Archit. Torino 2018, 3, 63–67. [Google Scholar]
  31. Van Eetvelde, V.; Antrop, M. Indicators for Assessing Changing Landscape Character of Cultural Landscapes in Flanders (Belgium). Land Use Policy 2009, 26, 901–910. [Google Scholar] [CrossRef]
  32. Gottero, E.; Cassatella, C. Landscape Indicators for Rural Development Policies. Application of a Core Set in the Case Study of Piedmont Region. Environ. Impact Assess. Rev. 2017, 65, 75–85. [Google Scholar] [CrossRef]
  33. Uuemaa, E.; Antrop, M.; Roosaare, J.; Marja, R.; Mander, Ü. Landscape Metrics and Indices: An Overview of Their Use in Landscape Research. Living Rev. Landsc. Res. 2009, 3, 1–28. [Google Scholar] [CrossRef]
  34. Cassatella, C.; Peano, A. Landscape Indicators: Assessing and Monitoring Landscape Quality; Springer: Berlin/Heidelberg, Germany, 2011. [Google Scholar]
  35. Plieninger, T.; Draux, H.; Fagerholm, N.; Bieling, C.; Bürgi, M.; Kizos, T.; Kuemmerle, T.; Primdahl, J.; Verburg, P.H. The Driving Forces of Landscape Change in Europe: A Systematic Review of the Evidence. Land Use Policy 2016, 57, 204–214. [Google Scholar] [CrossRef] [Green Version]
  36. Copus, A. Shrinking Rural Areas: A Fresh Look at an Old Problem. Territ. ESPON Mag. 2020, 1, 42–43. [Google Scholar]
  37. ESPON. Shrinking Rural Regions in Europe: Towards Smart and Innovative Approaches to Regional Development Challenges in Depopulating Rural Regions; Policy Brief; ESPON: Luxembourg, 2017. [Google Scholar]
  38. Estel, S.; Kuemmerle, T.; Alcántara, C.; Levers, C.; Prishchepov, A.V.; Hostert, P. Mapping Farmland Abandonment and Recultivation Across Europe Using MODIS NDVI Time Series. Remote Sens. Environ. 2015, 163, 312–325. [Google Scholar] [CrossRef]
  39. Primdahl, J.; Swaffield, S. (Eds.) Globalisation and Agricultural Landscapes: Change Patterns and Policy Trends in Developed Countries; Cambridge University Press: Cambridge, UK, 2010. [Google Scholar]
  40. European Commission (EC). Proposal for a Regulation of the European Parliament and of the Council Establishing Rules on Support for Strategic Plans to Be Drawn Up by Member States under the Common Agricultural Policy (CAP Strategic Plans) and Financed by the European Agricultural Guarantee Fund (EAGF) and by the European Agricultural Fund For Rural Development (EAFRD) and Repealing Regulation (EU) n.1305/2013 Of the European Parliament and of the Council and Regulation (EU) No 1307/2013 of the European Parliament and of the Council; COM/2018/392 Final—2018/0216 (COD)—Annex I—Impact, Result and Output Indicators Pursuant to Article 7; European Commission (EC): Brussels, Belgium, 2018; Available online: https://eur-lex.europa.eu/resource.html?uri=cellar:aa85fa9a-65a0-11e8-ab9c-01aa75ed71a1.0003.02/DOC_2&format=PDF (accessed on 21 November 2021).
  41. European Commission (EC). A Long-Term Vision for the EU’s Rural Areas—Towards Stronger, Connected, Resilient and Prosperous Rural Areas by 2040; COM(2021) 345 Final; European Commission (EC): Brussels, Belgium, 2021. [Google Scholar]
Figure 1. Flowchart.
Sustainability 13 13062 g001
Figure 2. Percentage incidence of the 2007–2013 RDP in the Piedmont Region and map of selected areas.
Sustainability 13 13062 g002
Figure 3. Current land use in the areas covered by CAP (Source: author elaboration from AAU, 2015).
Sustainability 13 13062 g003
Figure 4. Current land use in the areas not or less covered by CAP (Source: author elaboration from AAU, 2015).
Sustainability 13 13062 g004
Figure 5. The study areas selected for the evaluation at the local scale.
Sustainability 13 13062 g005
Figure 6. Hedges and patches identified through the photointerpretation in the years 2005–2007 and 2015 (author’s cartographic elaboration on AGEA orthophotos). The first has a geometric resolution of 50 cm. The 2015 AGEA orthophotos have a resolution of 50 × 50 cm2 in the alpine mountain areas and 20 × 20 cm2 in the plains and Apennine areas.
Sustainability 13 13062 g006
Figure 7. Change in the landscape structure in the study areas: (a) Novara; (b) Alessandria.
Sustainability 13 13062 g007
Figure 8. Magnitude and direction of the change in the landscape structure and land use: (a) Novara; (b) Alessandria.
Sustainability 13 13062 g008
Figure 9. Overall magnitude and direction of the change: (a) Novara; (b) Alessandria.
Sustainability 13 13062 g009
Table 1. Primary datasets.
DataProducers, Year
Land consumptionItalian Institute for Environmental Protection and Re-search (ISPRA), 2008 and 2013
Land cover and use at the supra-local scale (Corine land cover)European Environment Agency (EEA), Joint Research Centre (JRC), Copernicus Land Monitoring Service, 2006, 2012 and 2018
Forest land use, hedgesPiedmont Region Authority, IPLA, Regional Forest Plan (PFT), 2006 and 2016
Population and Oldness IndexItalian National Institute of Statistics (ISTAT), 2011 and 2016
Utilized agricultural area (UAA), total agricultural area, number of farms, organic areasISTAT, Agriculture Census, 2000 and 2010Piedmont Region Authority, Regional Farm Register (AAU), 2007 and 2015
2007–2013 RDP financial dataPiedmont Region Authority, Regional DWH for the 2007–2013 RDP
2007–2013 CAP financial data (first pillar)CSI Piemonte, 2015
Table 2. The shape factor and the visual variety indicator.
IndicatorsAlgorithms
shape factor F F n = p 2   S u p   x   π
where:
F F n = f o r m   f a c t o r   a t   t i m e   n
p k = p e r i m e t e r   o f   t h e   l a n d s c a p e   u n i t
S U P = a g r i n a t u r a l   a r e a   o f   t h e   l a n d s c a p e   u n i t
visual variety V V p a n = k = 1 s A k A t o t l o g A k A t o t l o g 1 s   1
where:
V V p a n = v i s u a l   v a r i a t y   a t   t i m e   n
A k = a g r i n a t u r a l   a r e a   o f   c l a s s   K
s = n u m b e r   o f   a g r o n a t u r a l   l a n d   u s e   c a t e g o r i e s
A t o t = a g r i n a t u r a l   a r e a   o f   t h e   l a n d s c a p e   u n i t
Author reworking starting from [31,32].
Table 3. Useful criteria for the identification and classification of study areas. The average incidence is the ratio between public expenditure at the municipal scale and total public expenditure at the regional level.
Area NumberDenominationAverage Incidence
of the CAP at Municipal Level (%)
Average Incidence
of the RDP at Municipal Level (%)
Average Value of TAA Covered by Agro-Environment Measures at Municipal Level (%)
01Alessandrino1.0200.61238.3
02Basse Langhe0.1700.46931.6
03Casalese0.0420.02933.9
04Cavourese0.2780.27313.2
05Monferrato Astigiano0.1470.41843.6
06Novarese0.4070.15420.2
07Piana cuneese0.9650.5336.4
08Vercellese0.4340.13929.4
09Alto Eporediese0.0140.0171.7
10Basso Canavese0.0460.0190.6
11Colline del Po0.0090.02214.3
Regional average value (at municipal level)0.080.0720.3
Source: Author elaboration from DWH PSR Piemonte and CSI Piemonte.
Table 4. The main socio-economic indicators of study areas (average variation at the municipal level).
AreasArea NumberDenominationAverage Variation of Population 2011–2016 (%)Average Variation of Oldness Index 2011–2016 (%)Average Variation of Farm Number 2000–2010 (%)Number of Farms at Meso Level (2010)UAA/Total Territorial Surface at Meso Level (%)Total CAP Support at Meso Level (EUR/farm)
Areas covered by CAP01Alessandrino5.31−9.19−25.9293369.1104,692.50
02Basse Langhe6.64−8.65−27.50128355.925,352.73
03Casalese−2.93−16.12−41.768363.832,130.56
04Cavourese8.7713.23−43.64185259.633,482.80
05Monferrato Astigiano0.62−5.81−39.9993656.015,003.70
06Novarese7.39−0.34−20.6423574.2331,287.43
07Piana cuneese8.7917.23−12.93264275.458,283.51
08Vercellese1.17−20.10−17.3610976.5381,621.96
Areas not or less covered by CAP09Alto Eporediese−1.1129.48−61.2415818.511,622.14
10Basso Canavese12.4722.46−34.3234343.930,055.13
11Colline del Po4.8923.23−33.863919.615,391.83
Source: Author elaboration from ISTAT (statistical data at the municipal level, farms and UUA); CSI Piemonte (CAP support).
Table 5. Land use change at the supra-local scale.
AreasArea NumberDenominationAverage UAA Variation 2007–2015 (%)Average Land Consumption 08–13 (%)Average Arable Land Variation 07–15 (%)Average Permanent Crops Variation 07–15 (%)Average Permanent Meadows Variation 07–15 (%)Average Forest Variation 06–16 (%)Average Wood Arboriculture Variation 06–16 (%)
Areas covered by CAP01Alessandrino−1.616.75−3.85−25.64105.0356.150.59
02Basse Langhe2.045.98−19.237.24−14.4811.44−41.36
03Casalese−2.263.75−7.87−25.33172.408.22−32.07
04Cavourese−4.077.31−5.55−7.39−9.205.5510.56
05Monferrato Astigiano−0.2914.10−12.243.0930.395.36−5.94
06Novarese−1.255.80−1.55734.04193.66−14.12−14.62
07Piana cuneese−1.185.53−3.46478.989.345.92−58.55
08Vercellese−1.606.03−1.580.0010.9341.4111.52
Average value−1.286.91−6.92145.6262.2614.99−16.23
Areas not or less covered by CAP09Alto Eporediese5.335.65−18.8231.1360.73−3.30324.63
10Basso Canavese−10.195.00−29.4325.1722.4143.1026.54
11Colline del Po−4.920.21−22.42−13.6636.527.550.10
Average value−3.263.62−23.5614.2239.8915.78117.09
Source: Author elaboration from AAU and CLC (UUA and land use in 2007 and 2015), ISPRA (land consumption in 2008 and 2013), PFT (forest and wood arboriculture in 2006 and 2016).
Table 6. Land use change at local level.
Land Use ClassNovaraAlessandria
20062015Var. %20062015Var. %
Urbanized areas548.7561.952.4235.5347.3247.5
Renaturalized and/or reforested areas03.24100.08.1537.22356.7
Renewable energy installations 026.9100.0
Invasive forests7.185.781108.20.4613.362804.3
Abandoned crops28.7438.4433.838.4346.9222.1
Orchards and vineyards 51.456.189.3
Arboriculture464.9302.15−35.0182.89108.91−40.5
Stable meadows117.2774.23−36.7273.17409.2749.8
Oak and hornbeam forests19.3319.01−1.7
Riparian vegetation18.860.51−97.3132.25164.6224.5
Arable land6941.826992.230.77811.27471.09−4.4
Source: Author elaboration through the photointerpretation of AGEA orthophotos in the years 2006–2015.
Table 7. Landscape metrics observed in the landscape change analysis.
Landscape MetricNovaraAlessandria
Hedges 2006 (Km)64.80133.48
Hedges 2015 (Km)62.62128.50
Change 2006–2015 (%)−3.36−3.73
Number of patches 200637504475
Number of patches 201536594216
Change 2006–2015 (%)−2.43−5.79
Mean patch size 2006 (ha)1.681.85
Mean patch size 2015 (ha)1.731.94
Change 2006–2015 (%)2.984.86
Patch density 060.450.49
Patch density 150.440.47
Change 2006–2015 (%)−2.22−4.08
Shape factor 20061.29341.4352
Shape factor 20151.29681.4371
Change 2006–2015 (%)0.260.13
Number of land use class 2006 (n.)1411
Number of land use class 2015 (n.)1213
Change 2006–2015 (%)−14.2918.18
Visual variety 20060.19430.2165
Visual variety 20150.19270.2592
Change 2006–2015 (%)−0.8219.72
Publisher’s Note: MDPI stays neutral with regard to jurisdictional claims in published maps and institutional affiliations.

